Live imaging of the co-translational recruitment of XBP1 mRNA to the ER and its processing by diffuse, non-polarized IRE1α
- Department of Gene Therapy and Regulation of Gene Expression, Center for Applied Medical Research (CIMA), University of Navarra, Spain
- Friedrich Miescher Institute for Biomedical Research, Switzerland
- University of Basel, Switzerland
Figures
Figure 1 with 2 supplements
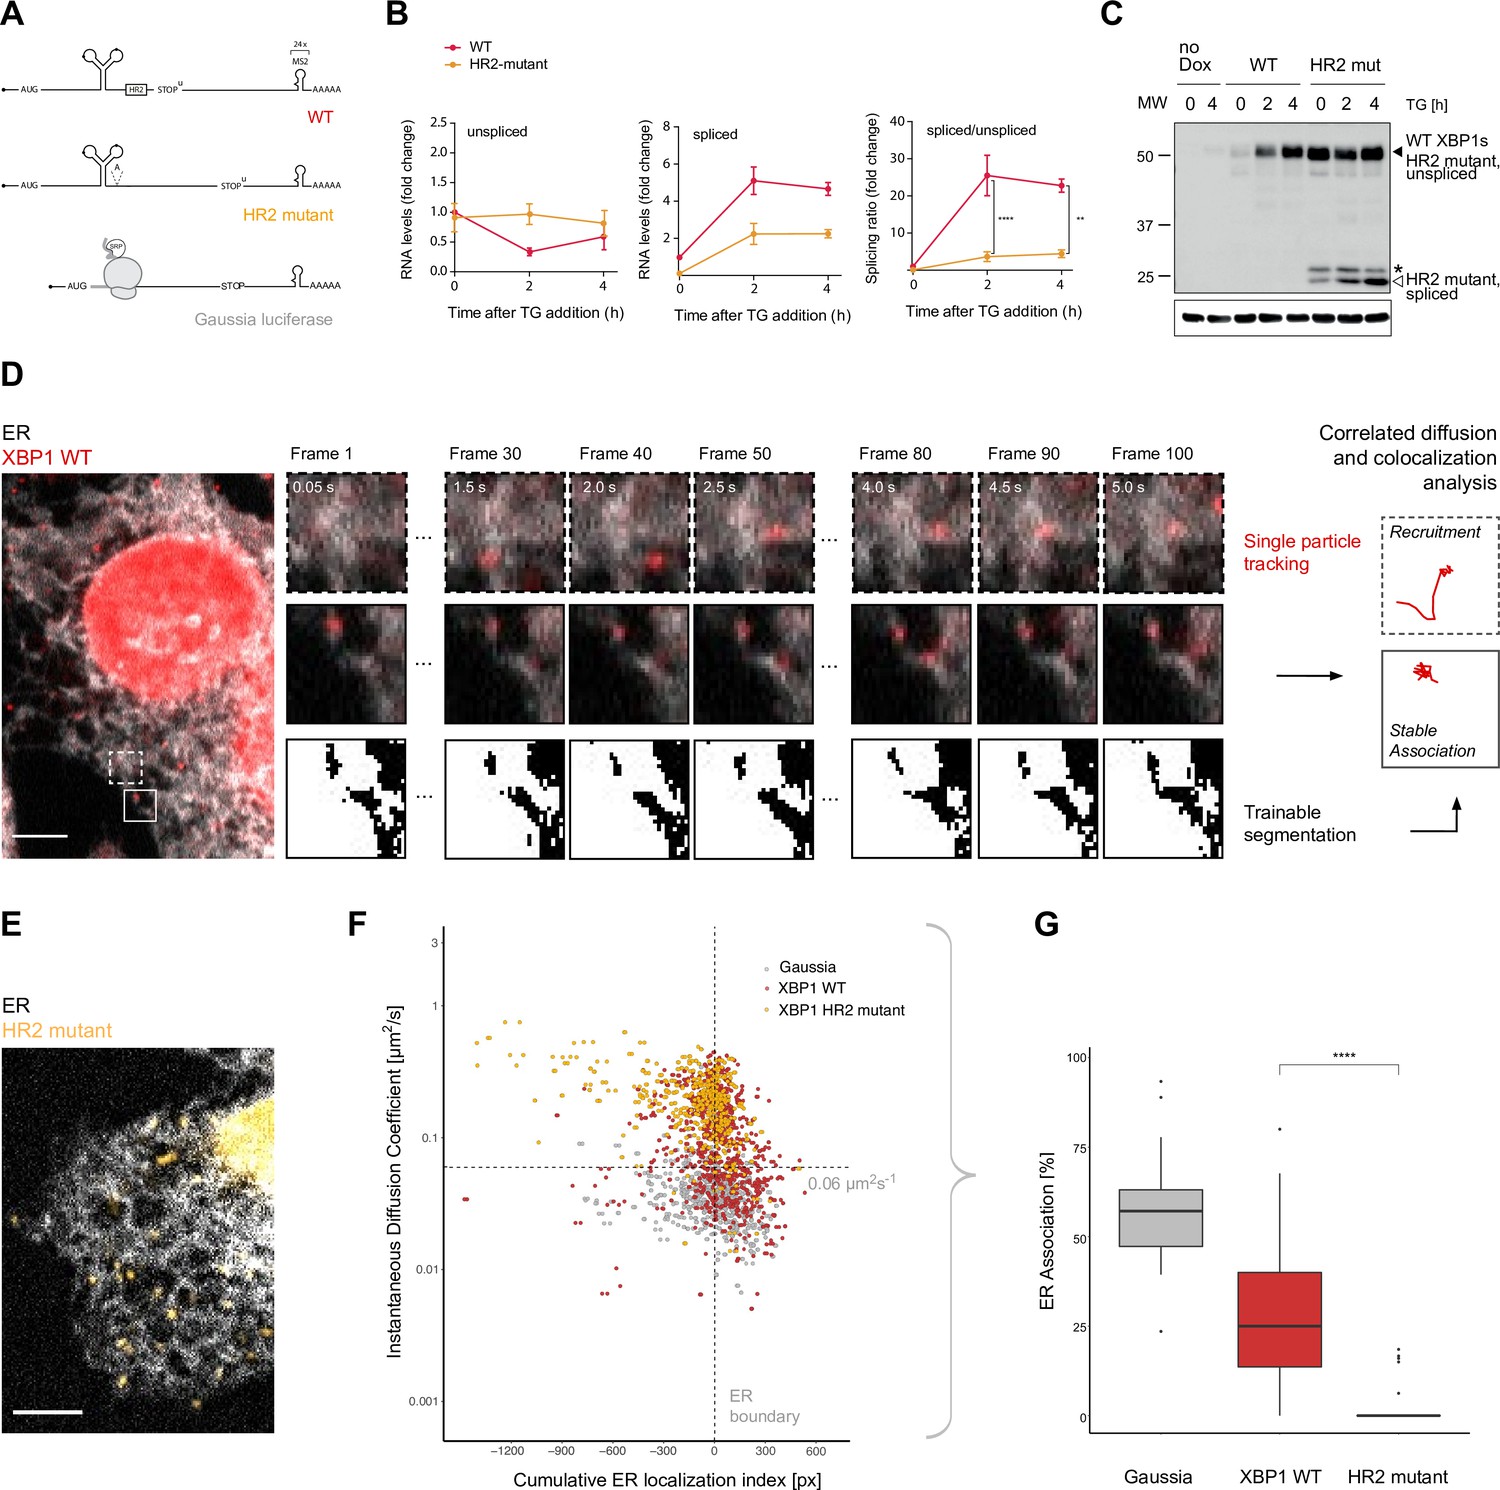
Live imaging of XBP1 mRNA recruitment to the endoplasmic reticulum (ER).
(A) Reporter construct design: XBP1 wild-type (WT; red) features the mouse XBP1 opening reading frame (ORF) and 3' untranslated region (UTR) and contains a 24 × MS2 stem loop array for mRNA detection. XBP1 HR2 mutant (yellow) is identical to the WT construct but contains a point mutation downstream of the ER intron that renders the HR2 peptide out-of-frame. The Gaussia luciferase reporter (gray) is a canonical signal-recognition particle (SRP)-recruited transcript and serves as positive control for ER association. (B) qPCR (quantitative polymerase chain reaction) assay showing splicing of MS2-labeled XBP1 reporter transcripts upon induction of ER stress with thapsigargin (TG). HeLa cells expressing WT and HR2 mutant reporters were treated with 0.2 µg/ml doxycycline (Dox) for 15 hours before addition of 100 nM TG for indicated times. Graph indicates the average ± SD (n=3). Statistical test Kruskal-Wallis and Dunn's multiple comparison test. * p<0.05, ** p<0.01, *** p<0.0001 (C) Western blot against XBP1 protein in response to unfolded protein response (UPR) activation with 100 nM TG for indicated times using an antibody that does not distinguish between XBP1u/s proteins but preferentially recognizes mouse over human XBP1 (human XBP1s background signal is detectable in samples w/o reporter expression = no Dox). Black triangle: 55 kDa band corresponding to endogenous and reporter WT XBP1s, which have the same size as unspliced HR2 mutant protein. White triangle: spliced HR2 mutant XBP1s protein. Asterisk (*): short protein product present before TG treatment. Loading control: Gapdh. (D) Representative live-cell image of the XBP1 WT reporter (red) in a HeLa cell expressing NLS-stdMCP-stdHalo and a fluorescent ER marker (gray). Illustration of the image analysis workflow: diffraction-limited spots (*) are individual mRNA transcripts. (E) Same as in (D) but expressing XBP1 HR2 mutant reporters (yellow). All scale bars = 5 µm. (F) Correlated diffusion and ER colocalization analysis of individual XBP1 WT (red), HR2 mutant (yellow), and Gaussia (gray) transcripts. Dots are single particles that were tracked for at least 30 frames. Y-axis: instantaneous diffusion coefficients. X-axis: cumulative ER localization index. Positive values indicate ER colocalization. (G) Boxplot showing ER association quantified from data shown in (F). Statistical test: unpaired t-test, p-value = 1e-8. For raw data see Figure 1—source data 1.
-
Figure 1—source data 1
Raw gel images for Figure 1.
- https://cdn.elifesciences.org/articles/75580/elife-75580-fig1-data1-v1.zip
Figure 1—figure supplement 1
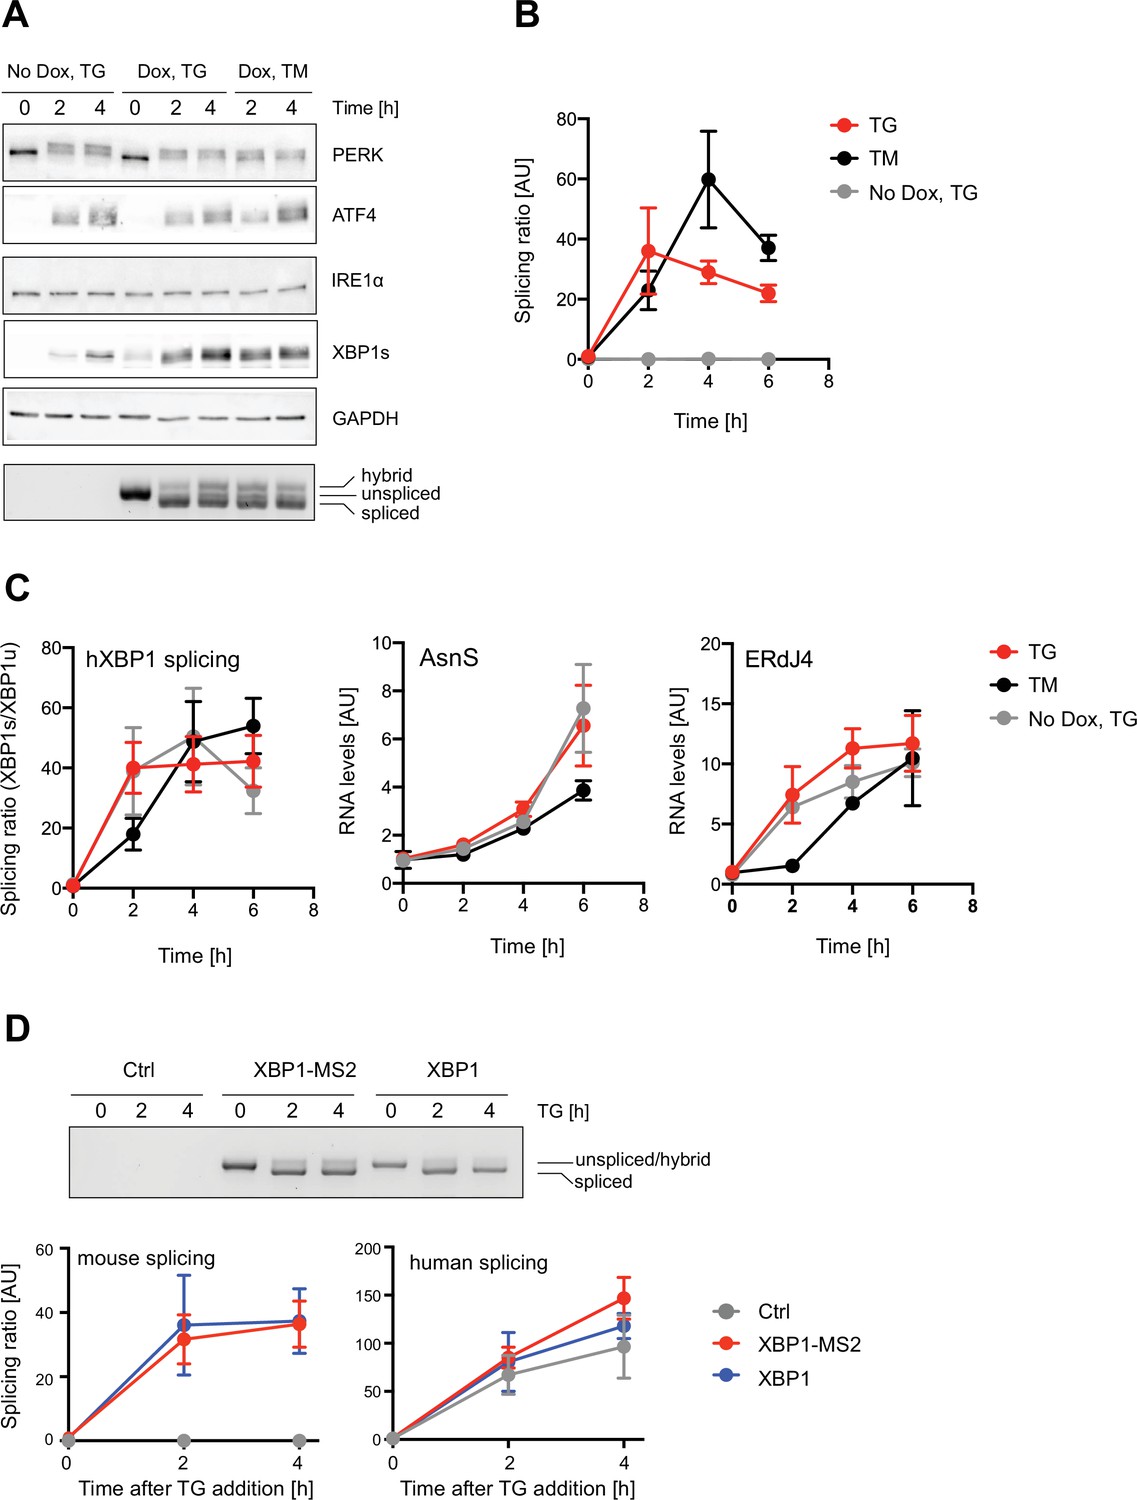
Characterization of XBP1 splicing and unfolded protein response (UPR) activation in XBP1 wild-type (WT) reporter expressing cells.
HeLa cells stably expressing XBP1-MS2 wild-type (WT) reporters were treated with 0.2 ug/ml doxycycline (Dox) for 15 hours before addition of 100 nM thapsigargin (TG) or 5 mg/ml tunicamycin (TM) for indicated times. (A) Western blot against PERK, ATF4, inositol-requiring enzyme 1 alpha (IRE1α), XBP1s, and GAPDH (loading control). Ectopic expression of XBP1-MS2 did not affect PERK activation or ATF4 synthesis but increased XBP1s levels under endoplasmic reticulum (ER) stress. Note that tunicamycin elicits a milder UPR. Bottom image: agarose gel documenting XBP1-MS2 reporter splicing by semi-quantitative real time (RT)-PCR analysis using mouse-specific oligonucleotides flanking the XBP1 intron. Fastest migrating band = spliced mRNA; middle band = unspliced mRNA; upper band = hybrid dsDNA product, where one strand is ‘spliced’ and the other ‘unspliced’. (B) Quantitative RT-PCR analysis determining the levels of unspliced and spliced XBP1-MS2 mRNA products to calculate splicing ratios (spliced/unspliced mRNA) in response to Dox and ER stress induction. (C) Quantitative RT-PCR analysis of endogenous transcripts: expression of XBP1-MS2 did not significantly alter the splicing ratio of endogenous XBP1 mRNA (hXBP1) or the mRNA levels of the ATF4-regulated asparagine synthetase (AsnS). And the increase of XBP1s levels in XBP1-MS2 cells led to an increase in the levels of the XBP1s-regulated ERdJ4 mRNA. (D) HeLa cells expressing XBP1 WT reporters with (XBP1-MS2) and w/o (XBP1) stem loop array were incubated in the presence of TG for the indicated time points. Splicing was visualized by semi-quantitative RT-PCR (upper panel) and quantified via qPCR-derived splicing ratios (bottom panels), as described above. In parallel, we confirmed that ectopic, murine XBP1 expression did not interfere with endogenous XBP1 splicing. In B, C and D, graphs shows the average ± SD from three independent experiments. Statistical test Kruskal-Wallis and Dunn's multiple comparison test was applied, and no significant differences were observed. For raw data see Figure 1—figure supplement 1—source data 1.
-
Figure 1—figure supplement 1—source data 1
Raw gel images for Figure 1—figure supplement 1.
- https://cdn.elifesciences.org/articles/75580/elife-75580-fig1-figsupp1-data1-v1.zip
Figure 1—figure supplement 2
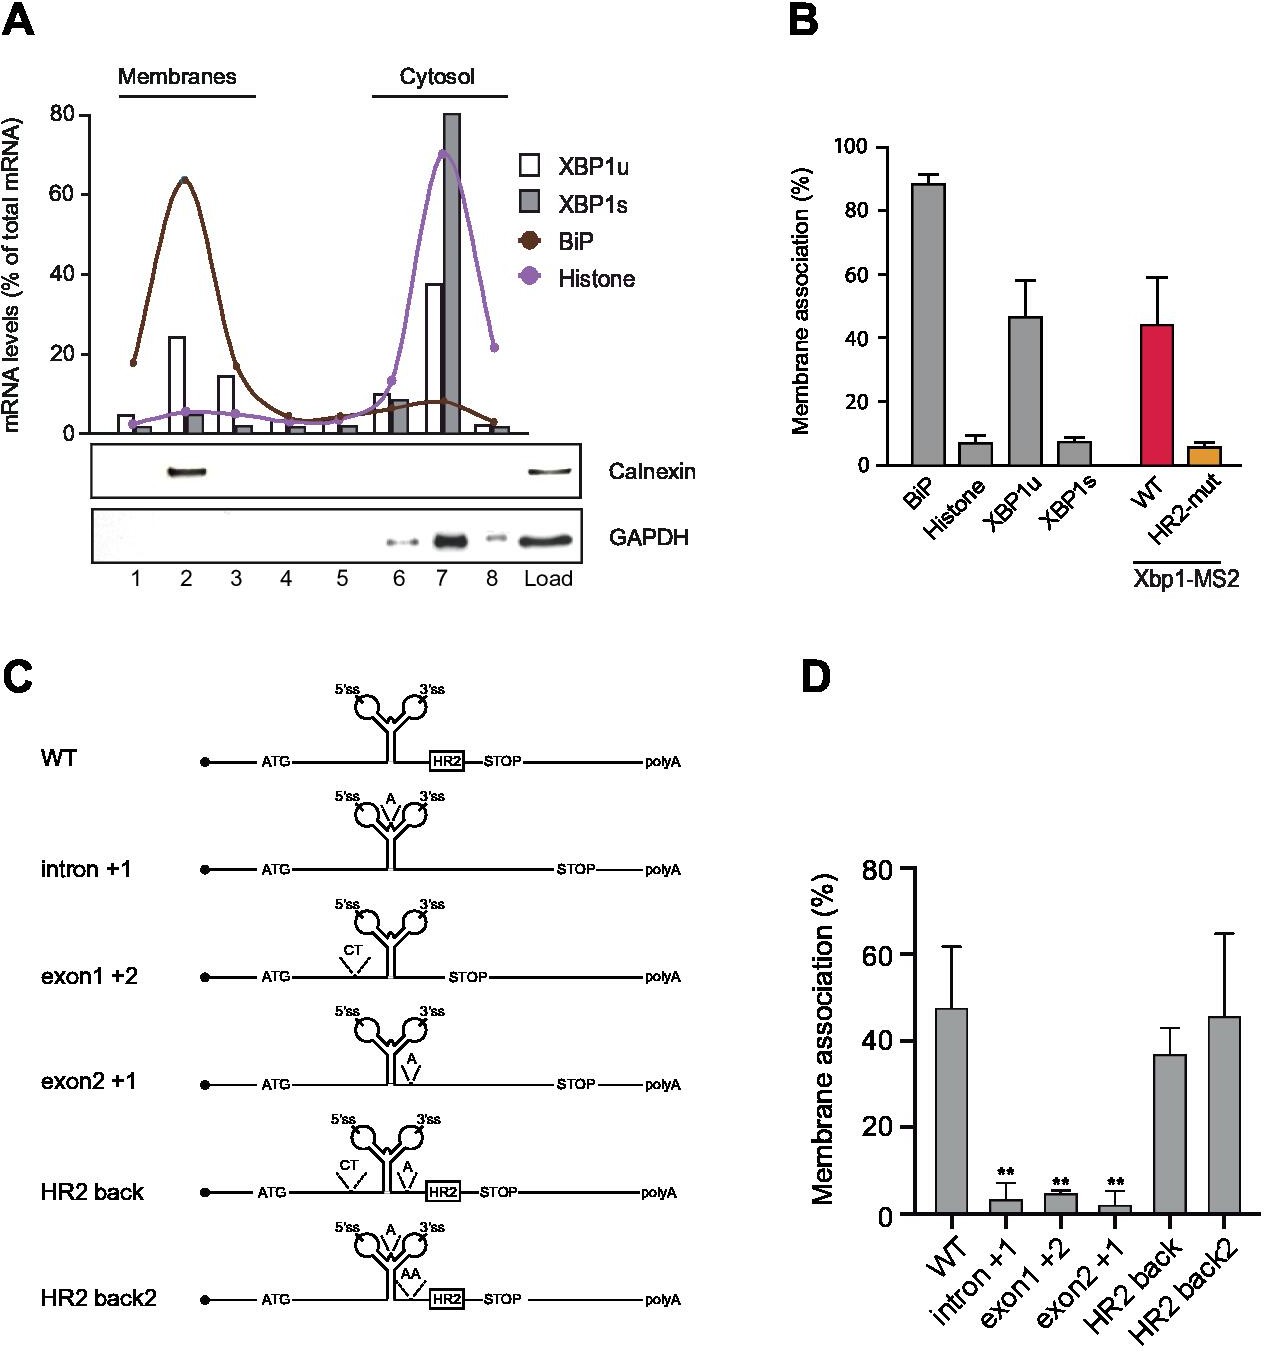
Flotation assays to investigate HR2-mediated recruitment of XBP1 reporter transcripts to endoplasmic reticulum (ER) membranes.
(A) HEK293 cells were subjected to hypotonic lysis and cytosolic extracts were subjected to flotation in discontinuous sucrose gradients. Fractions 2–3 include floating membranes (as indicated by the ER protein Calnexin), while cytosolic components concentrate in fractions 6–8 (as indicated by GAPDH). Endogenous XBP1s mRNA predominantly associates with cytosolic fractions, while a significant fraction of XBP1u mRNA is found in membrane fractions, albeit to a lesser extent than signal-recognition particle-targeted mRNAs, such as BiP (binding immunoglobulin protein). (B) Quantification of membrane association for endogenous transcripts and reporter mRNAs. The XBP1 wild-type (WT) reporter (red) behaves similar to the endogenous XBP1u transcript. The XBP1 HR2 mutant reporter (yellow) is not found in the membrane fractions and behaves like the endogenous XBP1s mRNA. Graph indicates the average ± SD (n=3). (C) Cartoon illustration of reporter transcripts used in flotation assays. Constructs ‘intron +1’, ‘exon1 +2’, and ‘exon2 +1’ all introduce frameshift mutations abolishing HR2 expression. Constructs ‘HR2 back’ and ‘HR2 back2’ restore the frameshift introduced above and thereby reconstitute membrane association. (D) Reporter constructs depicted in (C) were used to generate HEK293 Flp-In stable cell lines. Cytosolic extracts from these cultures were separated in flotation experiments and analyzed as shown in (A,B). Bar plot represents the average ± SD of at least three independent experiments. Statistical analysis scored differences between WT and each of the mutants. Unpaired Student t-test was used for statistical analysis ** p<0.01. For raw data see Figure 1—figure supplement 2—source data 1.
-
Figure 1—figure supplement 2—source data 1
Raw gel images for Figure 1—figure supplement 2.
- https://cdn.elifesciences.org/articles/75580/elife-75580-fig1-figsupp2-data1-v1.zip
Figure 2 with 2 supplements

Association of XBP1u mRNA with the endoplasmic reticulum (ER) is translation dependent.
(A) Reporter construct design and illustration of the method: XBP1u translation reporters feature a 9× GCN4 array (green) inserted into the opening reading frame downstream of the ER intron and in frame with the XBP1u protein. Upon translation of GCN4-XBP1u, emerging GCN4 peptide repeats are recognized by GFP-labeled single-chain antibodies (scAB-GFP), which allow detection of translating ribosomes together with mRNA transcripts. Upon splicing, the reading frame is changed and GCN4 expression is lost. (B) qPCR-based splicing assay to test functionality of XBP1u translation reporter (green) as compared to a non-GCN4-tagged control (gray). Shown is the splicing ratio (XBP1s/XBP1u) in response to induction of ER stress with 100 nM thapsigargin (TG). Graph represents the average ± SD (n=3). Statistical test Kruskal-Wallis and Dunn's multiple comparison test. No significant differences were observed.(C) Western blot against XBP1 proteins. Spliced XBP1 appearance is dependent on reporter expression (Dox) and induction of ER stress with 100 nM TG. Black arrows: XBP1 protein products expressed upon TG and Dox treatment. White arrows: unspecific bands present irrespective of reporter expression (Dox) in response to TG. Asterisk: unspecific bands present in all samples. (D) Representative live-cell image of XBP1u translation sites (green diffraction limited spots) in a HeLa cell expressing scAB-GFP and a fluorescent ER marker (gray). (E) Boxplot showing ER association of XBP1u translation sites (green) as compared to secreted protein encoding Gaussia mRNAs (gray) that serve as an ER-associated positive control. Statistical test: unpaired t-test, p-value = 0.49. (F) Combined single-molecule fluorescence in-situ hybridization (smFISH) and immunofluorescence (IF) analysis for colocalization of XBP1 mRNA (magenta) and translation site signal (green) in fixed HeLa cells (DAPI = blue). The majority of translation site spots disappear upon induction of ER stress with 5 µg/ml tunicamycin (TM) for 2 hours. (G) Quantification of data shown in (F). Individual dots represent per-cell averages. Black bars show mean ± SD. All scale bars = 5 µm. For raw data see Figure 2—source data 1.
-
Figure 2—source data 1
Source data containing raw gel images for Figure 2.
- https://cdn.elifesciences.org/articles/75580/elife-75580-fig2-data1-v1.zip
Figure 2—figure supplement 1
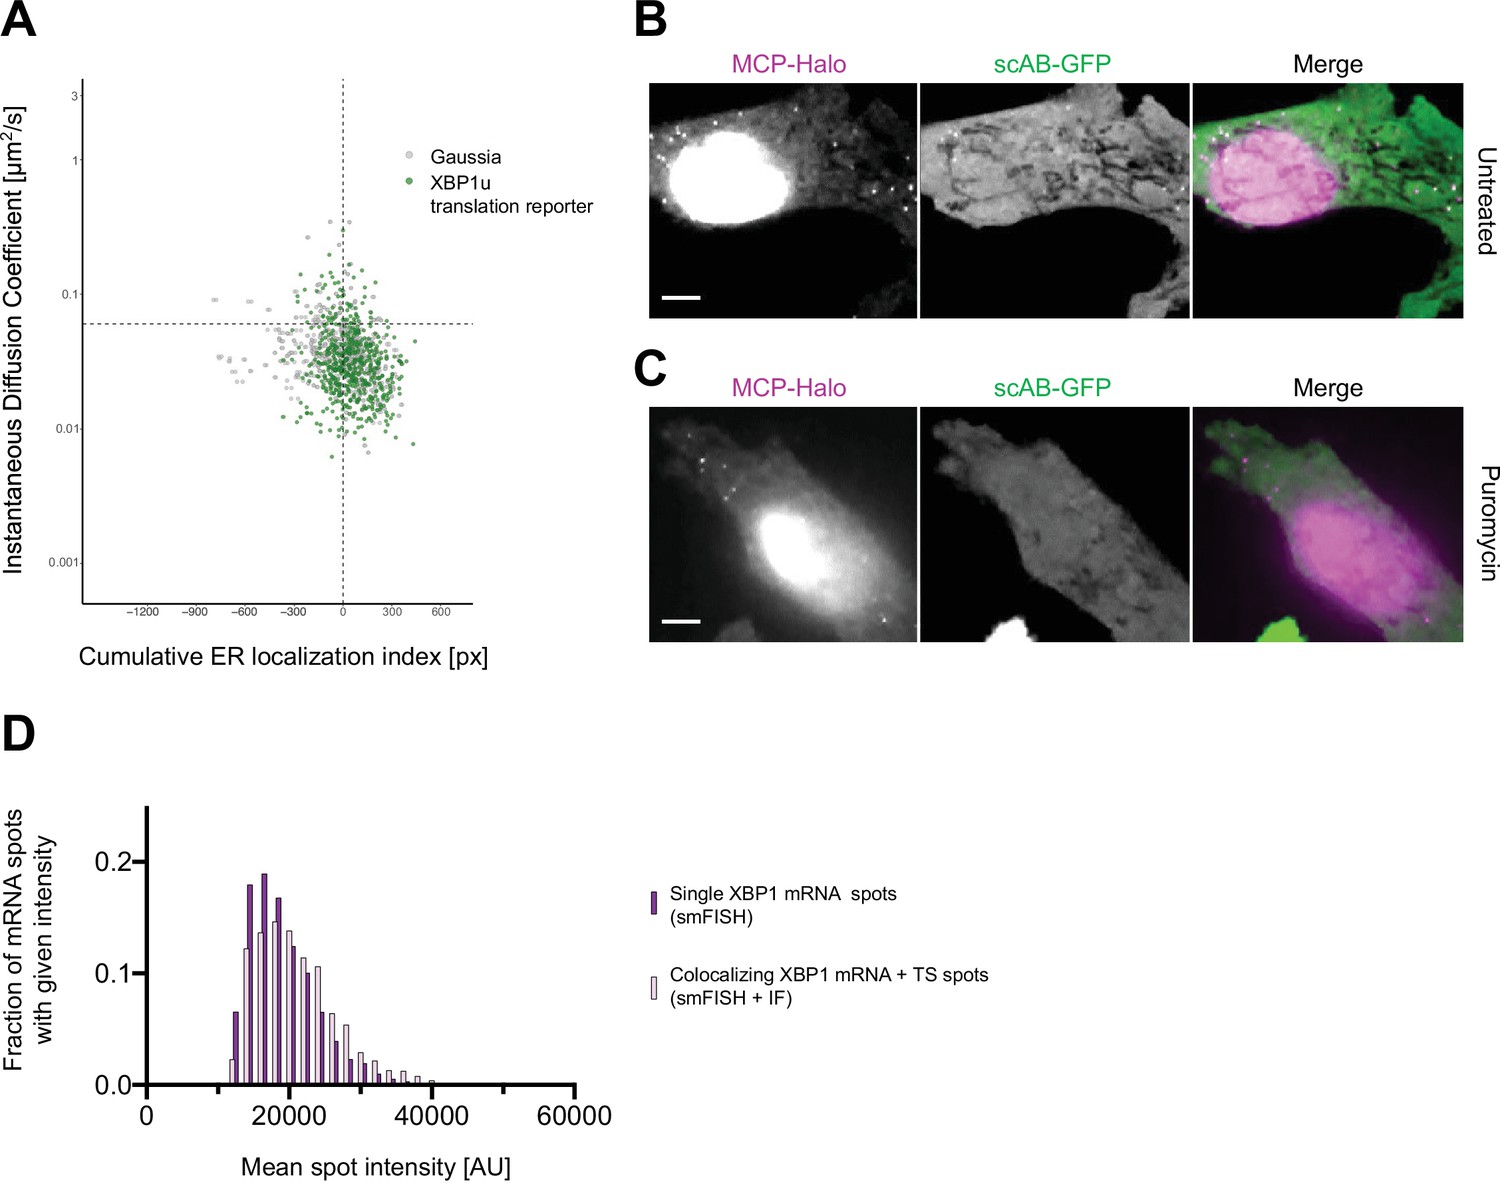
Live imaging of XBP1u translation sites.
(A) Correlated diffusion and endoplasmic reticulum (ER) colocalization analysis for individual XBP1u translation site tracks (green) and Gaussia mRNA transcripts (gray). Dots are single particles that were tracked for at least 30 frames. Y axis: instantaneous diffusion coefficients. X axis: cumulative ER localization index. Positive values indicate ER colocalization. XBP1u translation site tracks scatter similar to Gaussia mRNA tracks. (B) Representative live-cell image of XBP1u translation reporter mRNA (magenta) and translation site (green) spots in a HeLa cell stably expressing NLS-stdMCP-stdHalo and scAB-GFP. In the absence of stress, the majority of mRNA transcripts are translated. (C) Same as (B) but acquired upon addition of puromycin (PUR) (100 µg/ml). Translation site spots (green) vanish upon PUR-mediated translation inhibition. All scale bars = 5 µm. (D) Histogram plot showing distribution of mean spot intensities in exemplary fixed cell experiment (smFISH-IF, replicate 2). Intensities of mRNA spots that did not colocalize with scAB-GFP signal are shown in dark magenta, while intensities of those mRNA spots that did colocalize with scAB-GFP ( = translation sites) are depicted in light magenta.
Figure 2—figure supplement 2
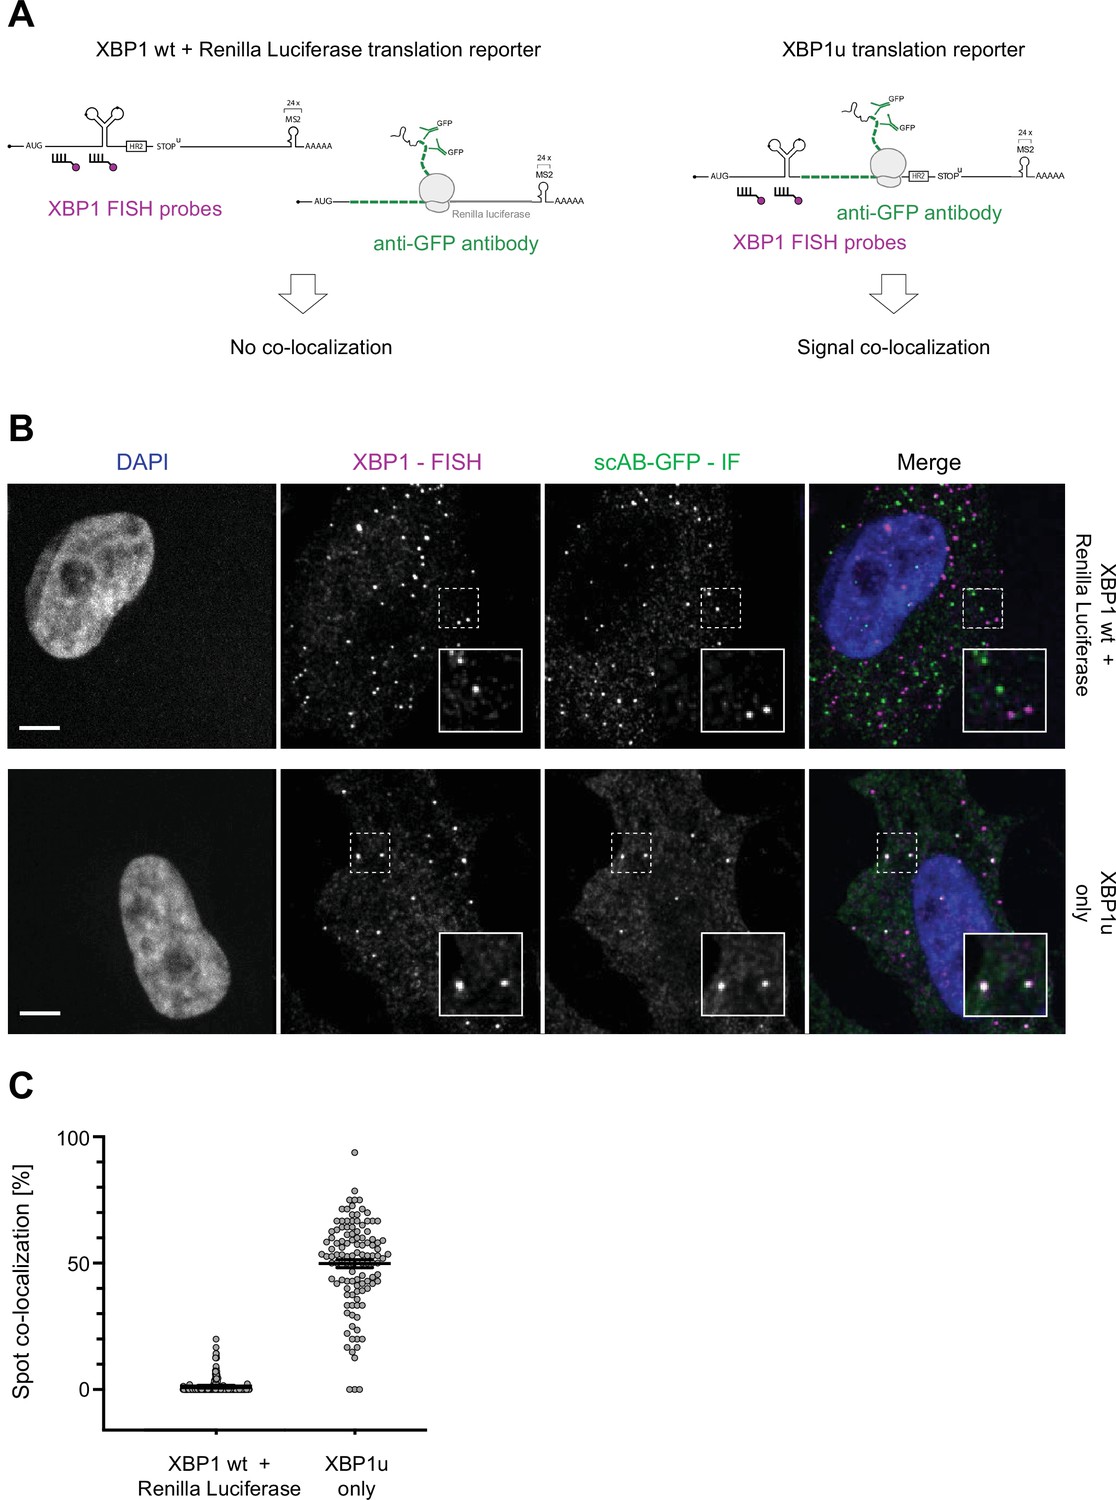
Colocalization control experiment shows no unspecific association of XBP1 mRNA and scAB-GFP spots.
(A) Schematic illustration of experimental design: GCN4-SM translation reporters either encoding Renilla luciferase (left) or XBP1u (right) were stably expressed in the HeLa imaging cell lines introduced above. To test if scAB-GFP could unspecifically associate with MCP (MS2 coat protein)-Halo or any other part of the XBP1 mRNA, a plasmid encoding the XBP1 wild-type (WT) reporter transcript was transfected into cells stably expressing the GCN4-SM-Renilla reporter (Eichenberger et al., in preparation). Expression of all reporter mRNAs was induced through addition of 0.2 ug/ml doxycycline for 1–2 hours. Cells were fixed, processed for single-molecule fluorescence in-situ hybridization (smFISH) against XBP1 mRNA and immunofluorescence (IF) against scAB-GFP, and the degree of colocalization of mRNA and scAB-GFP signal was quantified for both conditions. (B) Combined smFISH and IF experiment to assess colocalization of XBP1 mRNA (magenta) and translation site signal (green) in fixed HeLa cells (DAPI = blue). XBP1 mRNA and scAB-GFP translation site spots only colocalize if expressed from the same mRNA transcript. (C) Quantification of data shown in (B). Individual dots represent per-cell averages. Black bars show mean ± SD (XBP1u only = 0.50 ± 0.17; XBP1 wt + Renilla Luciferase = 0.01 ± 0.03). All scale bars = 5 µm.
Figure 3 with 1 supplement
Inositol-requiring enzyme 1 alpha (IRE1α)-dependent processing and endoplasmic reticulum (ER) association of XBP1u transcripts during stress.
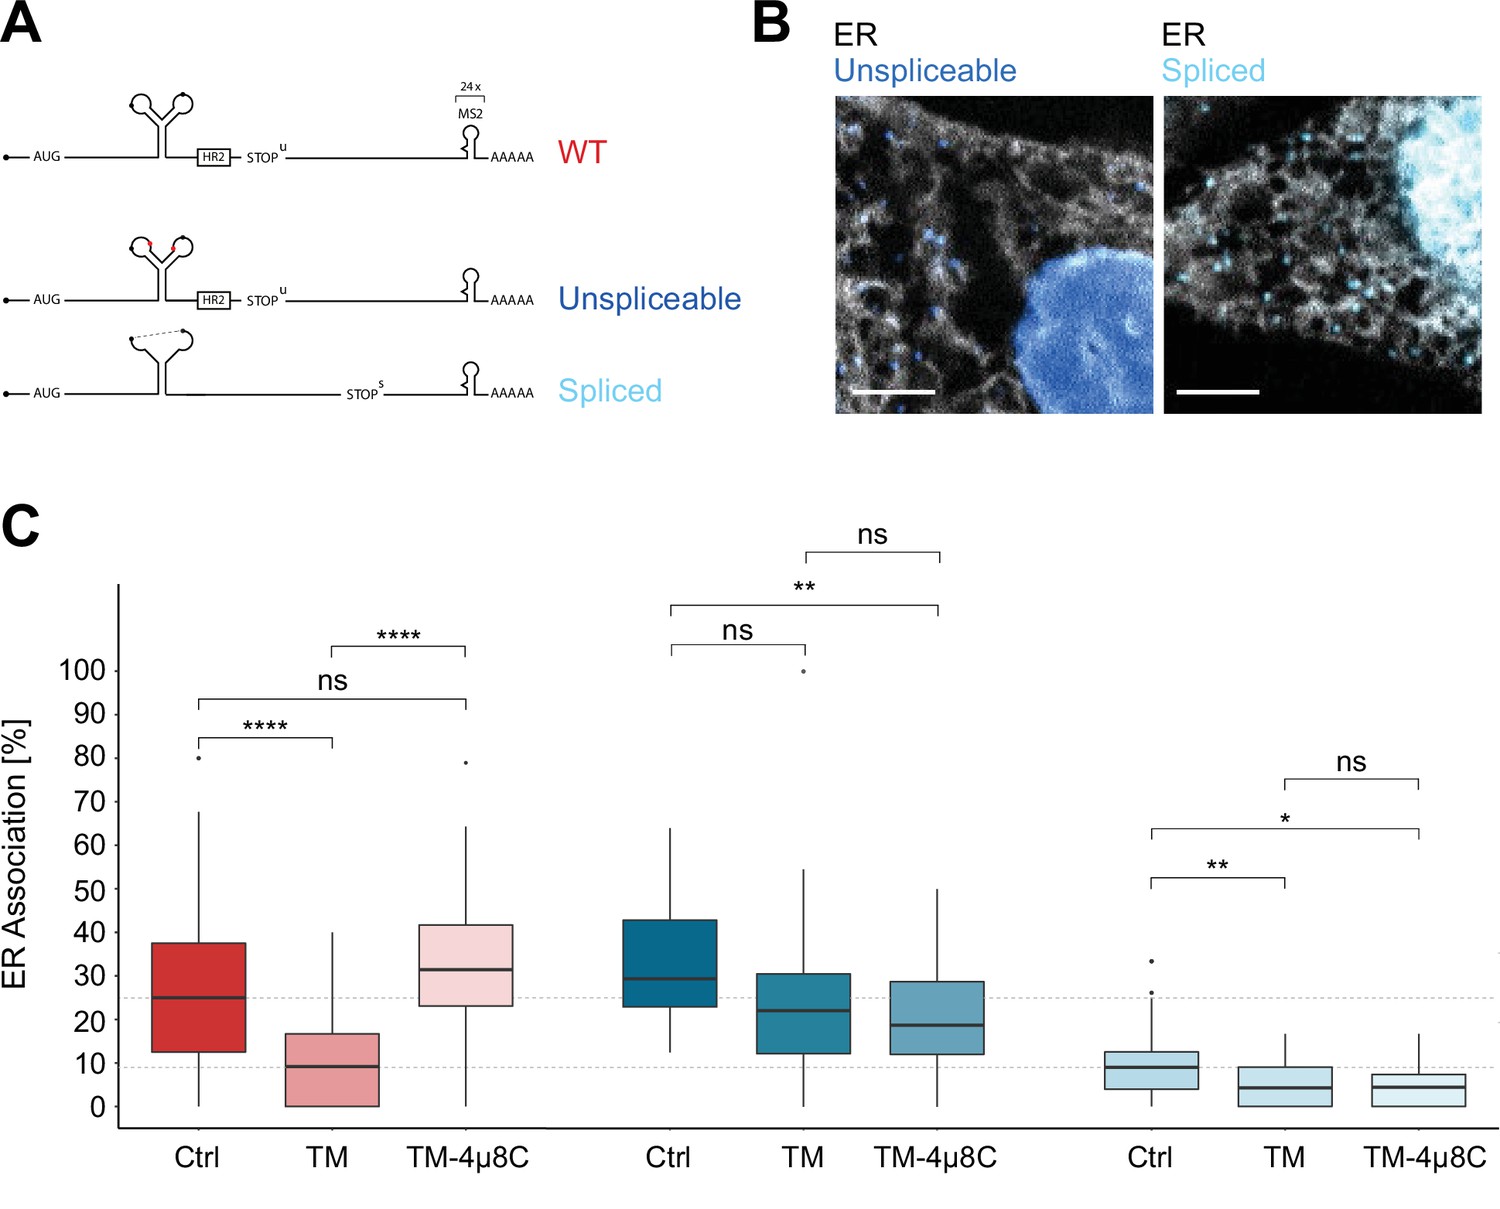
(A) Reporter construct design: Unspliceable (dark blue) and spliced (light blue) reporter transcripts are identical to XBP1 wild-type (WT; red) except for point mutations in the intron (unsplicable) or complete lack of it (spliced). (B) Representative live-cell images of XBP1 splice site mutant reporters (blue) in HeLa cells expressing NLS-stdMCP-stdHalo and Sec61b-SNAP as ER marker (gray). (C) Boxplot showing quantification of ER association from correlated diffusion and ER colocalization analysis for XBP1 WT (red), unspliceable (dark blue), and spliced (light blue) reporter transcripts. Different opacities represent experimental conditions: no treatment (Ctrl), ER stress induced with 3–4 hours of 5 µg/ml tunicamycin (TM), ER stress induced with 3–4 hours of 5 µg/ml TM under IRE1α inhibition with 4µ8C (TM + 4µ8C). Statistical test: unpaired t-test, p-values: (p≥0.05)=ns; (p<0.0001)=****. (D) Representative live-cell images of XBP1 WT reporter constructs (red) in HeLa cells expressing NLS-stdMCP-stdHalo and Sec61b-SNAP as ER marker (gray) under ER stress (5 µg/ml TM) as well as ER stress with IRE1α inhibition (5 µg/ml TM and 50 µM 4µ8C). All scale bars = 5 µm.
Figure 3—figure supplement 1
Validation of splice site mutants.
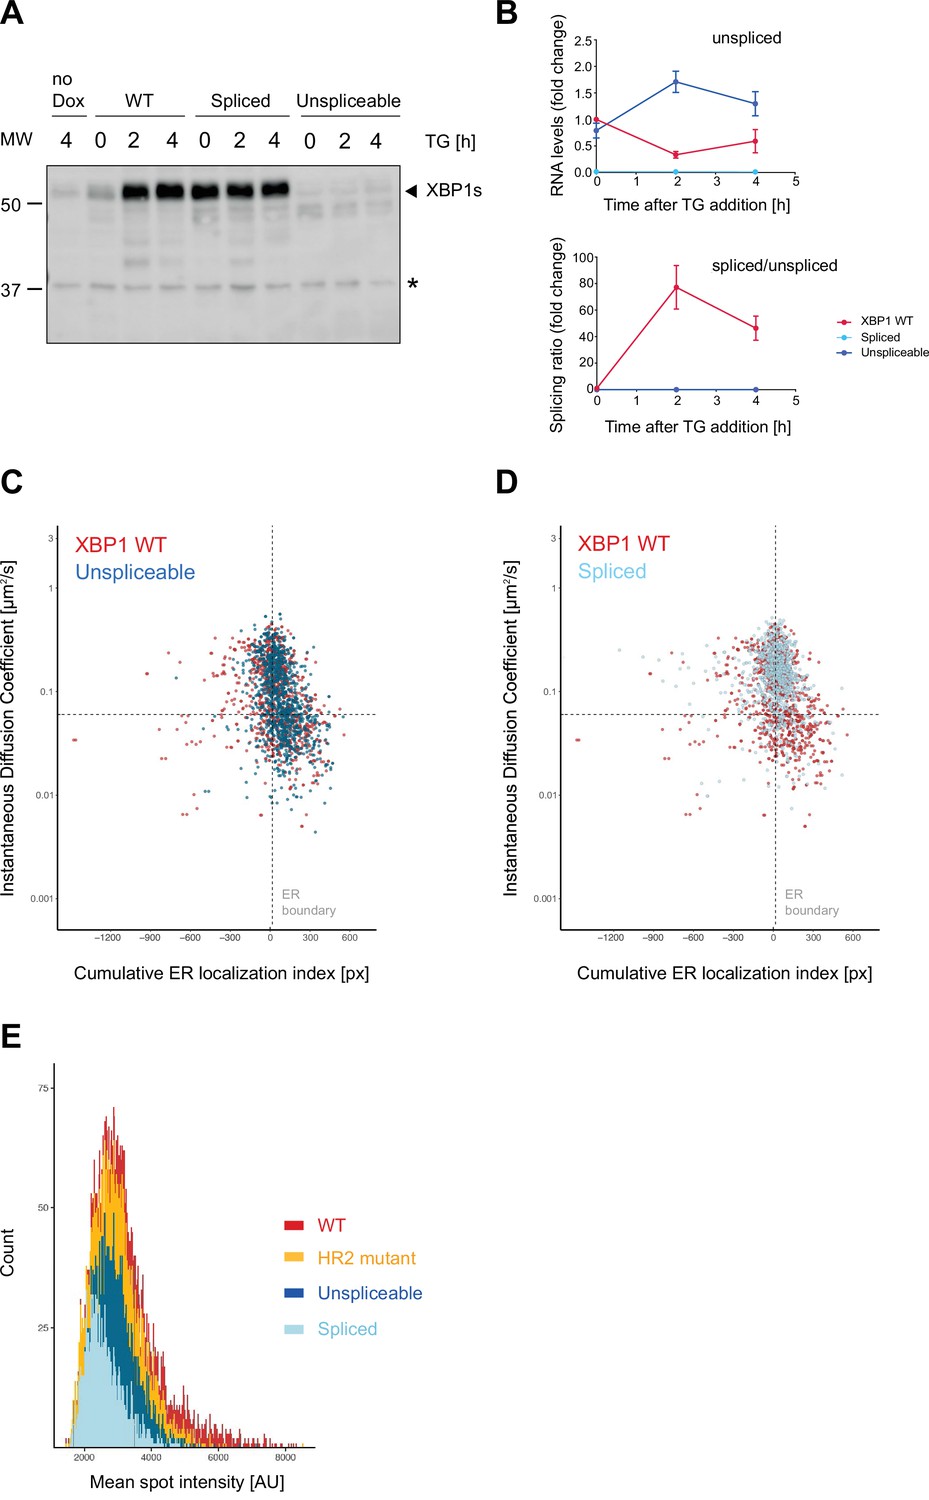
(A) Western blot analysis of production of spliced XBP1s protein in response to induction of endoplasmic reticulum (ER) stress with 100 nM thapsigargin (TG) as introduced in Figure 1. Only the wild-type (WT) reporter expressing cells, show a response in XBP1s protein production. Cells expressing the spliced mRNA reporter constitutively produce the 55 kDa XBP1s band, and cells expressing the unspliceable XBP1 reporter fail to produce XBP1s protein at all. (B) qPCR-based splicing assays showing the lack of splicing observed for mutant mRNA transcripts (blue) compared to XBP1 WT reporter mRNA (red). Graph shows the average ± SD (n=3). (C) Correlated diffusion and ER colocalization analysis for XBP1 splice site mutants. Unspliceable reporter transcript (dark blue) compared to XBP1 WT (red). Dots are single particles that were tracked for at least 30 frames. Y axis: instantaneous diffusion coefficients. X axis: cumulative ER localization index. Positive values indicate ER colocalization. (D) Same analysis as in (C) but for spliced reporter transcripts (XBP1s). (E) Histogram plot showing distribution of mean spot intensities in exemplary live cell imaging experiment (all tracks longer than three frames, bins = 20). For raw data see Figure 3—figure supplement 1—source data 1.
-
Figure 3—figure supplement 1—source data 1
Raw gel images for Figure 3—figure supplement 1.
- https://cdn.elifesciences.org/articles/75580/elife-75580-fig3-figsupp1-data1-v1.zip
Figure 4 with 1 supplement
Inositol-requiring enzyme 1 alpha (IRE1α) is able to splice XBP1u mRNA in the absence of foci formation.
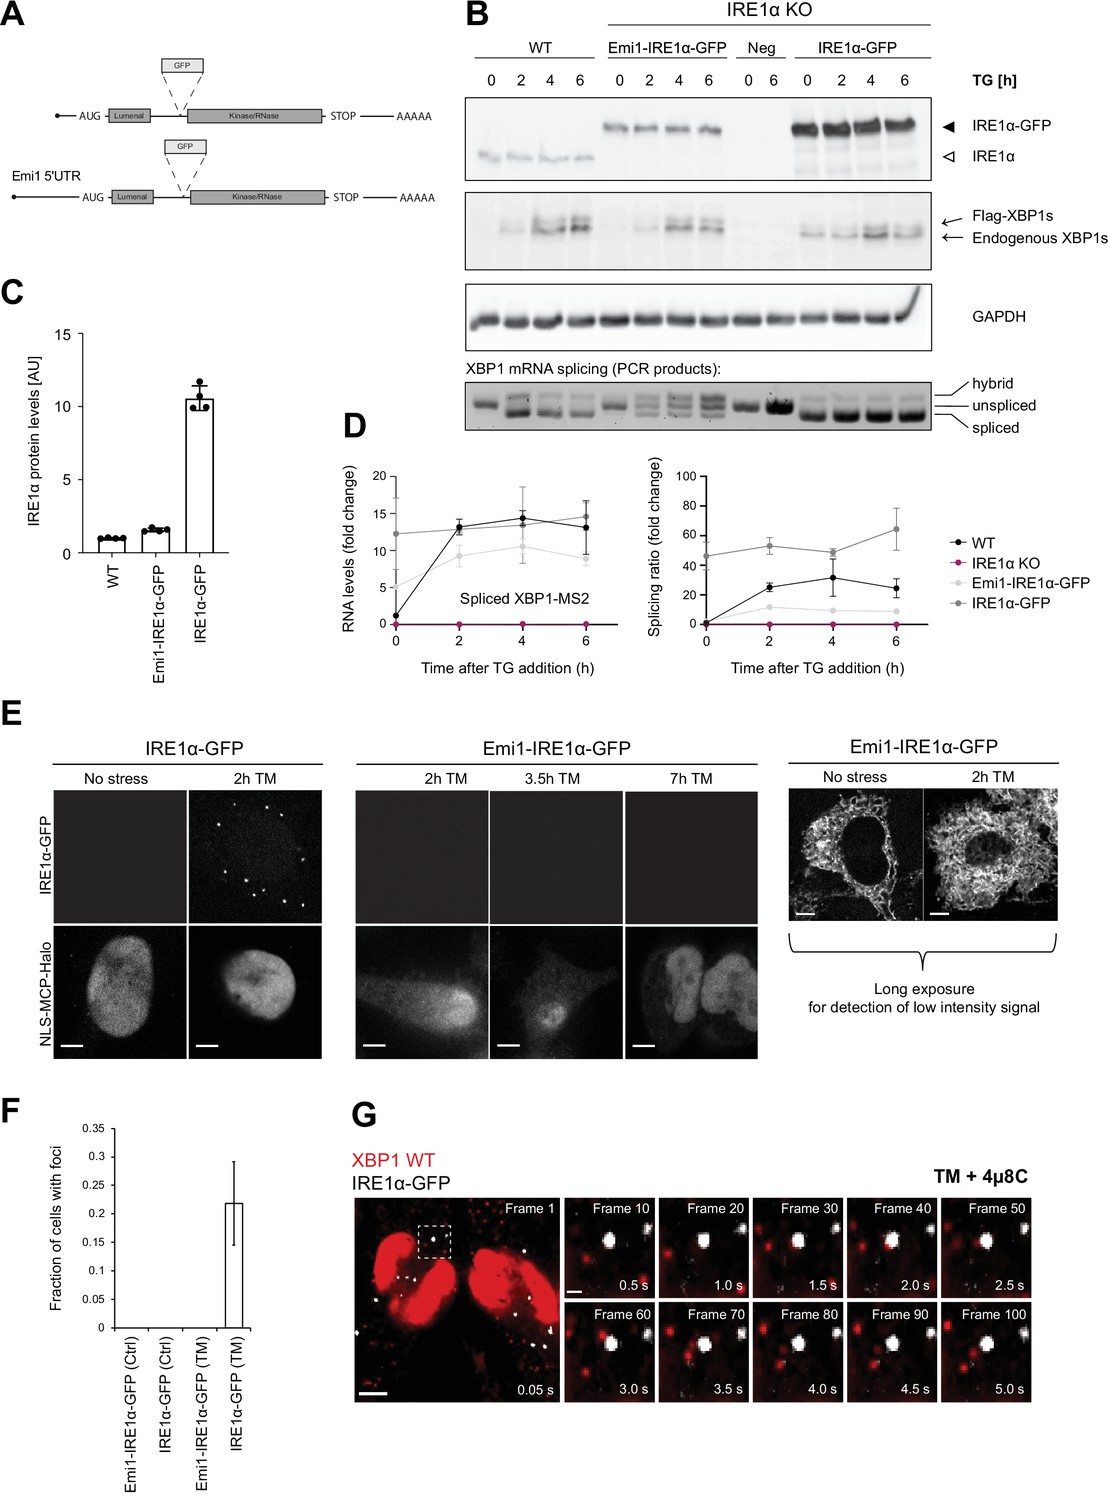
(A) Schematic representation of IRE1α-GFP construct design analogous to Belyy et al., 2020. To reduce expression of IRE1α-GFP to match endogenous levels, part of the Emi1 5’ untranslated region (UTR) was inserted upstream of the IRE1α-GFP opening reading frame. (B) HeLa cells (wild-type [WT] or IRE1α knock-out) expressing either no IRE1α (Neg) or reconstituted IRE1α-GFP at low levels (Emi1-IRE1α-GFP) or at high levels (IRE1α-GFP) were kept untreated or treated with 100 nM thapsigargin (TG) for indicated time points. Upper panels: western blot analysis of IRE1α and XBP1s levels in response to TG treatment. XBP1s immunodetection identifies two bands, a lower one corresponding to endogenous XBP1s and an upper one corresponding to the murine, FLAG-tagged XBP1s reporter protein. GAPDH (run in a different gel) was used as a loading control. Bottom panel: semiquantitative analysis of splicing of WT XBP1 mRNA. Total RNA was isolated from cells that were treated with TG as described above and subjected to RT-PCR with primers flanking the XBP1 intron. Lower band = spliced XBP1, middle band = unspliced XBP1, upper band = hybrid splicing intermediate (one strand spliced, one strand unspliced). (C) Quantification of the IRE1α expression levels in cell lines described in (B) under non-stress conditions. Graph depict the average ± SD (n=3). Revert staining of western blot membranes was used as a normalization value. (D) Quantitative RT-PCR to determine the levels of XBP1s mRNA and splicing ratios for the same RNA samples as shown in (B). Graph represents the average ± SD (n=3) (E) Representative live-cell images of the HeLa cell lines introduced in (C). In cells overexpressing IRE1α-GFP, foci can already be detected at 2 hour treatment with 5 µg/ml tunicamycin (TM). But there are no detectable IRE1α-GFP foci even after prolonged exposure to 5 µg/ml TM under standard imaging conditions in cells expressing Emi1-IRE1α-GFP. Only long exposure times allow for detection of low intensity GFP signal outlining the endoplasmic reticulum (ER) in the absence and presence of 5 µg/ml TM. (F) Quantification of the fraction of cells containing IRE1α-GFP foci in imaging cell lines under control (Ctrl) and ER stress (≥2 hour of 5 µg/ml TM) conditions. Cells are counted as foci-containing if ≥1% of the total cellular GFP signal is detected in IRE1α-GFP foci, which are defined as a ≥fivefold enrichment of GFP signal over cellular background. (G) Representative live-cell images of XBP1 WT reporters (red) in HeLa cells expressing NLS-stdMCP-stdHalo and IRE1α-GFP (gray) under ER stress (5 µg/ml TM) and IRE1α inhibition (50 µM 4µ8C). Dashed box indicates magnified inset and shows individual frames of the image series in the right part of the panel. The time series illustrates how individual mRNA particles (red) come close to IRE1α-GFP foci (gray) but do not associate stably nor accumulate in foci. All scale bars = 5 µm, except in single frame magnifications = 1 µm. For raw data see Figure 1—source data 1.
-
Figure 4—source data 1
Raw gel images for Figure 4.
- https://cdn.elifesciences.org/articles/75580/elife-75580-fig4-data1-v1.zip
Figure 4—figure supplement 1
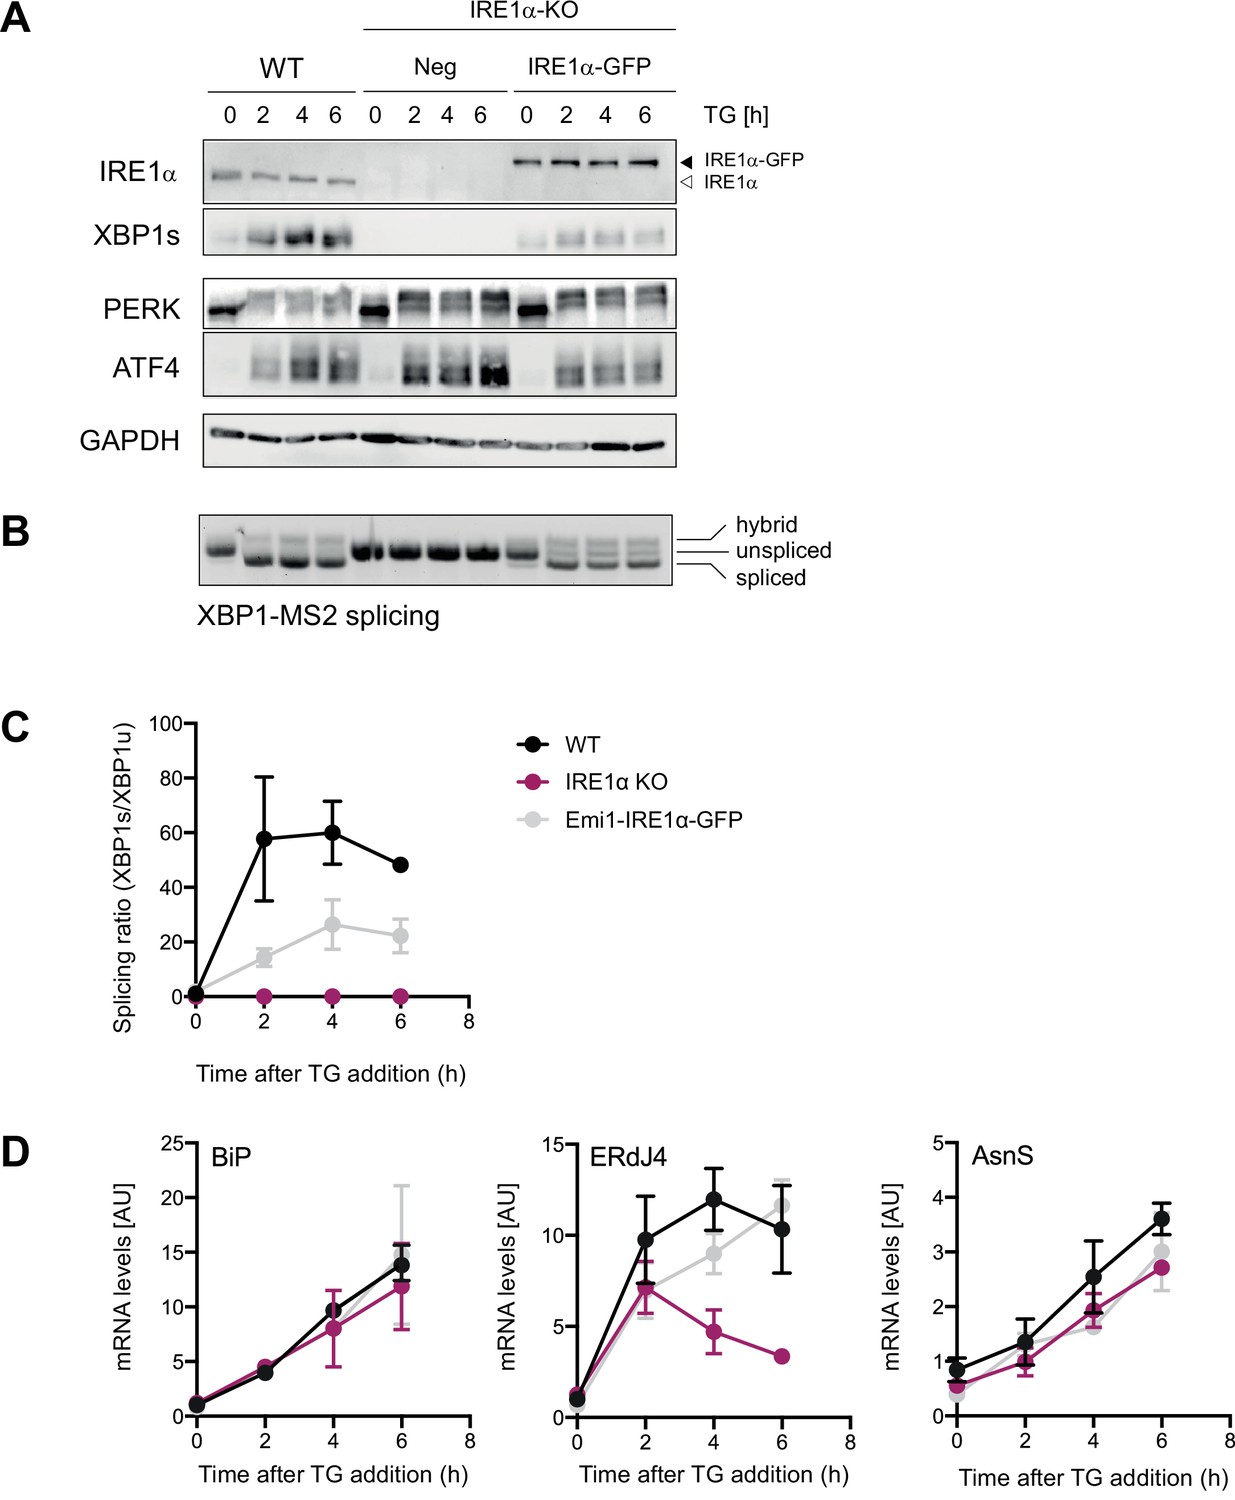
Characterization of unfolded protein response (UPR) activation in Emi1-IRE1α-GFP expressing cells.
HeLa cells, wild-type (WT) or inositol-requiring enzyme 1 alpha (IRE1α) KO (knock out) expressing either no IRE1α (Neg) or reconstituted (Emi1-) IRE1α-GFP at low levels were kept untreated or treated with 100 nM thapsigargin (TG) for indicated time points. (A) Western blot analysis of IRE1α, XBP1s, PERK, and ATF4 levels in response to TG treatment. (B) Agarose gel for semi-quantitative analysis XBP1-MS2 WT reporter mRNA splicing. Lower band = spliced XBP1, middle band = unspliced XBP1, upper band = hybrid splicing intermediate (one strand ‘spliced’, one strand ‘unspliced’). (C) Quantitative PCR analysis to determine endogenous XBP1 splicing ratio from the same RNA samples. (D) RT-PCR-based quantification of the levels of three UPR-induced mRNAs: BiP (ATF6-dependent), ERdJ4 (XBP1-dependent), and asparagin synthetase (AsnS; ATF4-dependent). As anticipated, the levels of BiP and AsnS mRNA increased upon TG addition, while ERdJ4 expression was impaired in IRE1α KO cells and restored by ectopic IRE1α-GFP. Graphs represent the average ± SD of three independent experiments. For raw data see Figure 4—figure supplement 1—source data 1.
-
Figure 4—figure supplement 1—source data 1
Raw gel images for Figure 4—figure supplement 1.
- https://cdn.elifesciences.org/articles/75580/elife-75580-fig4-figsupp1-data1-v1.zip
Videos
Video 1
XBP1 wild-type (WT) mRNA colocalization with the endoplasmic reticulum (ER).
HeLa cell line stably expressing XBP1 WT reporter transcripts, NLS-stdMCP-stdHalo, and an ER marker. Simultaneous image acquisition for both channels (XBP1 WT, red, and ER, gray) using 50 ms exposure times (100 frames total). The movie is played at 20 fps. The scale bar is 5 μm.
Video 2
Recruitment of a single XBP1 wild-type mRNA transcript to the endoplasmic reticulum (ER).
Close-up from the same image series as shown in Video 1 but highlighting an example for a single particle that is recruited to the ER surface.
Video 3
Stable association of a single XBP1 wild-type mRNA transcript with an endoplasmic reticulum (ER) sheet.
Close-up from the same image series as shown in Video 1 but highlighting an example for a single particle that is stably associated with the ER surface.
Video 4
Lack of colocalization with the endoplasmic reticulum (ER) exhibited by XBP1 HR2 mutant transcripts.
HeLa cell line stably expressing XBP1 HR2 mutant reporter transcripts, NLS-stdMCP-stdHalo and an ER marker. Simultaneous image acquisition for both channels (HR2 mutant, yellow and ER, gray) using 50 ms exposure times (100 frames total). The movie is played at 20 fps. The scale bar is 5 μm.
Video 5
Live imaging of XBP1u translation on the endoplasmic reticulum (ER).
HeLa cell line stably expressing XBP1u translation reporter transcripts, scAB-GFP, and Sec61b-SNAP as ER marker. Simultaneous image acquisition for both channels (XBP1u translation sites, green, and ER, gray) using 50 ms exposure times (100 frames total). The movie is played at 20 fps. The scale bar is 5 μm.
Video 6
Colocalization of XBP1 unspliceable mutant reporter transcripts with the endoplasmic reticulum (ER).
HeLa cell line stably expressing XBP1 splice site mutant transcripts, NLS-stdMCP-stdHalo and an ER marker. Simultaneous image acquisition for both channels (XBP1 Unspliceable, blue and ER, gray) using 50 ms exposure times (100 frames total). The movie is played at 20 fps. The scale bar is 5 μm.
Video 7
Lack of colocalization with the endoplasmic reticulum (ER) exhibited by XBP1 spliced reporter transcripts.
HeLa cell line stably expressing spliced XBP1 transcripts, NLS-stdMCP-stdHalo, and an ER marker. Simultaneous image acquisition for both channels (XBP1 spliced, light blue and ER, gray) using 50 ms exposure times (100 frames total). The movie is played at 20 fps. The scale bar is 5 μm.
Video 8
Lack of colocalization with the endoplasmic reticulum (ER) exhibited by XBP1 WT transcripts in response to ER stress.
HeLa cell line stably expressing XBP1 wild-type (WT) reporter transcripts, NLS-stdMCP-stdHalo, and an ER marker. Cells were treated with 5 µg/ml tunicamycin (TM) for 3–4 hours prior to image acquisition. Simultaneous image acquisition for both channels (XBP1 WT, red, and ER, gray) using 50 ms exposure times (100 frames total). The movie is played at 20 fps. The scale bar is 5 μm.
Video 9
XBP1 WT mRNA colocalization with the endoplasmic reticulum (ER) during ER stress and inhibition of inositol-requiring enzyme 1 alpha RNase activity.
HeLa cell line stably expressing XBP1 wild-type (WT) reporter transcripts, NLS-stdMCP-stdHalo, and an ER-marker. Cells were treated with 5 µg/ml tunicamycin and 50 µM 4µ8C for 3–4 hours prior to image acquisition. Simultaneous image acquisition for both channels (XBP1 WT, red, and ER, gray) using 50 ms exposure times (100 frames total). The movie is played at 20 fps. The scale bar is 5 μm.
Video 10
No accumulation of XBP1 wild-type (WT) transcripts in inositol-requiring enzyme 1 alpha (IRE1α)-GFP foci during IRE1α inhibition.
HeLa cell line stably expressing XBP1 WT reporter transcripts, NLS-stdMCP-stdHalo and IRE1α-GFP. Cells were treated with 5 µg/ml tunicamycin and 50 µM 4µ8C for 2–3 hours prior to image acquisition. Simultaneous image acquisition for both channels (XBP1 WT, red, and IRE1α-GFP, gray) using 50 ms exposure times (100 frames total). The movie is played at 20 fps. The scale bar is 5 μm.
Video 11
Detection of single XBP1 wild-type (WT) transcripts in inositol-requiring enzyme 1 alpha (IRE1α)-GFP foci is possible but extremely rare.
HeLa cell line stably expressing XBP1 WT reporter transcripts, NLS-stdMCP-stdHalo, and IRE1α-GFP. Cells were treated with 5 µg/ml tunicamycin and 50 µM 4µ8C for 2–3 hours prior to image acquisition. Simultaneous image acquisition for both channels (XBP1 WT, red, and IRE1α-GFP, gray) using 50 ms exposure times (100 frames total). The movie is played at 20 fps. The scale bar is 5 μm. White arrow indicates a single XBP1 mRNA particle that colocalizes with an IRE1α cluster.
Video 12
No accumulation of XBP1 splice site mutant transcripts in inositol-requiring enzyme 1 alpha (IRE1α)-GFP foci.
HeLa cell line stably expressing XBP1 splice site mutant reporter transcripts, NLS-stdMCP-stdHalo, and IRE1α-GFP. Cells were treated with 5 µg/ml tunicamycin for 3–4 hours prior to image acquisition. Simultaneous image acquisition for both channels (Unspliceable XBP1 reporter, blue, and IRE1α-GFP, gray) using 50 ms exposure times (100 frames total). The movie is played at 20 fps. The scale bar is 5 μm.
Tables
Table 1
List of antibodies used for western blotting.
| Protein | Provider | Cat. # | Notes |
|---|---|---|---|
| XBP1 | Santa Cruz Biotechnology | sc-7160 (M-186) | Detects murine XBP1 much better than endogenous, human XBP1 |
| XBP1 | Cell Signaling | #12,782 | Used to detect both human and murine XBP1 proteins |
| IRE1α | Cell Signaling | #3294 | |
| Calnexin | Novus Biologicals | NBP1-97485 | |
| Alpha-tubulin | Sigma | T6074 | |
| GAPDH | Cell Signaling | #2118 |
Table 2
List of primers used for RT-PCR analysis.
| Oligonucleotides used in this study (1st Fwd; 2nd Rev.) |
|---|
| H.s. Histone |
| AAAGCCGCTCGCAAGAGTGCG |
| ACTTGCCTCCTGCAAAGCAC |
| H.s. GRP78 |
| GAGCTGTGCAGAAACTCCGGCG |
| ACCAACTGCTGAATCTTTGGAATTCGAGT |
| H.s. XBP1u |
| CACTCAGACTACGTGCACCTC |
| CAGGGTGATCATTCTCTGAGGGGCTG |
| H.s. XBP1s |
| CGGGTCTGCTGAGTCCGCAGCAG |
| CAGGGTGATCATTCTCTGAGGGGCTG |
| M.m. XBP1u |
| CACTCAGACTACGTGCACCTC |
| CAGGGTGATCATTCTCTGAGGGGCTG |
| M.m XBP1s |
| CGGGTCTGCTGAGTCCGCAGCAG |
| CAGGGTGATCATTCTCTGAGGGGCTG |
| PCR to analyze M.m splicing by agarose electrophoresis |
| ACGCTGGATCCTGACGAGGTTCC |
| GAGAAAGGGAGGCTGGTAAGGAACTA |
Table 3
List of smFISH probes to detect mouse XBP1 mRNA.
| 1 | taagagtagcactttggggg |
|---|---|
| 2 | gctactctgtttttcagttt |
| 3 | ctttctttctatctcgagca |
| 4 | ctgatttcctagctggagtt |
| 5 | cgtgagttttctcccgtaaa |
| 6 | tctggaacctcgtcaggatc |
| 7 | agaggtgcacatagtctgag |
| 8 | ttctggggaggtgacaactg |
| 9 | tgtcagagtccatgggaaga |
| 10 | actcagaatctgaagaggca |
| 11 | ccagaatgcccaaaaggata |
| 12 | aacatgacagggtccaactt |
| 13 | actctggggaaggacatttg |
| 14 | tggtaaggaactaggtcctt |
| 15 | gagttcattaatggcttcca |
| 16 | gcttggtgtatacatggtca |
| 17 | cagaggggatctctaaaact |
| 18 | acgttagtttgactctctgt |
| 19 | tgcttcctcaattttcacta |
| 20 | cctcttctgaagagcttaga |
| 21 | gagacaatgaattcagggtg |
| 22 | ttccaaaggctctttcttca |
| 23 | ccagctctgggatgaagtca |
| 24 | gctggatgaaagcaggtttg |
| 25 | caagaaggtggtctcagaca |
| 26 | atatccacagtcactgtgag |
| 27 | gtctgtaccaagtggagaag |
| 28 | cattggcaaaagtatcctcc |
| 29 | cactaatcagctgggggaaa |
| 30 | cagtgttatgtggctcttta |
| 31 | ctaggcaatgtgatggtcag |
| 32 | aagagacaggcctatgctat |
| 33 | cctctactttggcttttaac |
| 34 | ggaattcttctaaggccaga |
| 35 | cttggaagtcatctatgaga |
| 36 | ataccttagacagctgagtg |
| 37 | agctgtagtactggaatacc |
| 38 | tttagagtatactaccacct |
| 39 | aaactgtcaaatgaccctcc |
| 40 | catgtccacctgacatgtcg |
| 41 | gaaatgctaagggccattca |
| 42 | cgaaacctgggaagcagaga |
| 43 | cataagggaaaacaagcccc |
| 44 | agatccatcaagcatttaca |
Table 4
Imaging data statistics.
| Data statistics for live imaging experiments | ||||||||
|---|---|---|---|---|---|---|---|---|
| Reporter | Experiment | Independent replicates | ID experiments | Cells | Mean tracks (≥3 frames) per cell | Tracks ≥3 frames | Tracks ≥10 frames | Tracks ≥30 frames |
| Gaussia | Ctrl | 2 | 20200323, 20200420 | 19 | 149 | 2822 | 1480 | 864 |
| XBP1 wt | Ctrl | 4 | 20191023, 20191108, 20200313,20210702 | 37 | 141 | 5200 | 2588 | 997 |
| XBP1u translation reporter | Ctrl | 3 | 20211018, 20211022, 20211023 | 50 | 36 | 1815 | 923 | 519 |
| XBP1 HR2 mutant | Ctrl | 3 | 20191023, 20191108, 20200313 | 25 | 206 | 5144 | 2454 | 653 |
| Spliced | Ctrl | 3 | 20200313, 20210226, 20211022 | 36 | 193 | 6943 | 3261 | 955 |
| Unspliceable | Ctrl | 3 | 20200313, 20210226, 20211025 | 34 | 194 | 6612 | 2997 | 1120 |
| XBP1 wt | TM | 3 | 20210218, 20210322, 20210702 | 37 | 117 | 4326 | 2183 | 741 |
| Spliced | TM | 3 | 20210218, 20210322, 20211022 | 35 | 152 | 5309 | 2571 | 817 |
| Unspliceable | TM | 3 | 20210218, 20210322, 20211025 | 43 | 120 | 5143 | 2491 | 1001 |
| XBP1 wt | TM +4µ8C | 3 | 20210219, 20210702, 20211017 | 41 | 119 | 4896 | 2509 | 1046 |
| Spliced | TM +4µ8C | 3 | 20210219, 20211017, 20211022 | 35 | 173 | 6,044 | 2,792 | 793 |
| Unspliceable | TM +4µ8C | 3 | 20210219, 20211017, 20211025 | 48 | 120 | 5750 | 2766 | 1031 |
| Data statistics for smFISH experiments | ||||||||
| Experiment | Colocalization control | |||||||
| Condition | Ctrl | TM | XBP1 wt +Renilla Luciferase | XBP1u only | ||||
| Cells | 278 | 170 | 208 | 114 | ||||
| Replicates | 2 | 2 | 1 | 1 | ||||
| scAB-GFP spots | 4172 | 1928 | 4086 | 1928 | ||||
| XBP1 mRNA spots | 6704 | 4186 | 5230 | 2313 | ||||
| Mean fraction of transl. mRNAs | 0.47 | 0.18 | 0.011 | 0.498 | ||||
| Data statistics for IRE1a-GFP foci quantification | ||||||||
| Experiment | Construct name | Replicate 1 | Replicate 2 | Replicate 3 | Replicate 4 | |||
| TM | Emi1-IRE1α-GFP | 20220510_577 | 20220510_630 | 20220513_630 | ||||
| Cells total | 233 | 115 | 167 | |||||
| Cells w/o foci | 233 | 115 | 167 | |||||
| Cells with foci | 0 | 0 | 0 | |||||
| Mean(Fraction in foci) | 0 | 0 | 0 | |||||
| SD (Fraction in foci) | 0 | 0 | 0 | |||||
| Fraction(Cells with foci) | 0 | 0 | 0 | |||||
| Image series | 10 | 10 | 10 | |||||
| IRE1α-GFP | 20200826_631 | 20220510_630 | 20220513_630 | |||||
| Cells total | 55 | 178 | 301 | |||||
| Cells w/o foci | 43 | 152 | 213 | |||||
| Cells with foci | 12 | 26 | 88 | |||||
| Mean(Fraction in foci) | 0.01920605 | 0.02054973 | 0.02550403 | |||||
| SD (Fraction in foci) | 0.00850352 | 0.01393375 | 0.01711448 | |||||
| Fraction(Cells with foci) | 0.21818182 | 0.14606742 | 0.2923588 | |||||
| Image series | 8 | 10 | 15 | |||||
| Ctrl | Emi1-IRE1α-GFP | 20220427_630 | 20220428_577 | 20220428_630 | 20220513_630 | |||
| Cells total | 76 | 107 | 53 | 136 | ||||
| Cells w/o foci | 76 | 107 | 53 | 136 | ||||
| Cells with foci | 0 | 0 | 0 | 0 | ||||
| Mean(Fraction in foci) | 0 | 0 | 0 | 0 | ||||
| SD (Fraction in foci) | 0 | 0 | 0 | 0 | ||||
| Fraction(Cells with foci) | 0 | 0 | 0 | 0 | ||||
| Image series | 5 | 5 | 5 | 10 | ||||
| IRE1α-GFP | 20220427_577 | 20220428_577 | 20220428_630 | 20220513_630 | ||||
| Cells total | 52 | 46 | 123 | 105 | ||||
| Cells w/o foci | 52 | 46 | 123 | 105 | ||||
| Cells with foci | 0 | 0 | 0 | 0 | ||||
| Mean(Fraction in foci) | 0 | 0 | 0 | 0 | ||||
| SD (Fraction in foci) | 0 | 0 | 0 | 0 | ||||
| Fraction(Cells with foci) | 0 | 0 | 0 | 0 | ||||
| Image series | 5 | 4 | 5 | 5 | ||||
Additional files
Download links
A two-part list of links to download the article, or parts of the article, in various formats.
Downloads (link to download the article as PDF)
Open citations (links to open the citations from this article in various online reference manager services)
Cite this article (links to download the citations from this article in formats compatible with various reference manager tools)
Live imaging of the co-translational recruitment of XBP1 mRNA to the ER and its processing by diffuse, non-polarized IRE1α
eLife 11:e75580.
https://doi.org/10.7554/eLife.75580


