NPAS4 in the medial prefrontal cortex mediates chronic social defeat stress-induced anhedonia-like behavior and reductions in excitatory synapses
- Department of Neuroscience, Medical University of South Carolina, United States
- Department of Anesthesiology, Medical University of South Carolina, United States
- Department of Psychiatry, Harvard Medical School, United States
- Neuroscience Graduate Program, University of Texas Southwestern Medical Center, United States
Figures
Figure 1 with 1 supplement
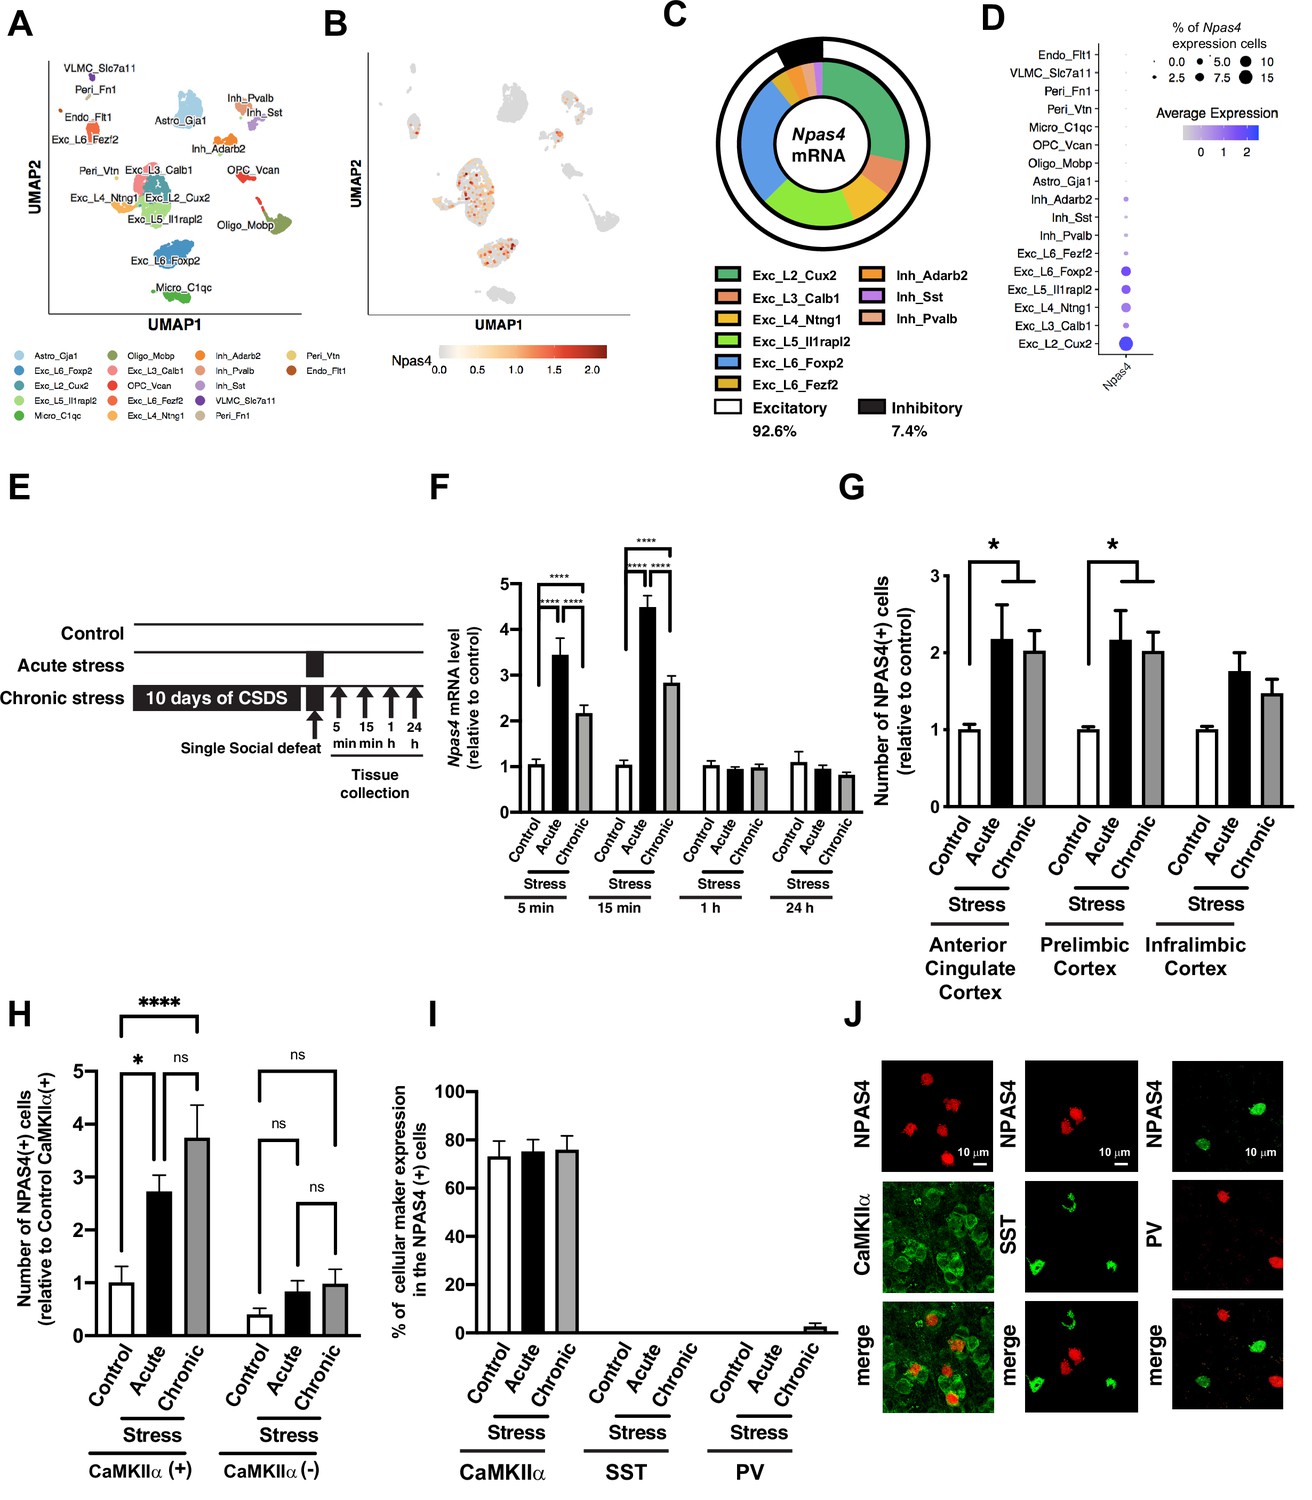
Social defeat stress induces NPAS4 expression in the medial prefrontal cortex (mPFC).
(A, B) Uniform manifold approximation and projection (UMAP) plot of the mPFC single cells colored by cell type (A) and Npsa4 mRNA expression (B). Cell types were defined by known markers and confirmed by predictive modeling using a single-cell mPFC atlas. (C) Donut chart represents the percentage of cell types that express Npas4 mRNA. (D) Dot plot represents the percentage of Npas4 mRNA expressing neurons in each cell type. (E) Schematic illustration of experimental timeline of gene expression analyses following acute social defeat stress and 10 days of chronic social defeat stress (CSDS). (F) Data plot represents the quantification of Npas4 mRNA expression following acute and chronic social defeat stress at 5 min, 15 min, 1 hr, and 24 hr (n = 5–10/condition). (G) Quantification of fold change in NPAS4-positive cell number following acute and chronic social defeat stress in subregions of the mPFC, including the anterior cingulate, prelimbic, and infralimbic cortices (n = 3–5/condition). (H) Quantification of mPFC NPAS4-positive cells relative to the number of CaMKIIα-positive cells in control/no-stress mice. (I, J) Data plot shows the percentage of CaMKIIα-, somatostatin (SST)-, and parvalbumin (PV)-positive cells in NPAS4-positive cells within the mPFC after acute stress and CSDS (n = 3–9/condition), as well as representative IHC images of NPAS4 colocalization in these respective cell type. Scale bar, 10 μm. Data shown are mean ± SEM; *p<0.05, ****p<0.0001. Also see Source data 1 for detailed statistical analyses.
-
Figure 1—source data 1
Npas4 mRNA expression in the medial prefrontal cortex (mPFC) after acute and chronic social defeat stress.
- https://cdn.elifesciences.org/articles/75631/elife-75631-fig1-data1-v1.xlsx
-
Figure 1—source data 2
Number of NPAS4(+) cells in the medial prefrontal cortex (mPFC) after acute and chronic social defeat stress.
- https://cdn.elifesciences.org/articles/75631/elife-75631-fig1-data2-v1.xlsx
-
Figure 1—source data 3
Number of NPAS4(+) cells in the medial prefrontal cortex (mPFC) in the CaMKIIα-positive or -negative cells after acute and chronic social defeat stress.
- https://cdn.elifesciences.org/articles/75631/elife-75631-fig1-data3-v1.xlsx
-
Figure 1—source data 4
% of cellular marker expression in the NPAS4(+) cells in the medial prefrontal cortex (mPFC) after acute and chronic social defeat stress.
- https://cdn.elifesciences.org/articles/75631/elife-75631-fig1-data4-v1.xlsx
Figure 1—figure supplement 1
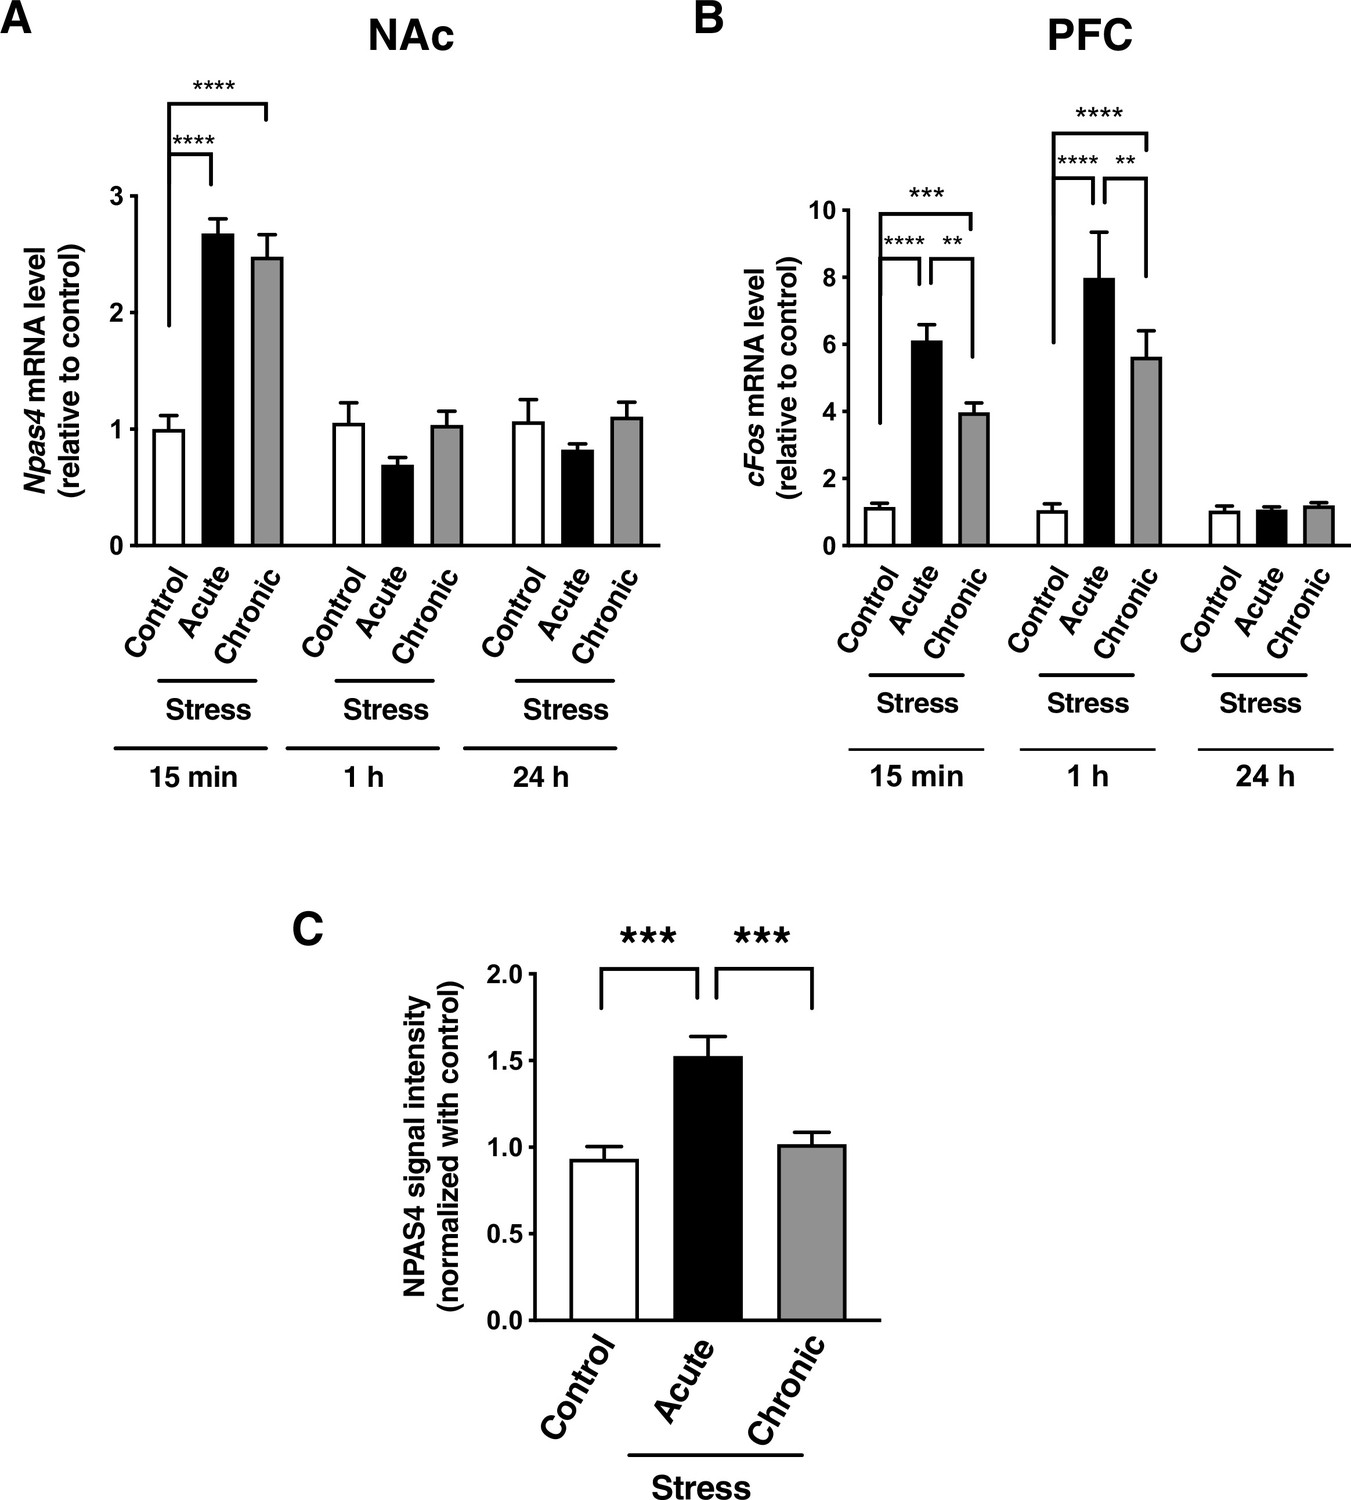
Social defeat stress induces NPAS4 and cFos expression in the nucleus accumbens (NAc) and medial prefrontal cortex (mPFC).
(A) Quantification of Npas4 mRNA expression in the NAc following acute and chronic social defeat stress at 15 min, 1 hr, and 24 hr (two-way ANOVA, Tukey’s post hoc analysis: control vs. acute stress at 15 min, p<0.0001, control vs. chronic stress at 15 min, p<0.0001, n = 5–10 per group). (B) Quantification of cFos mRNA expression in the mPFC following acute and chronic social defeat stress at 15 min, 1 hr, and 24 hr (two-way ANOVA, Tukey’s post hoc analysis: control vs. acute stress at 15 min, p<0.0001, control vs. chronic stress at 15 min, p<0.0001, acute vs. chronic stress at 15 min, p=0.0021, control vs. acute stress at 1 hr, p<0.0001, control vs. chronic stress at 1 hr, p<0.0001, acute vs. chronic stress at 1 hr, p=0.0055, n = 5–10 per group). (C) Data plot represents fold change of NPAS4 signal intensity in CaMKIIα-positive pyramidal excitatory neurons of the mPFC (one-way ANOVA, Tukey’s post hoc analysis: control vs. acute stress, p=0.0002, control vs. chronic stress, p=0.8222, acute vs. chronic stress, p=0.0001, n = 45–87 cells/3–5 animals/condition). Data shown are mean ± SEM; **p<0.01, ***p<0.001, ****p<0.0001. Also see Source data 1 for detailed for detailed statistical analyses.
-
Figure 1—figure supplement 1—source data 1
Figure 1—figure supplement 1A.
Npas4 mRNA expression in the nucleus accumbens (NAc) after acute and chronic social defeat stress.
- https://cdn.elifesciences.org/articles/75631/elife-75631-fig1-figsupp1-data1-v1.xlsx
-
Figure 1—figure supplement 1—source data 2
Figure 1—figure supplement 1B.
cFos mRNA expression in the medial prefrontal cortex (mPFC) after acute and chronic social defeat stress.
- https://cdn.elifesciences.org/articles/75631/elife-75631-fig1-figsupp1-data2-v1.xlsx
-
Figure 1—figure supplement 1—source data 3
Figure 1—figure supplement 1C.
NPAS4 signal intensity in the CaMKIIα-positive cells after acute and chronic social defeat stress.
- https://cdn.elifesciences.org/articles/75631/elife-75631-fig1-figsupp1-data3-v1.xlsx
Figure 2 with 1 supplement

NPAS4 in the medial prefrontal cortex (mPFC) is required for chronic social defeat stress (CSDS)-induced anhedonia-like behavior.
(A) Schematic illustration of experimental timeline of behavioral test battery consisting of CSDS followed by social interaction (SI; C–F), sucrose preference (SP; G), elevated plus maze (EPM; H), sucrose self-administration, and progressive ratio testing (Suc-SA and PR; Figure 3A–D). (B) AAV2-Npas4 shRNA in the adult male mPFC decreases stress-induced NPAS4 protein expression. Left: representative image showing AAV2-shRNA expression viral vector-mediated eGFP expression in the adult mice mPFC. Right: quantification of NPAS4-positive cells/100 μm2 (n = 4/condition). (C) and (D) CSDS decreases the time spent in the social interaction zone (C) and the social interaction ratio (D) in SC shRNAPFC and Npas4 shRNAPFC mice after CSDS (n = 18–25/condition). (E) and (F) CSDS increases the time spent in the avoidance corner zone and social avoidance ratio in SC shRNAPFC and Npas4 shRNAPFC mice (n = 16–24/condition). (G) CSDS-induced reduction of sucrose preference is blocked by Npas4 shRNA in the mPFC (F; n = 11–24). (H) CSDS reduces time spent in open arms (sec) in SC shRNAPFC and Npas4 shRNAPFC mice (n =14–18).
-
Figure 2—source data 1
NPAS4 (+) cells/100 μm2.
- https://cdn.elifesciences.org/articles/75631/elife-75631-fig2-data1-v1.xlsx
-
Figure 2—source data 2
Time spent in interaction zone (s) in the social interaction assay.
- https://cdn.elifesciences.org/articles/75631/elife-75631-fig2-data2-v1.xlsx
-
Figure 2—source data 3
Social interaction ratio in the social interaction assay.
- https://cdn.elifesciences.org/articles/75631/elife-75631-fig2-data3-v1.xlsx
-
Figure 2—source data 4
Time spent in avoidance corner zone (s) in the social interaction assay.
- https://cdn.elifesciences.org/articles/75631/elife-75631-fig2-data4-v1.xlsx
-
Figure 2—source data 5
Social avoidance ratio in the social interaction assay.
- https://cdn.elifesciences.org/articles/75631/elife-75631-fig2-data5-v1.xlsx
-
Figure 2—source data 6
Sucrose preference (%).
- https://cdn.elifesciences.org/articles/75631/elife-75631-fig2-data6-v1.xlsx
-
Figure 2—source data 7
Time spent in Opem Arm (s).
- https://cdn.elifesciences.org/articles/75631/elife-75631-fig2-data7-v1.xlsx
Figure 2—figure supplement 1
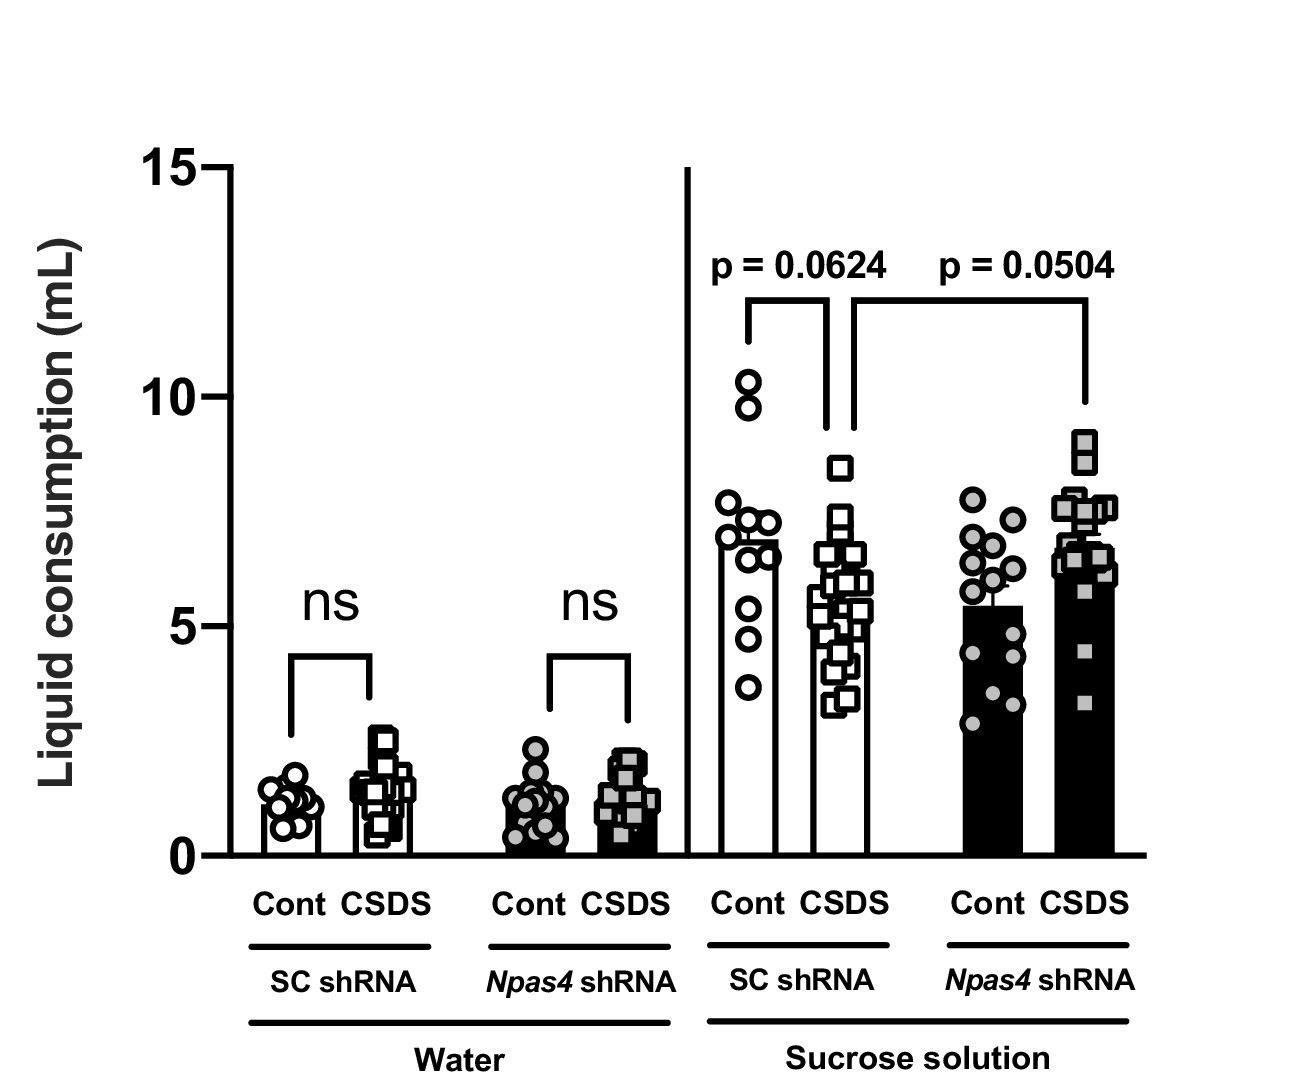
NPAS4 in the medial prefrontal cortex (mPFC) is required for chronic social defeat stress (CSDS)-induced reduction of sucrose consumption.
Chart represents the amount of consumption of water and 1% sucrose solution in each day SC shRNAPFC and Npas4 shRNAPFC mice after CSDS (two-way ANOVA, Tukey’s post hoc analysis: control vs. CSDS in SC shRNAPFC mice, p=0.0624, SC shRNA versus Npas4 shRNA animals with CSDS, p=0.0504, n = 11–24 per group). Data shown are mean ± SEM; Also see Source data 1 for detailed statistical analyses.
-
Figure 2—figure supplement 1—source data 1
Amount of liquid consumption (mL) in the sucrose preference assay.
- https://cdn.elifesciences.org/articles/75631/elife-75631-fig2-figsupp1-data1-v1.xlsx
Figure 3

NPAS4 in the medial prefrontal cortex (mPFC) regulates effort-based motivated behavior during sucrose SA following chronic social defeat stress (CSDS).
(A, B) Data plots showing the acquisition period of sucrose self-administration in SC shRNAPFC and Npas4 shRNAPFC mice after CSDS or no stress control condition, with no change in the number of sucrose delivery (A) and in the discrimination ratio between the active and inactive nosepokes (B; n = 14–18/group). (C) Data plot showing the maximum number of active nose pokes required to receive a sucrose reward (breakpoint) after CSDS in the PR test of both SC shRNAPFC and Npas4 shRNAPFC mice. Npas4 shRNAPFC mice demonstrated a significantly higher PR breakpoint compared to control SC shRNAPFC mice (n = 13–19/group). (D) Npas4 shRNAPFC mice susceptible, but not resilience, to CSDS demonstrated a significantly higher breakpoint compared to SC shRNAPFC mice after CSDS (n =3–14/group).
-
Figure 3—source data 1
Sucrose delivery in the sucrose self-administration.
- https://cdn.elifesciences.org/articles/75631/elife-75631-fig3-data1-v1.xlsx
-
Figure 3—source data 2
Discrimination index in the sucrose self-administration.
- https://cdn.elifesciences.org/articles/75631/elife-75631-fig3-data2-v1.xlsx
-
Figure 3—source data 3
Breakpoint in the sucrose self-administration.
- https://cdn.elifesciences.org/articles/75631/elife-75631-fig3-data3-v1.xlsx
-
Figure 3—source data 4
Breakpoint of animals after chronic social defeat stress (CSDS) in the sucrose self-administration.
- https://cdn.elifesciences.org/articles/75631/elife-75631-fig3-data4-v1.xlsx
Figure 4 with 1 supplement
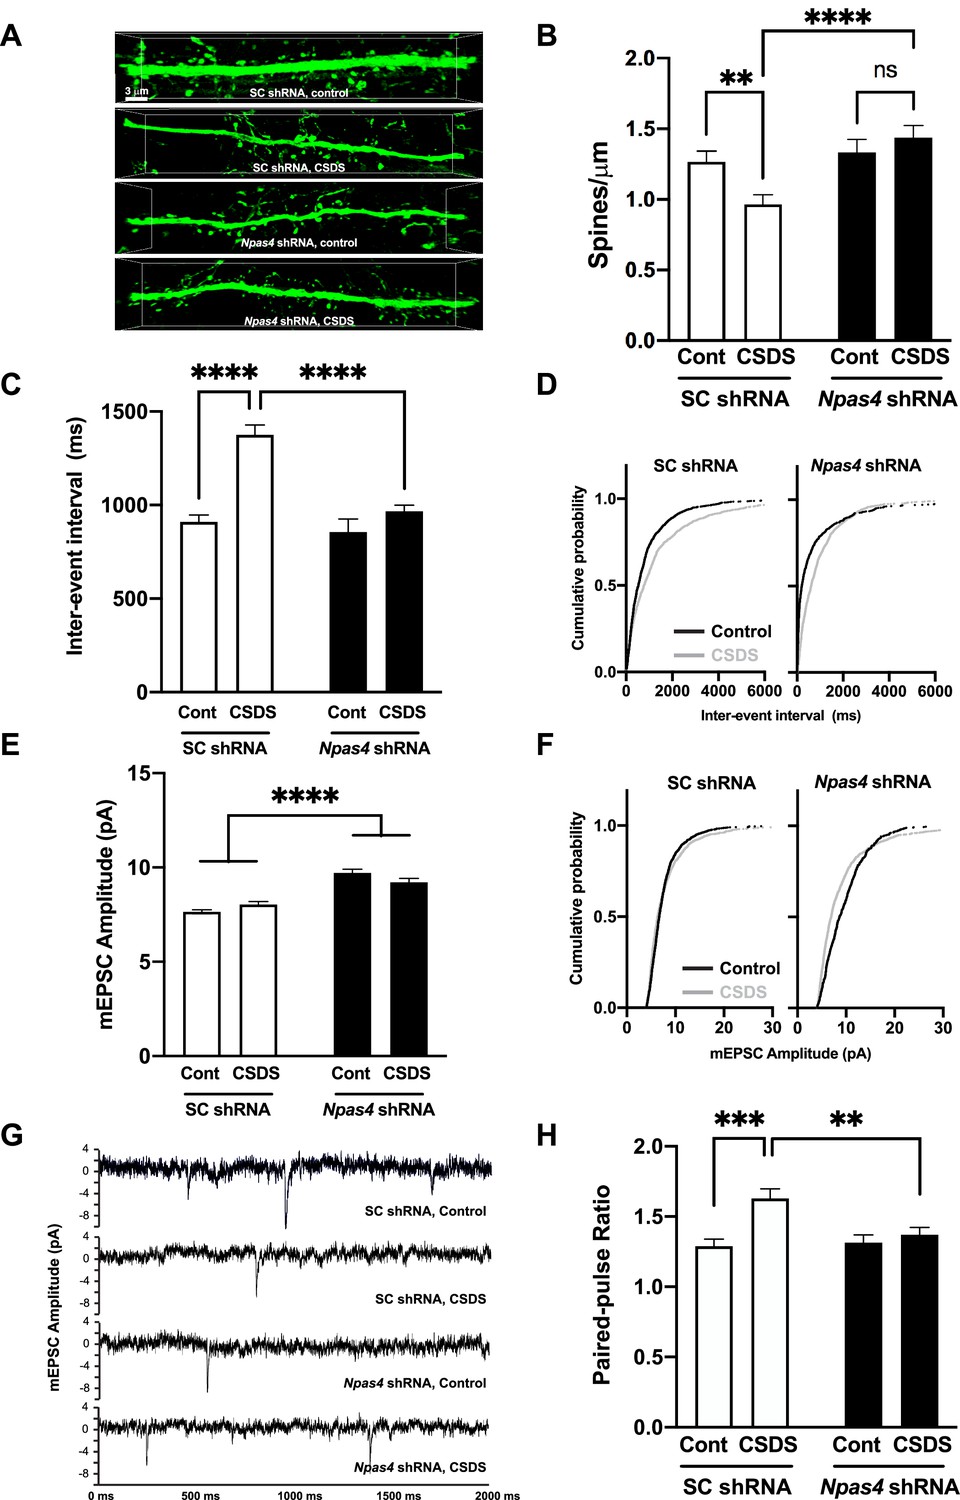
NPAS4 regulates chronic social defeat stress (CSDS)-induced reductions in medial prefrontal cortex (mPFC) dendritic spine density and excitatory synaptic transmission.
(A, B) NPAS4 regulates CSDS-induced reduction of dendritic spine density in the mPFC. (A) Representative images showing AAV2-shRNA expression viral vector-mediated eGFP expression. Scale bar, 3 μm. (B) Quantification of dendritic spine density of deep layer mPFC pyramidal neurons from SC shRNAPFC and Npas4 shRNAPFC mice after CSDS or in no stress controls (n = 34–55 branch/8 animals/condition). (C) Inter-event interval after Npas4 knockdown and CSDS. (D) Cumulative probability of inter-event interval after CSDS after SC shRNAPFC and Npas4 shRNAPFC. (E) Miniature excitatory postsynaptic current (mEPSC) amplitude after Npas4 knockdown and CSDS. (F) Cumulative probability of mEPSCC amplitude after CSDS after SC shRNAPFC and Npas4 shRNAPFC. (G) Representative mEPSC traces. (H) Paired-pulse ratio recordings after Npas4 knockdown and CSDS. Data shown are mean ± SEM; *p<0.05, ***p<0.001. Also see Source data 1 for detailed statistical analyses.
-
Figure 4—source data 1
Dendritic spine density/μm.
- https://cdn.elifesciences.org/articles/75631/elife-75631-fig4-data1-v1.xlsx
-
Figure 4—source data 2
Inter-event interval (ms).
- https://cdn.elifesciences.org/articles/75631/elife-75631-fig4-data2-v1.xlsx
-
Figure 4—source data 3
Cumulative probability of inter-event interval (ms).
- https://cdn.elifesciences.org/articles/75631/elife-75631-fig4-data3-v1.xlsx
-
Figure 4—source data 4
mEPSC amplitude (pA).
- https://cdn.elifesciences.org/articles/75631/elife-75631-fig4-data4-v1.xlsx
-
Figure 4—source data 5
Cumulative probability of mEPSC amplitude (pA).
- https://cdn.elifesciences.org/articles/75631/elife-75631-fig4-data5-v1.xlsx
-
Figure 4—source data 6
Paired-pulse ratios.
- https://cdn.elifesciences.org/articles/75631/elife-75631-fig4-data6-v1.xlsx
Figure 4—figure supplement 1
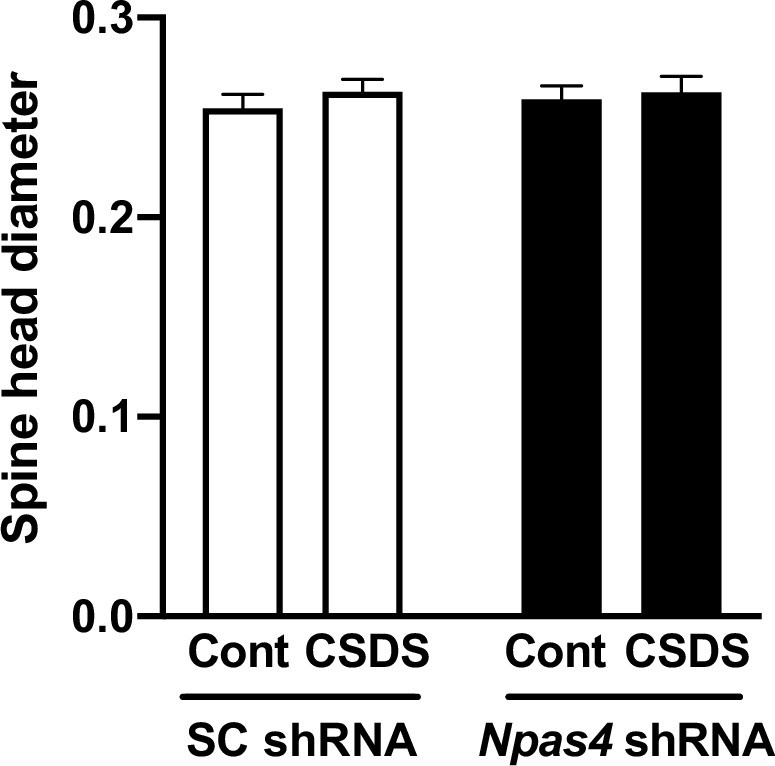
Medial prefrontal cortex (mPFC) dendritic spine morphological analyses in the mPFC of SC shRNAPFC and Npas4 shRNAPFC mice after chronic social defeat stress (CSDS).
Data plots represent spine head diameter of AAV2-SC shRNA or Npas4 shRNA viral vector-mediated eGFP-positive mPFC pyramidal neurons after CSDS (two-way ANOVA, n =34–55 branch/8 animals/condition).
-
Figure 4—figure supplement 1—source data 1
Spine head diameter.
- https://cdn.elifesciences.org/articles/75631/elife-75631-fig4-figsupp1-data1-v1.xlsx
Figure 5 with 1 supplement
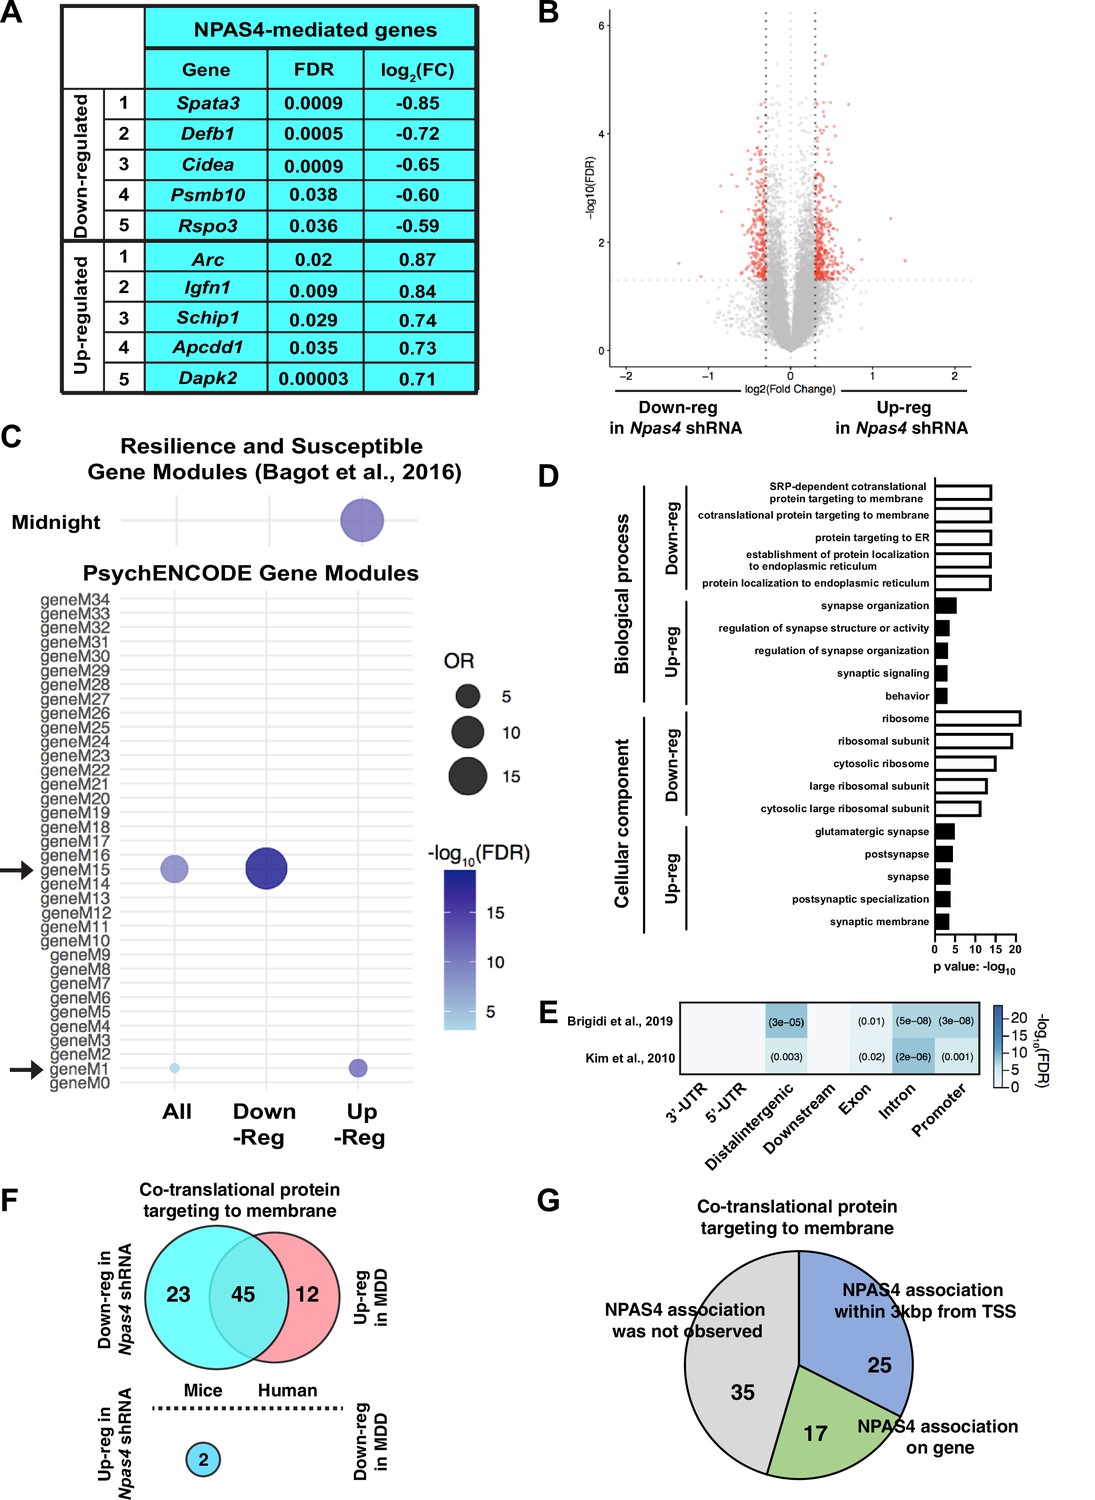
NPAS4 regulates the expression of ribosomal and glutamatergic synapse genes.
(A, B) List of top differentially expressed genes in medial prefrontal cortex (mPFC) of Npas4 shRNAPFC mice (A) and corresponding volcano plot of all significant DEGs (FDR < 0.05, log2 (FC) > |0.3|, red) compared to those that were not significant (gray; B). (C) Npas4 DEG enrichment in gene modules that are deferentially regulated in Resilience and Susceptible animals in Bagot et al., 2016 and are dysregulated in neuropsychiatric disorders; Modules M1 and M15, as shown by PsychENCODE. (D) Gene ontology analysis of down- and upregulated DEGs in Npas4 shRNAPFC mice. (E) Comparison of mPFC genes regulated by Npas4 shRNAPFC compared to previously published Npas4 ChIP-seq data (Kim et al., 2010; Brigidi et al., 2019). (F) Overlap of significantly differential expression genes (p<0.05) in Npas4 shRNAPFC mice (left; blue) and differential expression genes (p<0.05) in BA8/9 of human major depressive disorder (MDD) patients (right; pink). (G) ChIP-seq analysis of NPAS4 association with significant ribosome-related differential expression genes identified from this study.
-
Figure 5—source data 1
Table for NPAS4-mediated genes.
- https://cdn.elifesciences.org/articles/75631/elife-75631-fig5-data1-v1.xlsx
Figure 5—figure supplement 1
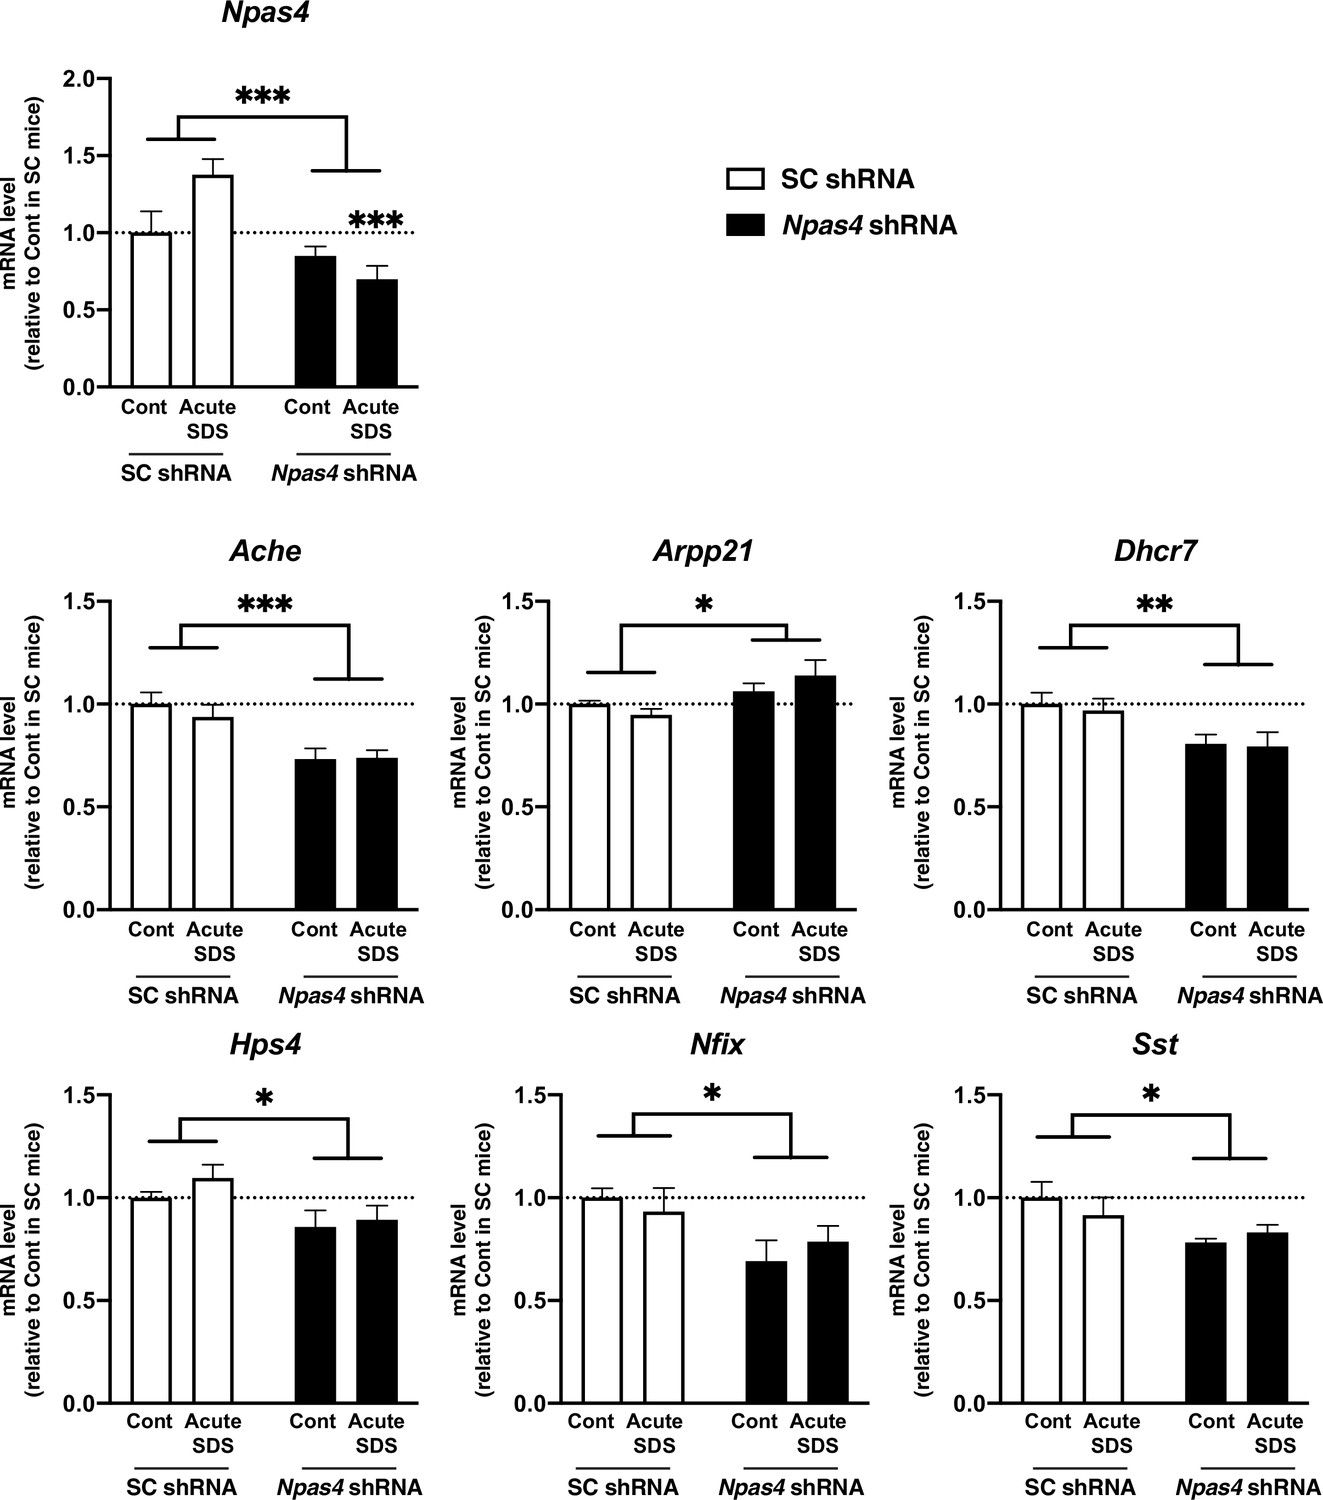
Differential expression genes in the medial prefrontal cortex (mPFC) of Npas4 shRNA mice.
Data plots represent the relative mRNA expression in the mPFC of SC shRNA and Npas4 shRNA mice (two-way ANOVA, Npas4, main effect of Npas4 shRNA, Tukey’s post hoc analysis, SC shRNAPFC and Npas4 shRNAPFC mice with acute social defeat stress [SDS], p=0.0005, Ache, main effect of Npas4 shRNA, p=0.0002, Arpp21, main effect of Npas4 shRNA, p=0.118, Dhcr7, main effect of Npas4 shRNA, p=0.0042, Hps4, main effect of Npas4 shRNA, p=0.0121, Nfix, main effect of Npas4 shRNA, p=0.0171, Sst, main effect of Npas4 shRNA, p=0.0281 [n = 7 per group]). Data shown are mean ± SEM; *p<0.05, **p<0.01. Also see Source data 1 for detailed statistical analyses.
-
Figure 5—figure supplement 1—source data 1
Differentially expression mRNA.
- https://cdn.elifesciences.org/articles/75631/elife-75631-fig5-figsupp1-data1-v1.xlsx
Figure 6
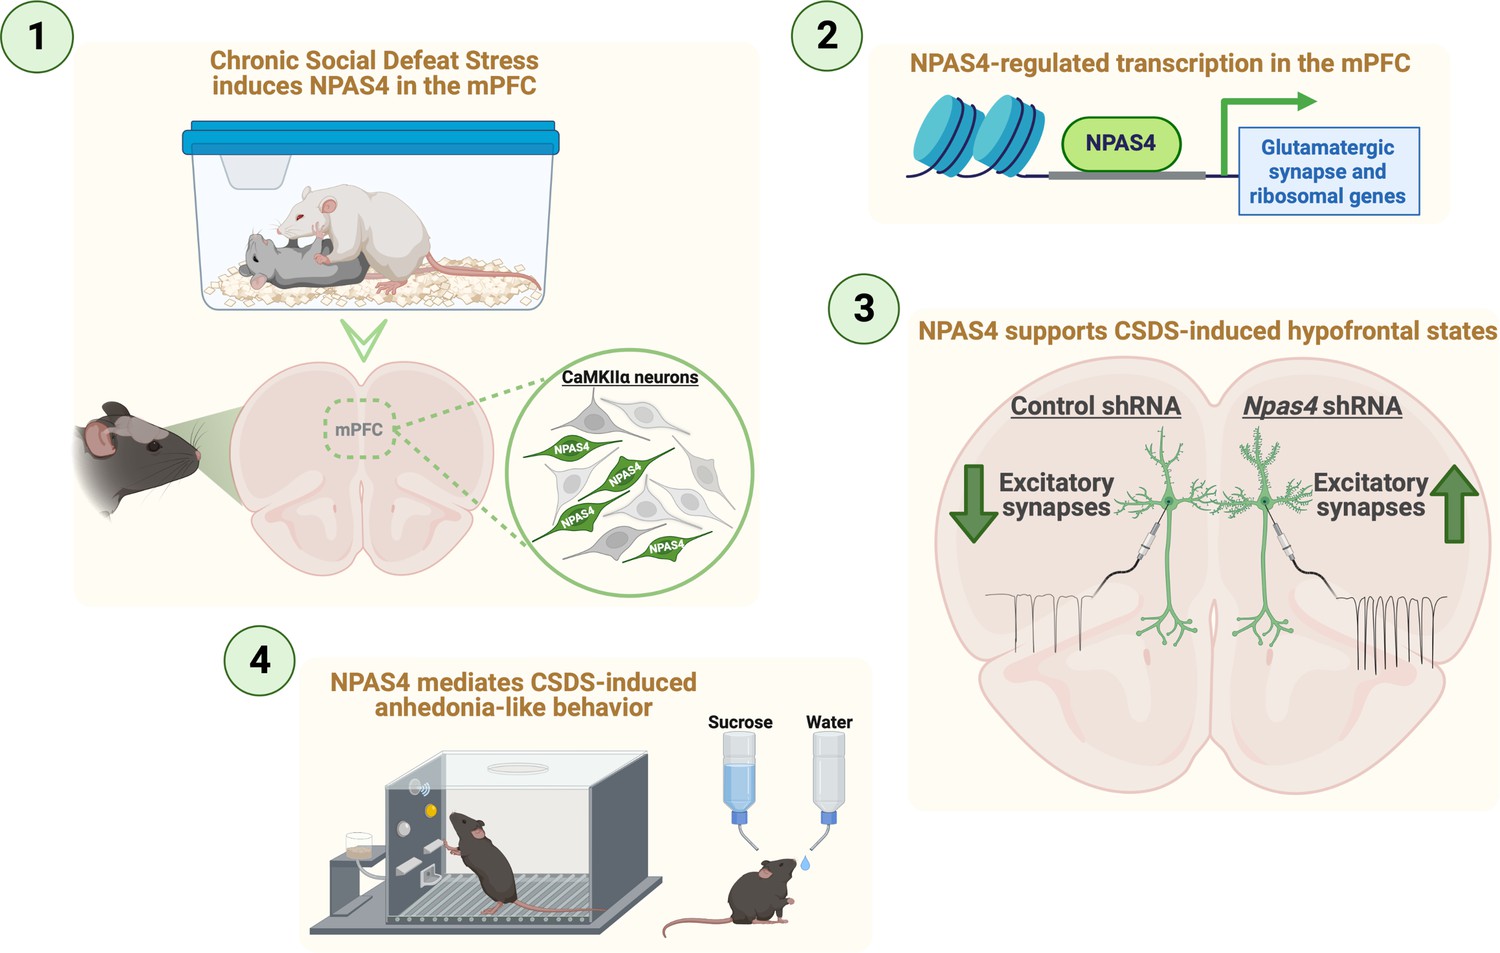
Summary for NPAS4 in the medial prefrontal cortex (mPFC) mediates chronic social defeat stress (CSDS)-induced anhedonia-like behavior and reductions in excitatory synapses.
Tables
Key resources table
| Reagent type (species) or resource | Designation | Source or reference | Identifiers | Additional information |
|---|---|---|---|---|
| Transfected construct (Mus musculus) | AAV2-Anti-Npas4 shRNA | Taniguchi et al., 2017, obtained from UNC vector Core and USC vector Core | ||
| Transfected construct (M. musculus) | AAV2-Scramble shRNA | Taniguchi et al., 2017, obtained from UNC vector Core and USC vector Core | ||
| Biological sample (M. musculus) | C57Bl6J mice | The Jackson laboratory | Strain# 000664; RRID:IMSR_JAX:000664 | |
| Antibody | Anti-CaMKIIalpha (mouse monoclonal) | Enzo Life Sciences | Cat# KAM-CA002D; RRID:AB_1659580 | IF(1:1000) |
| Antibody | Anti-somatostatin (rat monoclonal) | Millipore | Cat# MAB354; RRID:AB_2255365 | IF(1:1000) |
| Antibody | Anti- parvalbumin (mouse monoclonal) | Aves | Cat# MAB1572; RRID: AB_2174013 | IF(1:1000) |
| Antibody | Anti-GFP (chicken polyclonal) | Aves | Cat# GFP-1020; RRID: AB_10000240 | IF(1:1000) |
| Antibody | Anti-Npas4 (rabbit polyclonal) | Lin et al., 2008 | IF(1:1000–2000) | |
| Sequence-based reagent | Scramble shRNA | Lin et al., 2008 | GGTTCAGCGTCATAATT TATTCAAGAGATAAATTA TGACGCTGAACC | |
| Sequence-based reagent | Npas4 shRNA | Lin et al., 2008 | GGTTGACCCTGATAATT TATTCAAGAGATAAATTA TCAGGGTCAACC | |
| Sequence-based reagent | Npas4 forward primer | Furukawa-Hibi et al., 2012 | PCR primers | AGCATTCCAGGCT CATCTGAA |
| Sequence-based reagent | Npas4 reverse primer | Furukawa-Hibi et al., 2012 | PCR primers | GGCGAAGTAAGT CTTGGTAGGATT |
| Sequence-based reagent | Npas4 forward primer | Lin et al., 2008 | PCR primers | GCTATA CTCAGAAGG TCCAGAAGGC |
| Sequence-based reagent | Npas4 reverse primer | Lin et al., 2008 | PCR primers | TCAGAGAATGAG GGTAGCACAGC |
| Sequence-based reagent | Gapdh forward primer | Krishnan et al., 2007 | PCR primers | AGGTCGGTGTG AACGGATTTG |
| Sequence-based reagent | Gapdh reverse primer | Krishnan et al., 2007 | PCR primers | TGTAGACCATGT AGTTGAGGTCA |
| Sequence-based reagent | β-tubulin forward primer | Lin et al., 2008 | PCR primers | CGAC AATGAAG CCCTCTACGAC |
| Sequence-based reagent | β-tubulin reverse primer | Lin et al., 2008 | PCR primers | ATGGTGGCAGAC ACAAGGTGGTTG |
| Sequence-based reagent | cFos forward primer | Watanabe et al., 2009 | PCR primers | GTCGACCTAGGG AGGACCTTAC |
| Sequence-based reagent | cFos reverse primer | Watanabe et al., 2009 | PCR primers | CATCTCTGGAAG AGGTGAGGAC |
| Sequence-based reagent | Nfix forward primer | MGH, Harvard Medical School, Primer Bank | PCR primers | AGCCCCAGCTA CTACAACATA |
| Sequence-based reagent | Nfix reverse primer | MGH, Harvard Medical School, Primer Bank | PCR primers | AGTCCAGCTTT CCTGACTTCT |
| Sequence-based reagent | Sst forward primer | MGH, Harvard Medical School, Primer Bank | PCR primers | ACCGGGAAAC AGGAACTGG |
| Sequence-based reagent | Sst reverse primer | MGH, Harvard Medical School, Primer Bank | PCR primers | TTGCTGGGTT CGAGTTGGC |
| Sequence-based reagent | Dhcr7 forward primer | ORIGENE | PCR primers, Cat# MP200098 | CAAGACACCAC CTGTGACAGCT |
| Sequence-based reagent | Dhcr7 reverse primer | ORIGENE | PCR primers, Cat# MP200098 | CTGCTGGAGTAA TGGCACCTTC |
| Sequence-based reagent | Arpp21 forward primer | ORIGENE | PCR primers, Cat# MP221281 | GGAGTCAGCAAA TACCACAGACC |
| Sequence-based reagent | Arpp21 reverse primer | ORIGENE | PCR primers, Cat#: MP221281 | CTCCTTGCTGA CTGCTCATCAC |
| Sequence-based reagent | Hps4 forward primer | ORIGENE | PCR primers, Cat# MP206052 | AGTGTGAACGGA CTGGTGCTGT |
| Sequence-based reagent | Hps4 reverse primer | ORIGENE | PCR primers, Cat# MP206052 | GTCTCCTTCAGG TGGACTTCCA |
| Sequence-based reagent | Ache forward primer | ORIGENE | PCR primers, Cat# MP200188 | TTCCTTCGTGCC TGTGGTAGAC |
| Sequence-based reagent | Ache reverse primer | ORIGENE | PCR primers, Cat# MP200188 | CCGTAAACCAGAA AGTAGGAGCC |
| Software, algorithm | HOMER | Heinz et al., 2010 | ||
| Software, algorithm | STAR | Dobin et al., 2013 | ||
| Software, algorithm | HTseq | Anders et al., 2015 | ||
| Software, algorithm | biomaRt | Durinck et al., 2009 | ||
| Software, algorithm | GOstats | Falcon and Gentleman, 2007 | ||
| Other | Single-nuclei RNA-seq with mPFC from control C57BL/6J mice | This paper | GSE165586 | snRNA-seq analysis data assocciated with Figure 1A-D. |
| Other | RNA-seq with mPFC from AAV-Npas4 mRNA shRNA mice | This paper | GSE165586 | RNA-seq analysis data associated with Figure 5. |
| Other | ChIP-Seq, NPAS4 | Brigidi et al., 2019 | GSE127793 | ChIP-seq analysis data associated with Figure 5E. |
| Other | ChIP-Seq, NPAS4 | Kim et al., 2010 | GSE21161 | ChIP-seq analysis data associated with Figure 5E. |
Additional files
-
Supplementary file 1
RNA-seq data Related to Figure 5.
- https://cdn.elifesciences.org/articles/75631/elife-75631-supp1-v1.xlsx
-
Transparent reporting form
- https://cdn.elifesciences.org/articles/75631/elife-75631-transrepform1-v1.pdf
-
Source data 1
Detailed statistics information related to Figures 1—5 and figure supplements.
- https://cdn.elifesciences.org/articles/75631/elife-75631-data1-v1.xlsx
Download links
A two-part list of links to download the article, or parts of the article, in various formats.
Downloads (link to download the article as PDF)
Open citations (links to open the citations from this article in various online reference manager services)
Cite this article (links to download the citations from this article in formats compatible with various reference manager tools)
NPAS4 in the medial prefrontal cortex mediates chronic social defeat stress-induced anhedonia-like behavior and reductions in excitatory synapses
eLife 12:e75631.
https://doi.org/10.7554/eLife.75631


