Combined effect of cell geometry and polarity domains determines the orientation of unequal division
- Laboratoire de Biologie du Développement de Villefranche-sur-mer, Institut de la Mer de Villefranche-sur-mer, Sorbonne Université, CNRS, France
- Institute of Science and Technology Austria, Austria
Figures
Figure 1
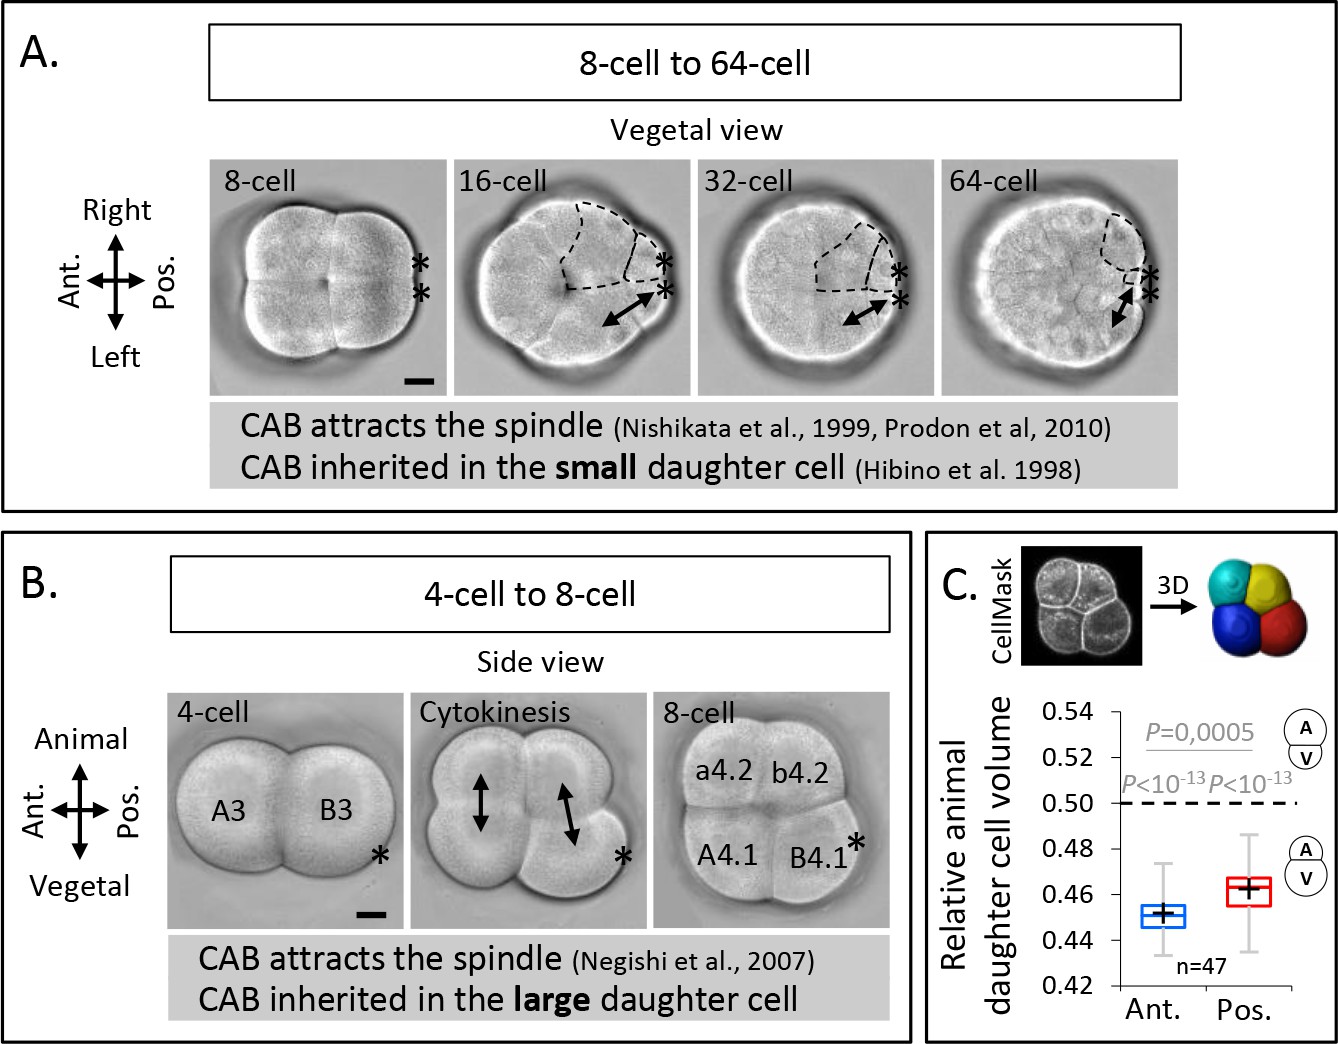
Unequal cell division at the third cleavage of ascidian embryos creates larger vegetal blastomeres which inherit the centrosome-attracting-body (CAB).
(A) Brightfield images of vegetal view of an embryo from 8- to 64-cell stage. The double black arrows on the left side of the embryo mark sister cells and the dashed lines on the right side of the embryo delineate the sister cells of different sizes. Asterisks mark the CAB. (B) Brightfield images of left-side view of an embryo positioned in a microwell with animal side on top and posterior to the right at 4-cell stage (left), during cytokinesis (middle) and at 8-cell stage (right). The double black arrows show the sister cells. Asterisks mark the CAB. (C) Images (top panel) of left-side view of an 8-cell stage embryo imaged on confocal microscope with CellMask staining and the corresponding 3D reconstruction. Plot (bottom panel) of the ratio of the animal daughter cell volume relative to total daughter cells volume for anterior (in blue) and posterior (in red) lineages at 8-cell stage (center line, median; box limits, upper and lower quartiles; whiskers, min and max; cross, mean). The p values correspond to two-tailed paired Wilcoxon tests for comparisons of anterior or posterior lineages to 0.5 (equal division) and for anterior/posterior lineages comparison. Asterisks mark the CAB. All scale bars, 20 µm.
Figure 2 with 1 supplement
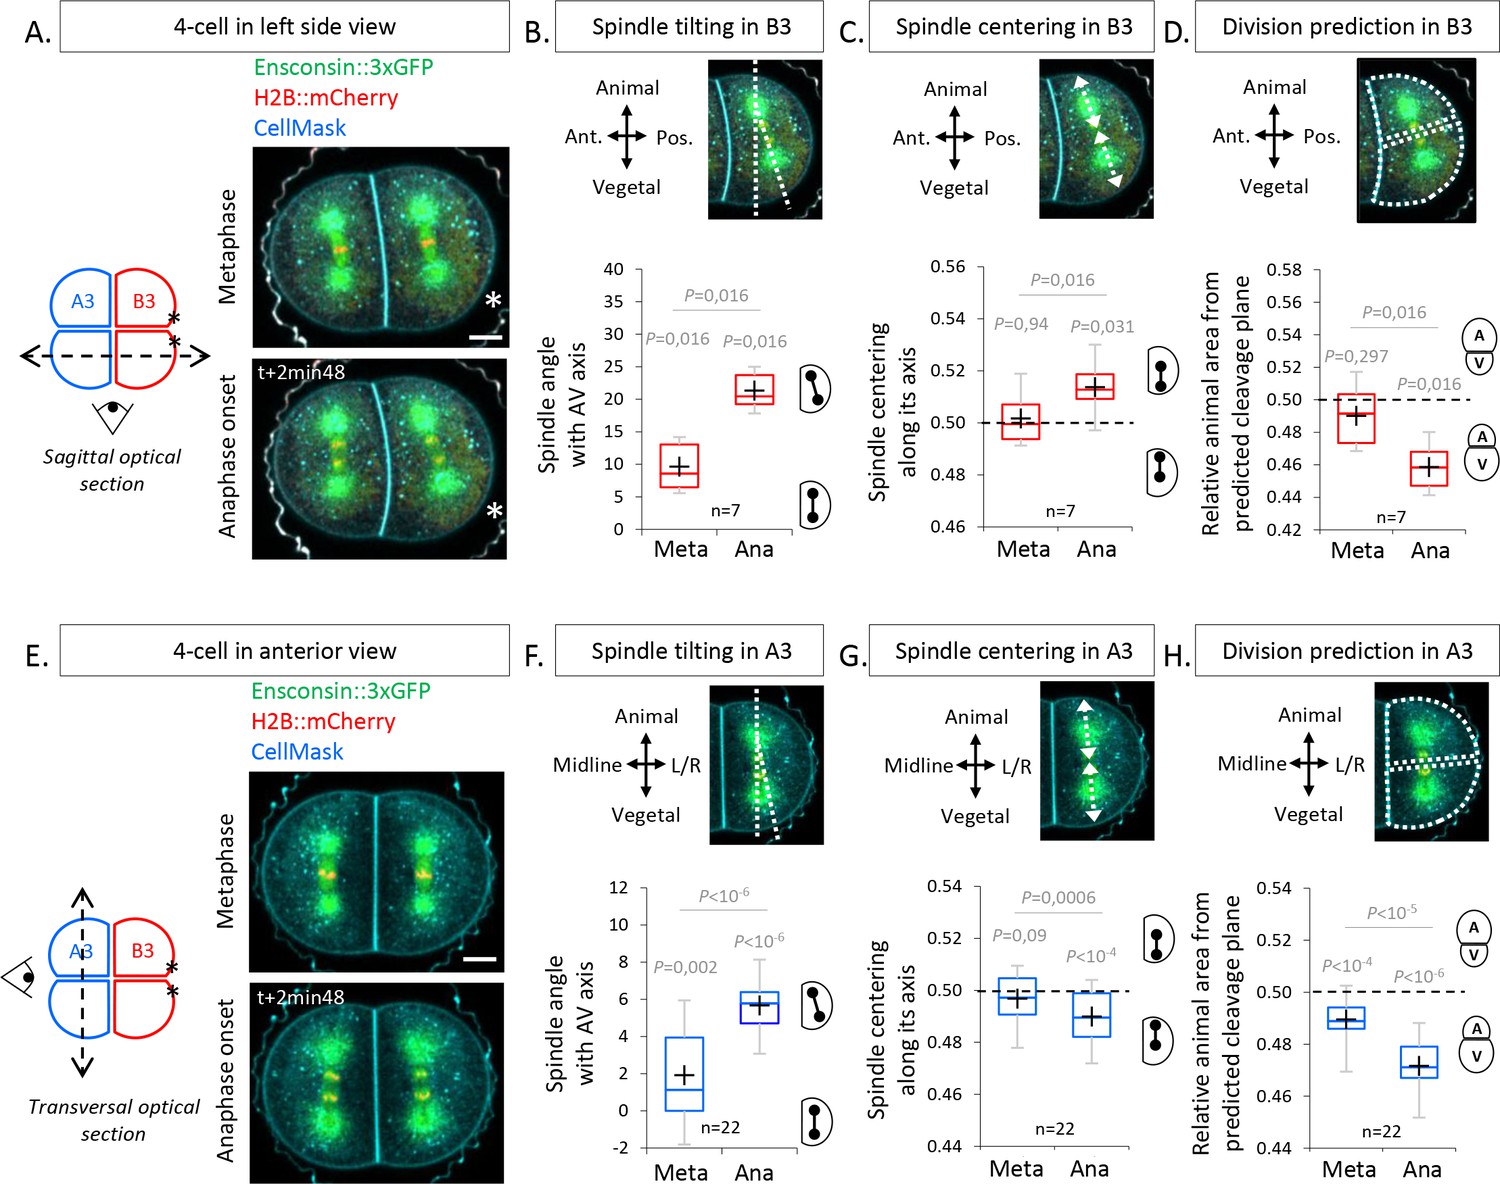
The spindles tilt at anaphase onset during unequal cell divisions (UCDs).
(A) Sagittal views showing spindle position at metaphase and anaphase onset at the 4-cell stage. Schematic illustration (left panel) of a 4-cell stage embryo with the imaging plane in a sagittal view (shown by a dotted double arrow) with anterior blastomeres A3 in blue and posterior blastomeres B3 in red. Fluorescence images of a 4-cell stage embryo in sagittal view (anterior to the left and animal on top) in metaphase (top) and anaphase onset (bottom) previously injected with mRNAs coding for Ensconsin::3xGFP (2 µg/µl, green) and H2B::mCherry (2 µg/µl, red) while plasma membrane is stained by CellMask deep red (1 µg/µl, cyan). The asterisks indicate the position of the centrosome-attracting-body (CAB) in B3 blastomeres. (B) Plot of the spindle angle with the animal-vegetal (AV) axis in posterior blastomere B3 measured on sagittal views in metaphase and anaphase. Positive angle means that the mitotic spindles point toward the posterior pole/side of the embryo. (C) Plot of the spindle centering along its axis (see Materials and methods for details) measured in posterior blastomere B3 from sagittal views in metaphase and anaphase. 0.5 means centered spindle and above 0.5 means spindle off-centered toward the vegetal pole. (D) Plot of the relative animal area after bisection according to the spindle position in posterior blastomere B3 in sagittal view. 0.5 means animal and vegetal area are equal and below means vegetal area is larger. (E) Transversal views showing spindle position in anterior blastomeres A3 in metaphase and anaphase onset at the 4-cell stage. Schematic illustration (left panel) of 4-cell stage embryo showing the transverse optical plane across the anterior blastomeres with anterior blastomeres A3 in blue and posterior blastomeres B3 in red. Fluorescence images of 4-cell stage embryo in transversal view (animal on top) in metaphase (top) and anaphase onset (bottom) previously injected with Ensconsin::3xGFP (2 µg/µl, green) and H2B::mCherry (2 µg/µl, red) mRNAs while plasma membrane is stained with CellMask deep red (1 µg/µl, cyan). (F) Plot of the spindle angle with the AV axis in anterior blastomere A3 in transversal view in metaphase and anaphase. Positive angle means that the mitotic spindles point away from the midline. (G) Plot of the spindle centering along its axis in anterior blastomere A3 in transversal view in metaphase and anaphase. 0.5 means a centered spindle and below 0.5 indicates a spindle off-centered toward the animal pole. (H) Plot of the relative animal area after bisection according to the spindle position in anterior blastomere A3 in transversal view. 0.5 means animal and vegetal area are equal and below means vegetal area is larger. All the p values correspond to two-tailed paired Wilcoxon tests for comparisons to 0.5 (equal division) or for metaphase/anaphase comparisons. The box plots are built with center line, median; box limits, upper and lower quartiles; whiskers, min and max; cross, mean.
Figure 2—figure supplement 1
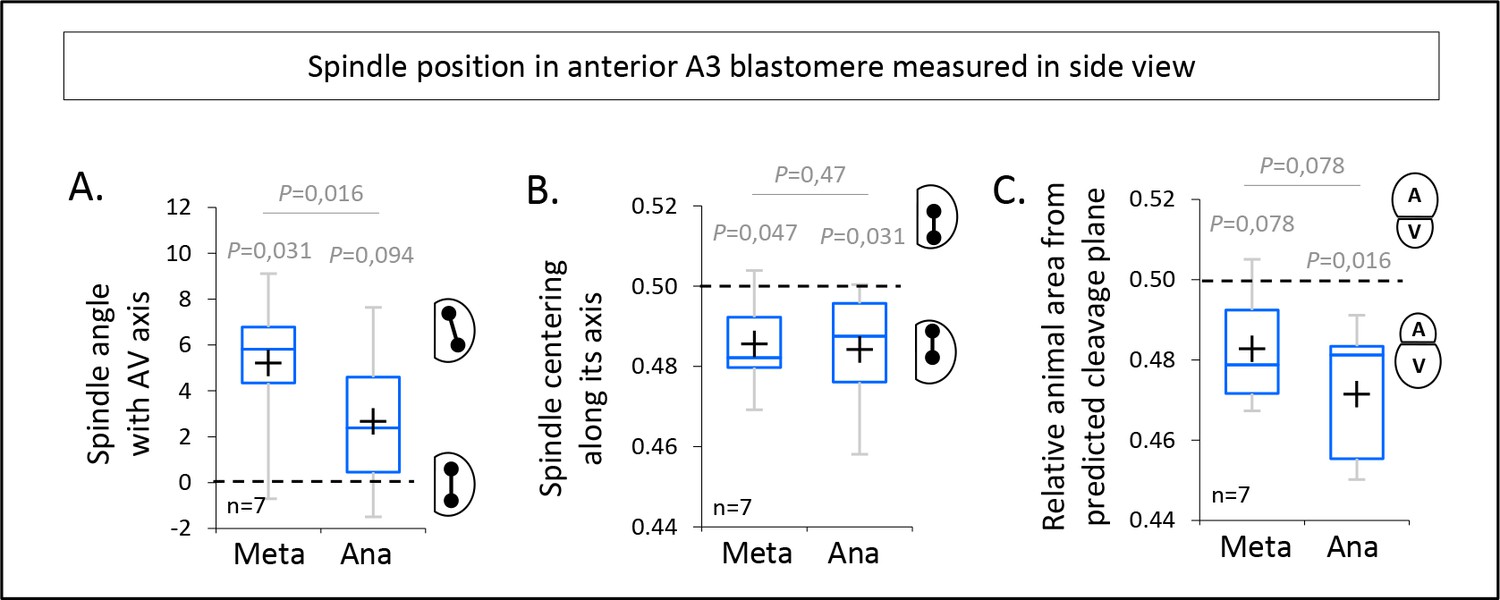
Spindle dynamics in anterior blastomeres in sagittal view.
(A) Plot of the spindle angle with the AV axis in anterior blastomere A3 measured on sagittal views (see Figure 3A) in metaphase and anaphase. Positive angle means that the mitotic spindles point toward the posterior pole/side of the embryo. (B) Plot of the spindle centering along its axis (see materials and methods for details) measured in anterior blastomere A3 from sagittal views (see Figure 3A) in metaphase and anaphase. 0.5 means centered spindle and above 0.5 means spindle off-centered toward the vegetal pole. (C) Plot of the relative animal area after bisection according to the spindle position in anterior blastomere A3 in sagittal view (see Figure 3A). 0.5 means animal and vegetal area are equal and below means vegetal area is larger. All the P values correspond to two-tailed paired Wilcoxon tests for comparisons to 0.5 (equal division) and for metaphase/anaphase comparisons. The box plots are built with center line, median; box limits, upper and lower quartiles; whiskers, min and max; cross, mean.
Figure 3

Spindle tilting in an anisotropic cell geometry induces unequal cell division (UCD) by displacing the cleavage plane from the cell center of mass.
(A) Simulation of the effect of a tilted but centered spindle on the bisection of the cell. Schematic illustration of the simulations realized using real cell contour of anterior blastomeres from transversal view. First scenario, the spindle is positioned parallel to the animal-vegetal (AV) axis (not tilted) and centered along this axis (top panel). Second scenario, the spindle tilting is applied (tilted) while kept centered along its axis (bottom panel). Plot of the relative animal area to total cell area after bisection according to the spindle angle using the tilting angles measured at anaphase onset (n = 22) (right panel) (center line, median; box limits, upper and lower quartiles; whiskers, min and max; cross, mean). 0.5 means animal and vegetal area are equal and below means vegetal area is larger. Gray lines connect simulation for the same real cell contour and tilting angle. The p values correspond to two-tailed paired Wilcoxon tests for comparisons to 0.5 (equal division) and for comparison between the two conditions. (B) Theoretical evaluation of spindle tilting in different cell geometries. Schematic illustration of the division plane from a gradually tilted but centered spindle (the top spindle pole remains fixed) in an isotropic shape (circle) (top panel) and in a anisotropic shape (half-circular shape) (bottom panel). Plot of the relative top area to total area after bisection according to the spindle tilting (left panel). 0.5 means top and bottom area are equal and below means bottom area is larger.
Figure 4 with 2 supplements
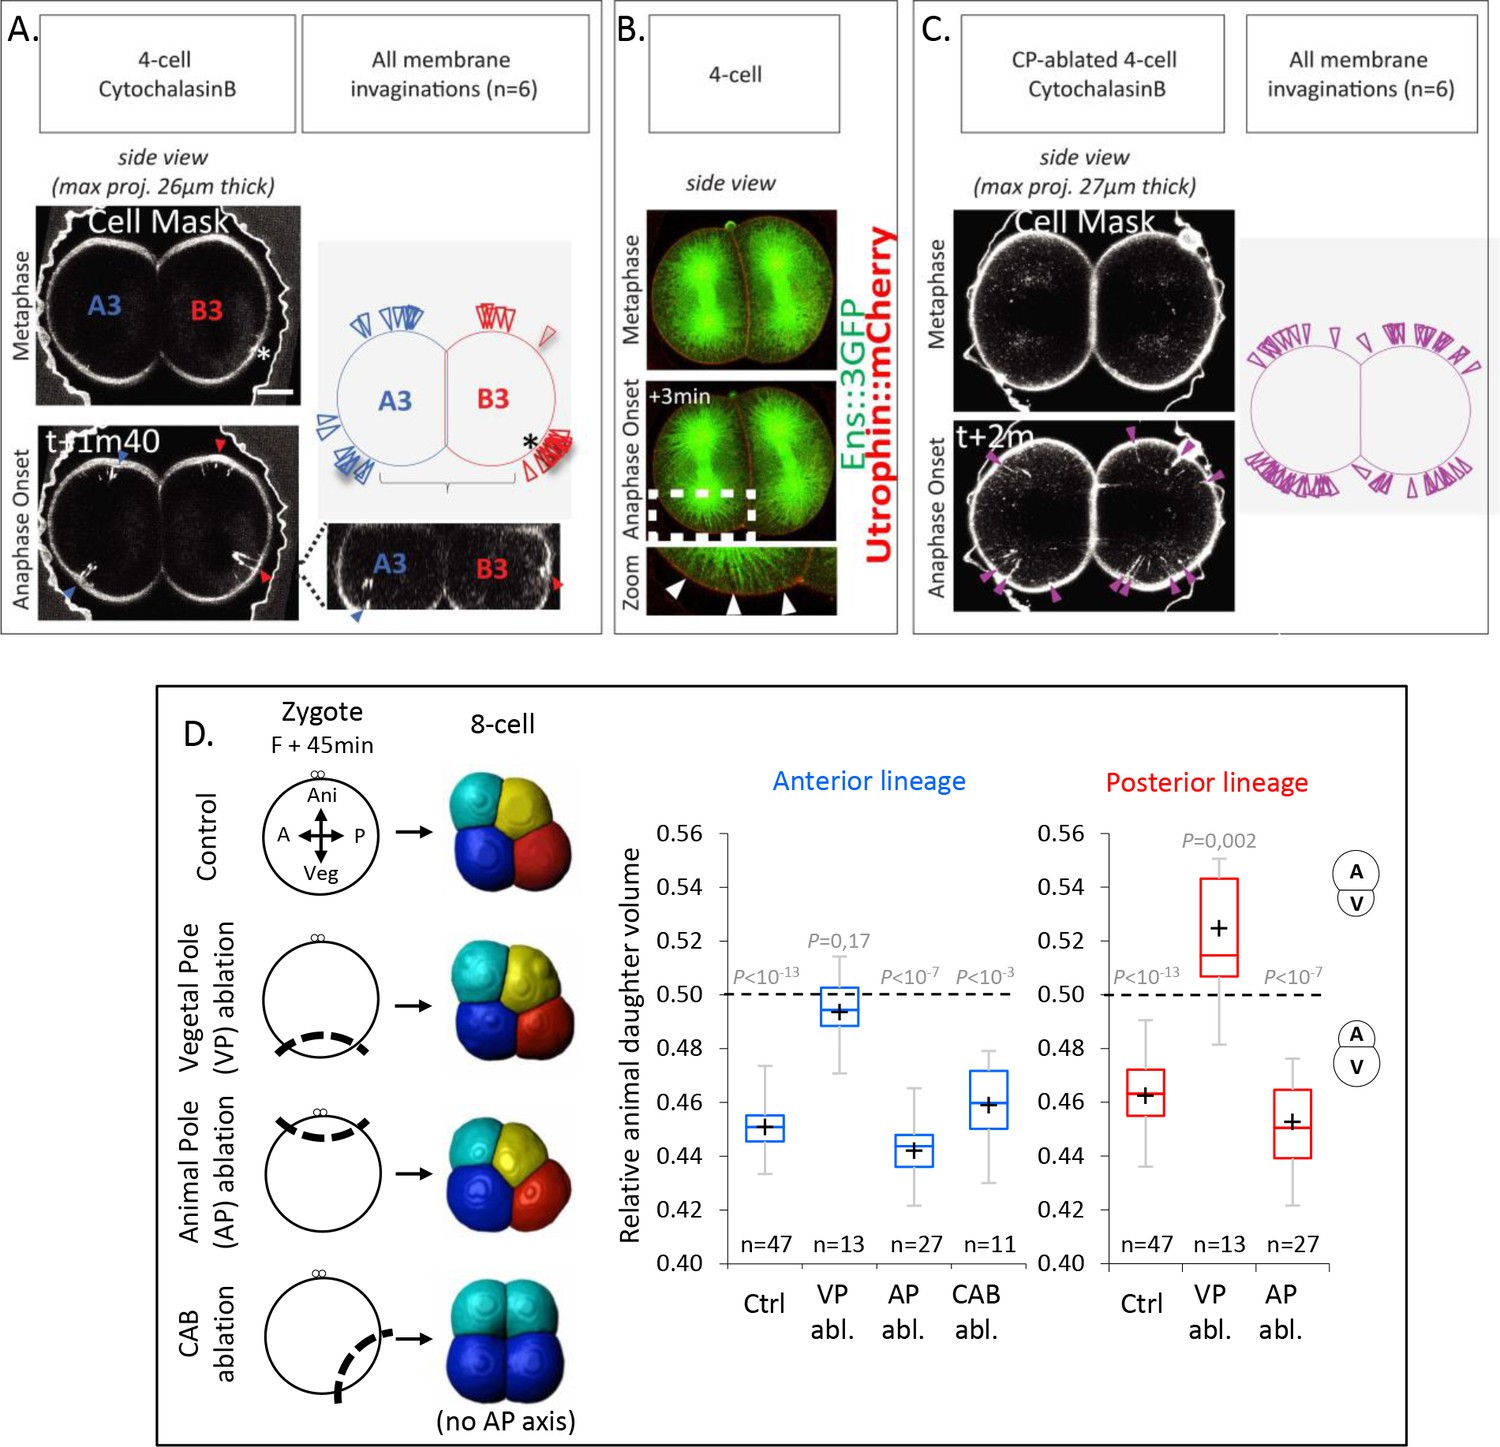
The vegetal cortex is a polarity domain lacking microtubule cortical pulling forces and is necessary for making larger vegetal blastomeres.
(A) Cortical pulling sites on astral microtubules at mitosis during the 4-cell stage observed as plasma membrane invaginations in embryos with a weakened cortex. Maximum projection (26 µm thick) of confocal images of 4-cell stage embryo in sagittal view (animal on top) during mitosis (left panel). Embryos were treated with cytochalasin (15 µM) from Nuclear Envelop Break Down to soften the cell cortex during mitosis and the plasma membrane is stained with CellMask deep red (at 1 µg/µl). Orthogonal section (bottom right) at the level indicated by the dashed lines showing the location of first invaginations at the site of centrosome-attracting-body (CAB) in B3 and in lateral position in A3. Schematic illustration summarizing all the membrane invaginations observed in six embryos (top right). The blue and red arrow heads indicate sites of membrane invaginations for the anterior blastomere A3 and the posterior blastomere B3, respectively. Asterisks show the CAB localization. Scale bar, 20 µm. (B) Astral microtubules reach the cortex at anaphase onset. Fluorescent confocal images of 4-cell stage embryo in sagittal view (anterior to the left and animal on top) in metaphase (top) and anaphase onset (middle) injected with Ensconsin::3xGFP (2 µg/µl, green) and Utrophin::mCherry (2 µg/µl, red) mRNAs. Enlarged view (bottom) corresponding to the area delineated by the dashed box where white arrow heads indicate astral microtubules contacting the cortex at the vegetal pole at anaphase onset. Scale bar, 20 µm. (C) Vegetal pole (VP)-ablated early zygotes (F + 15 min) were treated with Cytochalasin B (15 µM) from Nuclear Envelop Break Down to soften the cell cortex during mitosis, and the plasma membrane is stained with CellMask deep red (at 1 µg/µl). Invaginations at the 4-cell stage in a pair of blastomeres are displayed together with a schematic illustration summarizing all invaginations observed (n = 6). (D) Ablations of cell cortex at zygote stage and resulting blastomeres size at 8-cell stage. Schematic illustration (left panel) of the ablation performed at zygote stage after the second phase of ooplasmic segregation (animal on top) and the corresponding 8-cell stage visualized in 3D reconstruction in sagittal view (anterior to the left and animal on top). Plots of the ratio of animal daughter cell volume relative to total daughter cell volume for anterior lineage (in blue, middle) and posterior lineages (in red, right) at 8-cell stage measured from 3D reconstructions in control embryos and embryos with the VP (F + 45 min), or the animal pole (AP) ablated, or CAB ablated (center line, median; box limits, upper and lower quartiles; whiskers, min and max; cross, mean). The p values correspond to two-tailed paired Wilcoxon tests for comparisons of anterior or posterior lineages to 0.5 (equal division). Asterisks show the CAB localization.
Figure 4—figure supplement 1
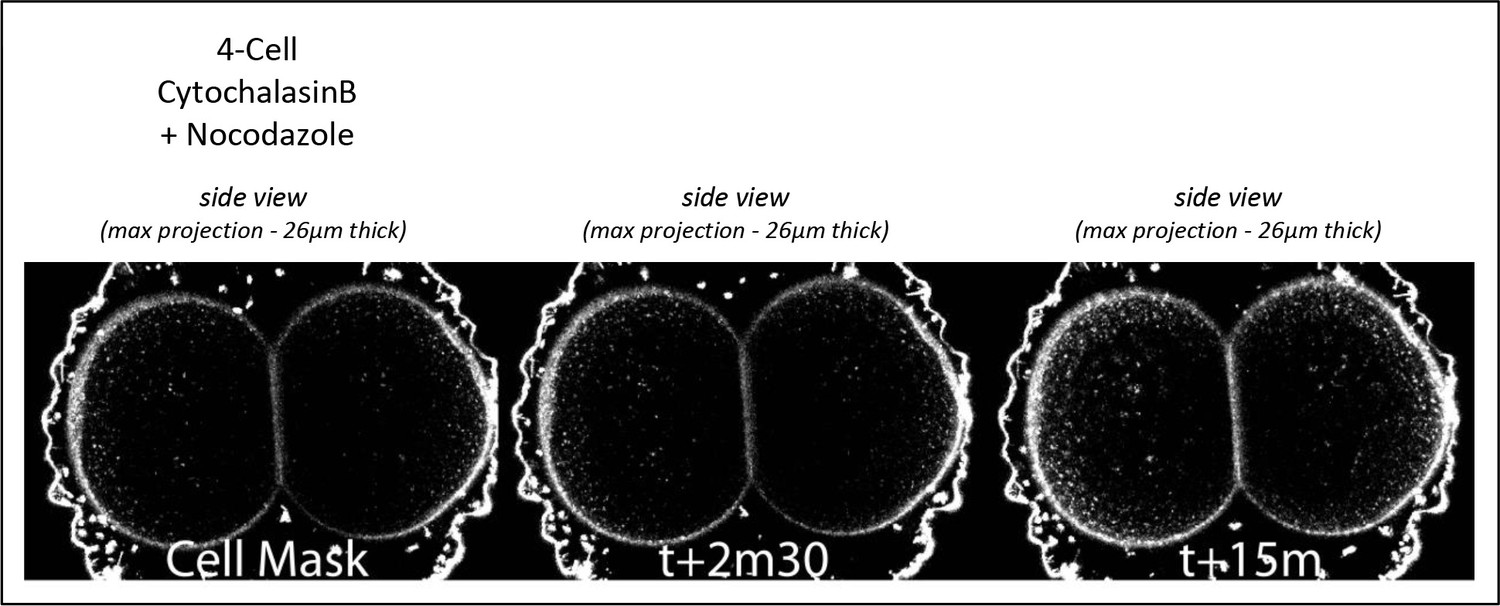
Membrane invaginations are abolished by depolymerizing microtubules.
Cortical pulling sites on astral microtubules at mitosis are abolished when microtubules are depolymerized during the 4-cell stage. Maximum projection (26µm thick) of confocal images of 4-cell stage embryo in sagittal view (animal on top) starting at mitotic entry. Embryos were treated with Cytochalasin B (15µM) and Nocodazole (10µM) from Nuclear Envelop Break Down to soften the cell cortex during mitosis, and the plasma membrane is stained with CellMask Deep Red (at 1µg/µl). Time is shown. n=8.
Figure 4—figure supplement 2
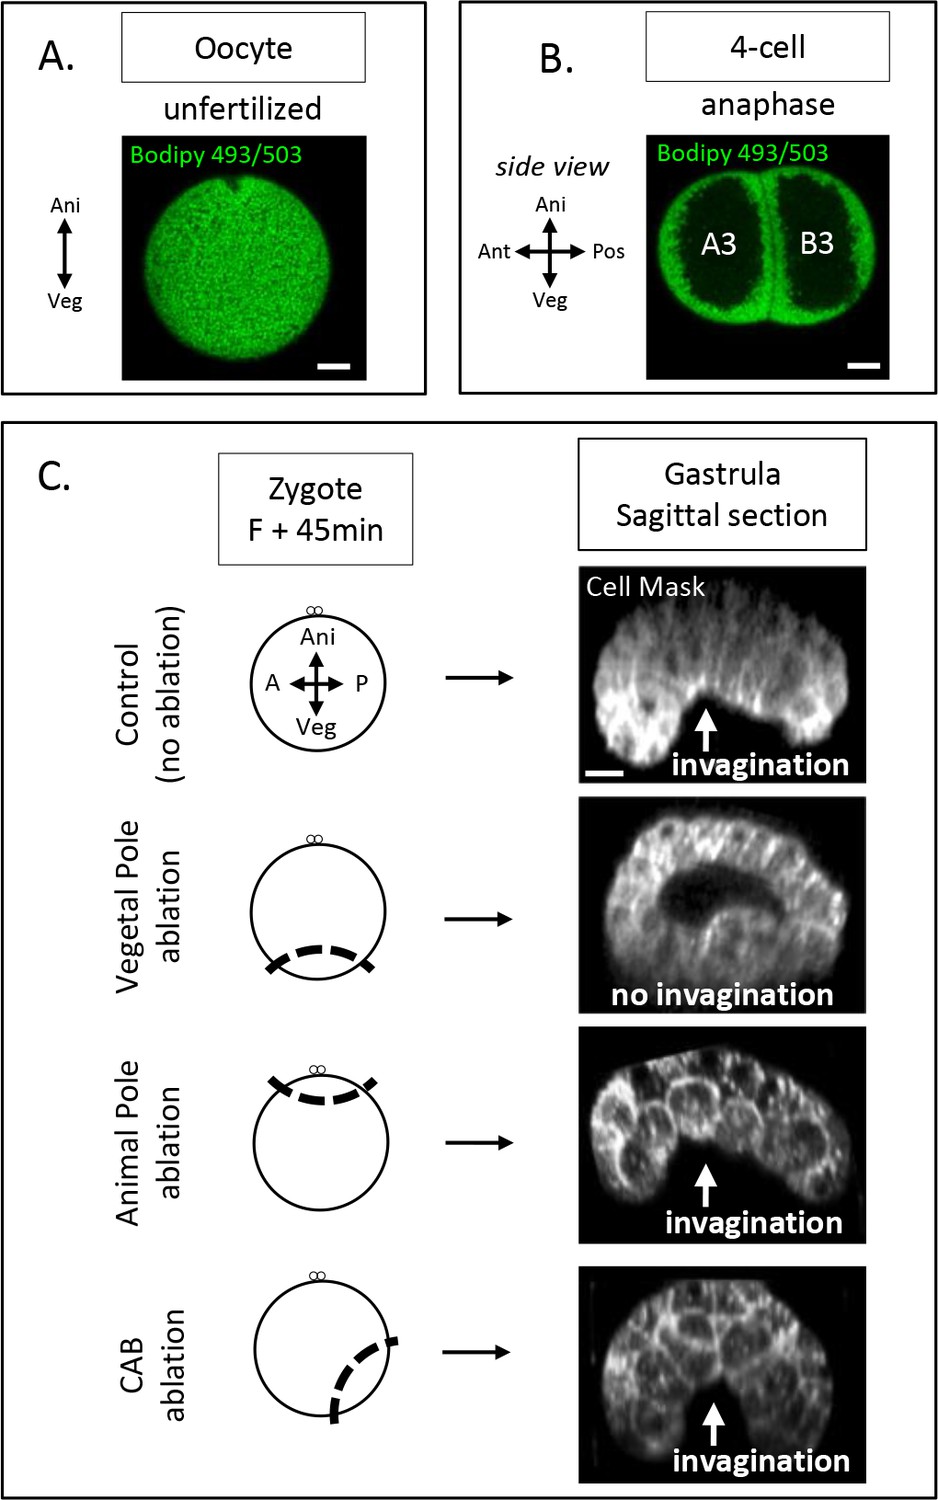
Yolk distribution in oocyte and 4-cell stage; gastrulation phenotypes after zygote microsurgeries.
(A) Confocal fluorescence image showing section across an oocyte (animal on top) with the yolk granules stained with Bodipy 493/503 (1µg/µl, green). Scale bars, 20µm. (B) Confocal fluorescence image showing sagittal section at 4-cell stage (animal on top) with the yolk granules stained with Bodipy 493/503 (1µg/µl, green). Scale bars, 20µm. (C) Schematic illustration (left panel) of the ablation performed at zygote stage after the second phase of ooplasmic segregation (animal on top) and the corresponding confocal fluorescence image of a sagittal section at the gastrula stage (right panel) with the plasma membrane stained with CellMask orange (at 1µg/µl, white). The white arrow indicates invagination of the endoderm at the vegetal pole. Scale bars, 20µm.
Figure 5 with 1 supplement
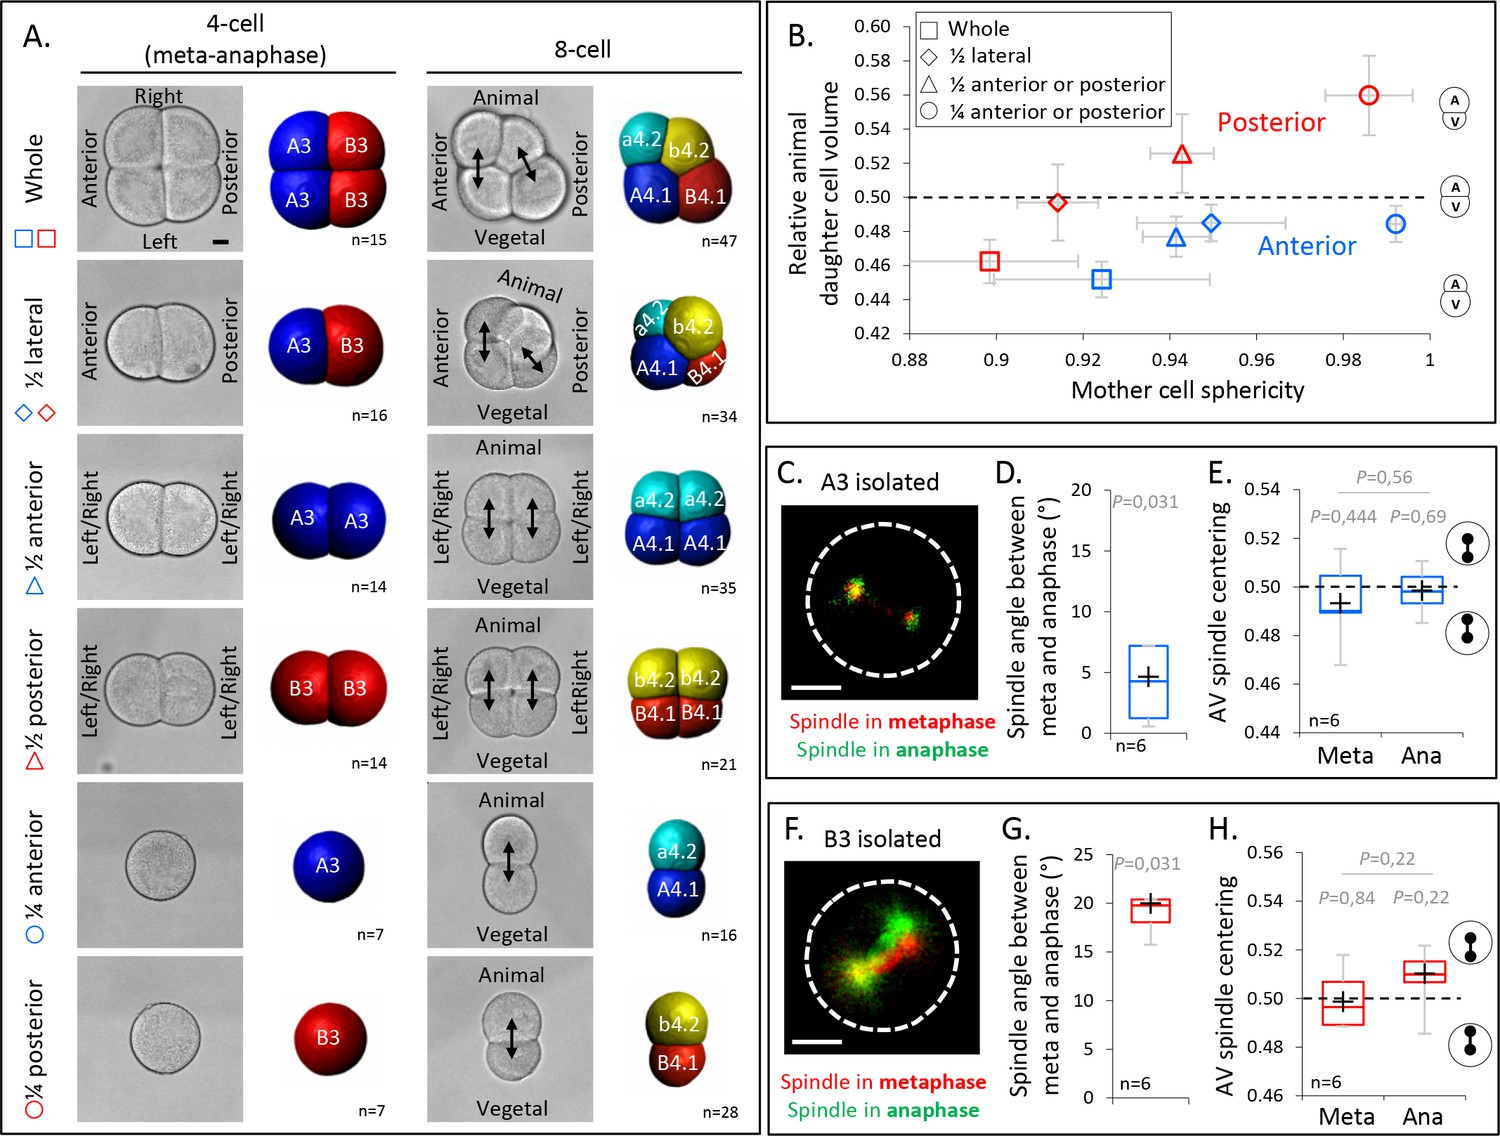
Decreasing cell shape anisotropy of the mitotic blastomeres changes the unequal cell divisions (UCDs).
(A) Left panel: brightfield images and corresponding 3D reconstruction (anterior blastomeres [A3] in blue, posterior blastomeres [B3] in red) of 4-cell stage embryos in mitosis either whole or after isolations of blastomeres (1/4) or pair of blastomeres (1/2). Right panel: brightfield images and corresponding 3D reconstruction at 8-cell stage (anterior blastomeres [a4.2, A4.1] in blue and cyan, posterior blastomeres [b4.2, B4.1] in red and yellow) either whole or after isolation of blastomeres (1/4) or pair of blastomeres (1/2). Isolations were performed at the 4-cell stage. Note that the whole embryo at 4-cell stage is oriented with an animal view whereas all other embryos are shown in side views. Scale bar, 20 µm. (B) Plot showing the ratio of animal daughter cell volume relative to total daughter cells volume at 8-cell stage as a function of their mother cell sphericity in mitosis for control embryos and isolated blastomeres (1/4) or pair of blastomeres (1/2) for anterior (blue) and posterior lineages (red). Error bars are standard deviation. (C) Fluorescence images of isolated anterior A3 blastomere previously injected with mRNAs coding for Ensconsin::3xGFP (2 µg/µl, green). The spindle is labeled in red and green for the time corresponding to metaphase and anaphase onset, respectively. (D) Plot of the angle between the spindle at metaphase and anaphase onset in isolated anterior A3 blastomeres. (C) Plot of the spindle centering along its axis (see Materials and methods for details) measured in isolated anterior A3 blastomere in metaphase and anaphase. 0.5 means centered spindle and above 0.5 means spindle off-centered toward the vegetal pole. (E) Fluorescence images of isolated posterior B3 blastomere previously injected with mRNAs coding for Ensconsin::3xGFP (2 µg/µl, green). The spindle is labeled in red and green for the time corresponding to metaphase and anaphase onset, respectively. (F) Plot of the angle between the spindle at metaphase and anaphase onset in isolated posterior B3 blastomeres. (C) Plot of the spindle centering along its axis (see Materials and methods for details) measured in isolated posterior B3 blastomere in metaphase and anaphase. 0.5 means centered spindle and above 0.5 means spindle off-centered toward the vegetal pole/centrosome-attracting-body (CAB). All the p values correspond to two-tailed paired Wilcoxon tests for comparisons to 0.5 (equal division) or for metaphase/anaphase comparisons. The box plots are built with center line, median; box limits, upper and lower quartiles; whiskers, min and max; cross, mean. Scale bar, 20 µm.
Figure 5—figure supplement 1
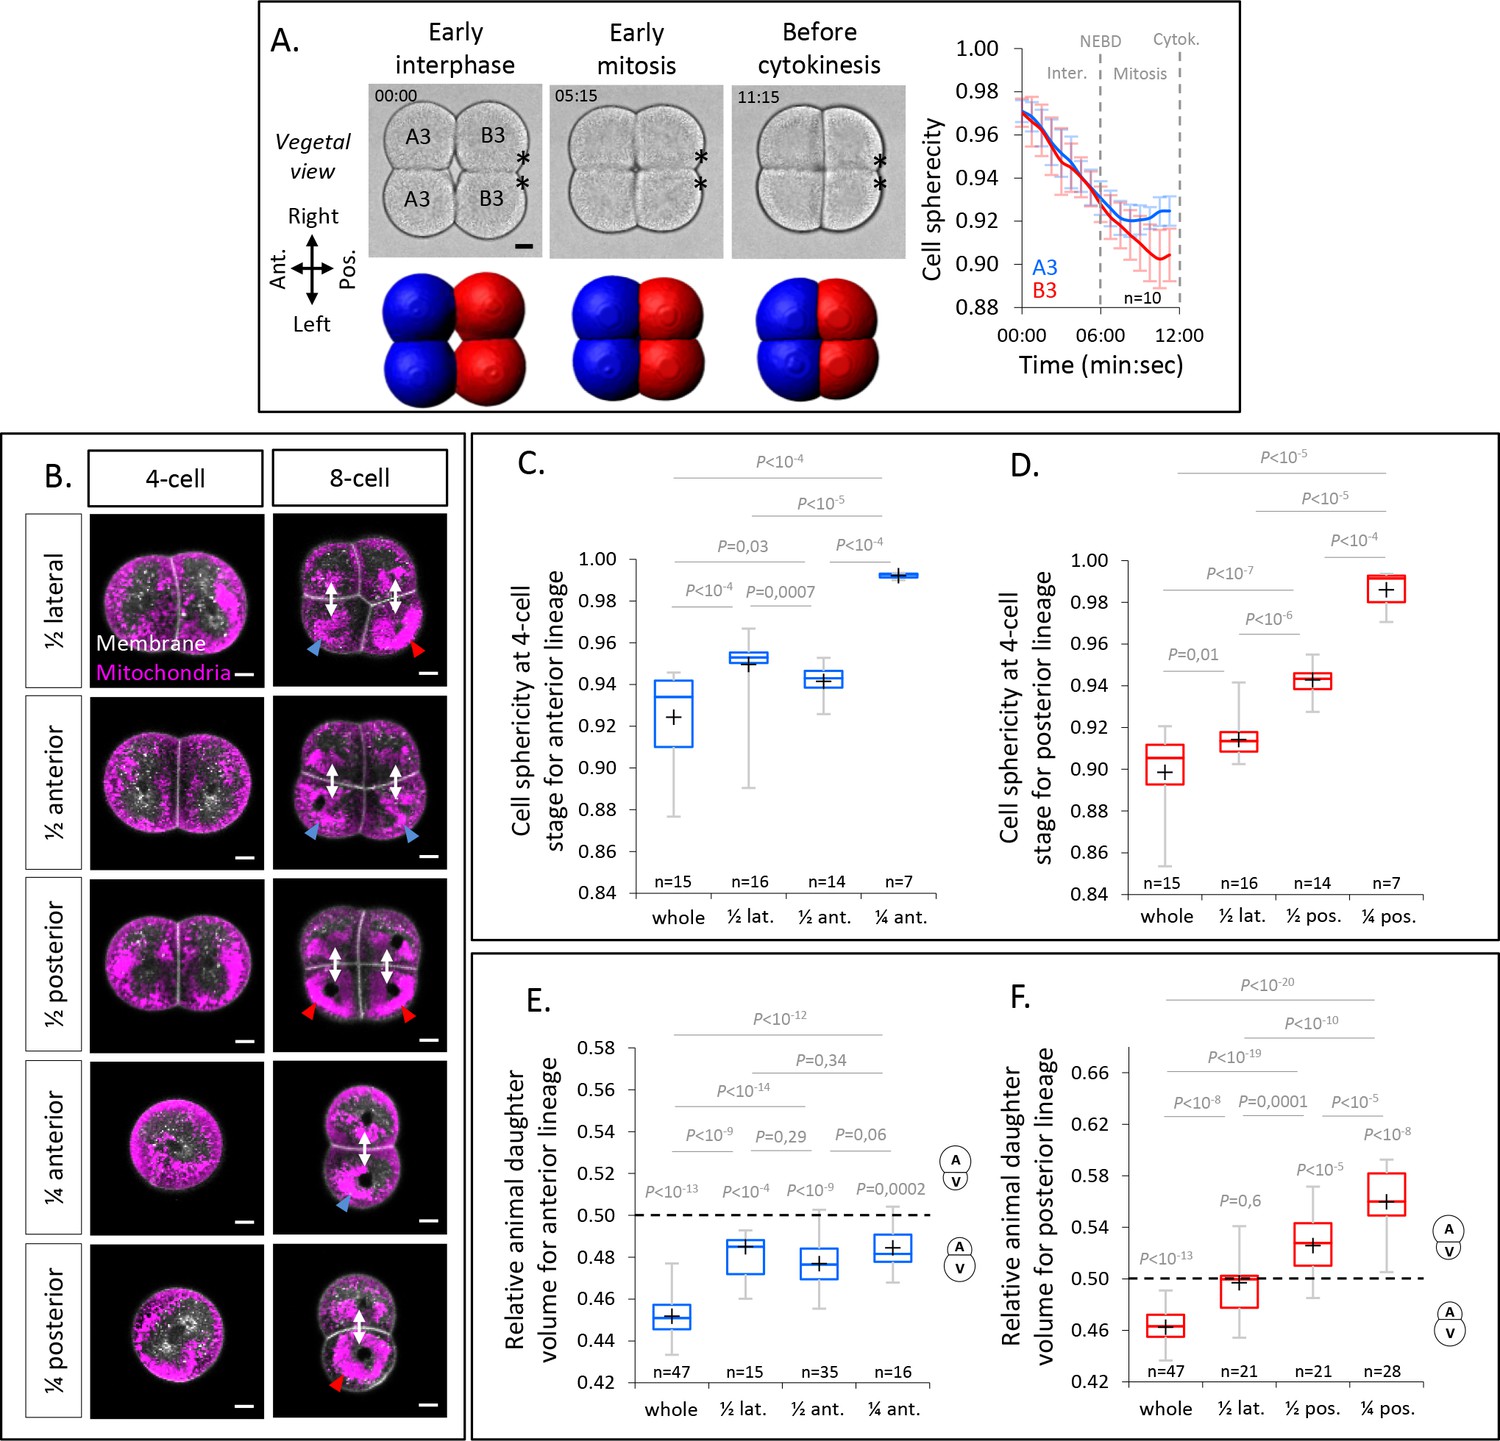
Cell sphericity during 4-cell stage; Blastomere identification and morphometric analysis of isolated blastomeres.
(A) Bright field images of vegetal view of an embryo during the 4-cell stage with anterior to the left (top left panel) and the corresponding 3D reconstructions with anterior blastomeres (A3) in blue and posterior blastomeres (B3) in red (bottom left panel). Plot (right panel) of the cell sphericity for the anterior blastomeres (blue) and posterior blastomeres (red) during the 4-cell stage. Error bars are standard deviation. NEBD, Nuclear Envelop Break Down. Asterisks mark the CAB. (B) Confocal optical section in isolated blastomeres or pair of blastomeres with the mitochondria stained with Mitotracker deep red (at 1µg/µl, magenta) and the plasma membrane with Cell Mask orange (at 1µg/µl, white) at 4-cell stage and after the cell division at 8-cell stage. The blue and red arrowheads at 8-cell stage show the highest mitochondria concentration in the vegetal blastomere in anterior and posterior lineages respectively. (C) Plot of the blastomere sphericity in control (whole) embryo and after blastomere isolations in the anterior lineage. The P values correspond to two-tailed unpaired Mann-Whitney test. (D) Plot of the blastomere sphericity in control (whole) embryo and after blastomere isolations in the posterior lineage. The P values correspond to two-tailed unpaired Mann-Whitney test. (E) Plot of the relative animal daughter cell volume to total daughter cell volume in control (whole) embryo and after blastomere isolations in the anterior lineage. The P values correspond to two-tailed paired Wilcoxon tests for comparisons to 0.5 (equal division) and two-tailed unpaired Mann-Whitney test to compare the different conditions between each other. (F) Plot of the relative animal daughter cell volume to total daughter cell volume in control (whole) embryo and after blastomere isolations in the posterior lineage. The P values correspond to two-tailed paired Wilcoxon tests for comparisons to 0.5 (equal division) and two-tailed unpaired Mann-Whitney test to compare the different conditions between each other. Scale bars, 20µm.
Figure 6
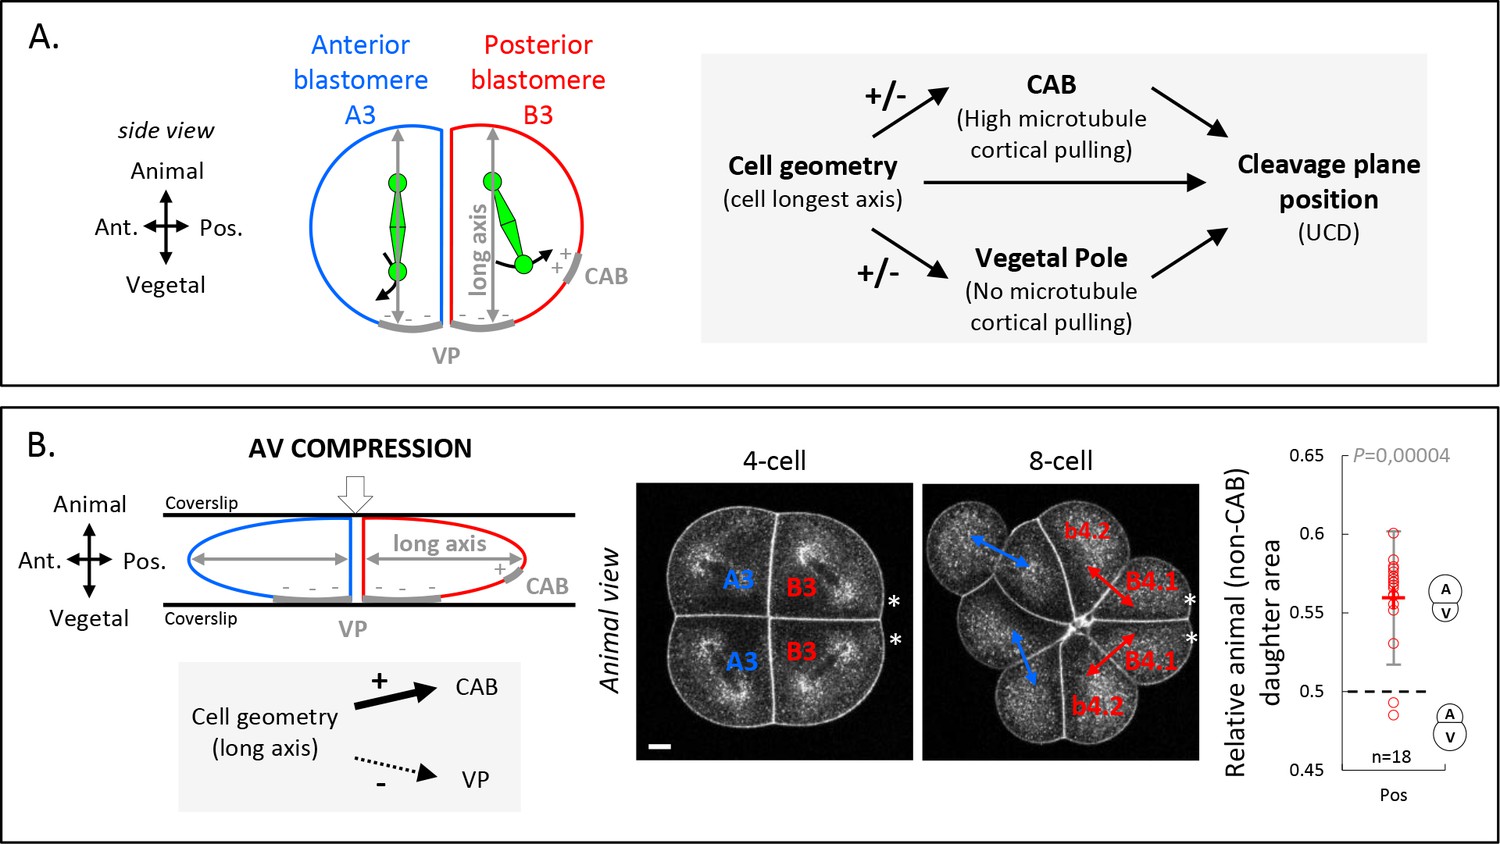
Anisotropic cell shape influences the spindle interaction with polarity domains and together determines the orientation of unequal cell division (UCD).
(A) Schematic illustration (left panel) of a 4-cell stage embryo in sagittal view (anterior to the left, animal on top) showing the spindle interaction with the different cortical polarity domains. Illustration of the cleavage plane positioning mechanism (right panel) where the cleavage plane position is a result of the interplay between cell geometry, the posterior centrosome-attracting-body (CAB) polarity domain, and the vegetal pole (VP) polarity domain. (B) Animal-vegetal (AV) compression of 4-cell stage embryo. Schematic illustration a 4-cell stage embryo in sagittal view with an AV compression (top left panel) to bring the long axis of the cell toward the CAB and away from the vegetal pole domain (bottom left panel). Optical confocal section of anteroposterior compressed embryo (middle panel) at 4-cell stage anaphase and at 8-cell stage with membrane stained with CellMask orange (at 1 µg/µl). Plot of the relative animal daughter cell area (right) for posterior lineages at 8-cell stage in AV compressed embryos (center line, median; box limits, upper and lower quartiles; whiskers, min and max; cross, mean). The p values correspond to two-tailed paired Wilcoxon tests for comparisons to 0.5 (equal division). Asterisks show the CAB localization. Scale bar, 20 µm. n = 18.
Additional files
Download links
A two-part list of links to download the article, or parts of the article, in various formats.
Downloads (link to download the article as PDF)
Open citations (links to open the citations from this article in various online reference manager services)
Cite this article (links to download the citations from this article in formats compatible with various reference manager tools)
Combined effect of cell geometry and polarity domains determines the orientation of unequal division
eLife 10:e75639.
https://doi.org/10.7554/eLife.75639


