Tom70-based transcriptional regulation of mitochondrial biogenesis and aging
- Buck Institute for Research on Aging, United States
- Healthy Longevity Programme, Yong Loo Lin School of Medicine, National University of Singapore, Singapore
- Centre for Healthy Longevity, National University Health System, Singapore
- Singapore Institute of Clinical Sciences, A(∗)STAR, Singapore
- USC Leonard Davis School of Gerontology, University of Southern California, United States
Figures
Figure 1 with 1 supplement
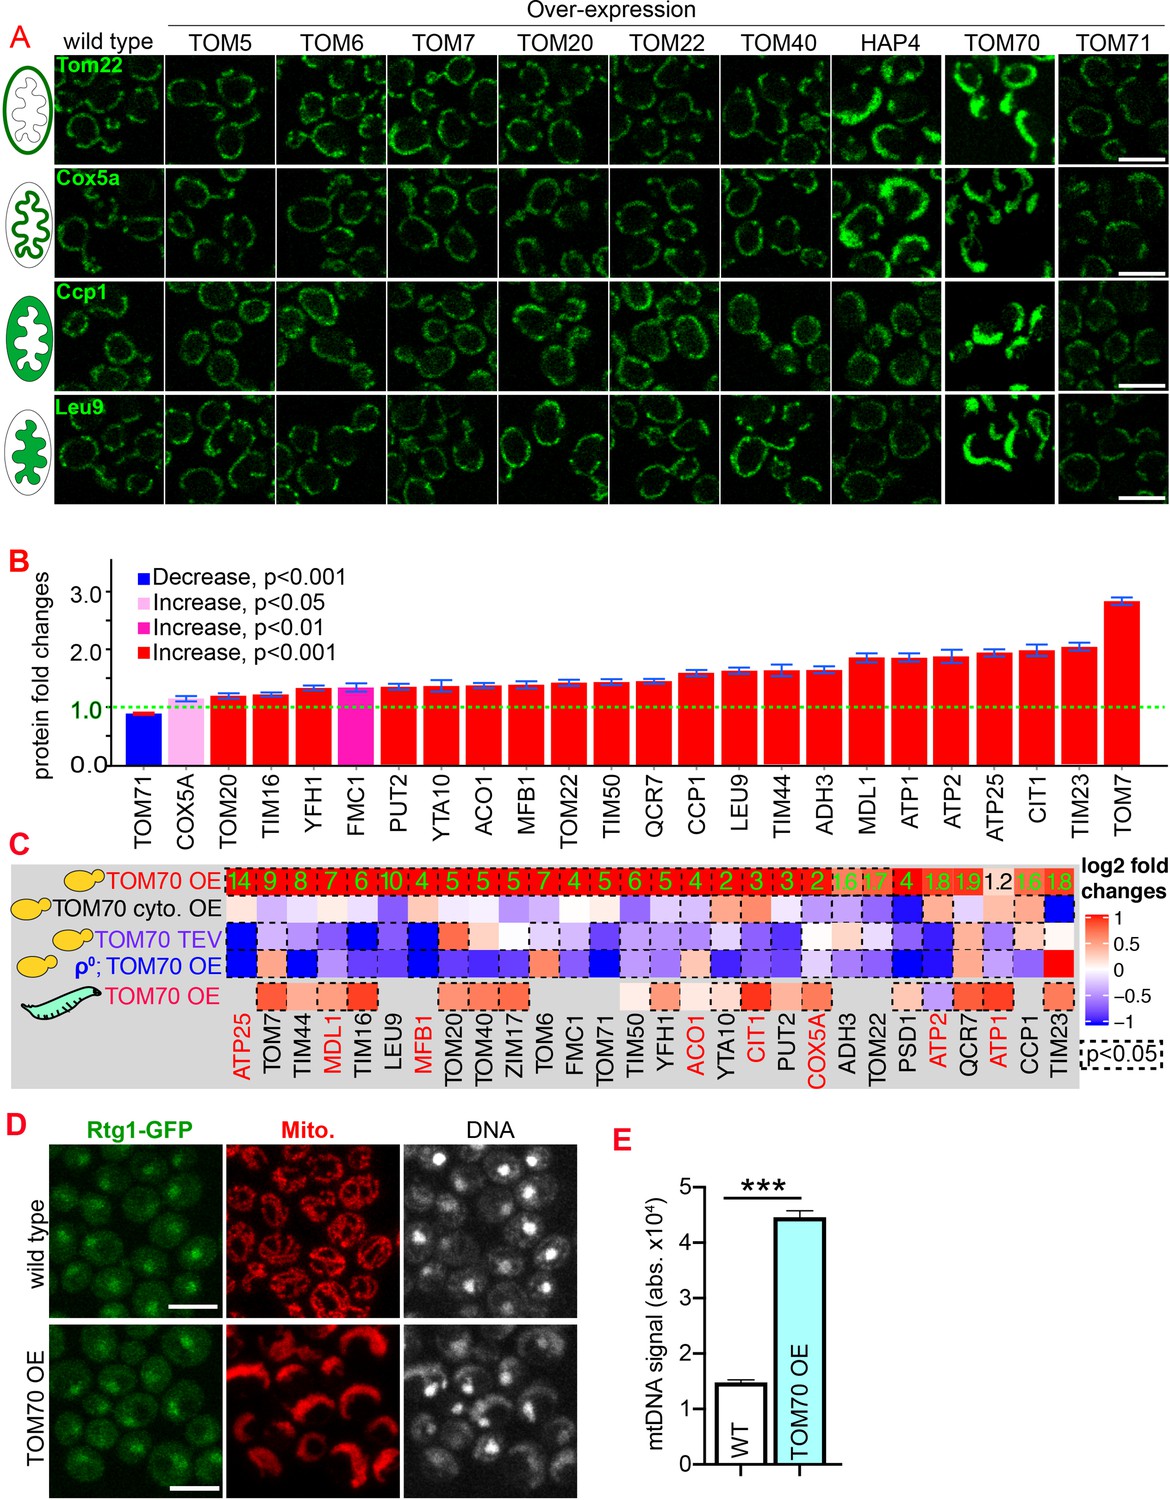
Tom70 regulates the transcriptional activity of mitochondrial proteins.
(A) Representative images for proteins localized to different sub-compartments of mitochondria in cells overexpressing (OE) different TOM proteins and HAP4 from pGal promoter. HAP4 OE increased the biogenesis of some, but not all, mitochondrial proteins. Mitochondrial proteins were visualized by endogenous C-terminal GFP tagging and expressed from their native promoters. As both wild type and OE strains were cultured in the same medium, the mitochondrial biogenesis effect of TOM70 OE and HAP4 OE is not due to the presence of galactose. (B) Quantification of mitochondrial protein levels in TOM70 OE cells normalized to wild-type cells cultured in the same medium. Mitochondrial proteins were visualized and quantified by endogenous C-terminal GFP tagging. These mitochondrial proteins were randomly chosen from the yeast GFP library based on their localization in mitochondria to represent all four sub-compartments of mitochondria. Bar graphs are the normalized mean and s.e.m. Data were analyzed with unpaired two-tailed t test. (C) RT-qPCR quantification of the mRNA abundance for different mitochondrial proteins in yeast and fruit fly strains with different levels of mitochondrial Tom70. TOM70 cyto. OE, overexpression of Tom70 cytosolic domain without transmembrane domain; TOM70 OE, TOM70 overexpression; TOM70 TEV, the cytosolic domain of Tom70 was removed by TEV protease.ρ0, petite cells without mtDNA. For yeast, cells with the same genetic background but lacking TOM70 TEV or TOM70 OE were used as control. For example, mRNA from ρ0/TOM70 OE cells were normalized to ρ0 cells lacking TOM70 OE. All different yeast strains, including the controls, were cultured in the same galactose medium. For fruit fly, 3rd instar larvae from control (UAS-TOM70) and TOM70 OE (Mef2-Gal4; UAS-TOM70) were used to extract mRNA from the whole animal. The mRNA abundance from each strain was normalized to control and the average fold changes from three replicates are shown. Only conserved orthologous genes from fly are included (https://www.alliancegenome.org/). Validated substrates of Tom70 are colored in red text (Backes et al., 2018; Kondo-Okamoto and Shaw, 2008; Melin et al., 2015; Yamamoto et al., 2009; Young, 2003). Dash line boxes indicate the ones with p < 0.05 from unpaired two-tailed t test. The inserted green numbers are fold changes of each protein in TOM70 OE cells. (D) Representative images of Rtg1-GFP in control and TOM70 OE cells. Rtg1-GFP, endogenous C-terminal GFP tagging of Rtg1. DNA was stained with Hoechst dye. All different yeast strains were cultured in the same galactose medium. (E) Quantification of mtDNA abundance from Hoechst staining in (D). 1116 and 1090 cells quantified for each. Data were analyzed with unpaired two-tailed t test: ***, p < 0.001. Scale bar for all images: 5 μm. Images are representative of at least two independent experiments. Sample sizes in B are given in Supplementary file 4.
Figure 1—figure supplement 1
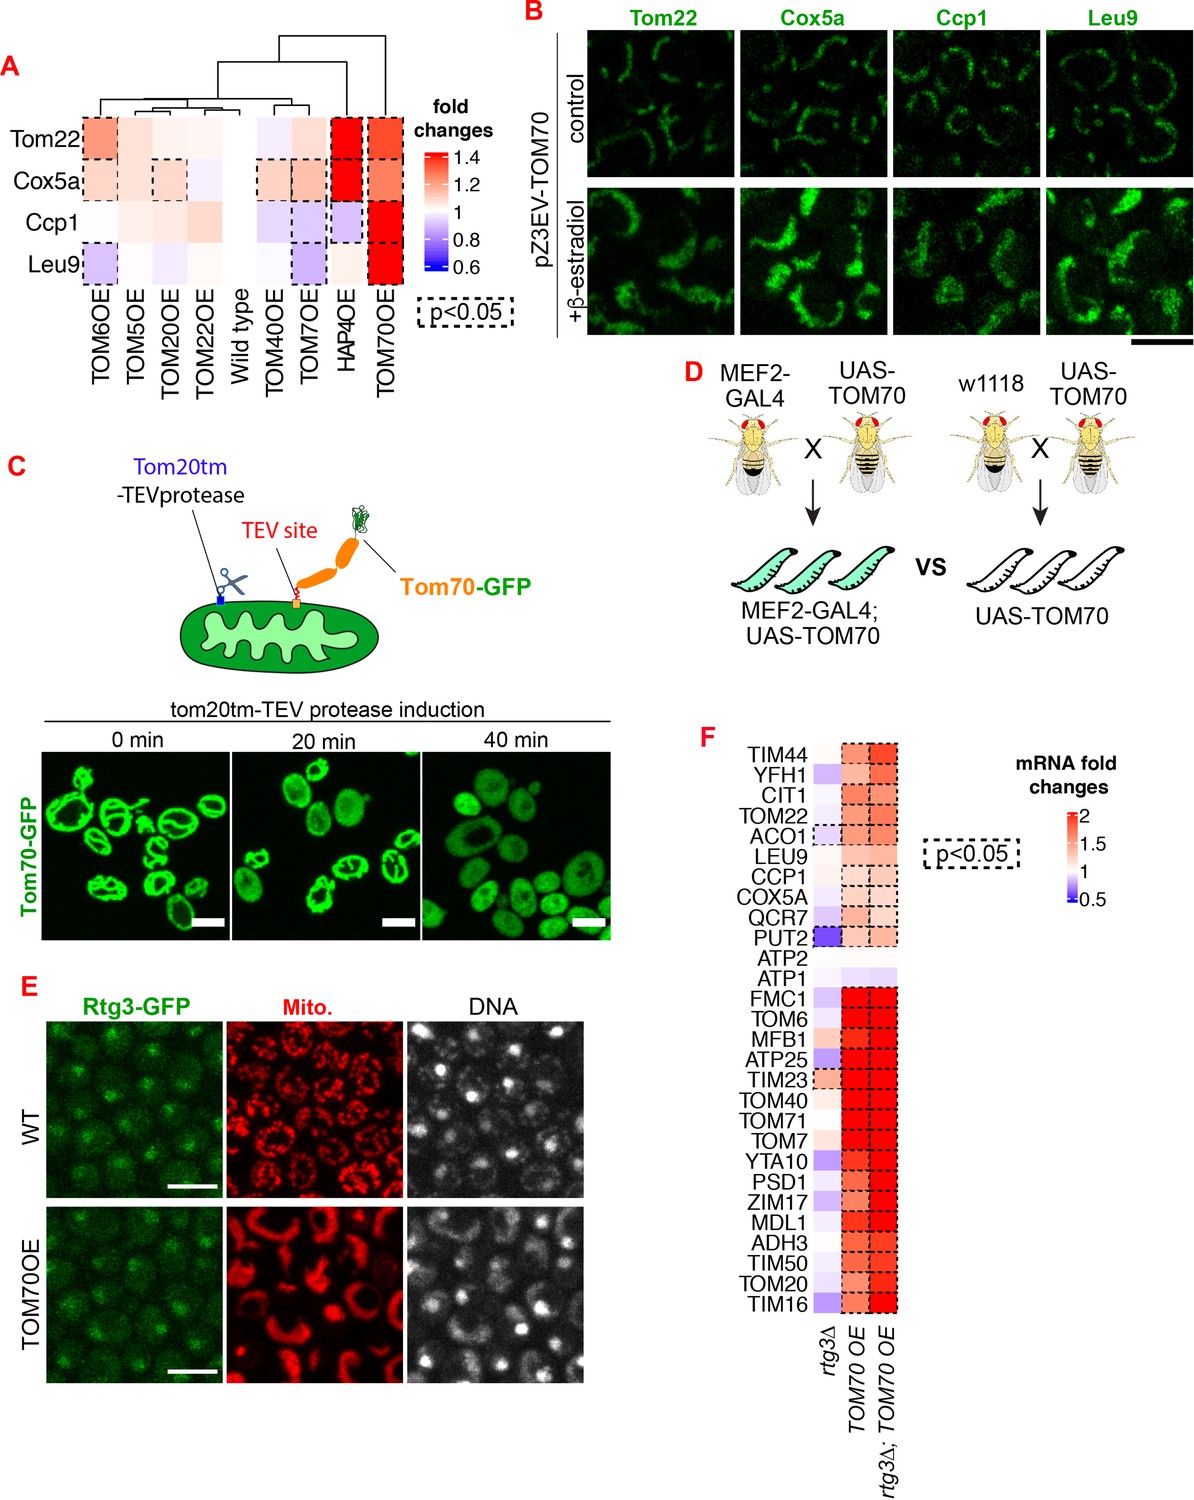
Additional data demonstrating that Tom70 regulates the transcription of mitochondrial proteins.
(A) Quantification of Figure 1A. Dash line boxes indicate the ones with p < 0.05 from unpaired two-tailed t test. (B) Representative images for proteins localized to different sub-compartments of mitochondria in cells overexpressing Tom70 from pZ3EV promoter. Mitochondrial proteins were visualized by endogenous C-terminal GFP tagging and expressed from their native promoters. Cells were cultured in 2% raffinose and switched to 2% glucose and added 10nMβ-estradiol to induce the Tom70 expression for 5 hr. (C) Cleavage of Tom70-GFP that contains a TEV site between transmembrane and cytosolic domain by TEV protease. TEV protease was fused to Tom20 transmembrane domain (Tom20tm) and expressed from a Gal promoter. Expression of TEV protease was induced and the localization of Tom70-GFP was monitored at different timepoints. (D) The genetic cross to generate 3rd instar larvae from control (UAS-TOM70) and TOM70 OE (MEF2-GAL4; UAS-TOM70). (E) Representative images of Rtg3-GFP in control and TOM70 OE cells. Rtg3-GFP, endogenous C-terminal GFP tagging of Rtg3. DNA was stained with Hoechst dye. All different yeast strains, including wild type control, were cultured in the same medium. (F) RT-qPCR quantification of different mitochondrial mRNA in wild type and rtg3∆ cells that overexpress TOM70. The mRNA abundance was normalized to wild type control and the fold changes from three biological replicates are shown. Dash line boxes indicate the ones with p < 0.05 from unpaired two-tailed t test. Scale bar for all images: 5 μm. Mitochondrial proteins were visualized by endogenous C-terminal GFP tagging and expressed from their own promoters. Images are representative of at least two independent experiments.
Figure 2 with 1 supplement
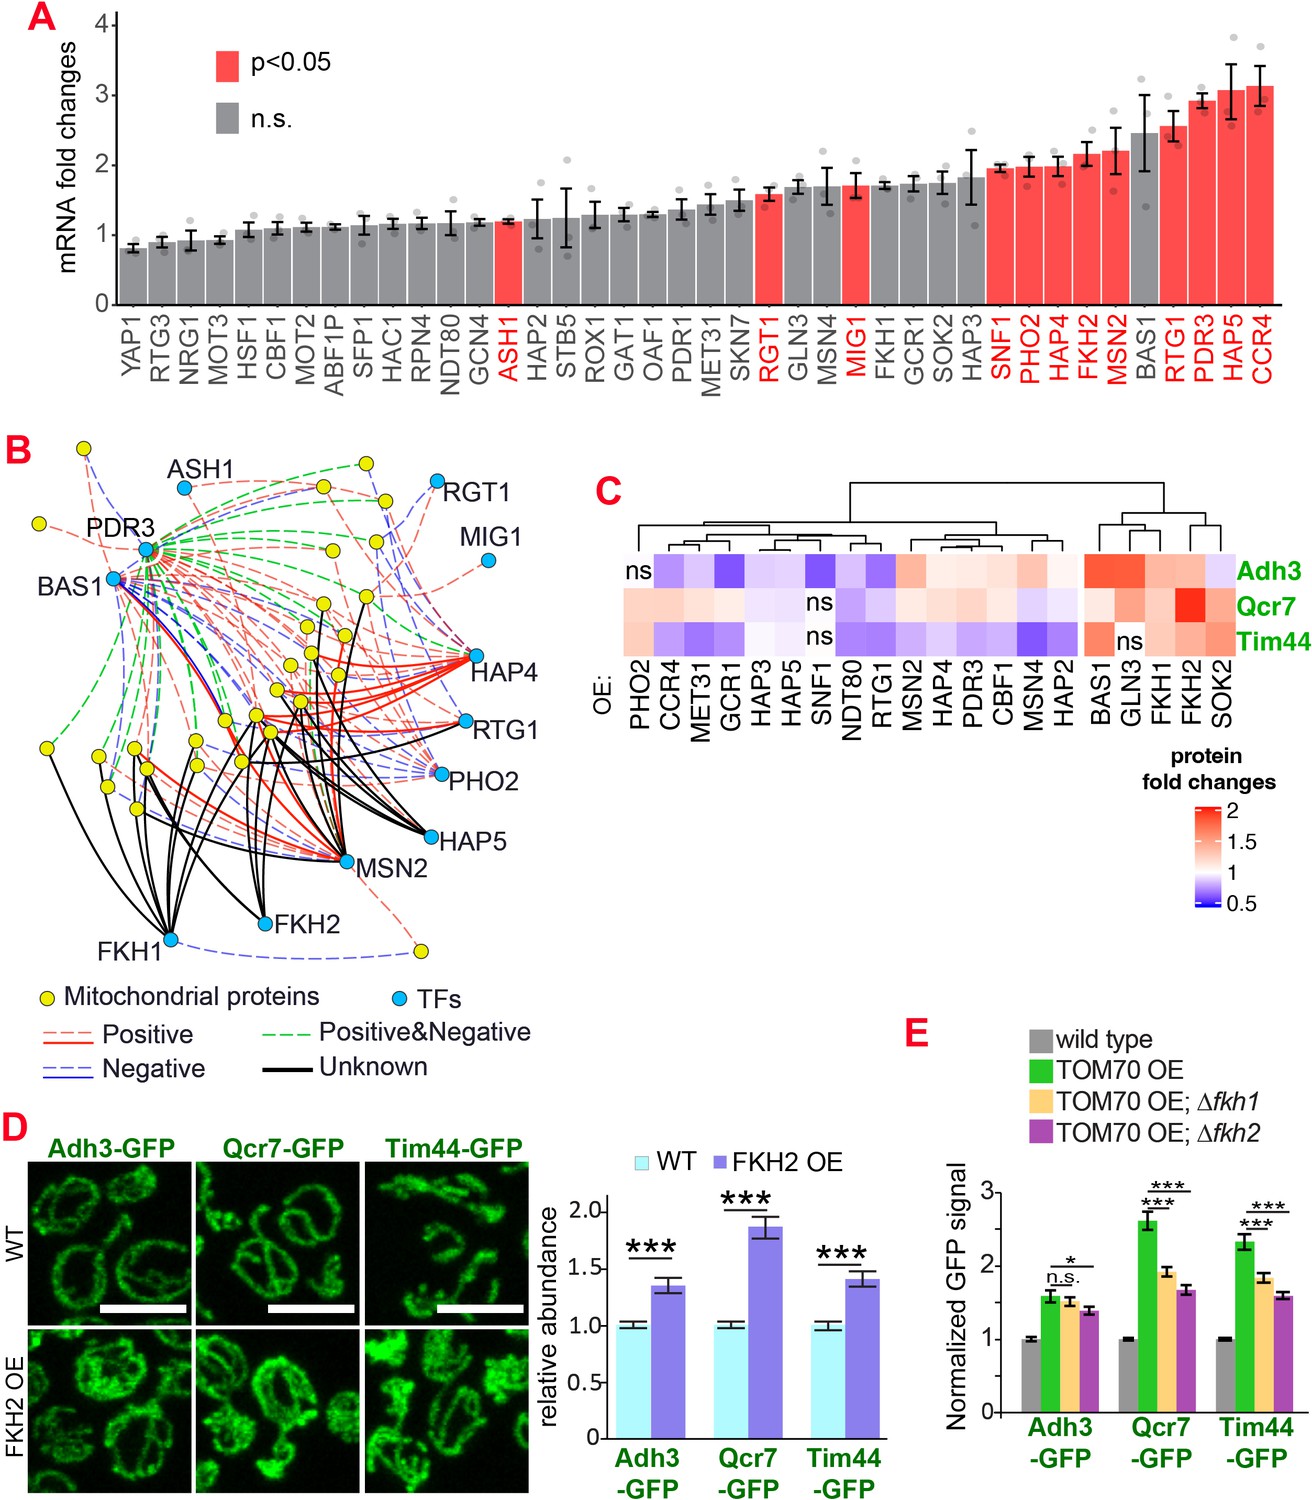
The transcription factors involved in the Tom70-dependent transcriptional regulation of mitochondrial proteins.
(A) mRNA abundance of different transcription factors (TF) quantified by RT-qPCR in TOM70 OE strain and normalized to control cells. All different yeast strains, including wild-type control, were cultured in the same medium. Shown are the mean and s.e.m. from three replicates. (B) TF regulatory network predicted for these mitochondrial proteins tested in Figure 1B (Monteiro et al., 2020). Only the TFs that increase significantly in (A) is included to simplify the illustration. The positive and negative regulations from existing literature are shown with red and blue lines, respectively; green lines represent the ones have both positive and negative effects. Solid lines represent the DNA binding evidence and the dash lines for co-expression evidence. The predicted regulations based on the consensus sequences but have no previous experimental data are shown as black lines. (C) Expression changes of mitochondrial proteins from different sub-compartments upon overexpression of different TFs. The GFP signal of Adh3-GFP, Qcr7-GFP, and Tim44-GFP were quantified from TF OE cells and normalized to wild type control of each protein. p < 0.05 for all of them except for four that labeled as ‘ns’. Data were analyzed with unpaired two-tailed t test. Both control and TOM70 OE strains were cultured in SC-raffinose medium and added 2% galactose for 5 hr before sample collection. (D) Representative images and quantification of different mitochondrial proteins in wild type and FKH2 OE strain. All different yeast strains were cultured in the same medium. (E) FKH1 and FKH2 are partially required for the mitochondria biogenesis program downstream of TOM70 OE. GFP signal of mitochondrial proteins were quantified in different strains and normalized to wild type. Scale bar for all images: 5 μm. Mitochondrial proteins were visualized by endogenous C-terminal GFP tagging and expressed from their own promoters. Images are representative of at least two independent experiments. Bar graphs are the normalized mean and s.e.m. Data were analyzed with unpaired two-tailed t test: ***, p < 0.001; *, p < 0.05; n.s., not significant. Sample sizes in (D, E) are given in Supplementary file 4.
Figure 2—figure supplement 1

ROS is partially required for the mitochondrial biogenesis program downstream of TOM70 OE.
GFP signal of mitochondrial proteins were quantified in different strains and normalized to wild type control. Mitochondrial proteins were visualized by endogenous C-terminal GFP tagging and expressed from their own promoters. Data were analyzed with unpaired two-tailed t test: ***, p < 0.001; *, p < 0.05; n.s., not significant. Sample sizes are given in Supplementary file 4.
Figure 3 with 1 supplement

Tom70 regulates the abundance of mtDNA.
(A, B) Representative images and quantification of mtDNA in wild type and ∆tom70 cells were stained by Hoechst dye. Yellow arrowheads point to the mtDNA. Bar graph are the mean and s.e.m. from 87 and 109 cells. (C) iMTS probability profiles of Mip1 and Hsp60 predicted by TargetP algorithm. The consecutively N-terminally truncated sequences of the proteins were used as input to calculate the TargetP scores for each residue, which shows internal regions with presequence-like properties, or iMTS. Hsp60, another mitochondrial protein does not depend on Tom70, was also plotted in the same way for comparison (Backes et al., 2018). Red line (0.4) indicates the cutoff defined in previous study (Backes et al., 2018). Blue and red arrows indicate the N-terminal signal peptide and iMTS, respectively. (D) Representative images and quantification of Mip1-GFP in control and TOM70 OE cells. Bar graphs are the mean and s.e.m. from 300 and 438 cells. (E) Quantification of mtDNA in control and MIP1 OE cells from Hoechst staining. Bar graphs are the mean and s.e.m. from 253 and 209 cells. Scale bar for all images: 5 μm. Images are representative of at least two independent experiments.Bar graphs are the normalized mean and s.e.m. Data were analyzed with unpaired two-tailed t test: ***, p < 0.001.
Figure 3—figure supplement 1

The role of mtDNA metabolisms in Tom70’s regulatory function of mitochondrial biogenesis.
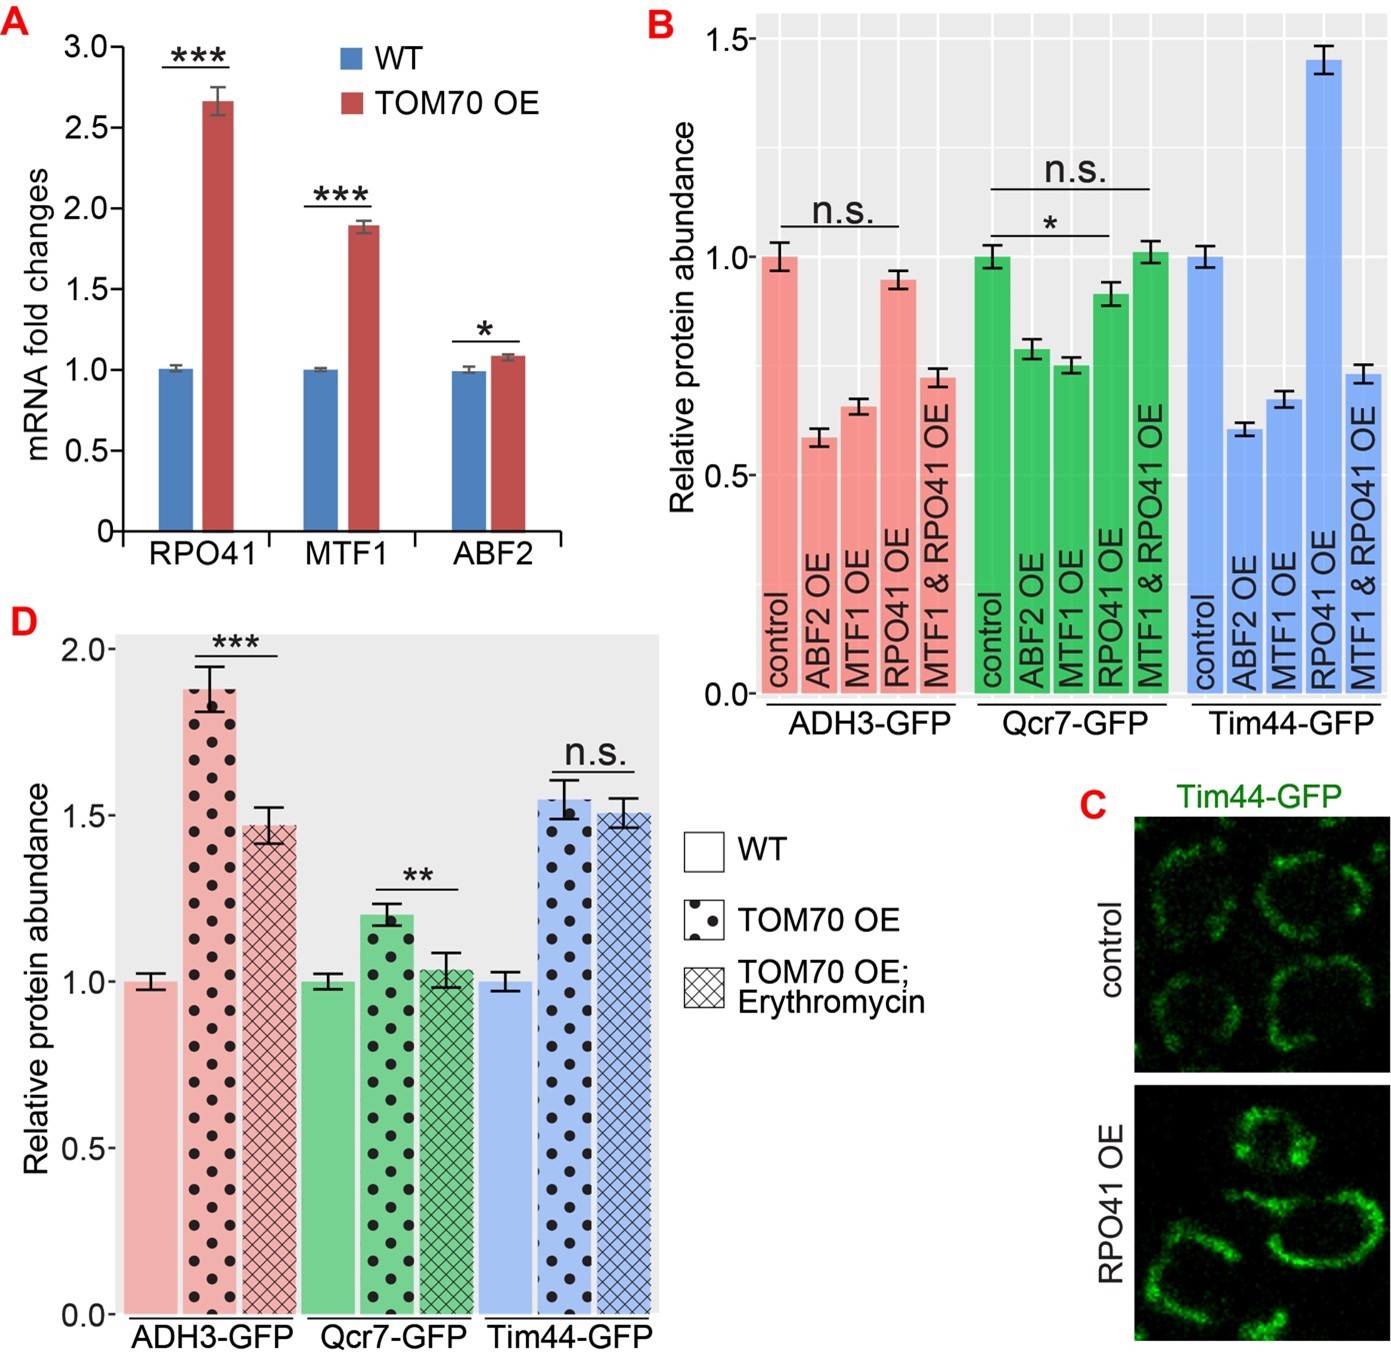
(A) mRNA abundance of basic mitochondrial transcription machineries quantified by RT-qPCR in TOM70 OE strain and normalized to control cells. All different yeast strains, including wild-type control, were cultured in the same medium. Shown are the mean and s.e.m. from three replicates. (B, C) Quantification (B) of different mitochondrial proteins in wild type control strain and other strains overexpressing different mitochondrial transcription machineries. All different yeast strains were cultured in the same medium. Only RPO41 OE increased Tim44-GFP expression among these strains. In fact, most of these overexpressing strains have reduced abundance of mitochondrial proteins , and the mitochondrial morphology in RPO41 OE cells (C) was different from TOM70 OE (Figure 1A), suggesting that these mitochondrial transcription machineries are not downstream of TOM70 OE. (D) Quantification of different mitochondrial proteins in wild type control strain and TOM70 OE strains with/without Erythromycin (2 mg/ml) treatment 30 min before and during galactose induced TOM70 OE. All different yeast strains were cultured in the same growth medium. Inhibition of mitochondrial translation by Erythromycin partially inhibit some mitochondrial biogenesis induced by TOM70 OE. Data were analyzed with unpaired two-tailed t test: ***, p < 0.001; *, p < 0.05; n.s., not significant. Sample sizes are given in Supplementary file 4.
Figure 4 with 1 supplement
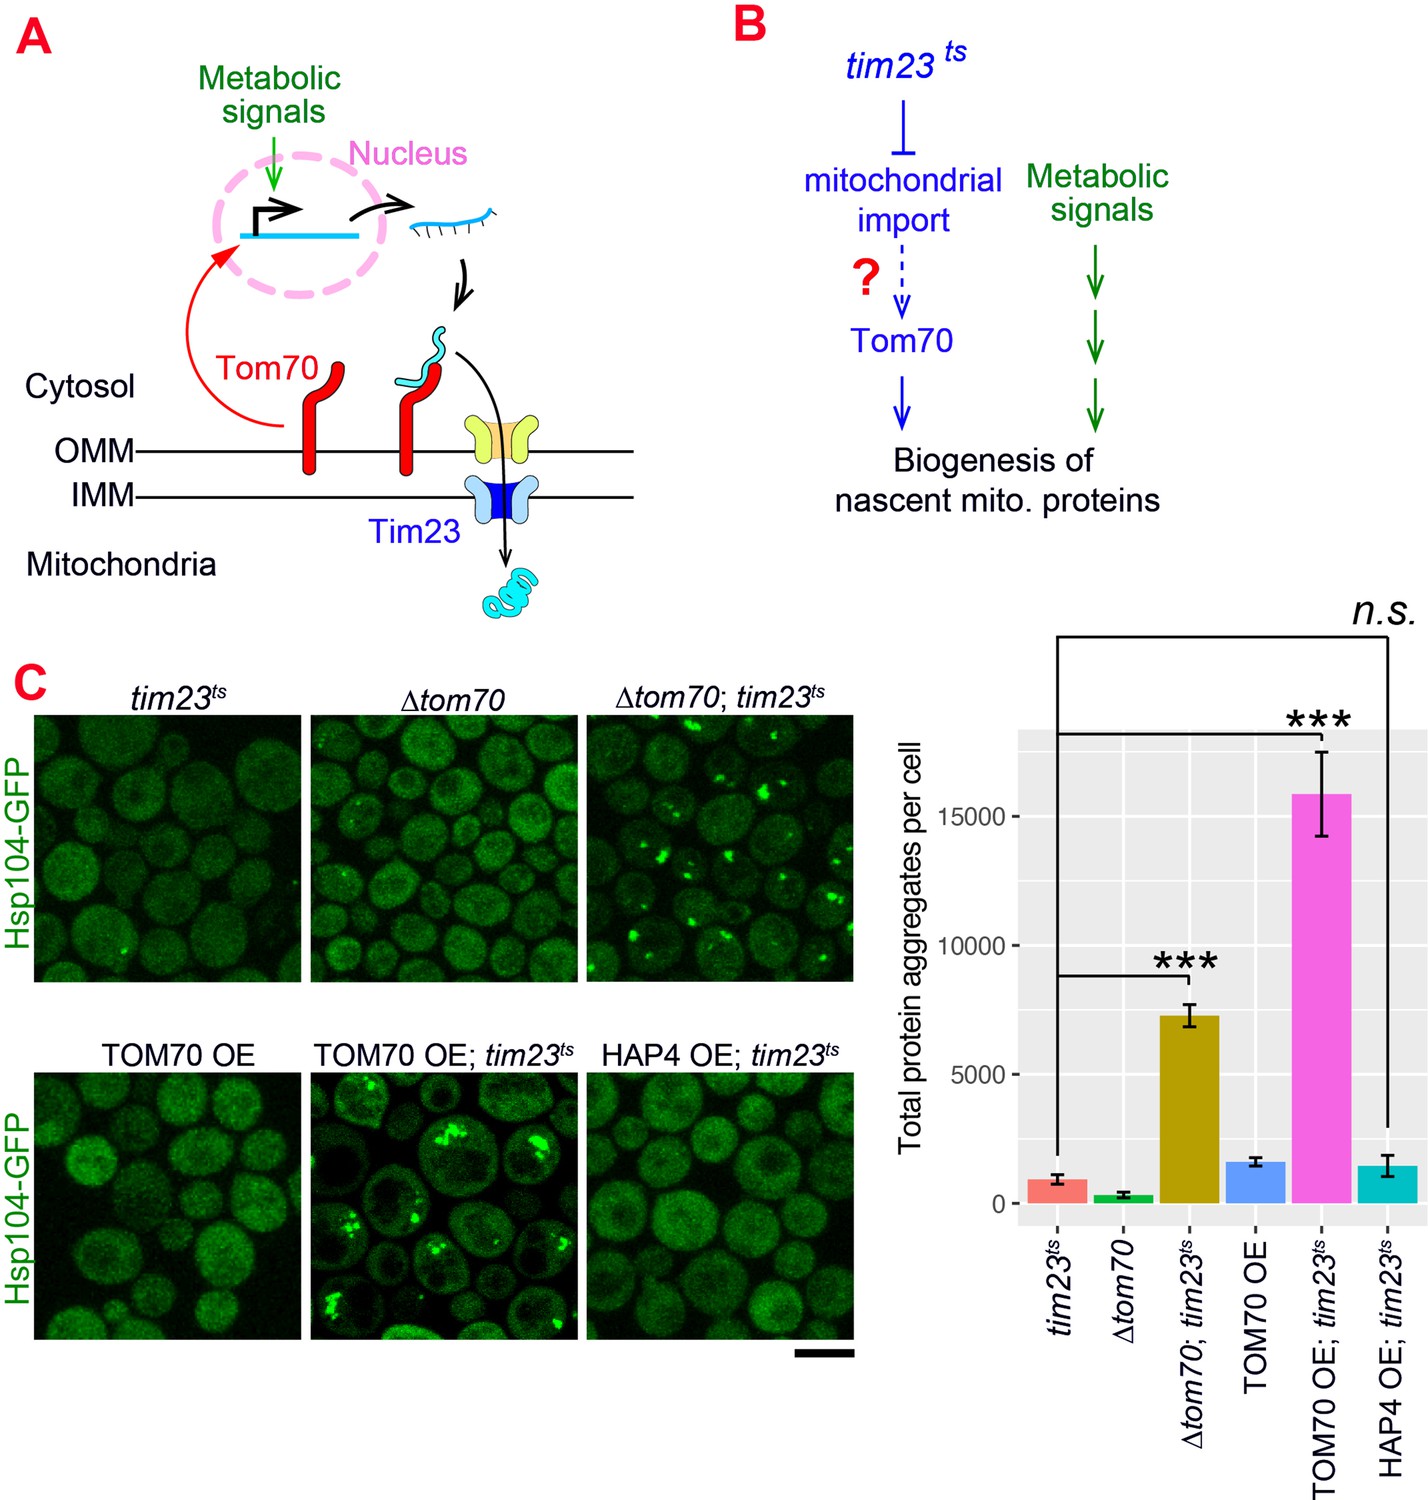
The Tom70-dependent regulation of mitochondrial biogenesis is involved in the cellular response to the mitochondrial import defect.
(A) Mitochondrial biogenesis in wild type cells. Metabolic signals regulate the transcriptional activity of mitochondrial proteins, which are synthesized in the cytosol and translocated through the outer mitochondrial membrane (OMM) and inner mitochondrial membrane (IMM) via TOM-TIM complexes. Tom70, a key component of the TOM complex, serves as the import receptor and the biogenesis regulator of mitochondrial proteins. Tim23, a key component of the TIM complex, acts downstream and receives the incoming nascent mitochondrial proteins from the TOM complex. (B) The potential role of Tom70 in the cellular response to the impairment of mitochondrial import caused by tim23ts. (C) Representative images and quantification for different strains after switching to the restricted temperatures to inactivate tim23ts. All strains were cultured in raffinose medium at 25 °C overnight, followed by adding galactose for 3hrs before adding glucose for 30 min and switching to 35 °C for 2 hr to inactivate tim23ts. Cytosolic protein aggregation was visualized with GFP-tagged Hsp104, a general marker of protein aggregates (Glover and Lindquist, 1998; Zhou et al., 2014). Bar graphs are the mean and s.e.m. of the Hsp104-GFP signals inside protein aggregates in each cell.Scale bar: 5 μm. Images are representative of at least two independent experiments. Data were analyzed with unpaired two-tailed t test: ***, p < 0.001; n.s., not significant. Sample sizes in (C) are given in Supplementary file 4.
Figure 4—figure supplement 1
Model of Tom70’s role in the cellular response to the mitochondrial import defect.
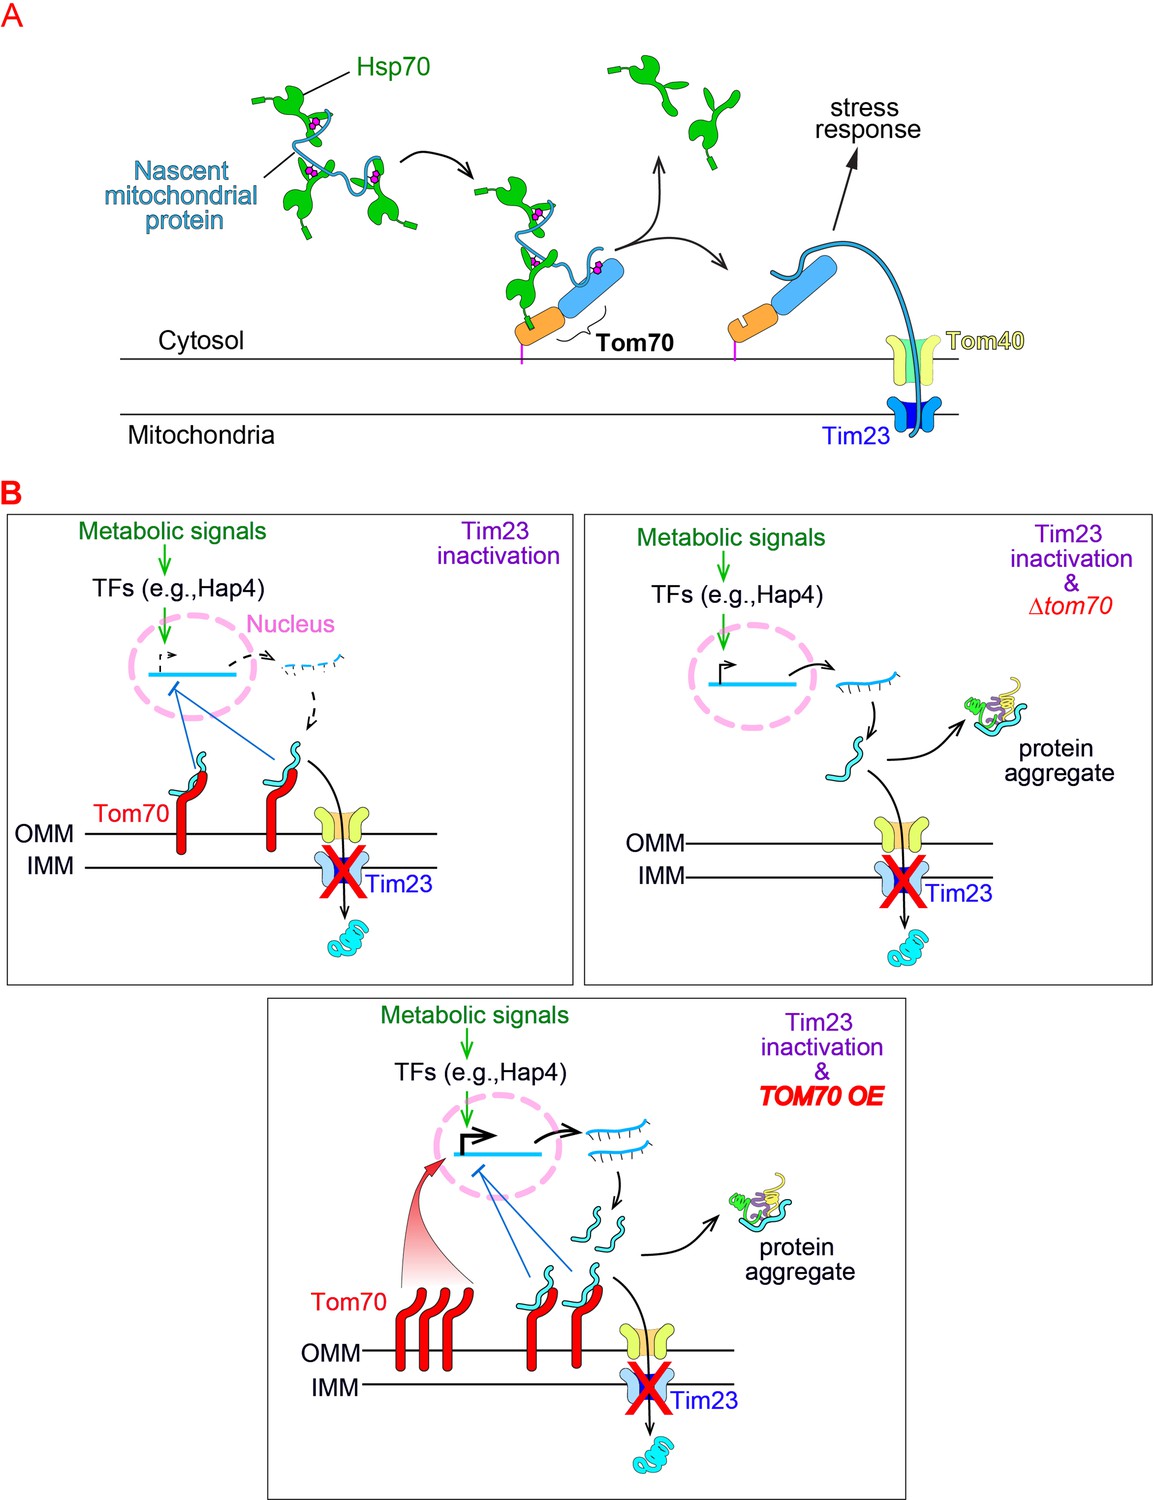
(A) Schematic of mitochondrial import steps involve Hsp70 and Tom70. In yeast, Hsp70 binds and maintains nascent mitochondrial proteins in unfolded states before transferring them to Tom70 for import (Young, 2003). Tim23, the key subunits of the inner membrane translocase TIM complex, acts downstream of TOM complex (including the subunit Tom70) in mitochondrial import. Tim23 inactivation blocks the mitochondrial import of nascent mitochondrial proteins, which stay on the surface of mitochondria and associate with upstream factors (such as Tom70), activate the stress response to repress the biogenesis of mitochondrial proteins. (B) The inactivation of Tim23 blocks the mitochondrial import of nascent mitochondrial proteins, which occupy Tom70 and signal the nucleus to reduce the biogenesis of mitochondrial proteins. This allows the tim23ts cells to re-balance the biogenesis and import of mitochondrial proteins, thereby avoiding their cytosolic accumulation and aggregation. Tom70 is required for this mitochondria-to-nucleus signaling as knockout of Tom70 in tim23ts cells compromises this re-balancing effort and causes cytosolic protein aggregation. The fact that overexpression of TOM70, which activates the transcriptional activity of mitochondrial proteins, compromises the re-balancing effort of tim23ts cells is consistent with previous reports that transcriptional repression of mitochondrial proteins is a key feature of the cellular response toward mitochondrial import defects .
Figure 5 with 1 supplement
Age-related reduction of Tom70 is associated with mitochondrial dysfunctions.
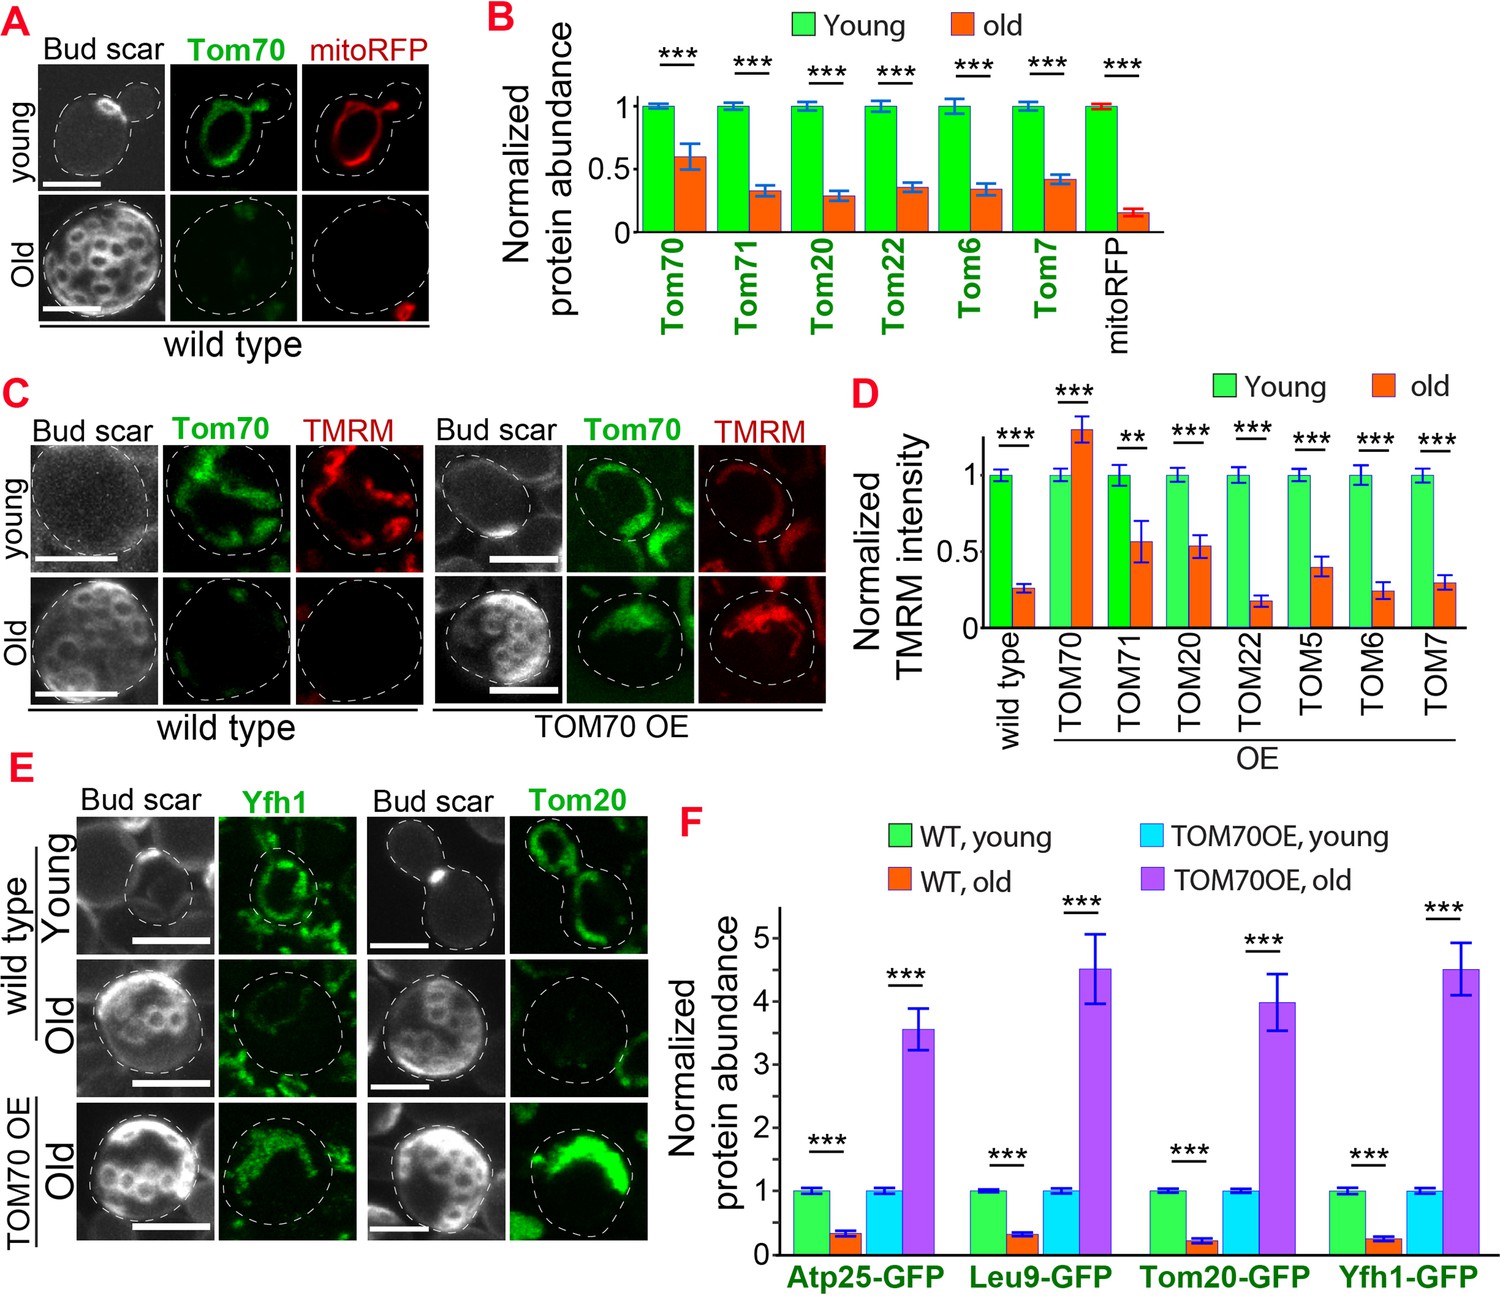
(A) Representative images of Tom70-GFP and mito-RFP in young and aged cells. Both young and old cells were from YPD culture and stained with calcofluor white to visualize the bud scars. (B) Quantification of different GFP-tagged TOM proteins and mitoRFP in young and aged cells. Both young and old cells were from YPD culture and the GFP signal was normalized to corresponding young cells of the same strain. (C, D) Representative images (C) and quantification (D) of mitochondrial membrane potential in young and aged cells from different strains. Different TOM proteins were overexpressed from pGAL promoter. Both young and old cells were from YEP-galactose medium. Mitochondrial membrane potential was indicated by TMRM staining. (E, F) Representative images (E) and quantification (F) of mitochondrial proteins undergo age-associated loss of expression, which can be suppressed by overexpressing TOM70. WT, wild type. Both young and old cells were from YEP-galactose medium. The significant increase of mitochondrial proteins in old TOM70 OE cells (F) is likely due to the continuous induction of mitochondrial proteins by TOM70 OE throughout the entire lifespan. Scale bar for all images: 5 μm. Mitochondrial proteins were visualized by endogenous C-terminal GFP tagging and expressed from their own promoters. Both young and old cells in each experiment went through the same culture medium, experimental procedures, and purification. Images are representative of at least two independent experiments. Bar graphs are the mean and s.e.m. that normalized to young cells for each genotype. Sample sizes of (B, D, F) are given in Supplementary file 4. Data were analyzed with unpaired two-tailed t test: ***, p < 0.001; **, p < 0.01; *, p < 0.05.
Figure 5—figure supplement 1
Overexpressing Tom70 from a different promoter can rescue age-associated mitochondrial defects.
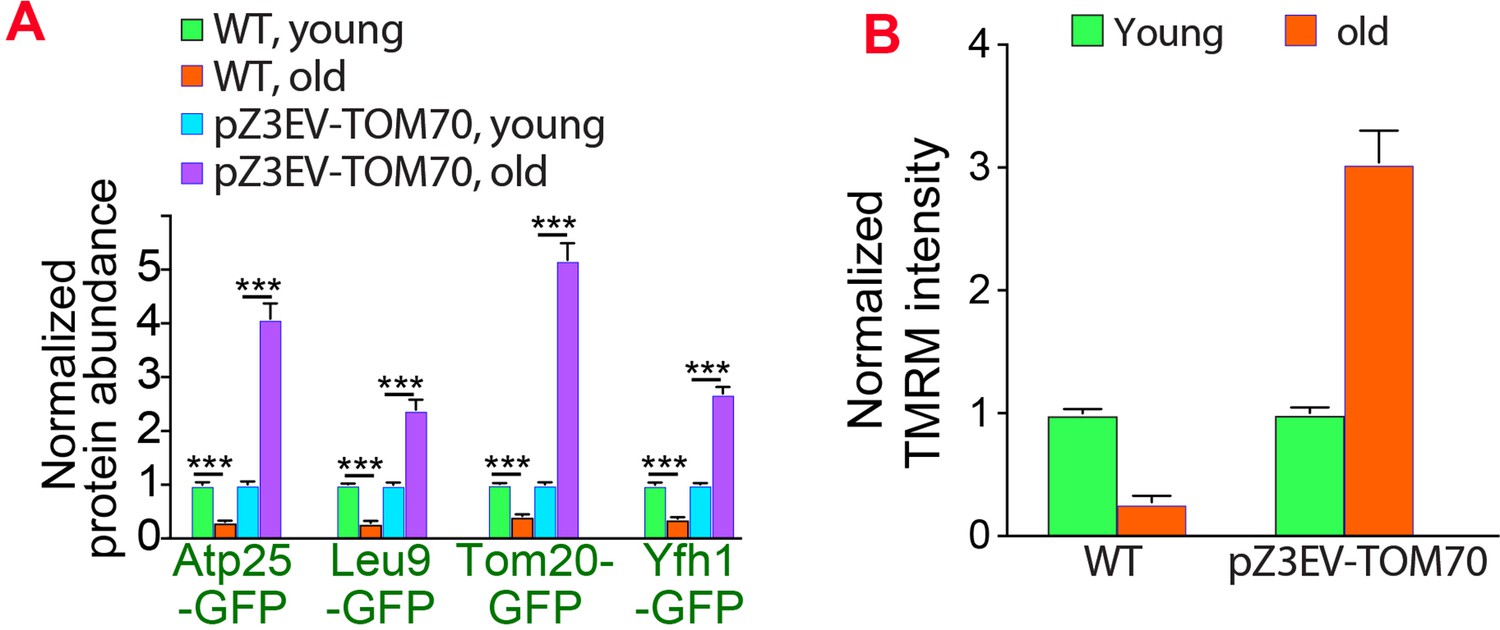
(A, B) Quantification of mitochondrial proteins abundance (A) and membrane potential (B) in different cells. The age-associated loss of mitochondrial membrane potential and protein expression can be suppressed by overexpressing TOM70 from pZ3EV promoter in the glucose medium. Both wild type (WT) and pZ3EV-TOM70 strains were cultured in YPD supplemented with 100nM β-estradiol before and after biotinylating mother cell wall and culturing for 2 days to age the mother cells. Bar graphs are the mean and s.e.m. that normalized to young cells for each genotype. Data were analyzed with unpaired two-tailed t test: ***, p < 0.001; **, p < 0.01; *, p < 0.05; n.s., not significant.Sample sizes are given in Supplementary file 4.
Figure 6 with 1 supplement
Loss of Tom70 accelerates mitochondrial aging.
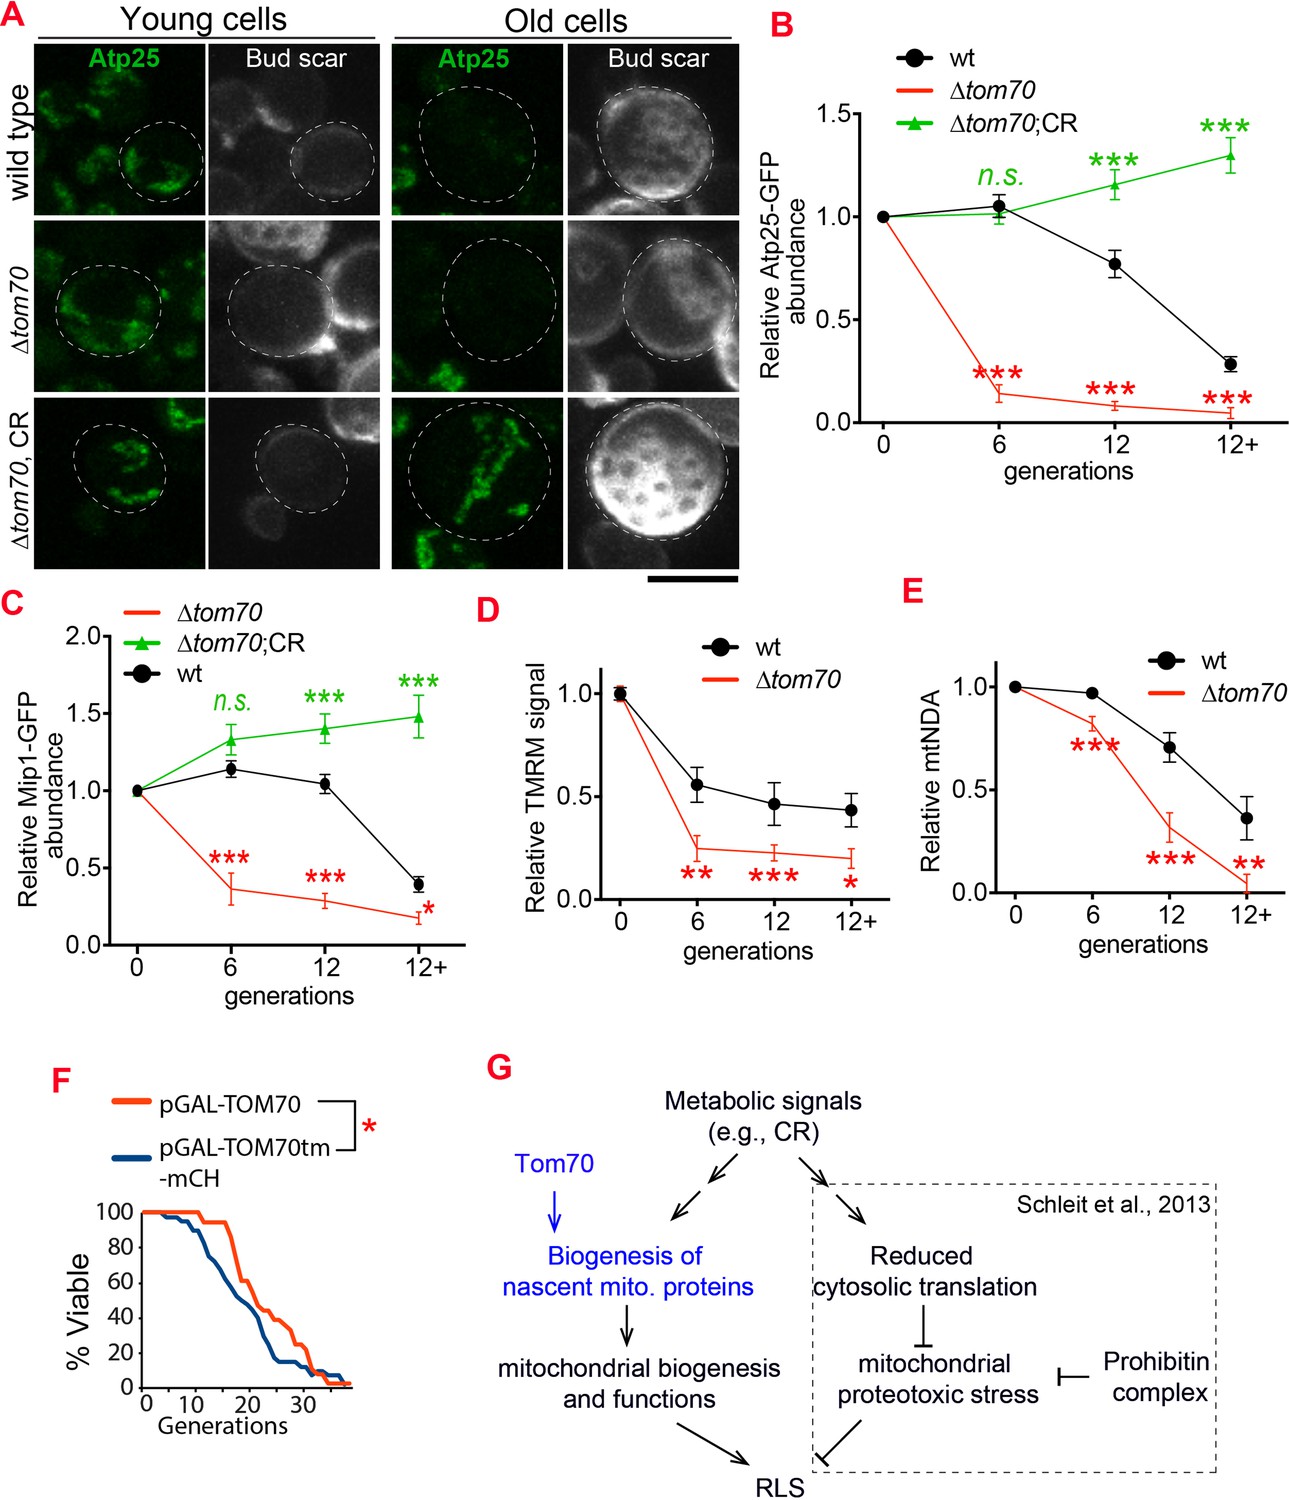
(A, B) Representative images (A) and quantifications (B) of Atp25-GFP in young and aged cells of different strains. Both young and old cells were from YPD culture and stained with calcofluor white to visualize the bud scars. Both young and old cells were quantified from the purified cells that went through the same experimental procedures and purification (same for other results). All strains cultured in YPD medium with 2% glucose except for CR, which has 0.05% glucose. The GFP signal quantified from the old cells was normalized to corresponding young cells of the same strain. Old cells were grouped as young (0 bud scar), age 2–6, age 7–11, and age 12+. Data were analyzed with unpaired two-tailed t test: ***, p < 0.001; **, p < 0.01; *, p < 0.05; n.s., not significant (same for C-E). More than 20 cells quantified for each group (same for C-E). (C) Quantification of Mip1 in young and aged cells from different strains. All strains cultured in YPD medium with 2% glucose except for CR, which has 0.05% glucose. (D, E) Quantification of mitochondrial membrane potential (D) and mtDNA (E) in young and aged cells from different strains. Mitochondrial membrane potential was indicated by TMRM staining. All strains cultured in YPD medium with 2% glucose except for CR, which has 0.05% glucose. (F) Survival curve from replicative life span assay of 36 and 40 cells expressing pGAL-TOM70 and pGAL-TOM70tm-mCH, respectively, were determined by microscopic dissection on YEP-galactose plates. P = 0.038 by Mann-Whitney test. (G) Proposed model by which CR extends the RLS of different mitochondrial mutants via different mechanisms. Schleit et al., 2013 showed that CR extends the RLS of ∆phb cells by reducing mitochondrial proteotoxic stress via reduced cytosolic translation. Our results demonstrated that this reduced cytosolic translation in CR is not universal as the biogenesis of mitochondrial proteins is preserved during aging. This preserved mitochondrial biogenesis in CR is consistent with the observed rescue of RLS in ∆tom70 cells by CR (Schleit et al., 2013). Scale bar for all images: 5 μm. Mitochondrial proteins were visualized by endogenous C-terminal GFP tagging and expressed from their own promoters. Images are representative of at least two independent experiments.
Figure 6—figure supplement 1
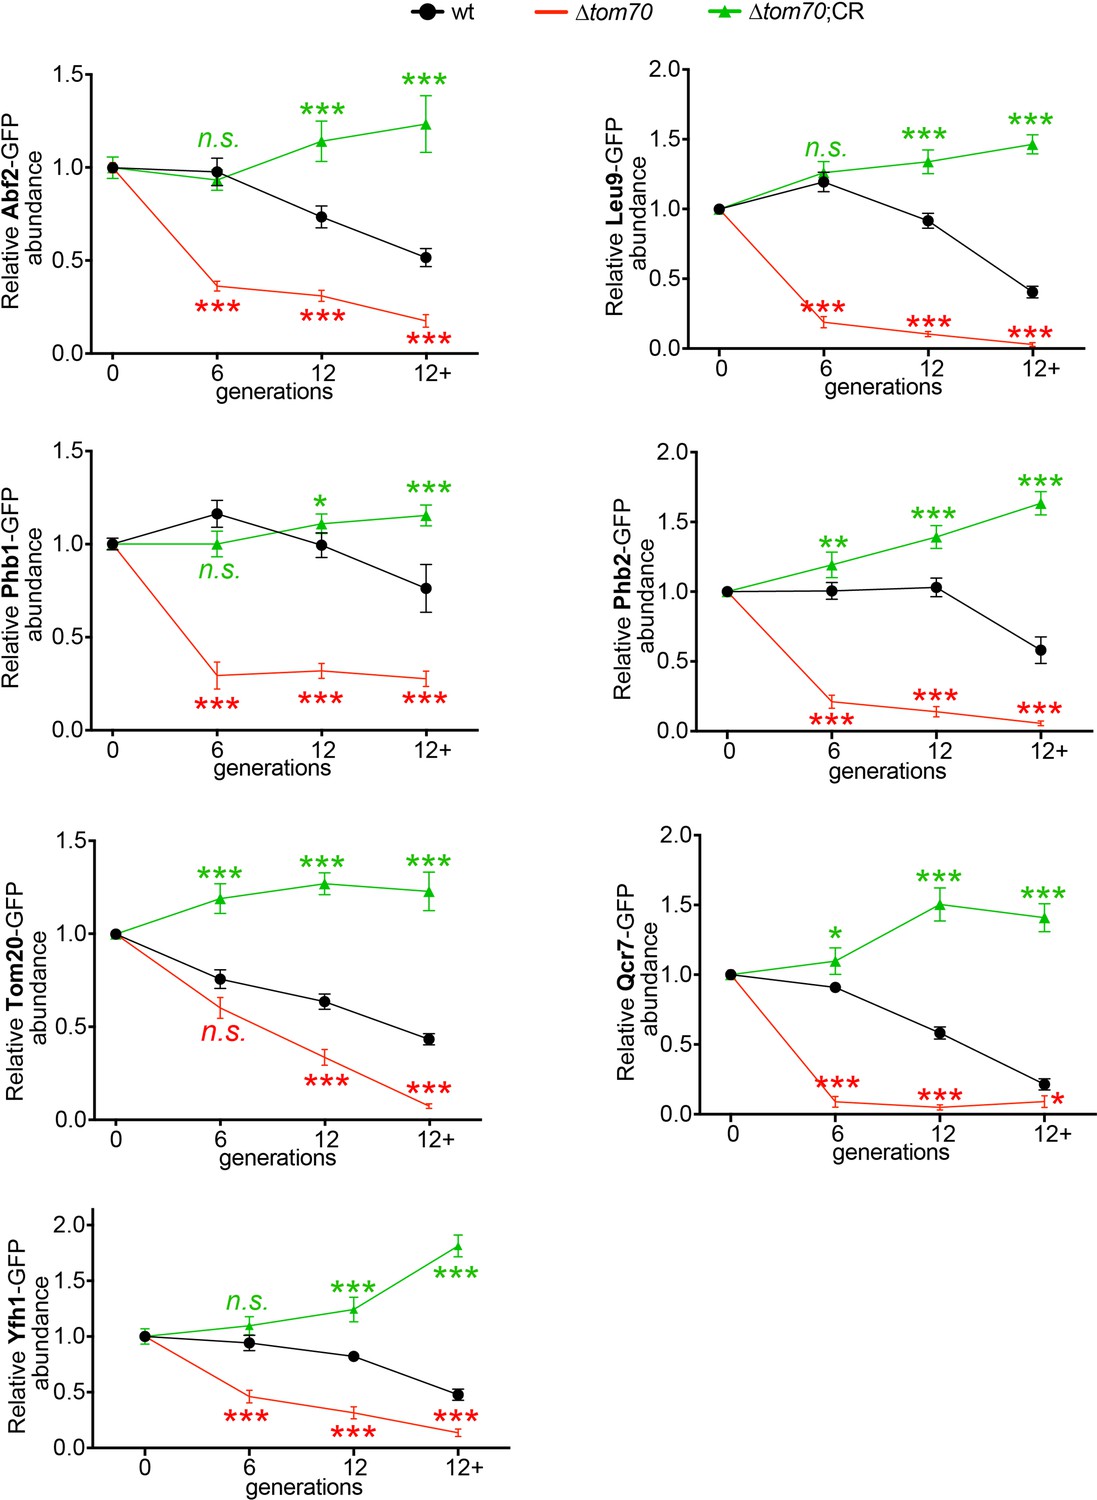
Additional data for the accelerated loss of mitochondrial proteins in ∆tom70 cells during aging.
Quantifications of different mitochondrial proteins in young and aged cells of different strains. Cells with advanced reproductive age were purified from YPD culture and stained with calcofluor white to visualize the bud scars. Both young and old cells were quantified from the purified cells that went through the same experimental procedures and purification (same for other results). All strains cultured in YPD medium with 2% glucose except for CR, which has 0.05% glucose. The GFP signal quantified from the old cells was normalized to corresponding young cells of the same strain. Old cells were grouped as young (0 bud scar), age 2–6, age 7–11, and age 12+. More than 20 cells quantified for each group.
Figure 7 with 1 supplement
Reduced biogenesis and enhanced degradation underlying the age-dependent reduction of mitochondrial Tom70.
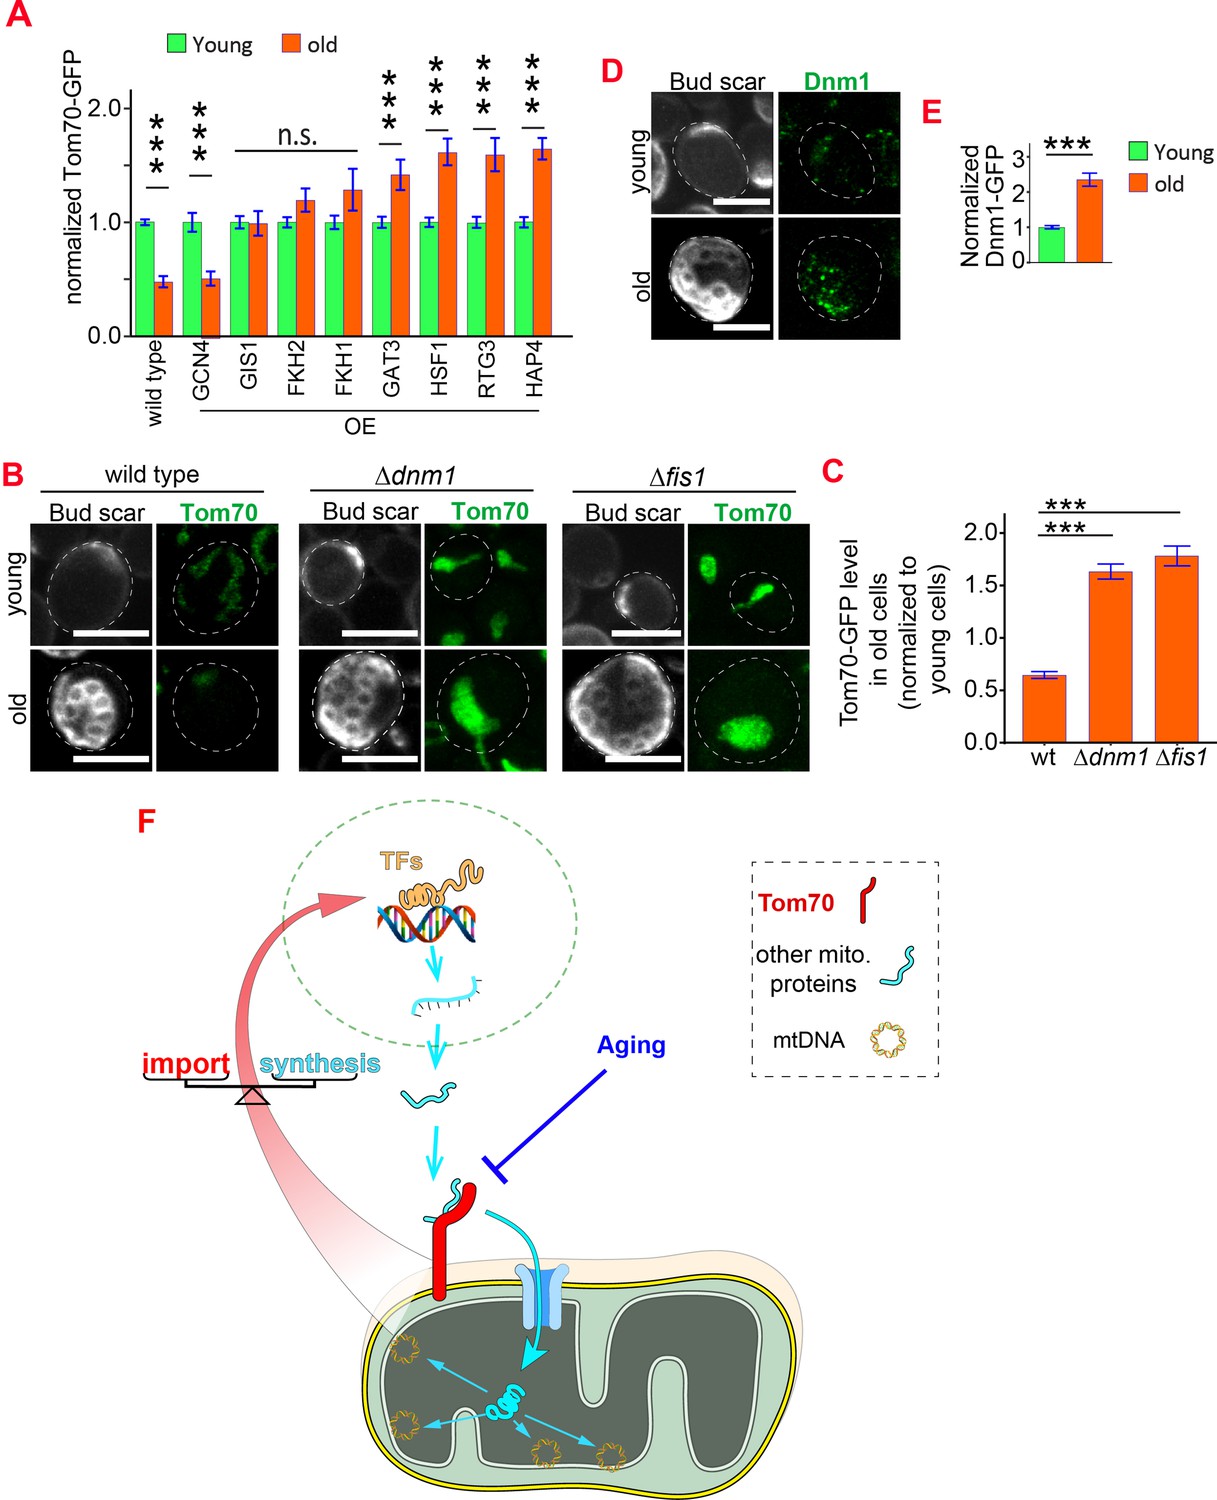
(A) Mean and s.e.m. of Tom70-GFP signal in young and old cells from strains overexpressing different TFs. Sample sizes are given in Supplementary file 4. Both young and old cells were from YEP-galactose medium. (B, C) Representative images (B) and quantification (C) of Tom70-GFP in young and old cells from wild type and mutant strains. Mean and s.e.m. from 57, 154, 50 old cells were normalized to young cells for each strain. Both young and old cells were from YPD medium. (D, E) Representative images (D) and quantification (E) of Dnm1-GFP in young and old cells. Mean and s.e.m. from 89 young and 53 old cells were quantified. Both young and old cells were from YPD medium. (F) Model of Tom70’s roles. Tom70 sits at the crossroad of cytosolic proteostasis and mitochondrial biogenesis by regulating both the biogenesis and import of mitochondrial proteins. The reduction of Tom70 during aging is associated with age-dependent mitochondrial defects. Scale bar for all images: 5 μm. Mitochondrial proteins were visualized by endogenous C-terminal GFP tagging and expressed from their own promoters. Images are representative of at least two independent experiments. Data were analyzed with unpaired two-tailed t test: ***, p < 0.001; **, p < 0.01; *, p < 0.05; n.s., not significant.
Figure 7—figure supplement 1
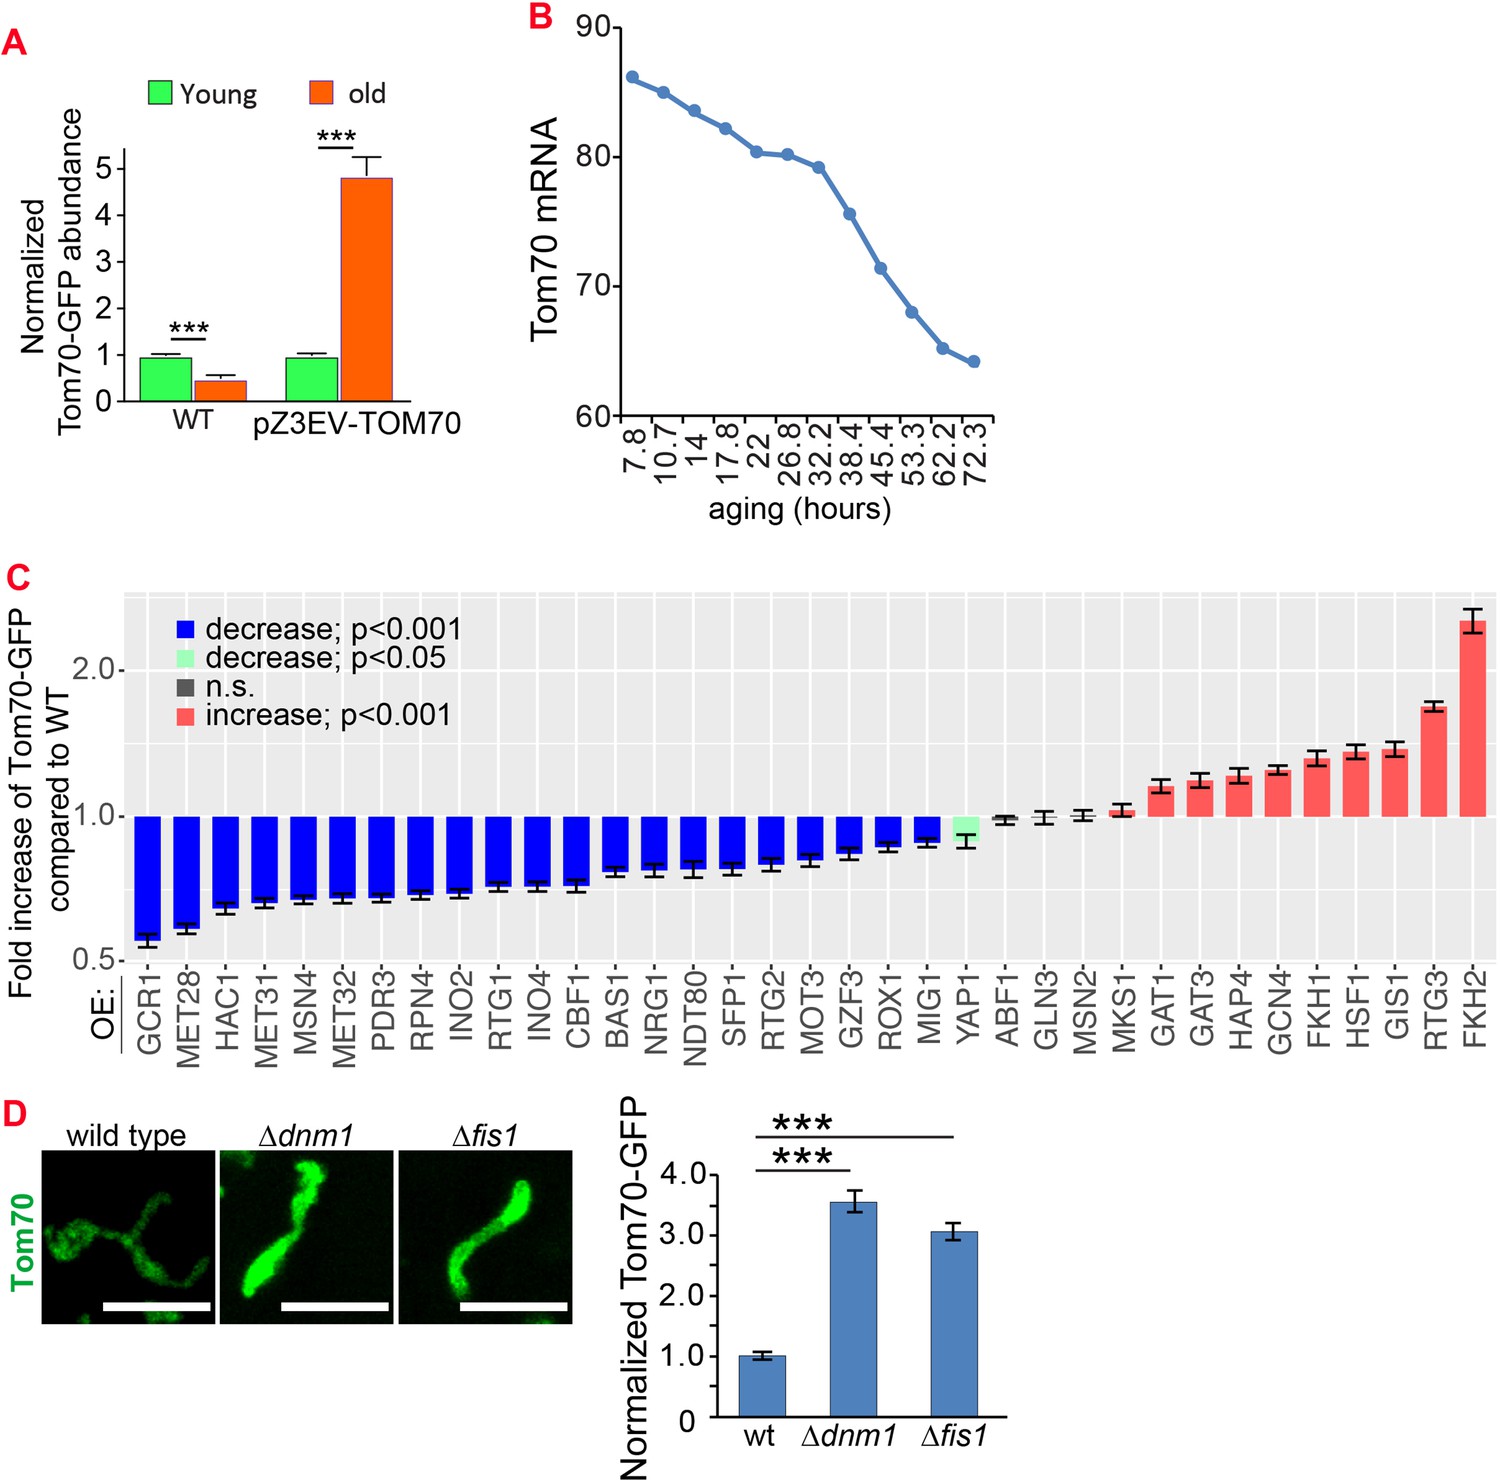
Additional data for the mechanisms that control the expression of Tom70 in young and aged cells.
(A) Expressing TOM70-GFP from pZ3EV can prevent the age-associated reduction of Tom70 protein. Both young and old cells were from YPD medium with 10 nM β-estradiol. (B) Tom70 mRNA quantified from cells with different replicative ages. RNAseq data from Janssens et al., 2015 was plotted. (C) Quantification of Tom70-GFP in young cells cultured in YEP-galactose medium to overexpress different TFs from the pGAL promoter. Shown are mean and s.e.m. normalized to wild-type cells. (D) Representative images and quantification of Tom70-GFP in young cells from wild type and mutant strains cultured in YPD medium. Mean and s.e.m. from 53, 50, 50 cells were quantified. WT, wild type. Scale bar for all images: 5 μm. Sample sizes for (A,C) are given in Supplementary file 4. Images are representative of at least two independent experiments. Data were analyzed with unpaired two-tailed t test: ***, p < 0.001; **, p < 0.01; *, p < 0.05; n.s., not significant.
Author response image 1
The role of mtDNA metabolisms in Tom70’s regulatory function of mitochondrial biogenesis.
(A) mRNA abundance of basic mitochondrial transcription machineries quantified by qPCR in TOM70 OE strain and normalized to control cells. All different yeast strains, including wild type control, were cultured in the same medium. Shown are the mean and s.e.m. from three replicates. (B, C) Quantification (B) of different mitochondrial proteins in wild type control strain and other strains overexpressing different mitochondrial transcription machineries. All different yeast strains were cultured in the same medium. Only RPO41 OE increased Tim44-GFP expression among these strains. In fact, most of these overexpressing strains reduced the mitochondrial abundance, and the mitochondrial morphology in RPO41 OE cells (C) is different from TOM70 OE (Figure 1A), suggesting that these mitochondrial transcription machineries are not downstream of TOM70 OE. (D) Quantification of different mitochondrial proteins in wild type control strain and TOM70 OE strains with/without Erythromycin (2mg/ml) treatment. All different yeast strains were cultured in the same growth medium. Inhibition of mitochondrial translation by Erythromycin partially inhibit the mitochondrial biogenesis induced by TOM70 OE. Data were analyzed with unpaired two-tailed t test: ***, p<0.001; *, p<0.05; n.s., not significant.
Author response image 2

Quantification of different mitochondrial proteins in wild type control strain and TOM70 OE strains with/without NAC (20mM) treatment.
All different yeast strains were cultured in the same growth medium. ROS scavenger NAC partially inhibits the induction of some mitochondrial proteins (highlighted as yellow bars) in TOM70 OE cells. Data were analyzed with unpaired two-tailed t test: ***, p<0.001; *, p<0.05; n.s., not significant.
Author response image 3
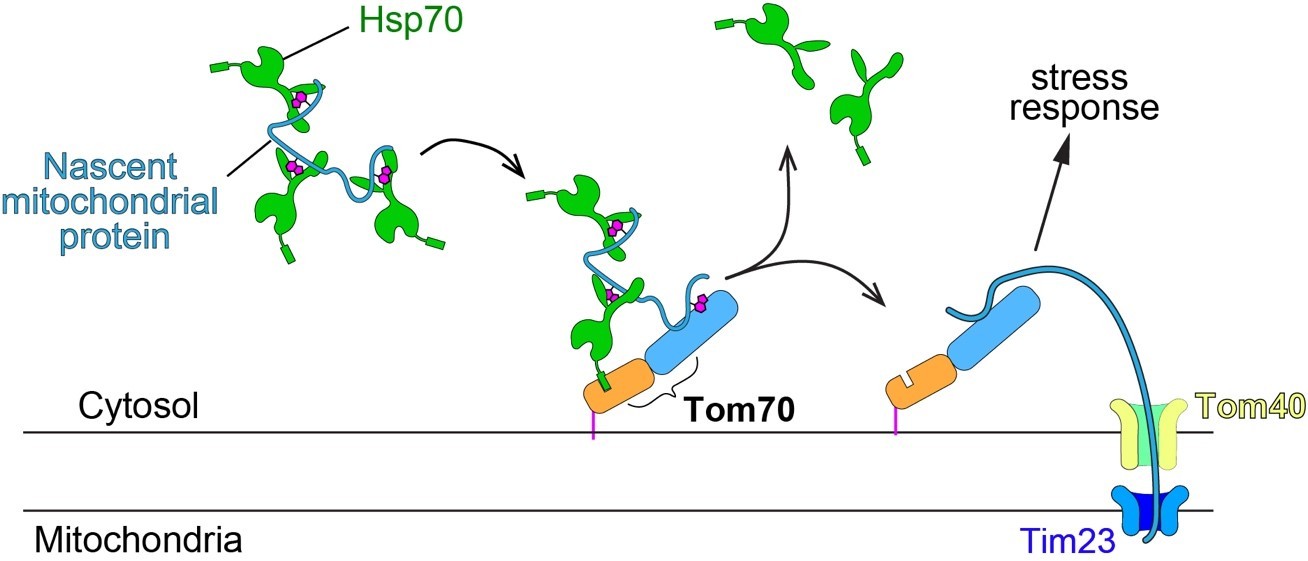
Schematic of mitochondrial import steps involve Hsp70 and Tom70.
In yeast, Hsp70 binds and maintains nascent mitochondrial proteins in unfolded states before transferring them to Tom70 for import (Young et al., 2003). Tim23, the key subunits of the inner membrane translocase TIM complex, acts downstream of TOM complex (including the subunit Tom70) in mitochondrial import. Tim23 inactivation blocks the mitochondrial import of nascent mitochondrial proteins, which stay on the surface of mitochondria and associate with upstream factors, such as Tom70.
Author response image 4
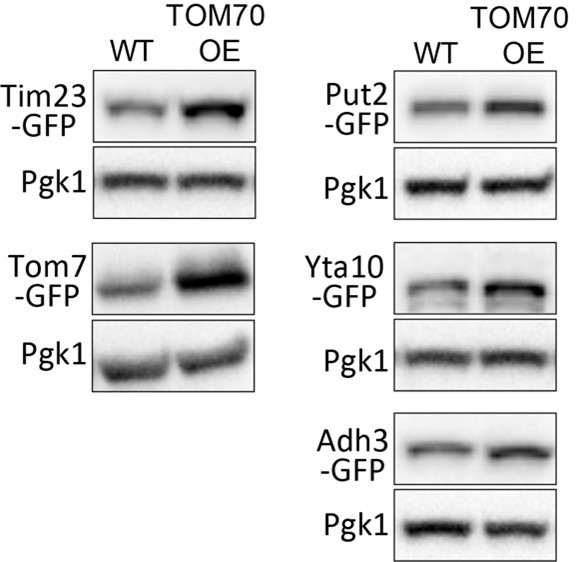
Representative WB of WT and TOM70 OE strains.
Additional files
-
Supplementary file 1
Experimental models, organisms and strains.
- https://cdn.elifesciences.org/articles/75658/elife-75658-supp1-v2.xlsx
-
Supplementary file 2
Oligo DNA.
- https://cdn.elifesciences.org/articles/75658/elife-75658-supp2-v2.xlsx
-
Supplementary file 3
Recombinant DNA.
- https://cdn.elifesciences.org/articles/75658/elife-75658-supp3-v2.xlsx
-
Supplementary file 4
Source data for sample sizes related to several figures.
- https://cdn.elifesciences.org/articles/75658/elife-75658-supp4-v2.xlsx
-
Supplementary file 5
Oligo DNA for fly genes tested.
- https://cdn.elifesciences.org/articles/75658/elife-75658-supp5-v2.xlsx
-
Transparent reporting form
- https://cdn.elifesciences.org/articles/75658/elife-75658-transrepform1-v2.docx
Download links
A two-part list of links to download the article, or parts of the article, in various formats.
Downloads (link to download the article as PDF)
Open citations (links to open the citations from this article in various online reference manager services)
Cite this article (links to download the citations from this article in formats compatible with various reference manager tools)
Tom70-based transcriptional regulation of mitochondrial biogenesis and aging
eLife 11:e75658.
https://doi.org/10.7554/eLife.75658


