Genetically manipulating endogenous Kras levels and oncogenic mutations in vivo influences tissue patterning of murine tumorigenesis
- Department of Pharmacology & Cancer Biology, Duke University Medical Center, United States
- Department of Pathology, Duke University Medical Center, United States
- Center for Applied Proteomics and Molecular Medicine, School of Systems Biology, George Mason University, United States
Figures
Figure 1 with 6 supplements
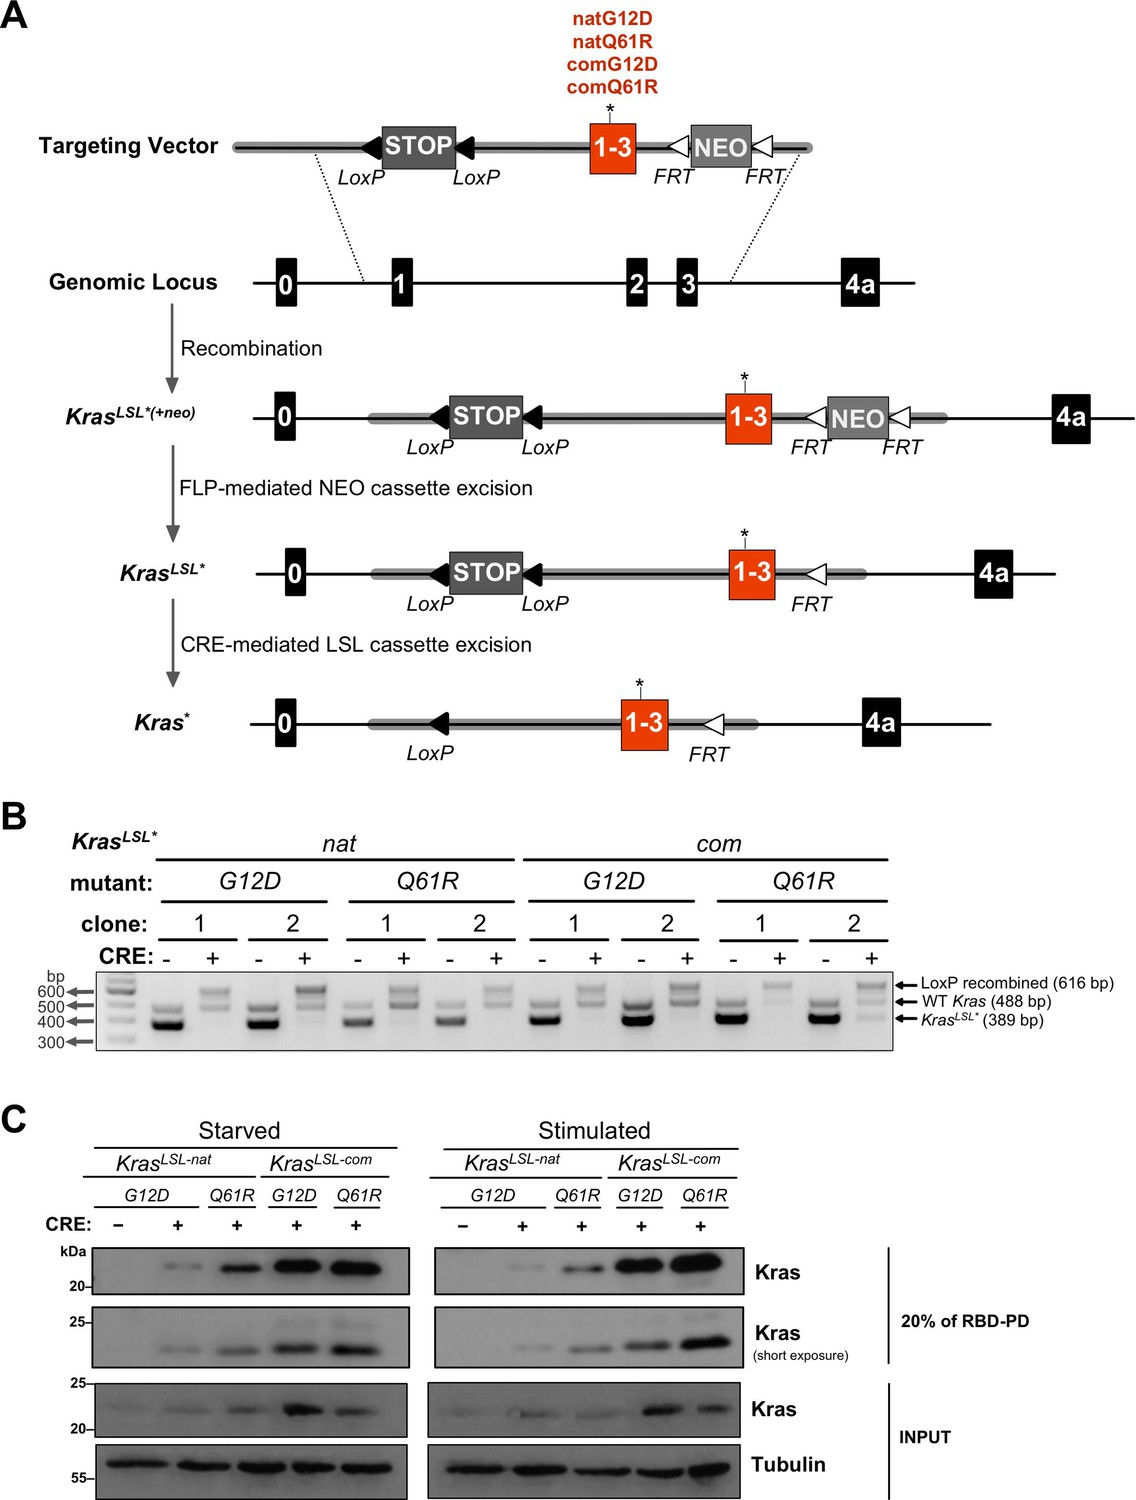
Conditional KrasLSL alleles with different oncogenic mutations and codon usage.
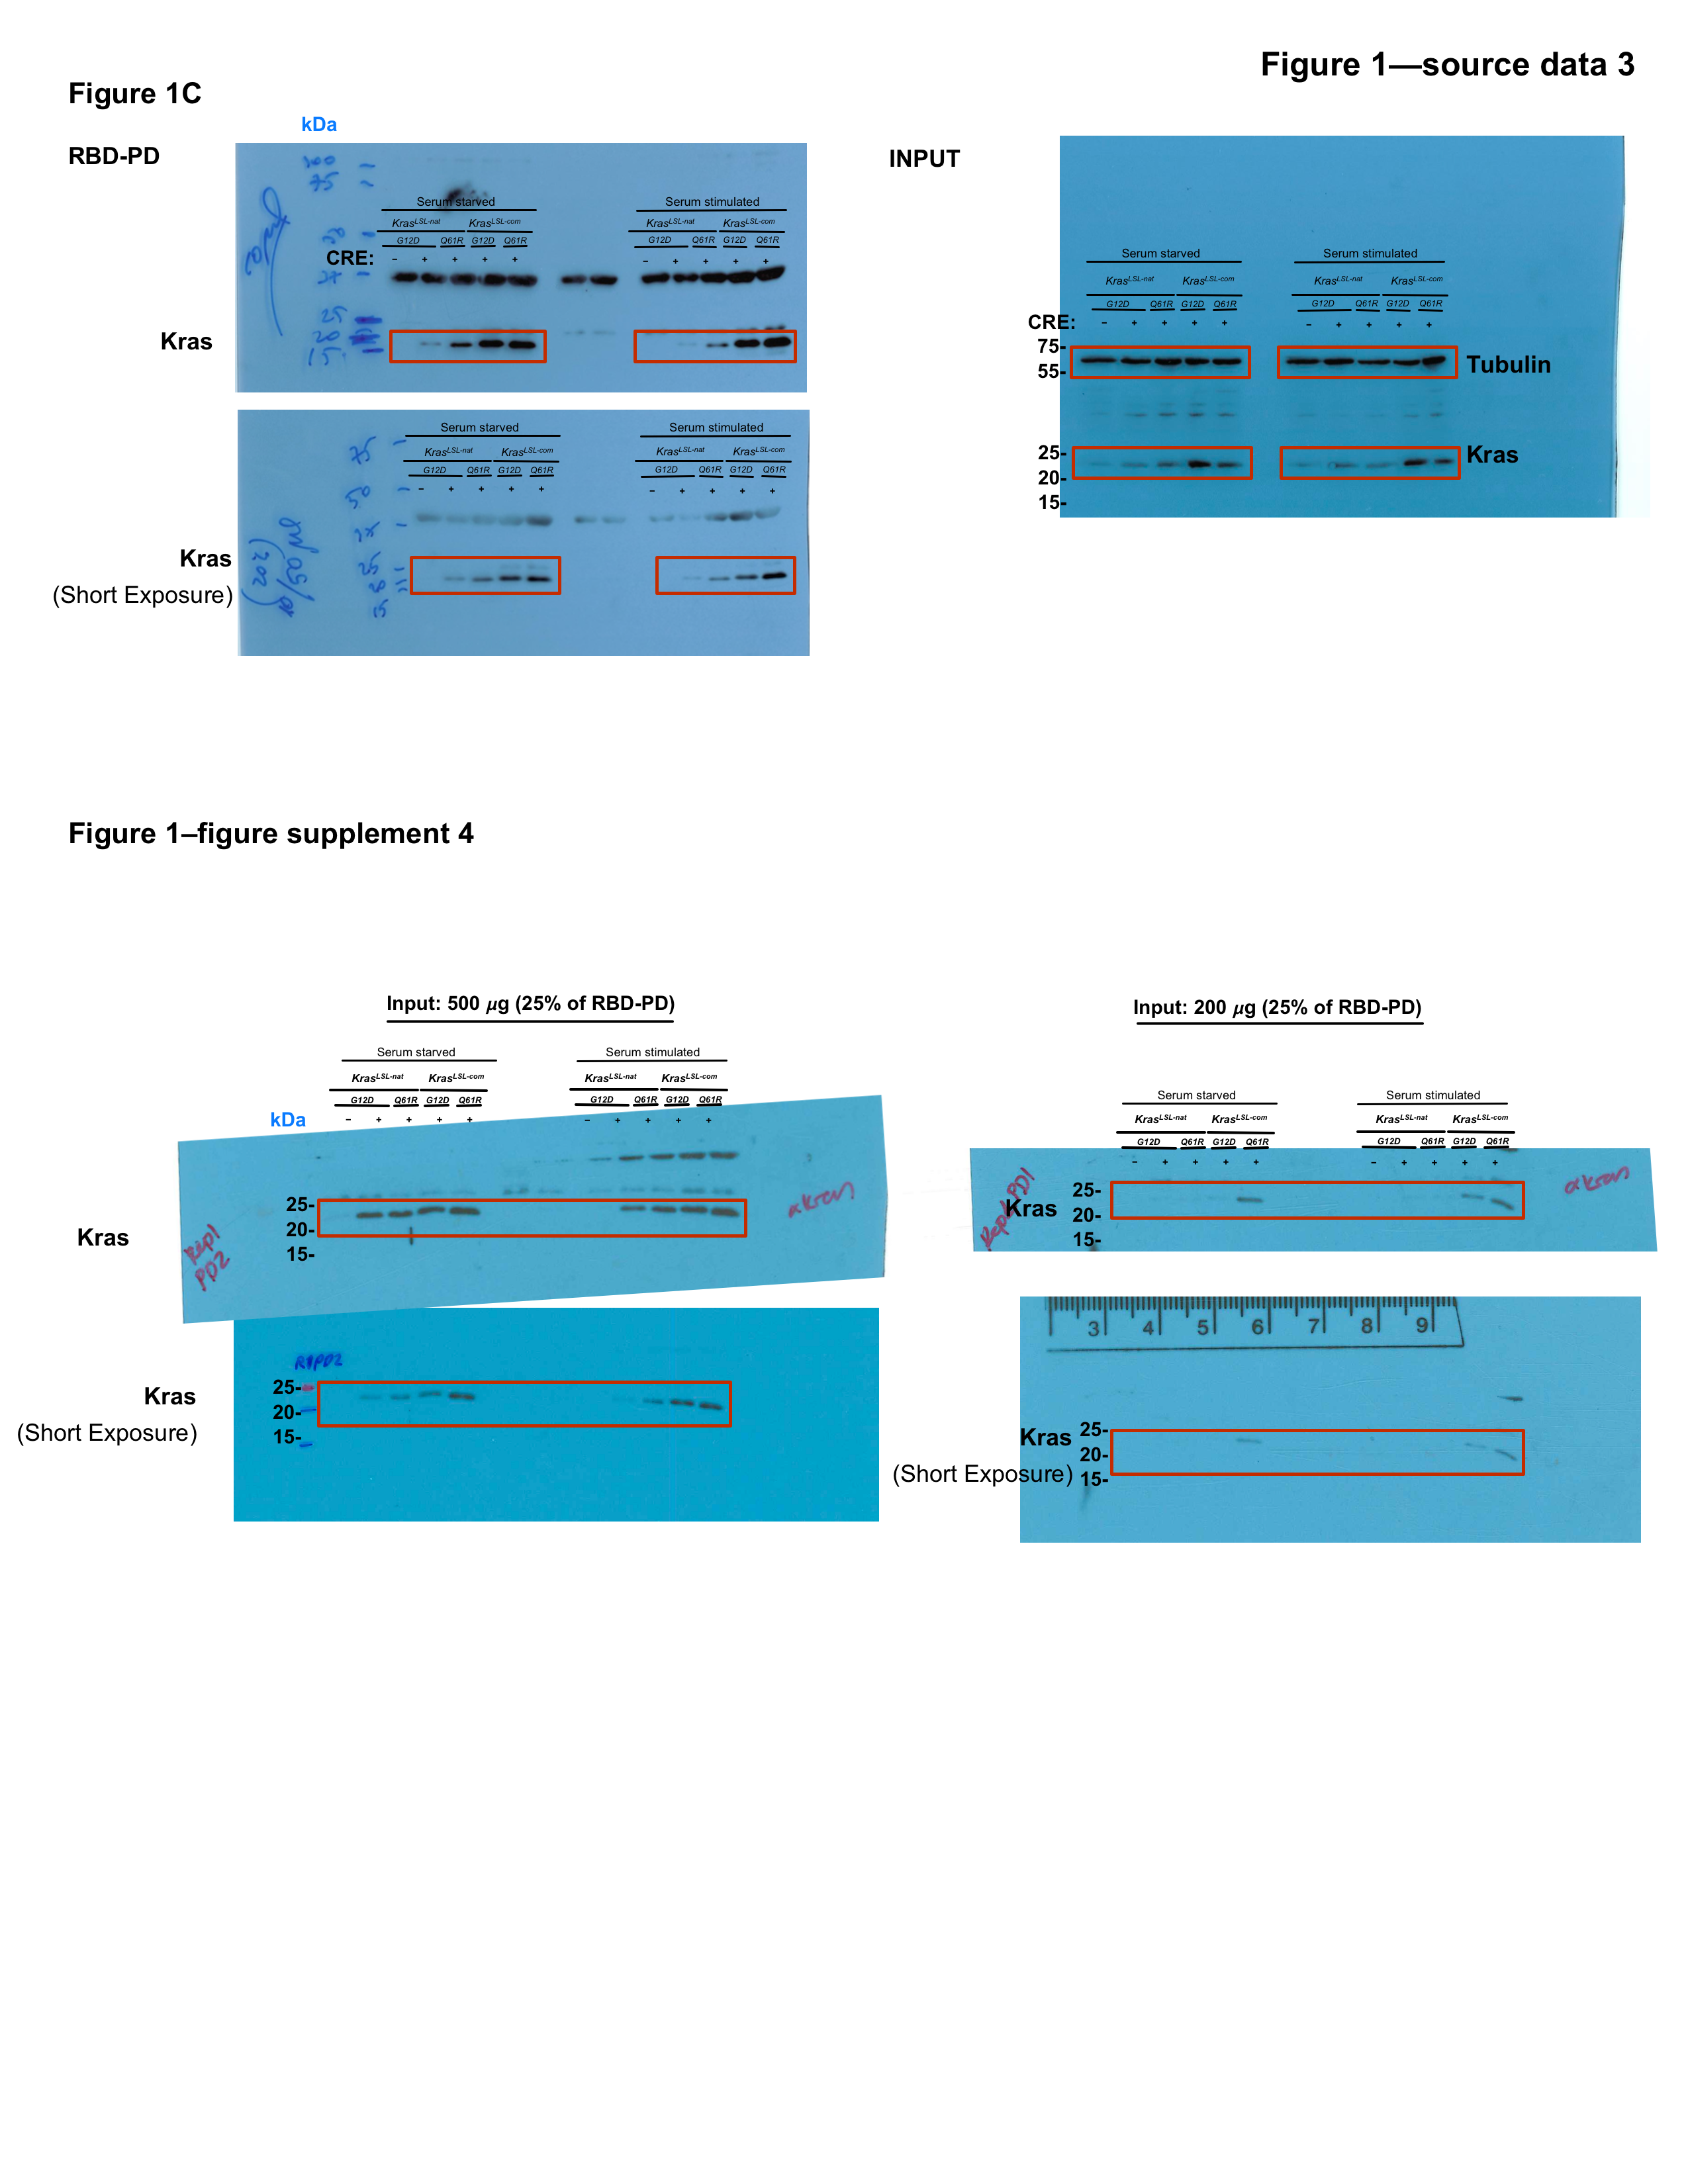
(A) Schematic of generating and activating KrasLSL alleles with the first three coding exons fused and encoded by native (nat) versus common (com) codons with either a G12D or Q61R mutation. (B) PCR genotyping of two independently derived mouse embryonic fibroblast (MEF) cultures (two biological replicates) with the indicated Kras alleles in the absence and presence of Cre recombinase (CRE) to detect the unaltered wild-type Kras allele product (WT, 488 bp) and the unrecombined (KrasLSL*, 389 bp) and recombined (LoxP recombined, 616 bp) KrasLSL allelic products. Gel images were cropped and color inverted for optimal visualization. Full-length gel images are provided in Figure 1—source data 2. (C) Expression levels, determined by immunoblot with an anti-Kras antibody, RAS activity levels, determined by RBD pull-down (RBD-PD) of lysates collected from MEF cells derived from mice with the indicated Kras alleles in the presence of Cre recombinase (CRE). MEF cultures derived from KrasLSL-natG12D/+ mice in the absence of Cre recombinase were used as negative control. MEF cultures were either serum starved overnight (starved) or serum starved overnight followed by serum stimulation for 5 min (stimulated). 20% of the elute from RBD-PD and 30 μg total protein from the total cell lysates were loaded. Tubulin serves as loading control. One of two biological replicates; see Figure 1—figure supplement 3 for the second biological replicate. Full-length gel images are provided in Figure 1—source data 3.
-
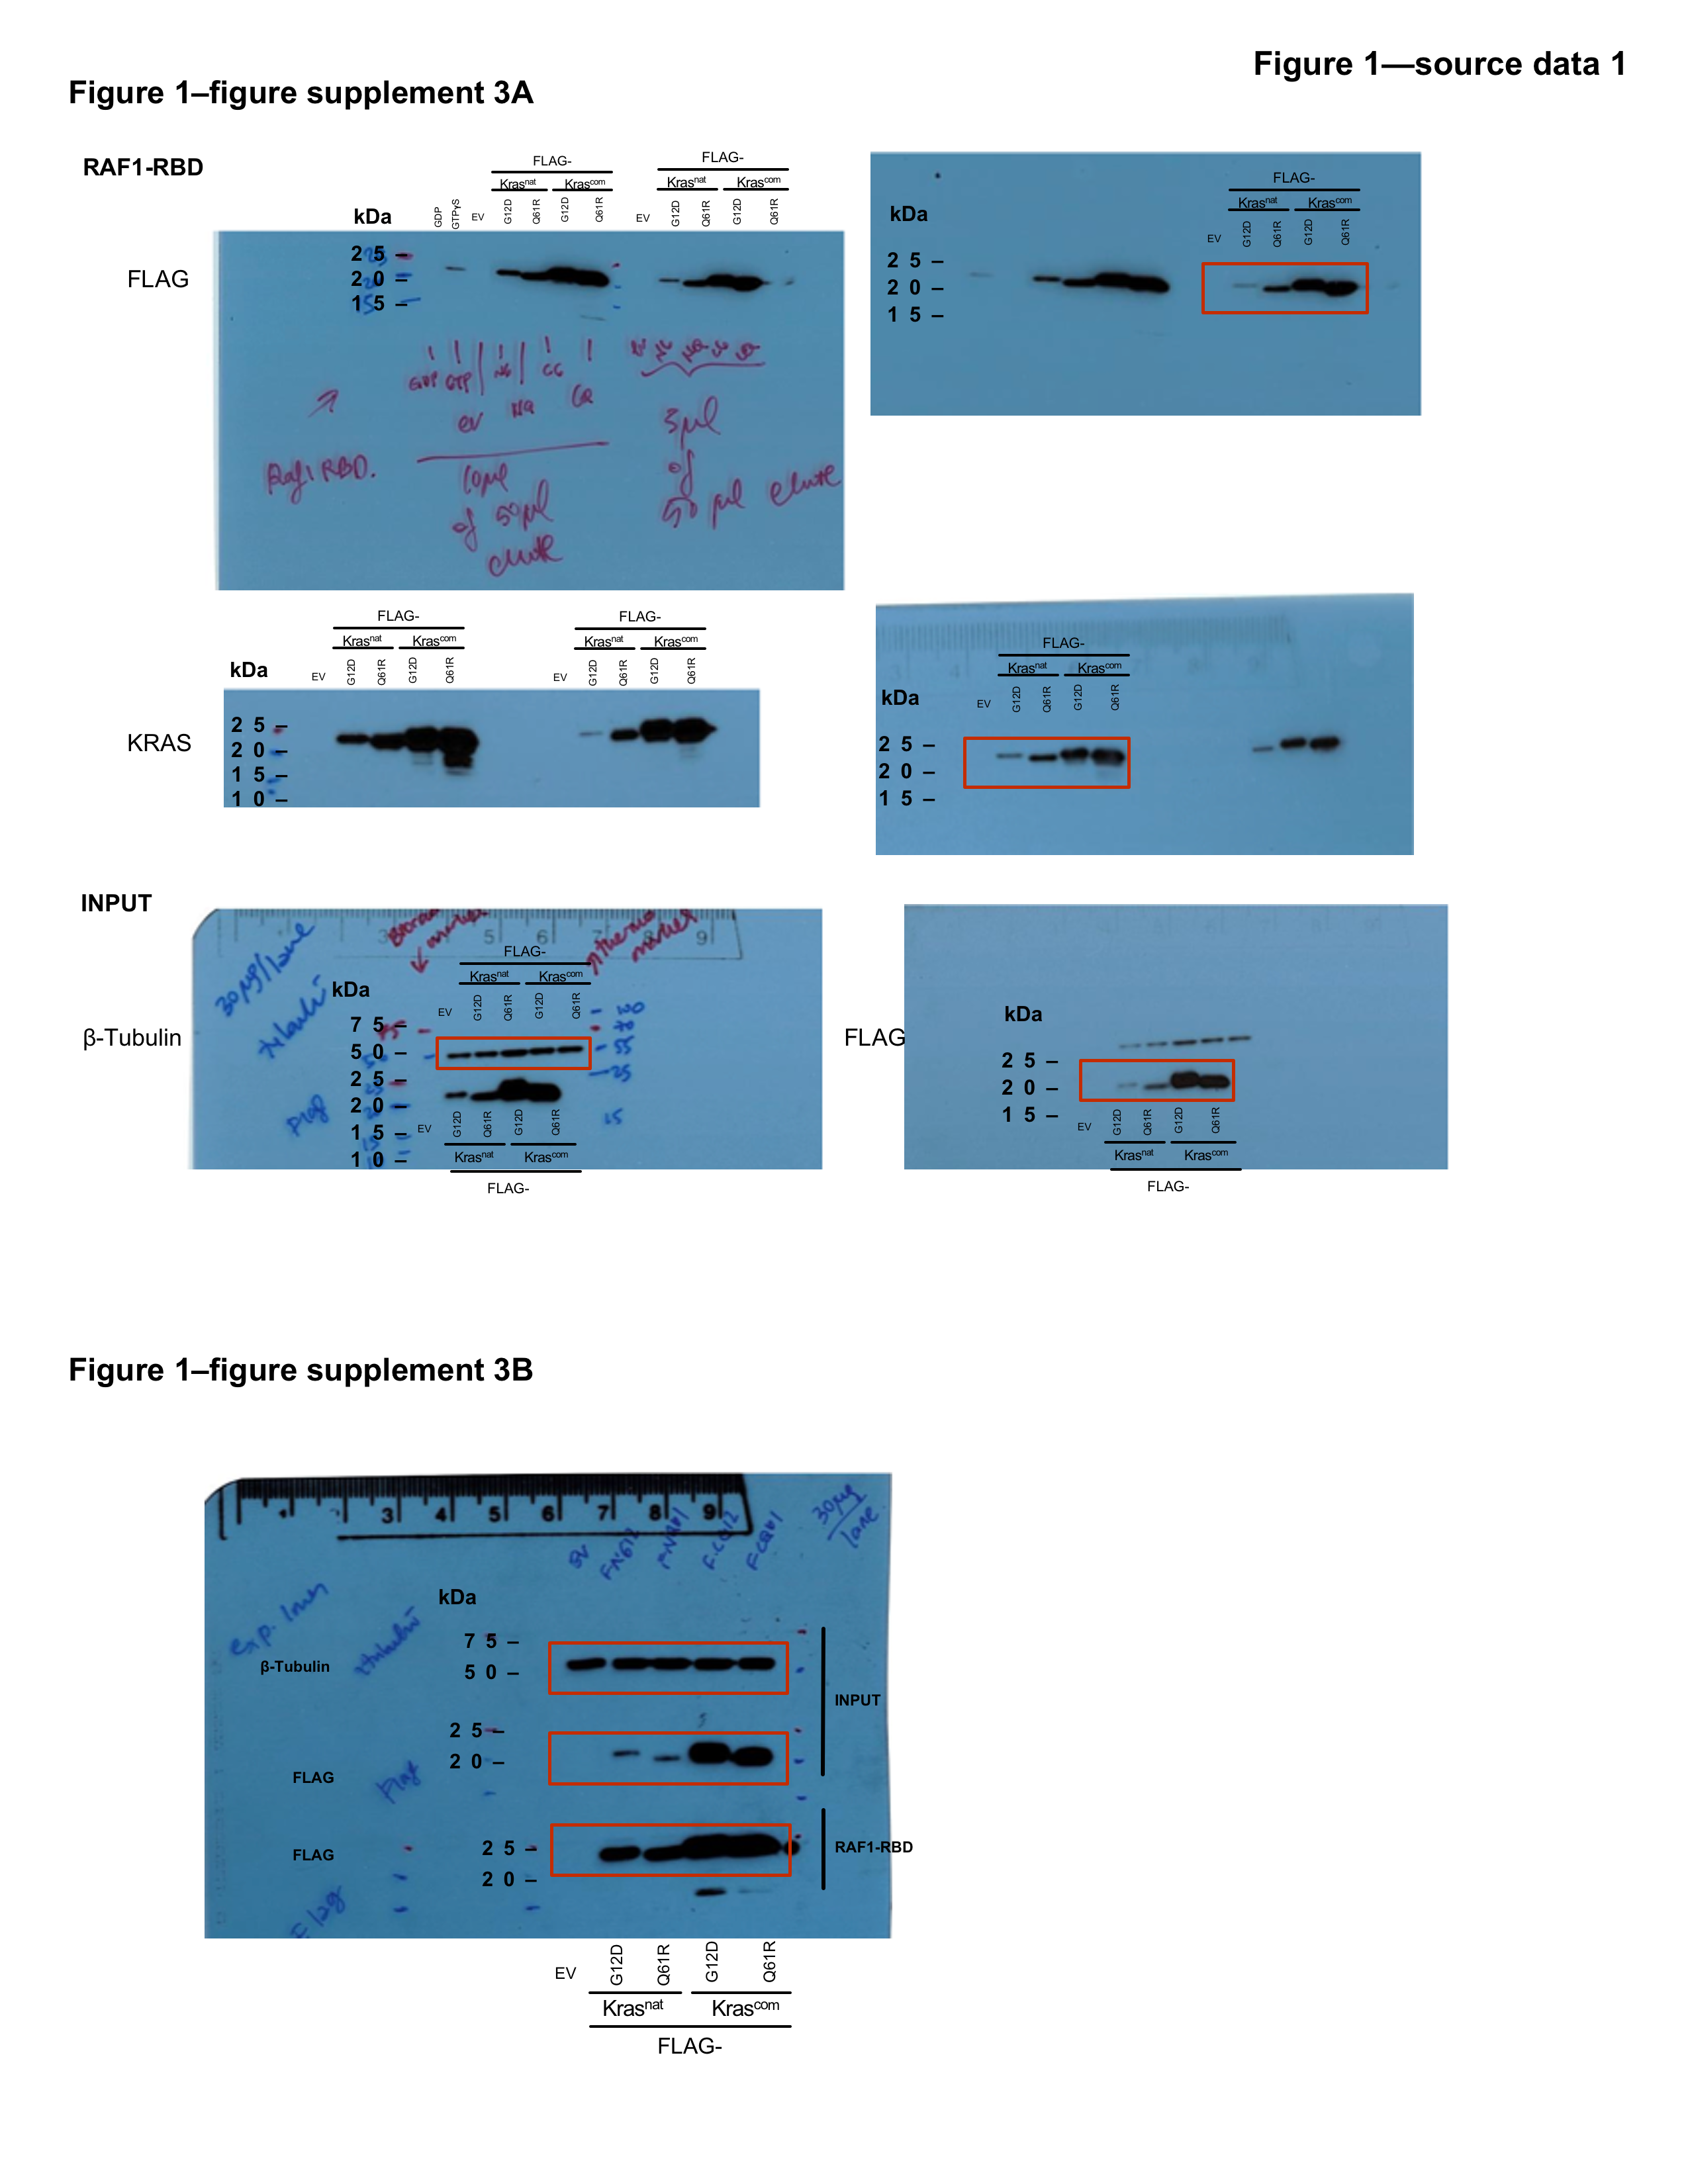
Figure 1—source data 1
Full-length gel images of RBD pull downs.
Full-length gel images from RAF1-RBD pull downs (top) and whole-cell lysates (bottom) from HEK-HTs ectopically expressing engineered Kras constructs shown in Figure 1—figure supplement 2.
- https://cdn.elifesciences.org/articles/75715/elife-75715-fig1-data1-v1.png
-
Figure 1—source data 2
Full-length gel image of genotyping of mouse embryonic fibroblast (MEF) cultures derived from the KrasLSL alleles in Figure 1B.
PCR genotyping of two independently derived MEF cultures with the indicated KrasLSL alleles in the absence and presence of Cre recombinase (CRE) to detect the unaltered wild-type Kras allele product (WT, 488 bp) as well as the unrecombined (KrasLSL, 389 bp) and recombined (LoxP recombined, 616 bp) Kras allelic products. Gel images were color inverted for better visualization. Red box depicts region shown in Figure 1B.
- https://cdn.elifesciences.org/articles/75715/elife-75715-fig1-data2-v1.zip
-
Figure 1—source data 3
Full-length gel images of RBD pull-downs in MEFs.
Full-length gel images from RBD pull-downs (left) and whole-cell lysates (right) from MEFs derived from KrasLSL alleles with serum starvation, or serum starvation followed by serum stimulation shown in Figure 1C, and same conditions with a second clone of MEF cultures with serial dilutions of 500 μg lysate (left) and 200 μg lysate (right) used for RBD-PD as shown in Figure 1—figure supplement 3. Red box depicts regions shown in Figure 1C and Figure 1—figure supplement 3.
- https://cdn.elifesciences.org/articles/75715/elife-75715-fig1-data3-v1.png
-
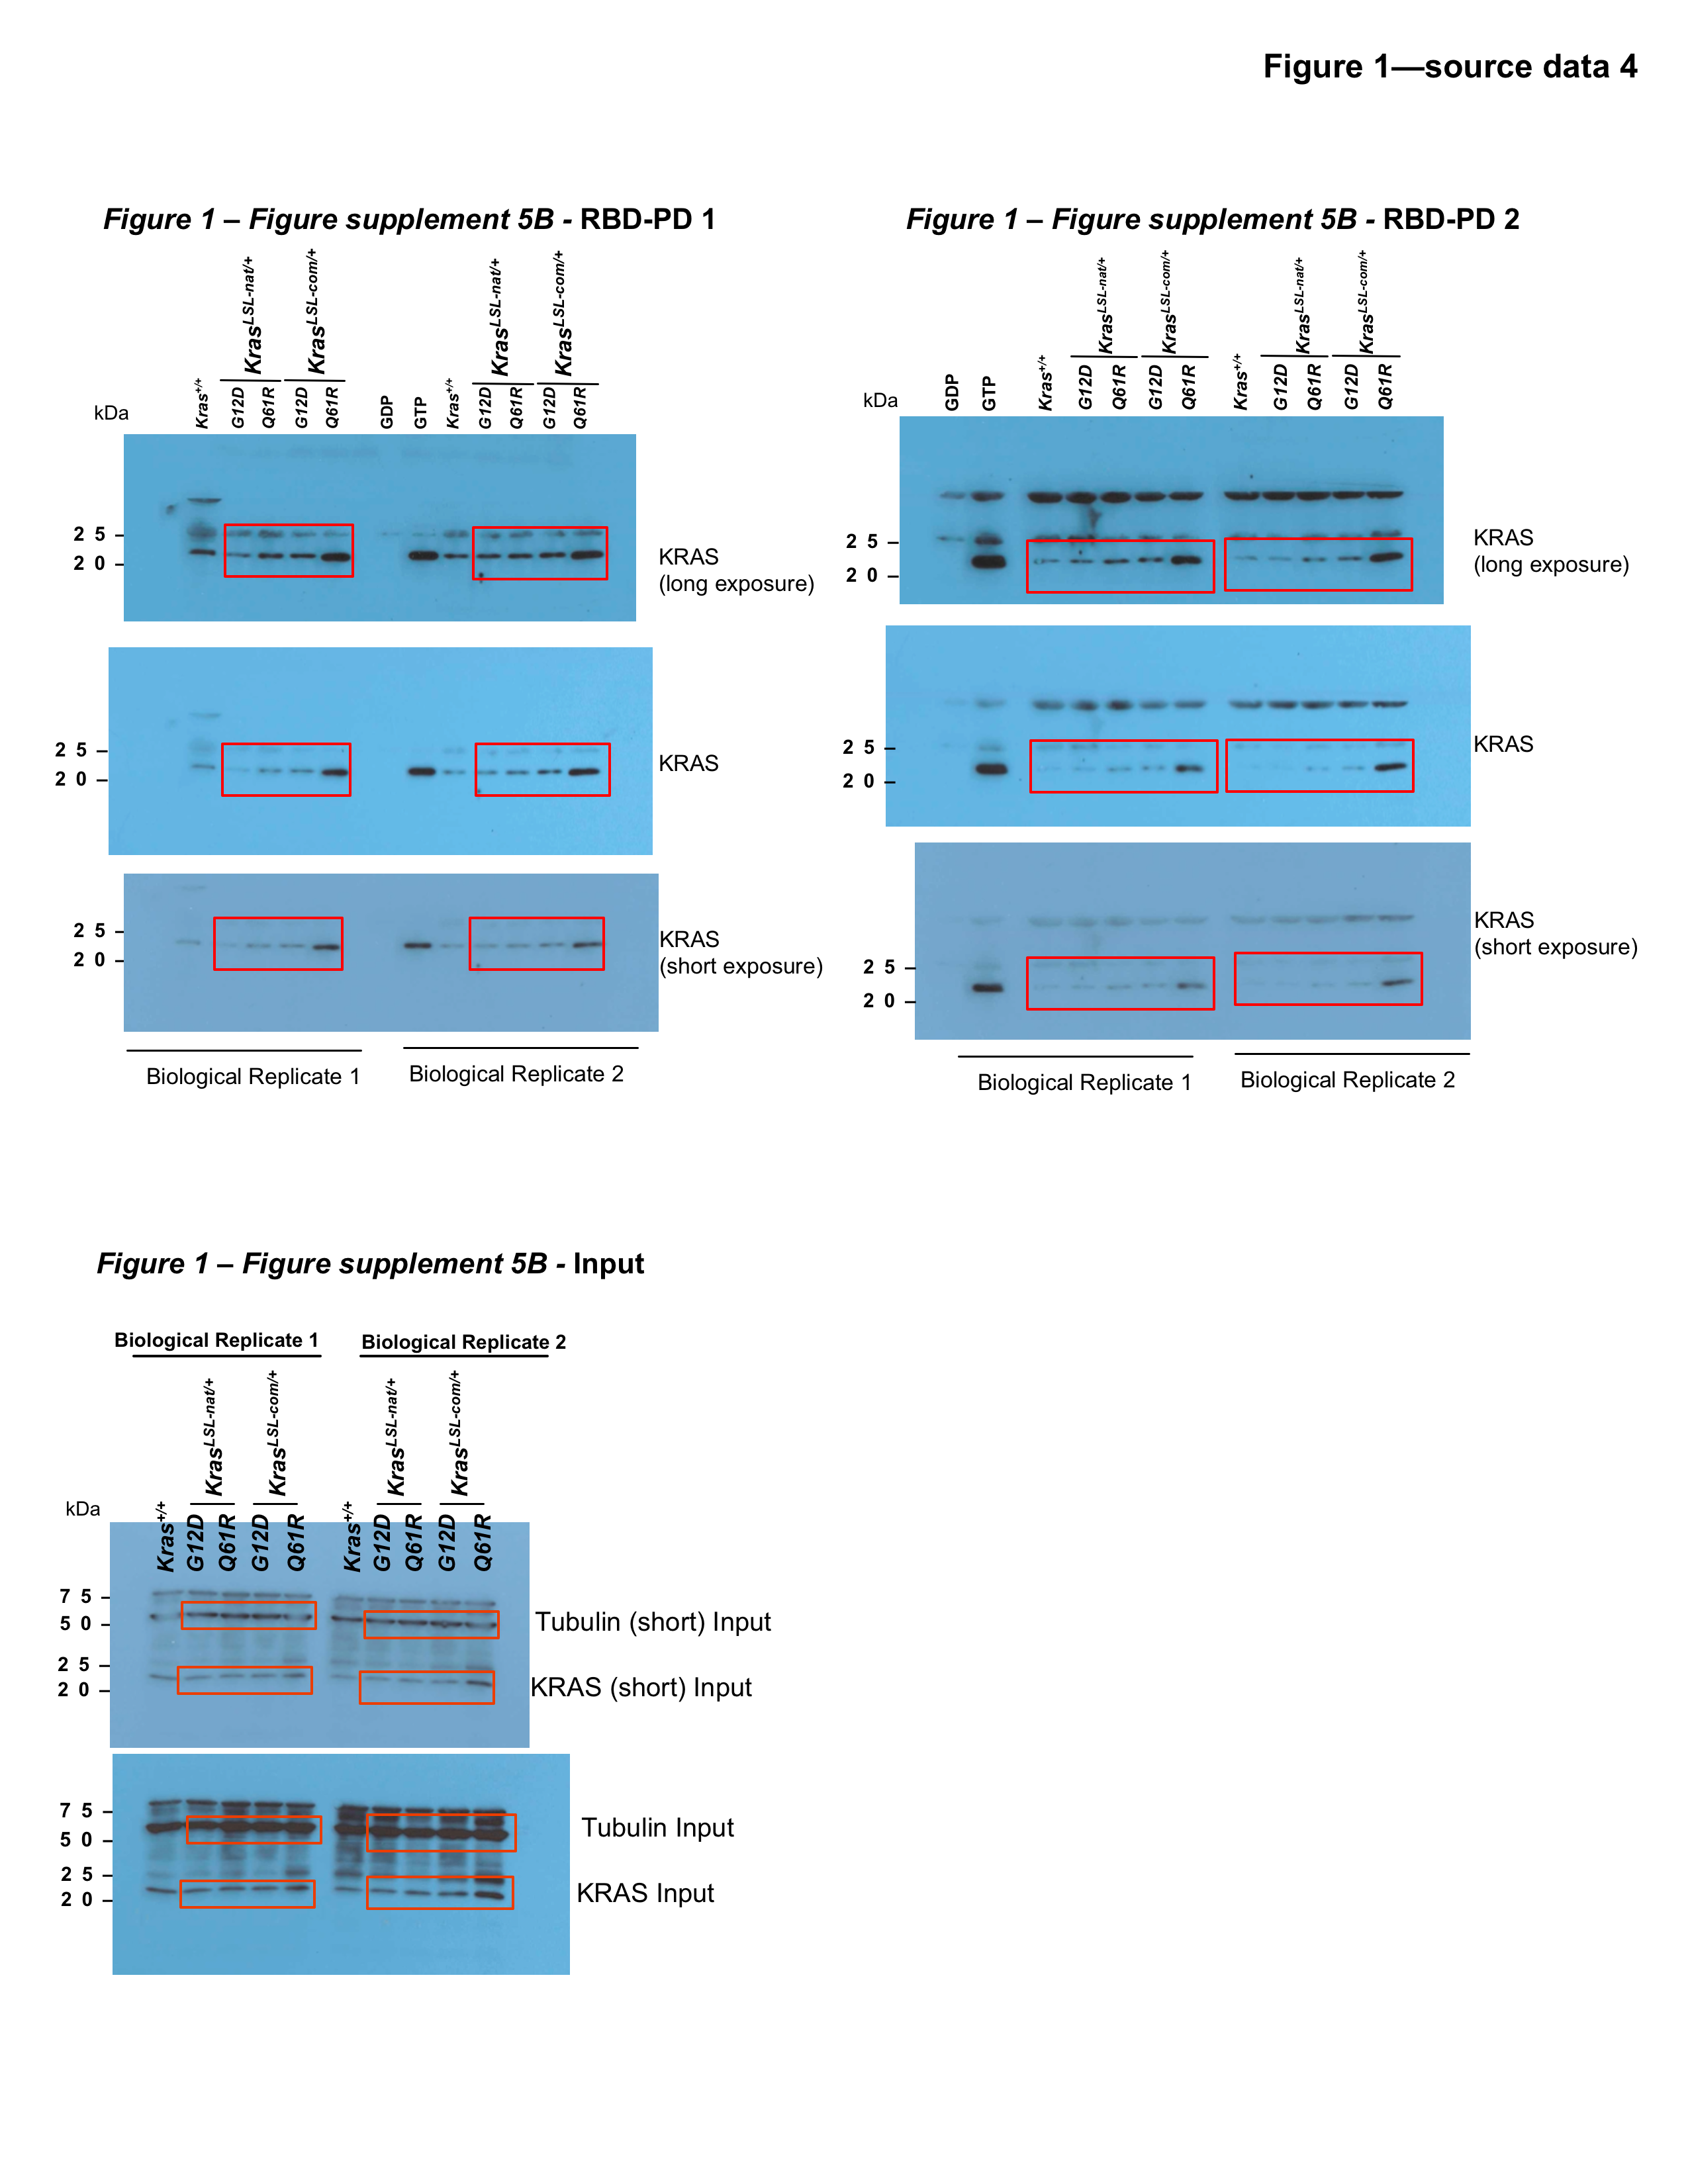
Figure 1—source data 4
Full-length gel images of Kras expression and activity using RBD pull-downs from lung tissue.
Full-length gel images from RAF1-RBD pull-downs (RBD-PD, top) and whole-cell lysates (bottom) of lungs from mice with KrasLSL alleles seven days after tamoxifen injection as shown in Figure 1—figure supplement 4A. Immunoblots of two separate pull downs from two biological replicates are shown as in Figure 1—figure supplement 4B. Red box depicts the regions shown in Figure 1—figure supplement 4B.
- https://cdn.elifesciences.org/articles/75715/elife-75715-fig1-data4-v1.png
-
Figure 1—source data 5
Ct values from the qRT-PCR analysis in Figure 1—figure supplement 5.
- https://cdn.elifesciences.org/articles/75715/elife-75715-fig1-data5-v1.xlsx
-
Figure 1—source data 6
Sequence of coding exons 1 to 3 of the four KrasLSL alleles.
Sequence alignment of the codons in the coding exons 1 to 3 of the indicated KrasLSL alleles in comparison to the murine wild-type sequence (Kras). Top: amino acid sequence. Red nucleotides: optimized codons. Green highlight: G12D mutation. Blue highlight: Q61R mutation.
- https://cdn.elifesciences.org/articles/75715/elife-75715-fig1-data6-v1.xlsx
Figure 1—figure supplement 1
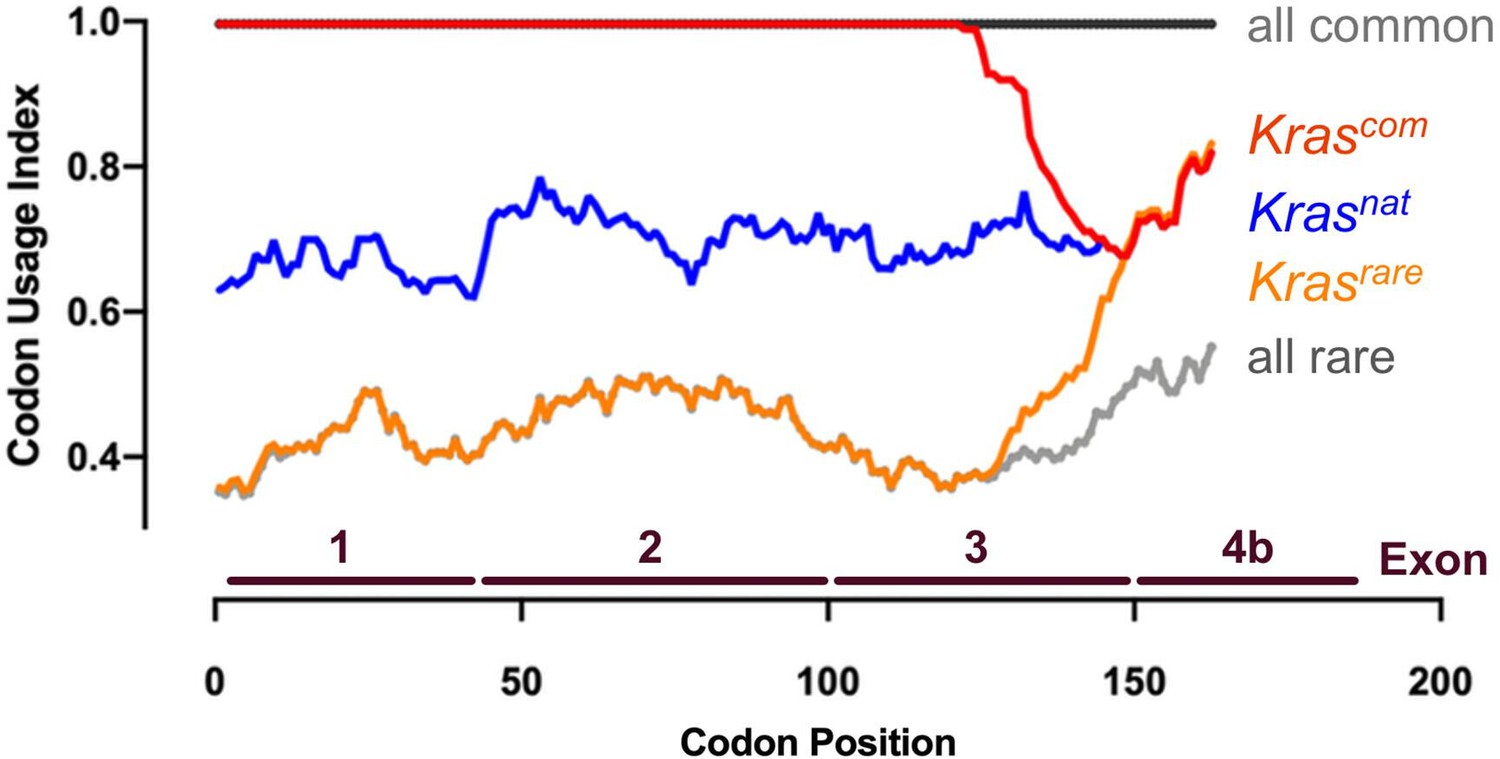
Codon usage of the four novel KrasLSL alleles.
Codon usage index versus codon position of Kras with native (nat, blue line), common (com, red line), and rare (rare, orange line) codons. Maximum rare (all rare, gray dotted line) and common (all common, solid black line) codon usage is shown for reference.
Figure 1—figure supplement 2
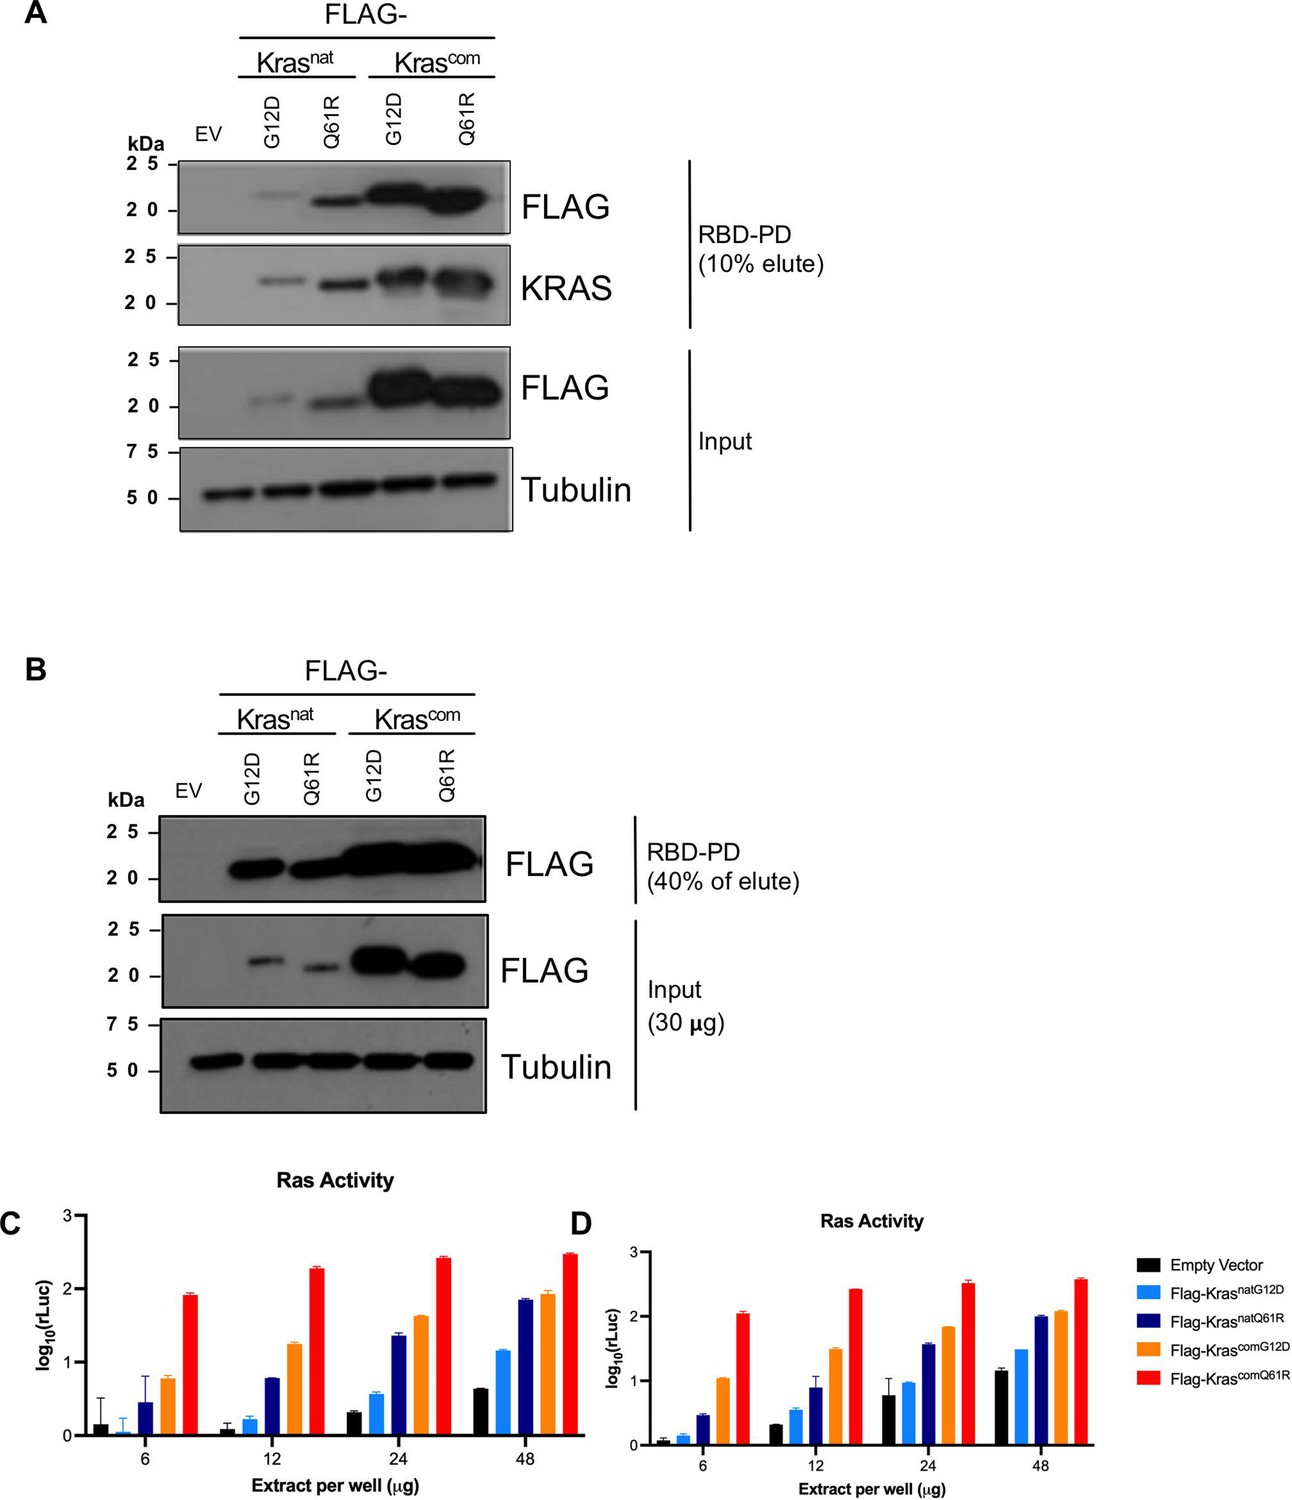
Expression and activity level of proteins encoded by cDNA versions of the four KrasLSL alleles.
Expression levels, determined by immunoblot with an anti-FLAG antibody, and activity levels, determined by RBD pull-down (RBD-PD) followed by (A, B) immunoblots of lysates derived from HEK-HT cells transiently expressing the indicated FLAG-tagged Kras proteins and (C, D) by ELISA (n=2). (A, B) and (C, D) are two biological replicates. Tubulin and empty vector (EV) serve as loading and negative controls, respectively. Full-length gel images are provided in Figure 1—source data 1.
Figure 1—figure supplement 3
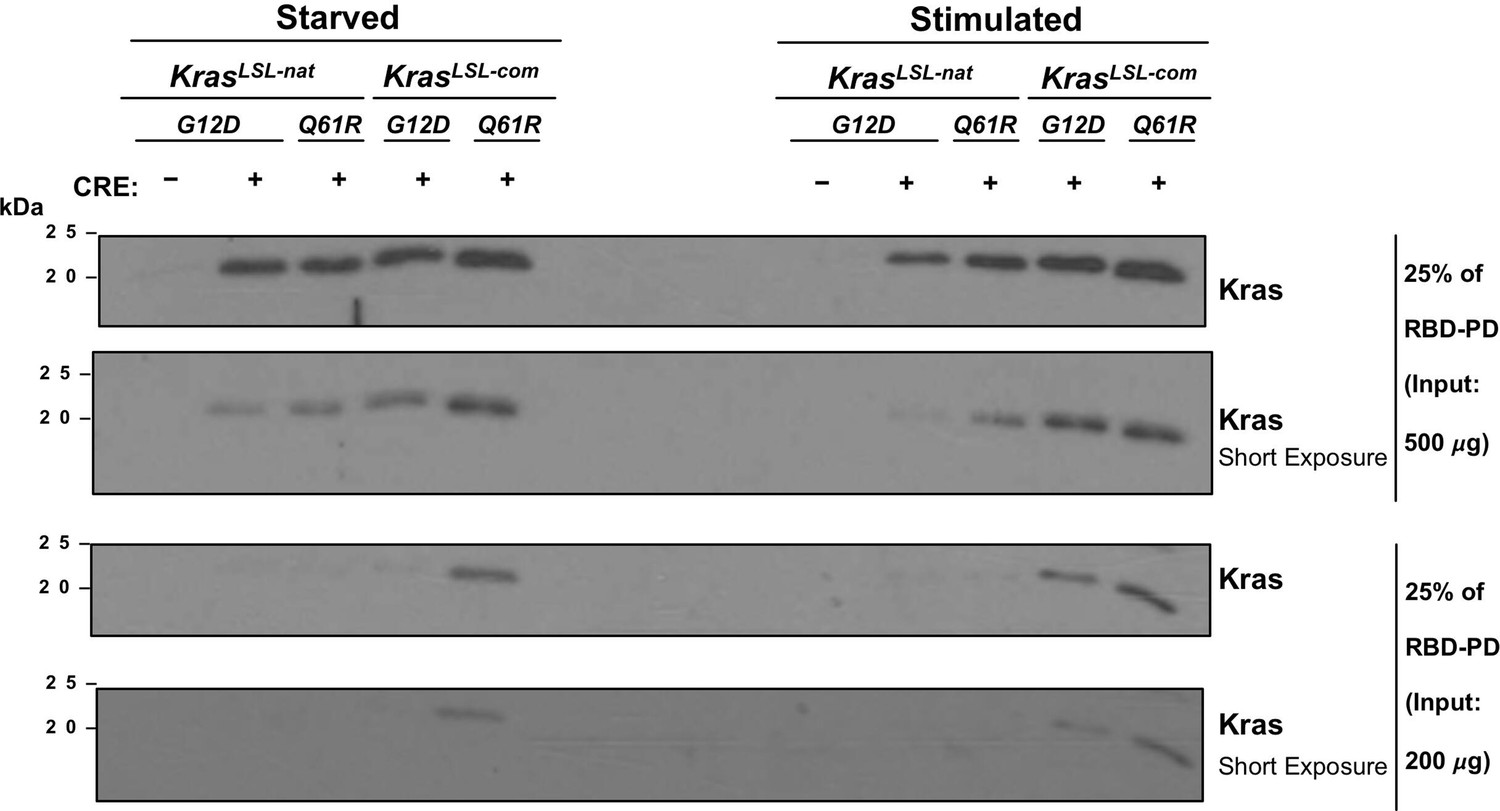
Second replicate of RBD pull-down assays from Figure 1C.
RBD pull-down (RBD-PD) of lysates of mouse embryonic fibroblast (MEF) cells derived from the indicated KrasLSL alleles in the presence of Cre recombinase (CRE) after serum starvation overnight (Starved) or then stimulated with serum for 5 min (Stimulated). RBD-PD was performed with two serial dilutions of 500 μg (top) and 200 μg (bottom) MEF lysates. Lysates of KrasLSL-natG12D/+ MEFs in the absence of Cre recombinase serve as negative controls. Full-length gel images are provided at Figure 1—source data 3.
Figure 1—figure supplement 4
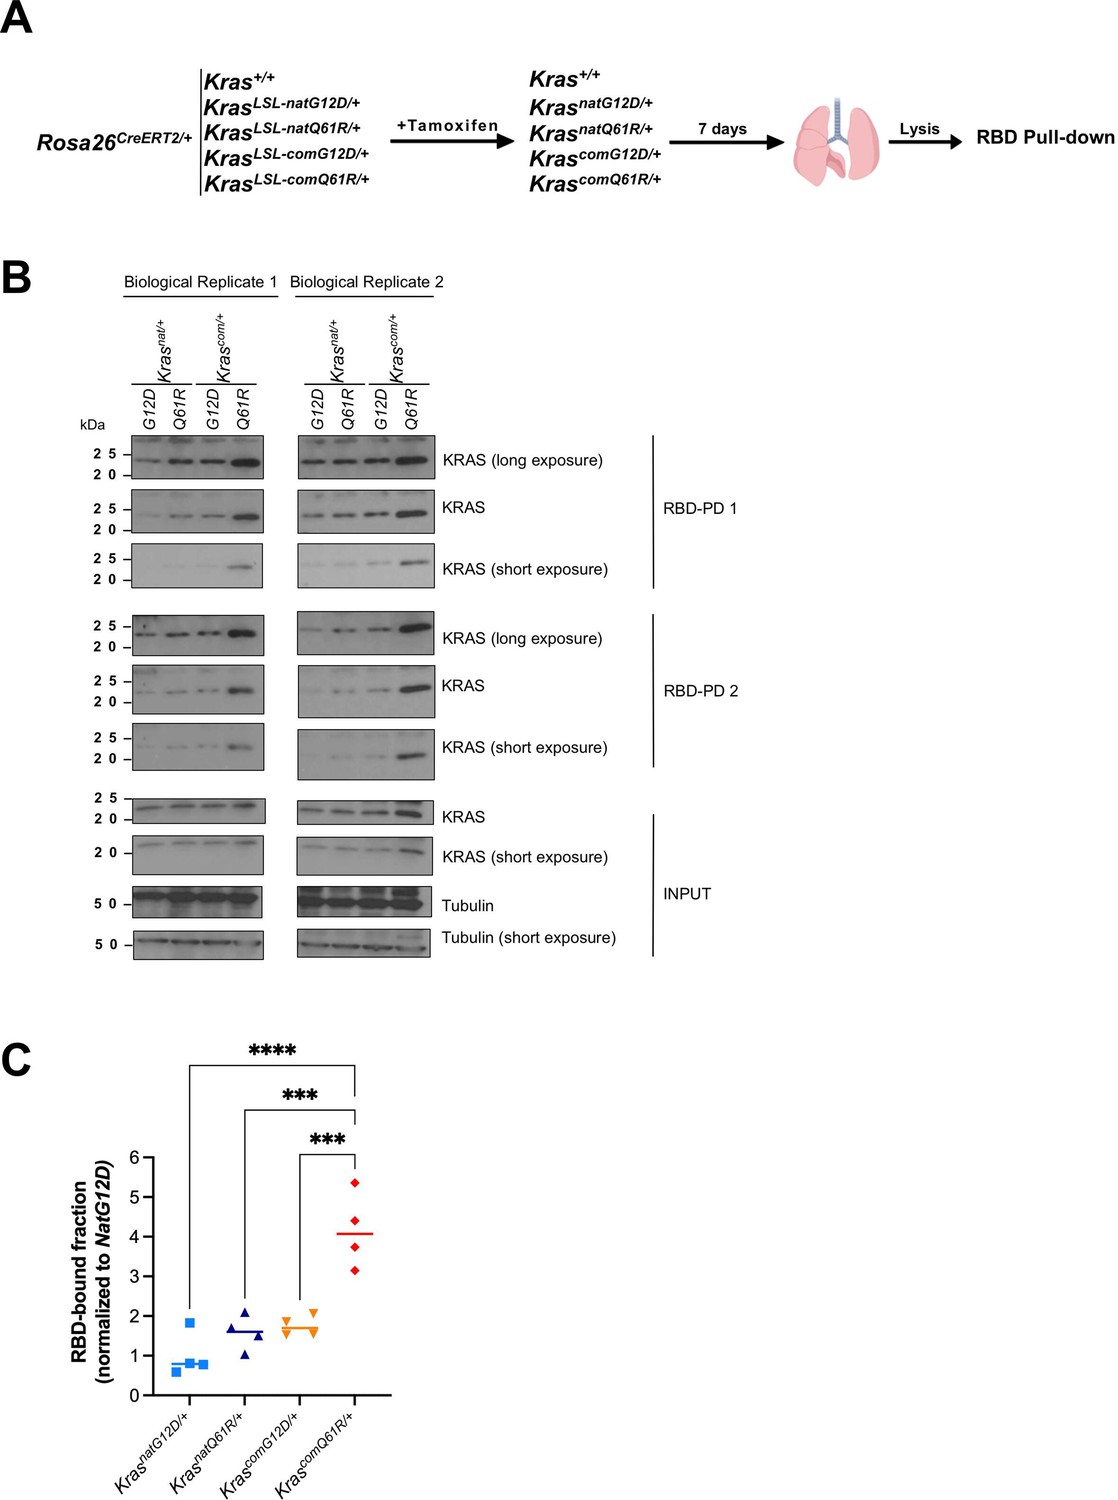
Expression and activity levels in the lung upon activating each KrasLSL allele.
(A) Schematic of the experimental design. Two mice from cohorts of KrasLSL-natG12D/+, KrasLSL-natQ61R/+, KrasLSL-comG12D/+, and KrasLSL-comQ61R/+ in a Rosa26CreERT2/+ background, injected with tamoxifen at six to eight weeks of age, seven days later the lungs were removed at the time of necropsy, and protein lysates were subjected to the RBD pull-down (RBD-PD) assay. Two Rosa26CreERT2/+ mice were treated similarly as a control. (B) RAF1-RBD pull-down (RBD-PD) of lysates of lungs from the indicated KrasLSL alleles after tamoxifen injection. 20% of the RBD pull-downs were immunoblotted for Kras. Immunoblots of two separate pull downs from total lung lysates are shown as RBD-PD 1 and RBD-PD 2. 30 μg total protein was loaded in each lane as input. (C) The ratio of median Kras activity levels determined by densitometry in each genotype in comparison to the KrasnatG12D/+ allele, calculated from both technical and biological replicates in (B). p-Values calculated by one-way ANOVA multiple pairwise comparisons with Tukey testing (C). ***p<0.001, ****p<0.0001. Full-length gel images are provided in Figure 1—source data 4.
Figure 1—figure supplement 5

qRT-PCR validates an increase in RAS target gene expression with increased Kras activity.
qRT-PCR validates an increase in RAS target gene expression with increased Kras activity. Two mice from cohorts of KrasLSL-natG12D/+, KrasLSL-natQ61R/+, KrasLSL-comG12D/+, and KrasLSL-comQ61R/+ in a Rosa26CreERT2/+ background, injected with tamoxifen at six to eight weeks of age and RNA was extracted from lungs seven days later. Two Rosa26CreERT2/+ mice were treated similarly as a control (A). First-strand cDNA synthesis and qRT-PCR of selected genes downstream ERK/MAPK pathway were performed using GoTaq 2-Step RT-qPCR kit (B, C). All measurements were normalized against Actin as the internal control using the 2-ΔΔCt method (n=3). (B, C) Biological replicates. Measurements are provided in Figure 1—source data 5.
Figure 1—figure supplement 6
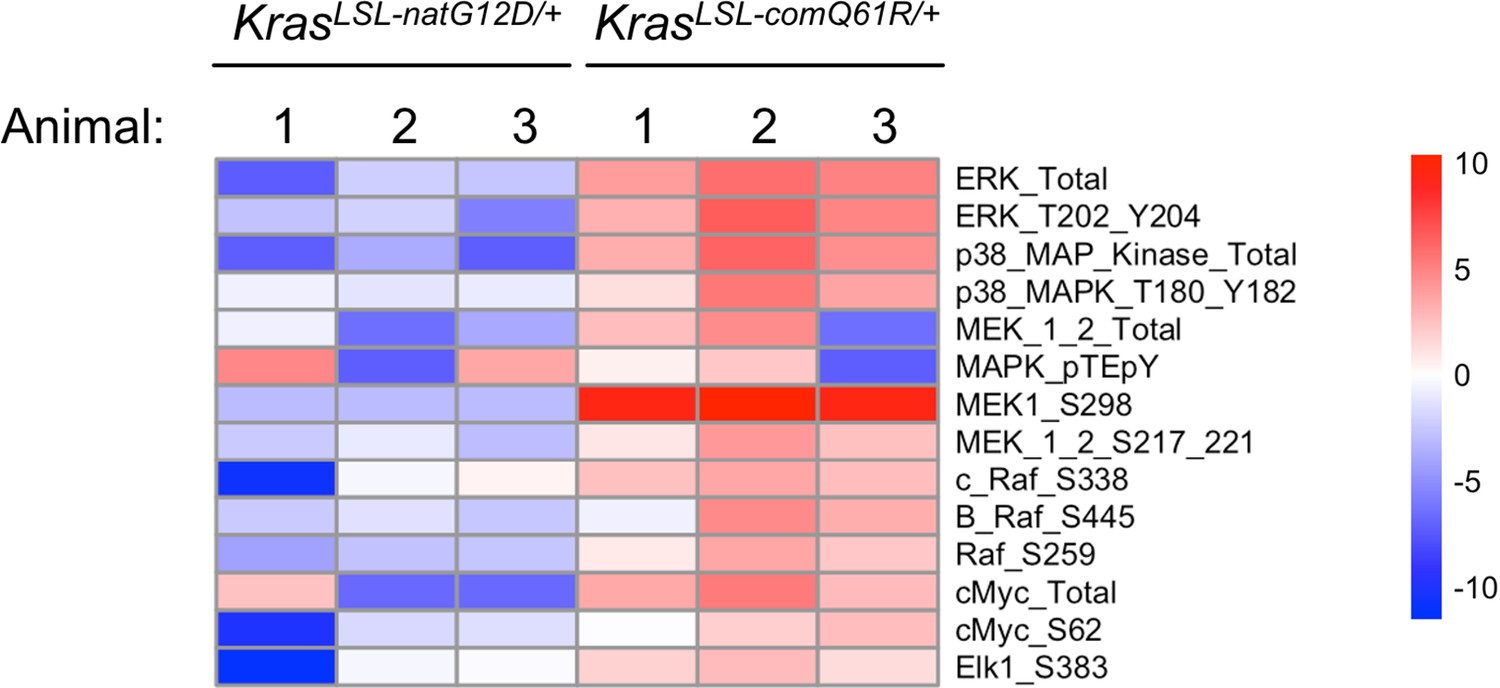
RPPA analysis of proteins and phosphoproteins within the MAPK signaling in the lung upon activation of KrasLSL-natG12D/+ versus KrasLSL-comQ61R/+.
Heatmap of the log2 fold change of the average abundance of protein and phosphorylated proteins within the MAPK pathway via RPPA analysis upon activation of the KrasLSL-natG12D/+ and KrasLSL-comQ61R/+ alleles in comparison to the wild-type Kras allele. Data is representative of three technical replicates from three biological replicates.
Figure 2 with 1 supplement

Biological effect upon activating each oncogenic Kras allele.
(A) Examples of H&E-stained lung sections and (B) the mean ± SD % tumor burden from microscopic analysis of two lung sections from five mice with the indicated KrasLSL alleles in a CC10CreER/+;Rosa26CAG-fGFP/+ background at each of the indicated times post-tamoxifen injection.
Figure 2—figure supplement 1

Tumor phenotypes track with intrinsic oncogenic Kras signaling.
(A) Schematic of the experimental design. (B) Percentage of mice with at least one visible lung lesion. (C) Representative H&E staining of lungs and (D) mean ± SD% tumor burden from microscopic analysis of two lung sections from two CC10CreER/+;Rosa26CAG-fGFP/+;Kras+/+ mice 13 months after tamoxifen. (E, F) Predominant proliferative lesions in lungs of CC10CreER/+;Rosa26CAG-fGFP/+;KrascomG12D/+ and CC10CreER/+;Rosa26CAG-fGFP/+;KrascomQ61R/+ differ. Photomicrograph of lung section from (E) CC10CreER/+;Rosa26CAG-fGFP/+;KrascomG12D/+ mouse at 4 months showing multiple large pulmonary adenomas, and (F) CC10CreER/+;Rosa26CAG-fGFP/+;KrascomQ61R/+ mouse at 1 month showing extensive proliferation of airway epithelium into papillary projections of hyperplastic and dysplastic cells as well as pulmonary adenoma. H&E staining, ×40 magnification.
Figure 3 with 9 supplements
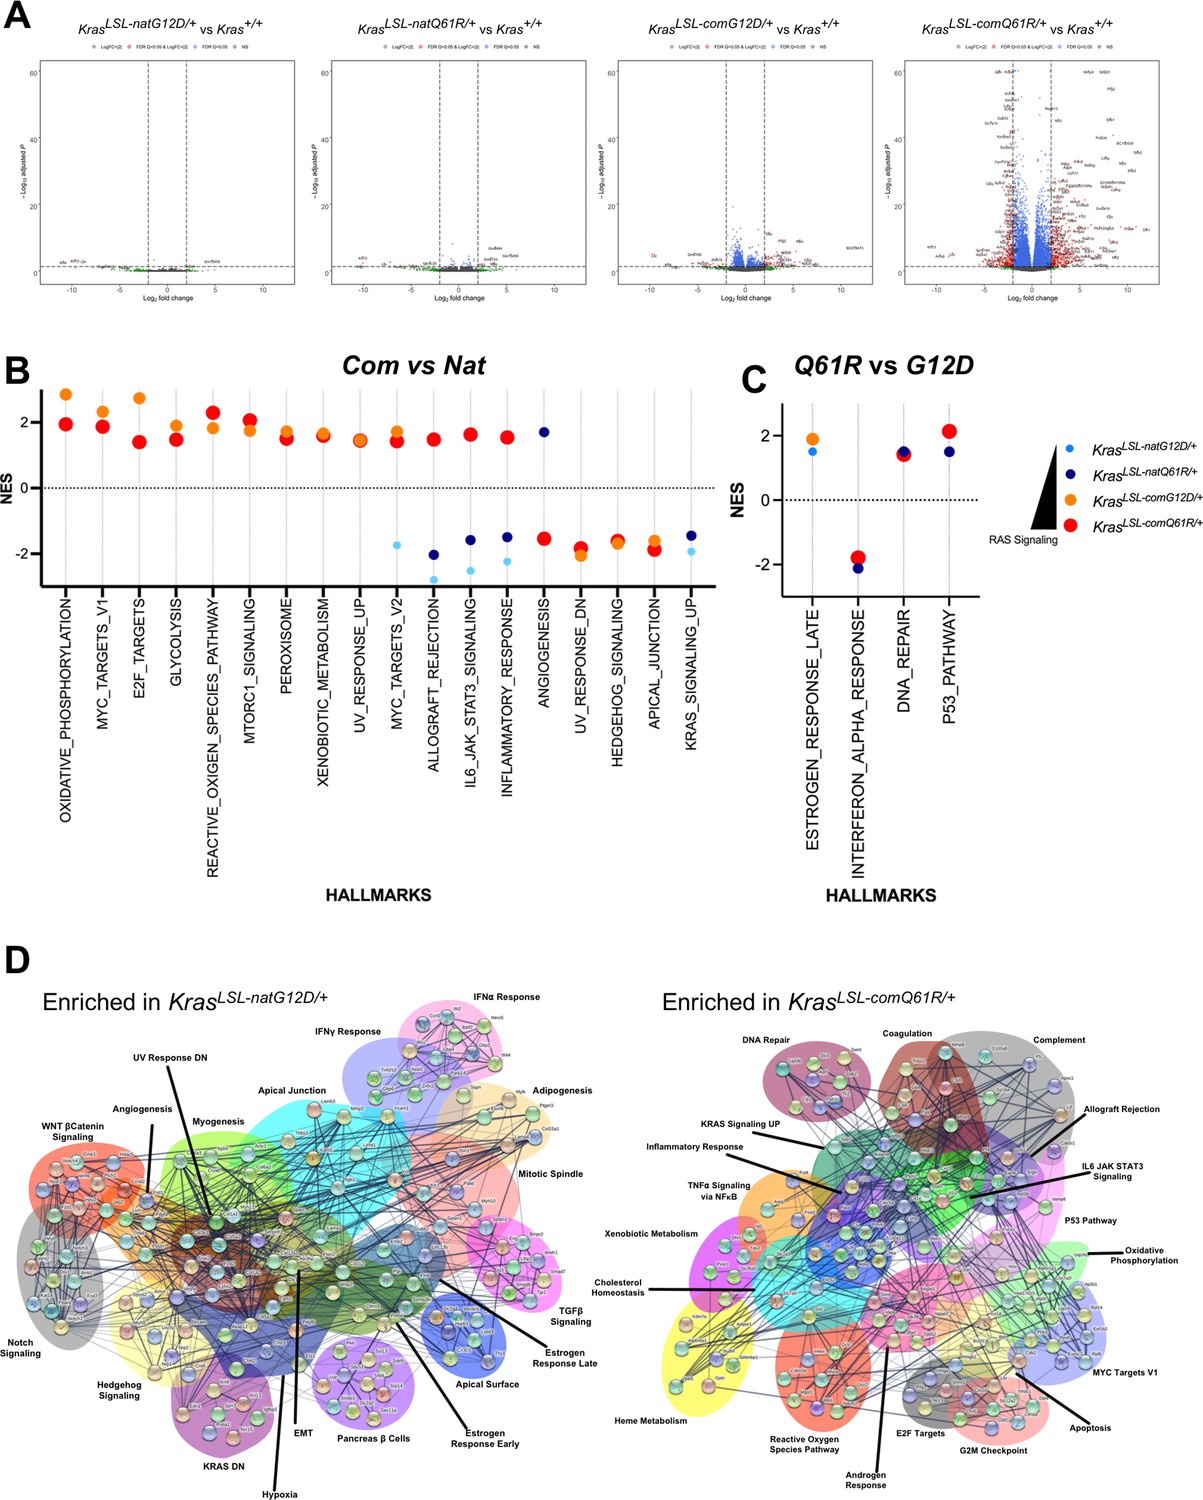
Lung transcriptome induced by each oncogenic Kras allele.
(A) Volcano plot of the log2 fold change versus p-value of the genes showing differential expression in each allele compared to the wild-type (+/+) Kras allele in the lung. Full-sized plots are provided in Figure 3—figure supplements 2–5. (B, C) Normalized enrichment score and patterns of the indicated Gene Set Enrichment Analysis (GSEA) hallmarks differentially enriched by Kras codon usage (expression) (B) and mutation type (C). Only hallmarks with a false discovery rate (FDR) < 5% are shown. Dot size is adjusted to RAS activity for better visualization. All GSEA hallmarks differentially enriched upon activating KrasLSL alleles with an FDR < 5% are provided in Figure 3—figure supplement 7. (D) STRING analysis of the top ten genes in the differentially enriched GSEA hallmarks identified in RNA-seq analysis of the lungs of Rosa26CreERT2/+;KrasLSL-natG12D/+ versus Rosa26CreERT2/+;KrasLSL-comQ61R/+ mice seven days after tamoxifen injection.
-
Figure 3—source data 1
Differentially expressed genes in each allele from Figure 3—figure supplements 2–6.
- https://cdn.elifesciences.org/articles/75715/elife-75715-fig3-data1-v1.xlsx
-
Figure 3—source data 2
Normalized enrichment scores of the hallmarks identified in Figure 3—figure supplement 1C.
- https://cdn.elifesciences.org/articles/75715/elife-75715-fig3-data2-v1.xlsx
-
Figure 3—source data 3
Ct values from the qRT-PCR analysis in Figure 3—figure supplement 7.
- https://cdn.elifesciences.org/articles/75715/elife-75715-fig3-data3-v1.xlsx
Figure 3—figure supplement 1
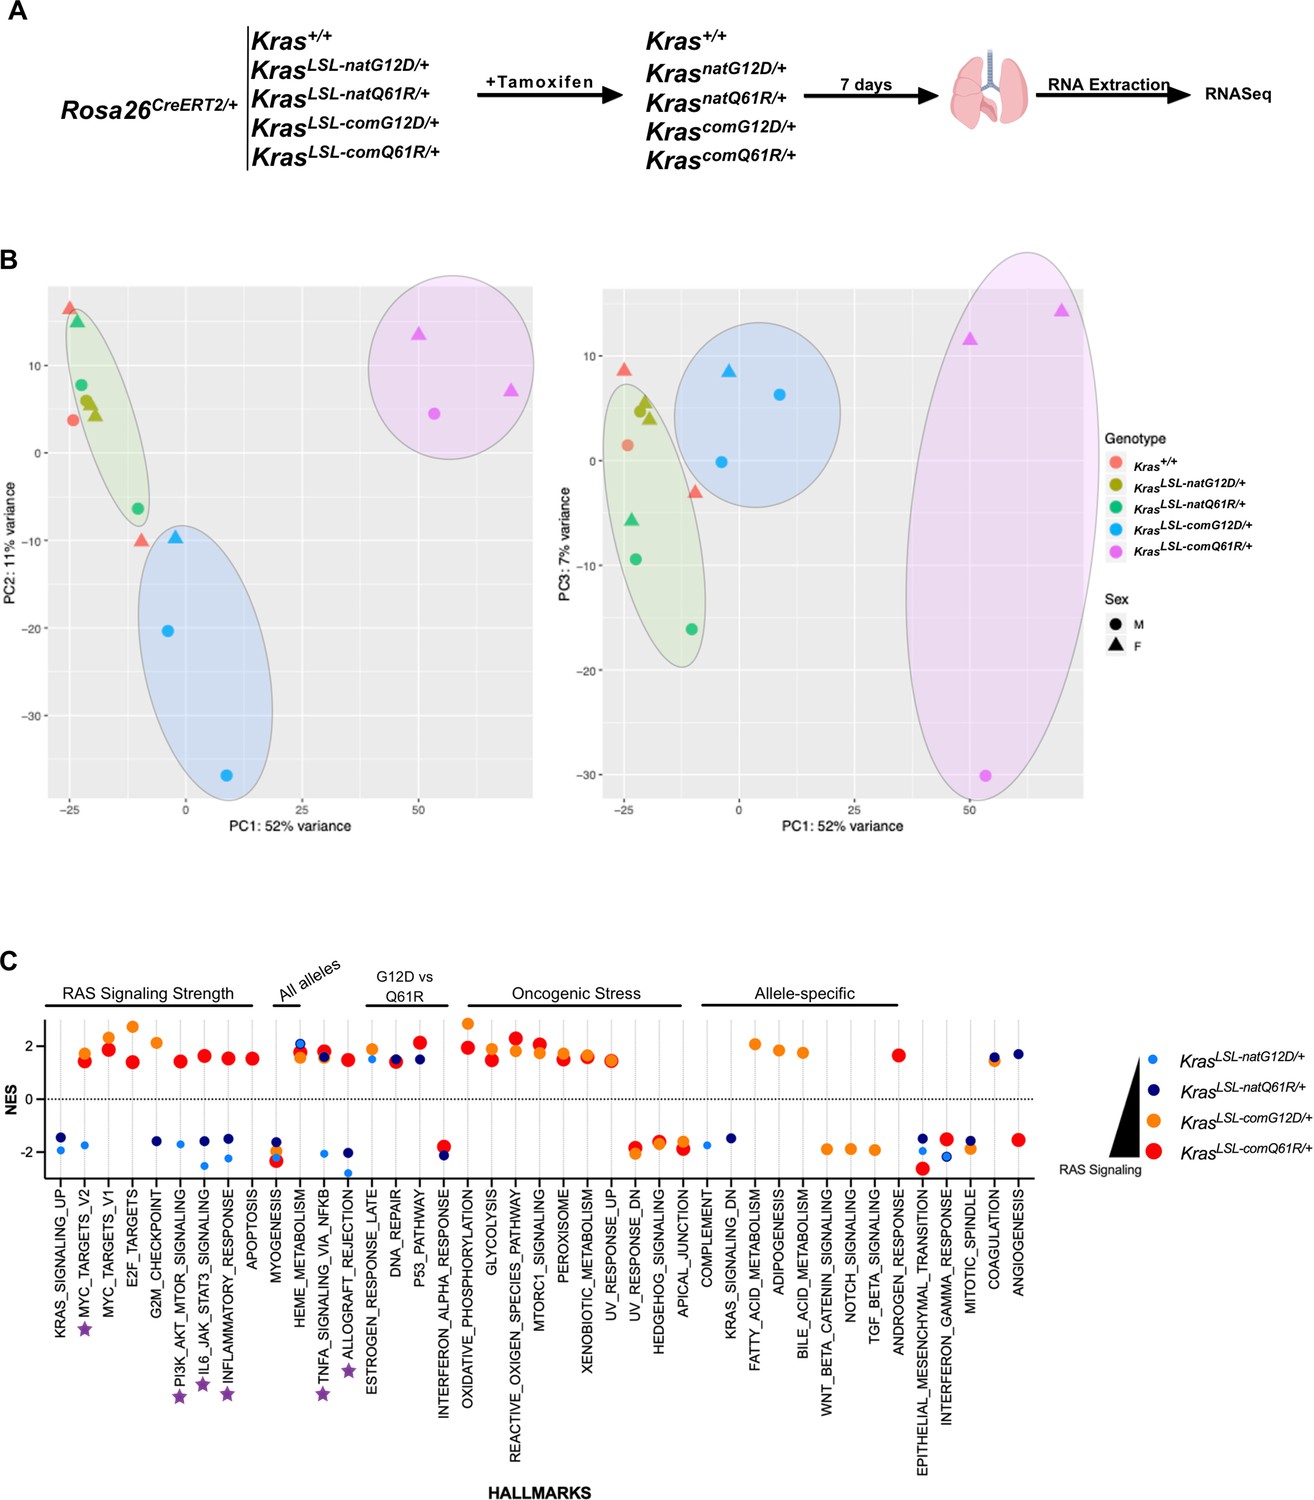
Lung transcriptome upon activating each KrasLSL allele.
(A) Schematic of the experimental design. (B) Principal component analysis of the transcriptome signatures of engineered alleles. Alleles with high quantitative signaling are highlighted with blue (KrascomG12D/+) and pink shade (KrascomQ61R/+), and alleles with and low signaling (Krasnat) in green shade. (C) Transcriptome Gene Set Enrichment Analysis (GSEA) hallmarks upon activating the panel of KrasLSL alleles. Purple stars show hallmarks that show enrichment or depletion patterns of hallmarks correlated with the Kras expression (enriched in Krascom and depleted in Krasnat). Only hallmarks with a false discovery rate (FDR) < 5% are shown. Dot size is adjusted according to RAS activity for better visualization.
Figure 3—figure supplement 2

Lung transcriptome upon activating the KrasLSL-natG12D allele.
Volcano plot of the log2 fold-change versus p-value of differentially expressed genes from RNA-seq analysis of the lungs of Rosa26CreERT2/+;KrasLSL-natG12D/+ versus Rosa26CreERT2/+;Kras+/+ mice seven days after tamoxifen injection.
Figure 3—figure supplement 3
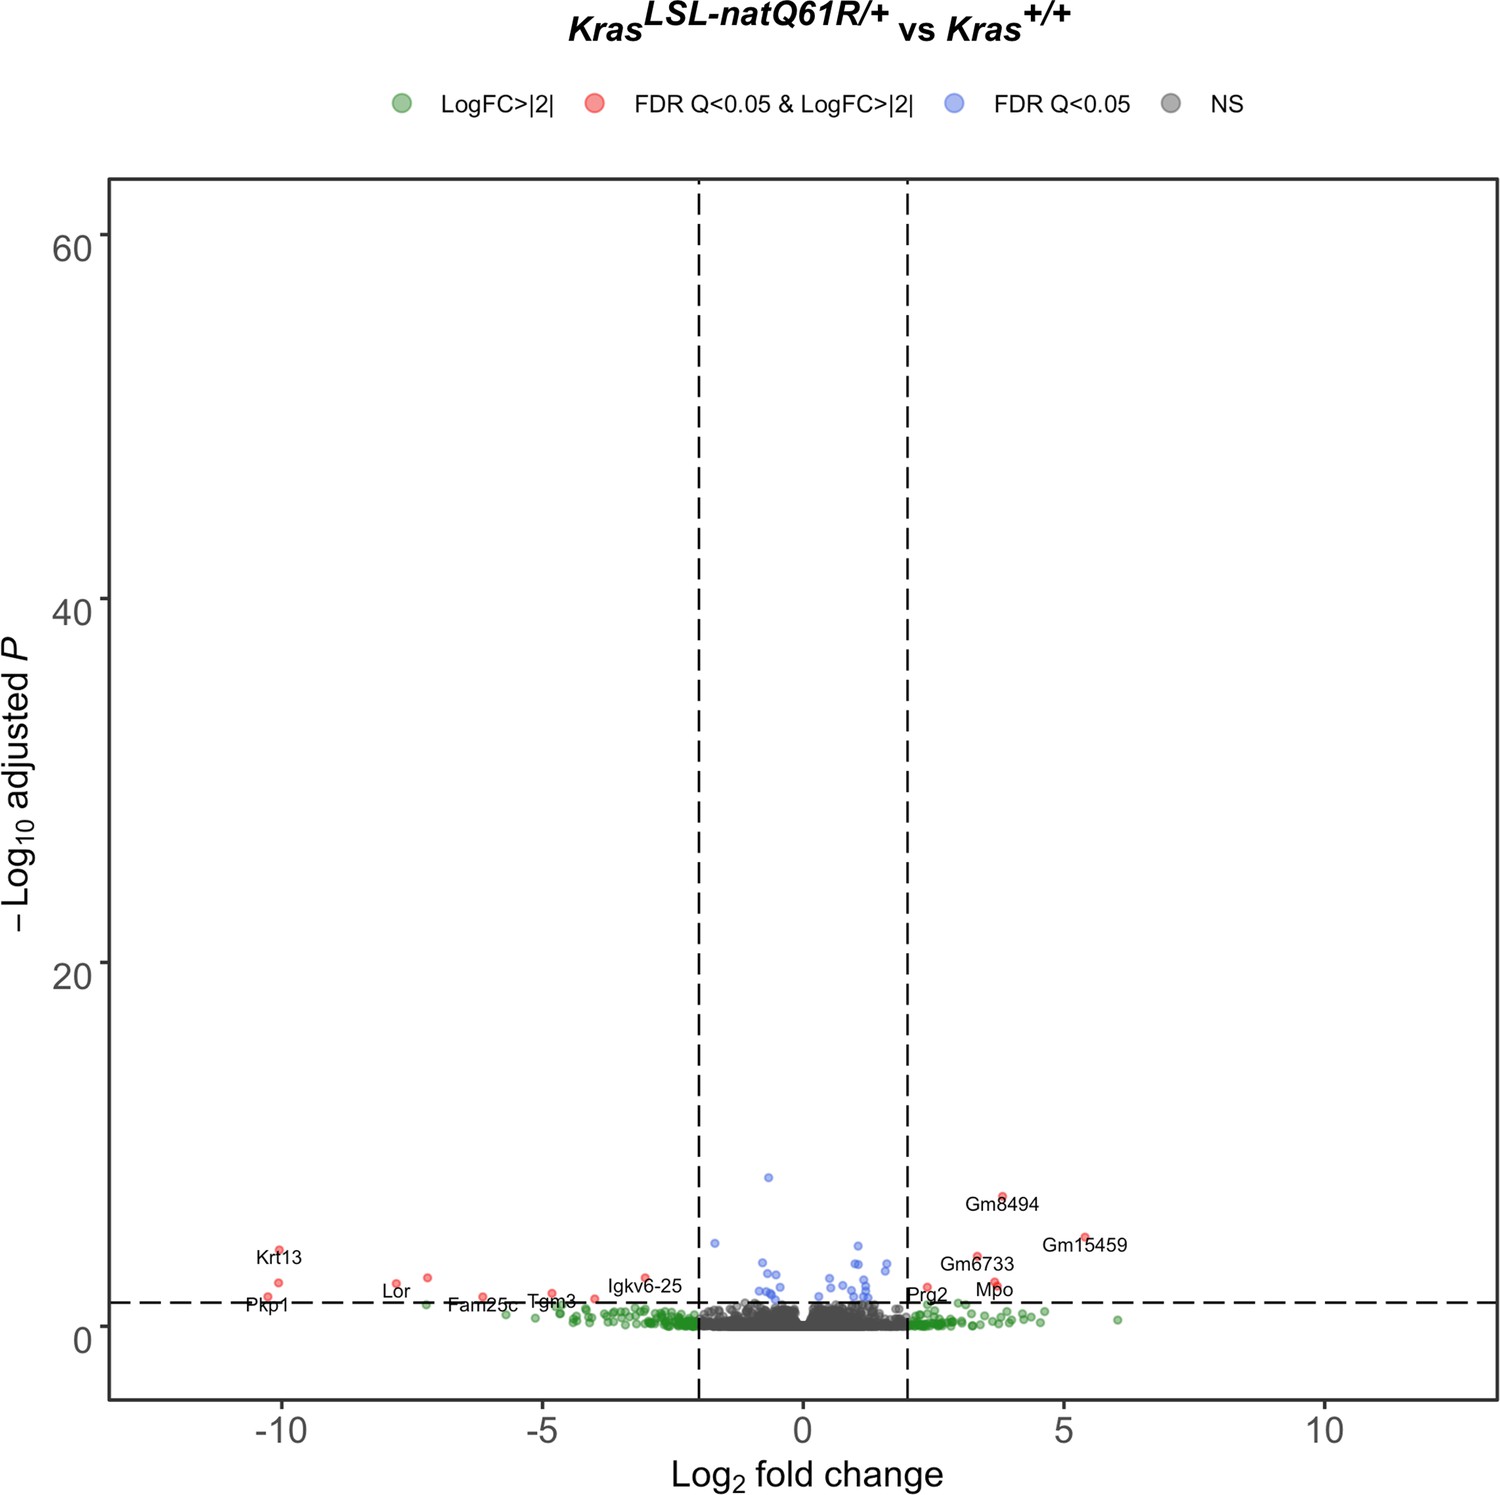
Lung transcriptome upon activating the KrasLSL-natQ61R allele.
Volcano plot of the log2 fold-change versus p-value of differentially expressed genes from RNA-seq analysis of the lungs of Rosa26CreERT2/+;KrasLSL-natQ61R/+ versus Rosa26CreERT2/+;Kras+/+ mice seven days after tamoxifen injection.
Figure 3—figure supplement 4
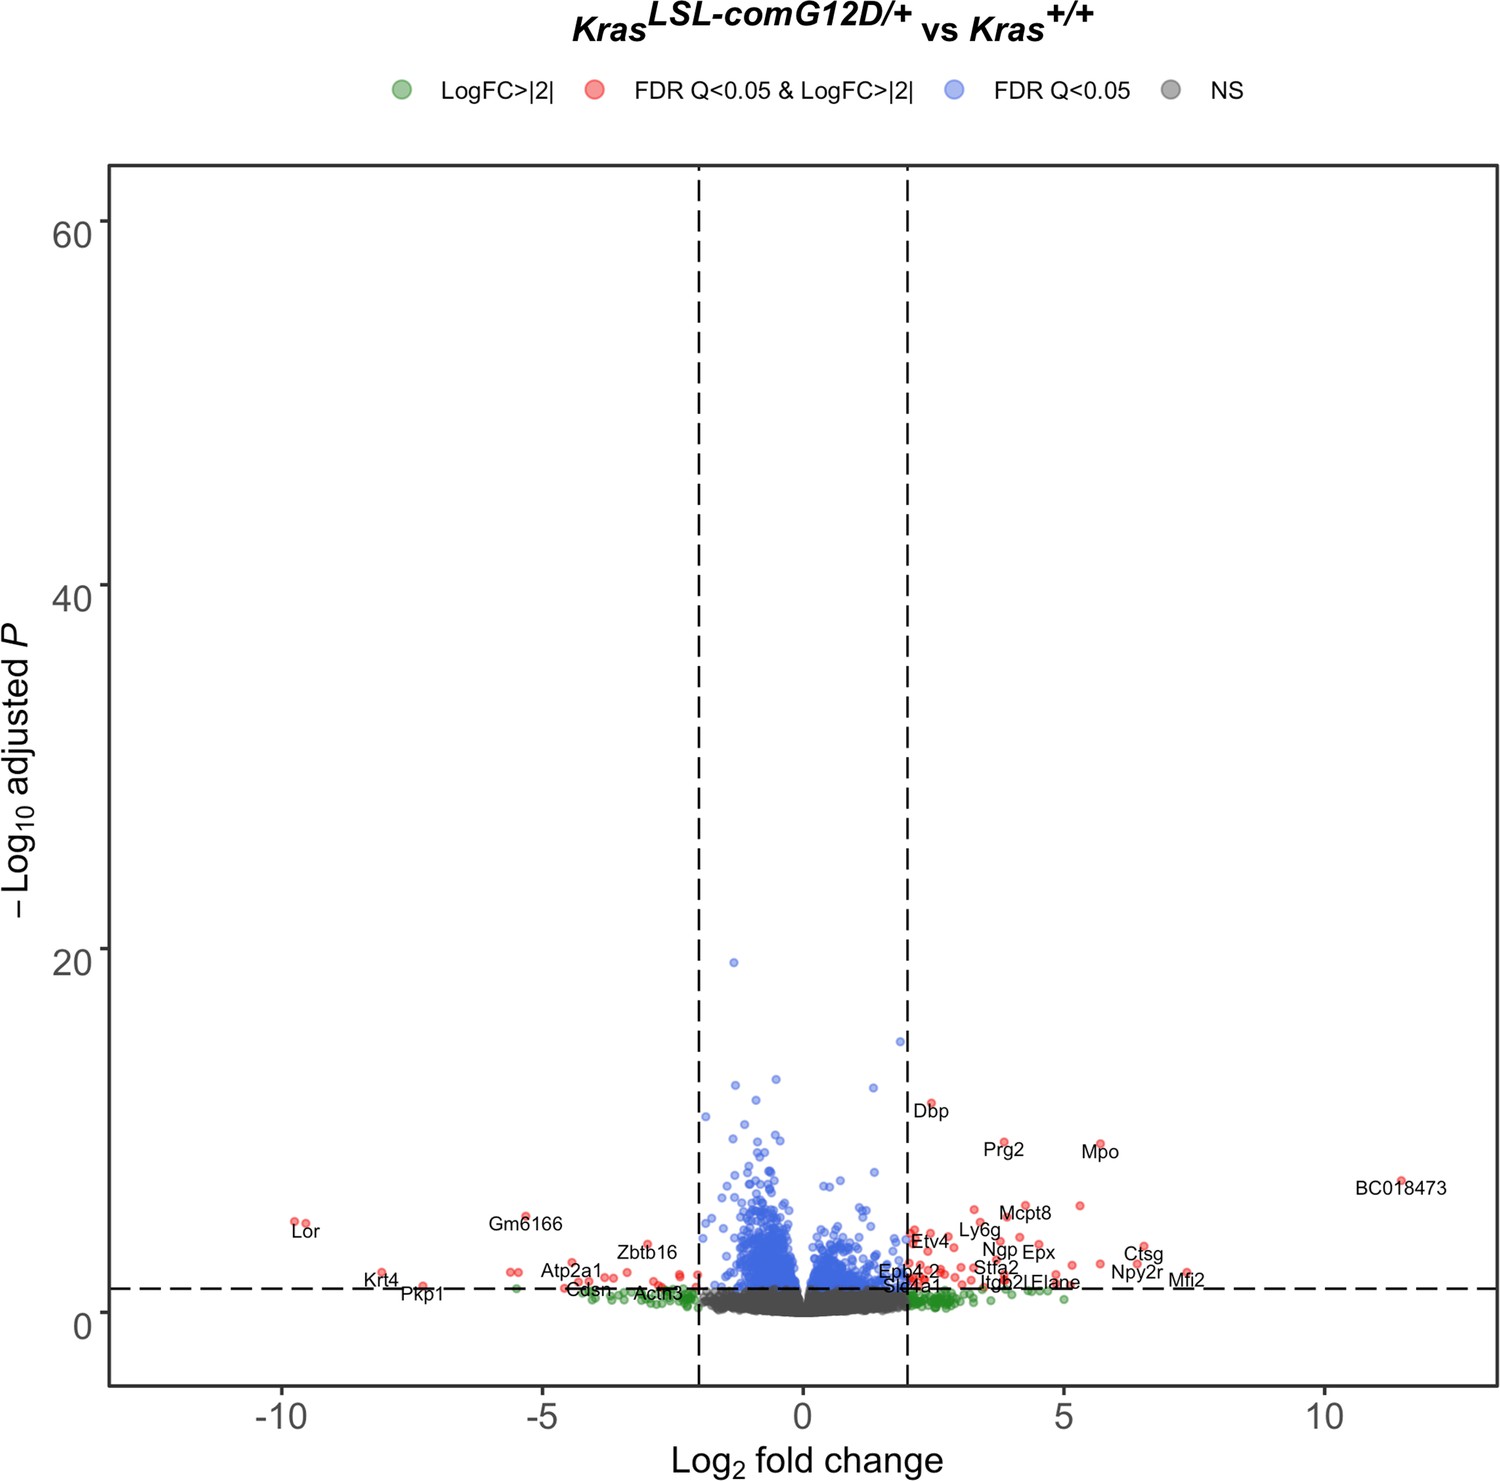
Lung transcriptome upon activating the KrasLSL-comG12D allele.
Volcano plot of the log2 fold-change versus p-value of differentially expressed genes from RNA-seq analysis of the lungs of Rosa26CreERT2/+;Kras LSL-comG12D/+ versus Rosa26CreERT2/+;Kras+/+ mice seven days after tamoxifen injection.
Figure 3—figure supplement 5
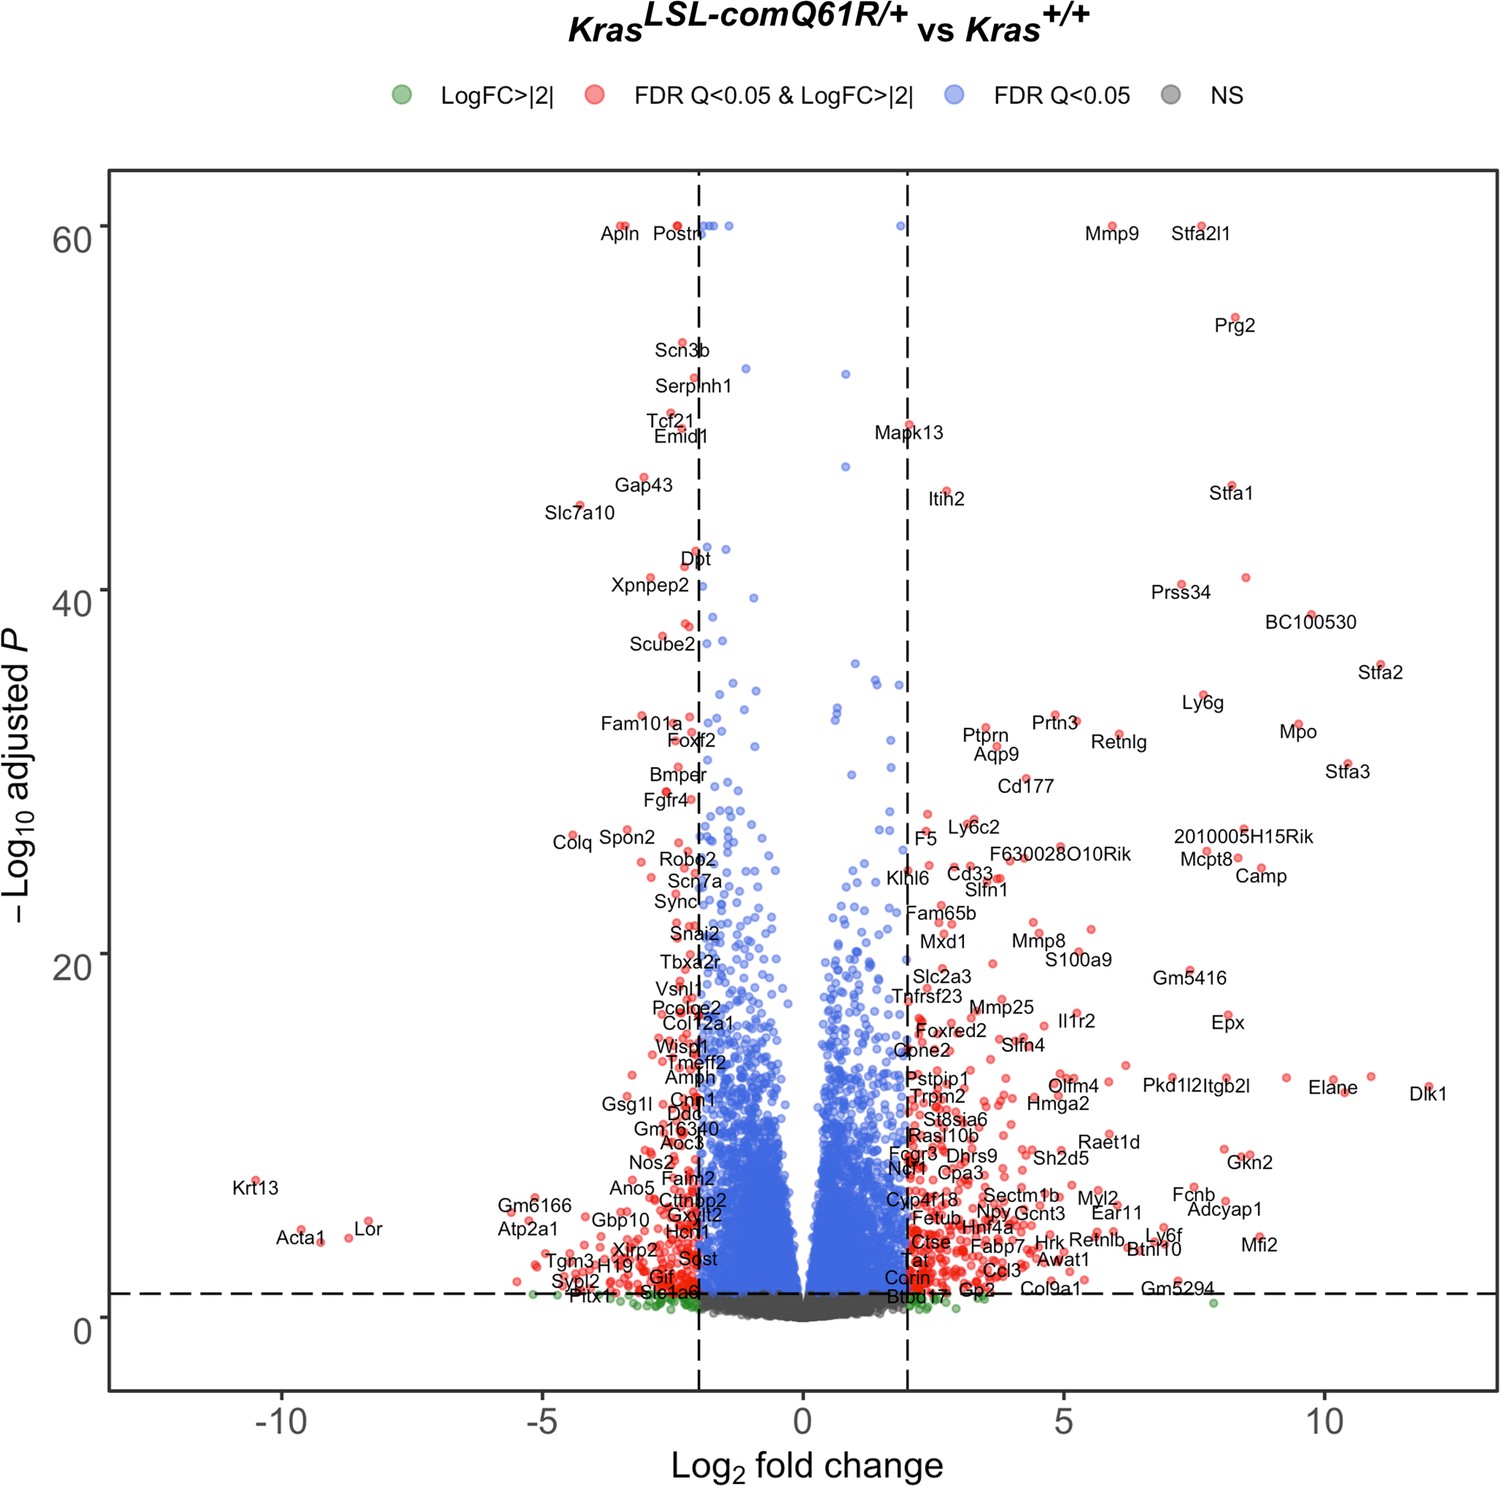
Lung transcriptome upon activating the KrasLSL-comQ61R allele.
Volcano plot of the log2 fold-change versus p-value of differentially expressed genes from RNA-seq analysis of the lungs of Rosa26CreERT2/+;Kras LSL-comQ61R/+ versus Rosa26CreERT2/+;Kras+/+ mice seven days after tamoxifen injection.
Figure 3—figure supplement 6

Venn diagram of the number of shared differentially expressed genes in the lung transcriptome upon activation of the KrasLSL alleles.
Number of commonly identified genes from the differentially expressed transcriptome in each KrasLSL allele with |log2FC| larger than 2 and adjusted p-value larger than 5% when compared to the WT Kras allele (top: depleted; middle: enriched; bottom: total). Venn diagrams are color coded according to KrasLSL allele for better visualization (cyan: KrasLSL-natG12D/+; blue: KrasLSL-natQ61R/+; orange: KrasLSL-comG12D/+; red: KrasLSL-comQ61R/+).
Figure 3—figure supplement 7
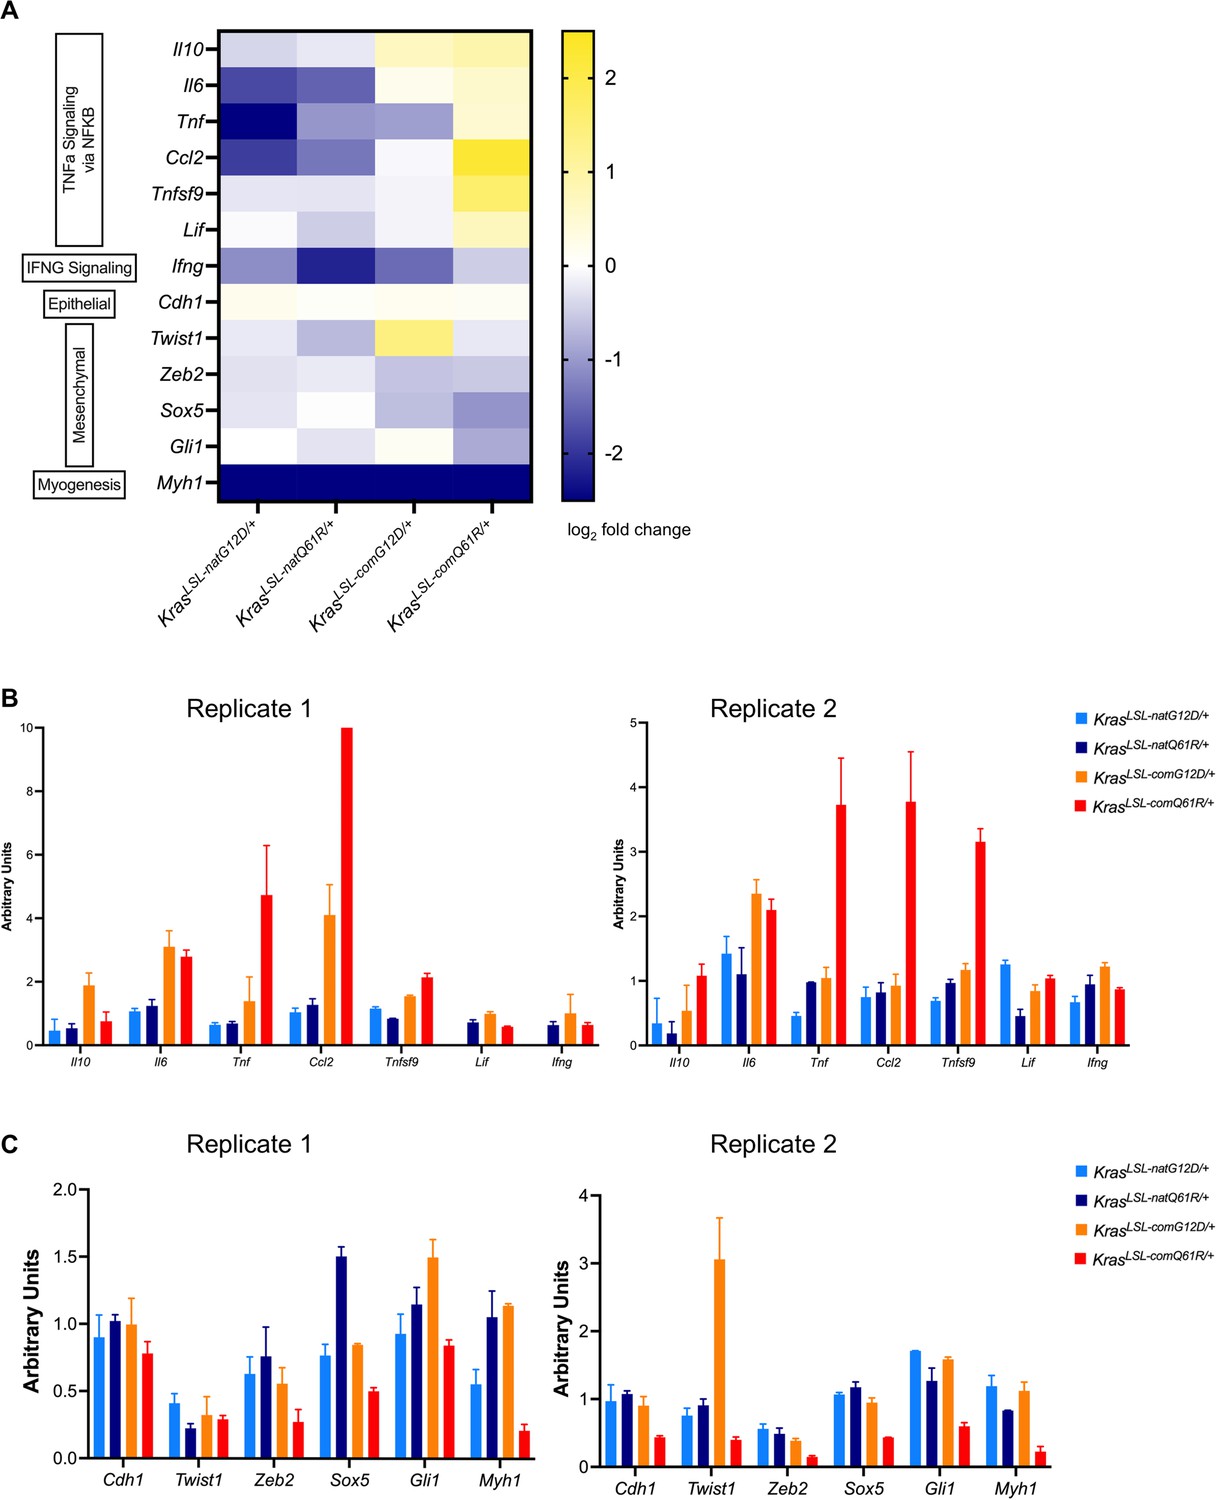
Validation of signaling responses via qRT-PCR analysis of the selected genes.
(A) Heatmap of the log2 fold change of selected genes from RNA-seq analysis of the lungs of indicated KrasLSL alleles in the Rosa26CreERT2/+ background in comparison to the wild-type Kras allele seven days after tamoxifen injection. (B, C) Validation of signaling responses via qRT-PCR analysis of the selected genes in (A) from pathways of TNFα Signaling via NF-κB and Interferonγ Signaling (B), and EMT and Myogenesis (C) (n=3). Two biological replicates.
Figure 3—figure supplement 8

Comparison of the transcriptomes upon activating the KrasLSL-natG12D versus KrasLSL-comQ61R allele.
(A) Volcano plot of the log2 fold change versus p-value of differentially expressed genes and (B) the false discovery rate (FDR) versus normalized enrichment score of the indicated Gene Set Enrichment Analysis (GSEA) hallmarks determined from RNA-seq analysis of the lungs of Rosa26CreERT2/+; KrasLSL-comQ61R/+ versus Rosa26CreERT2/+;Kras LSL-natG12D/+ mice seven days after tamoxifen injection.
Figure 3—figure supplement 9
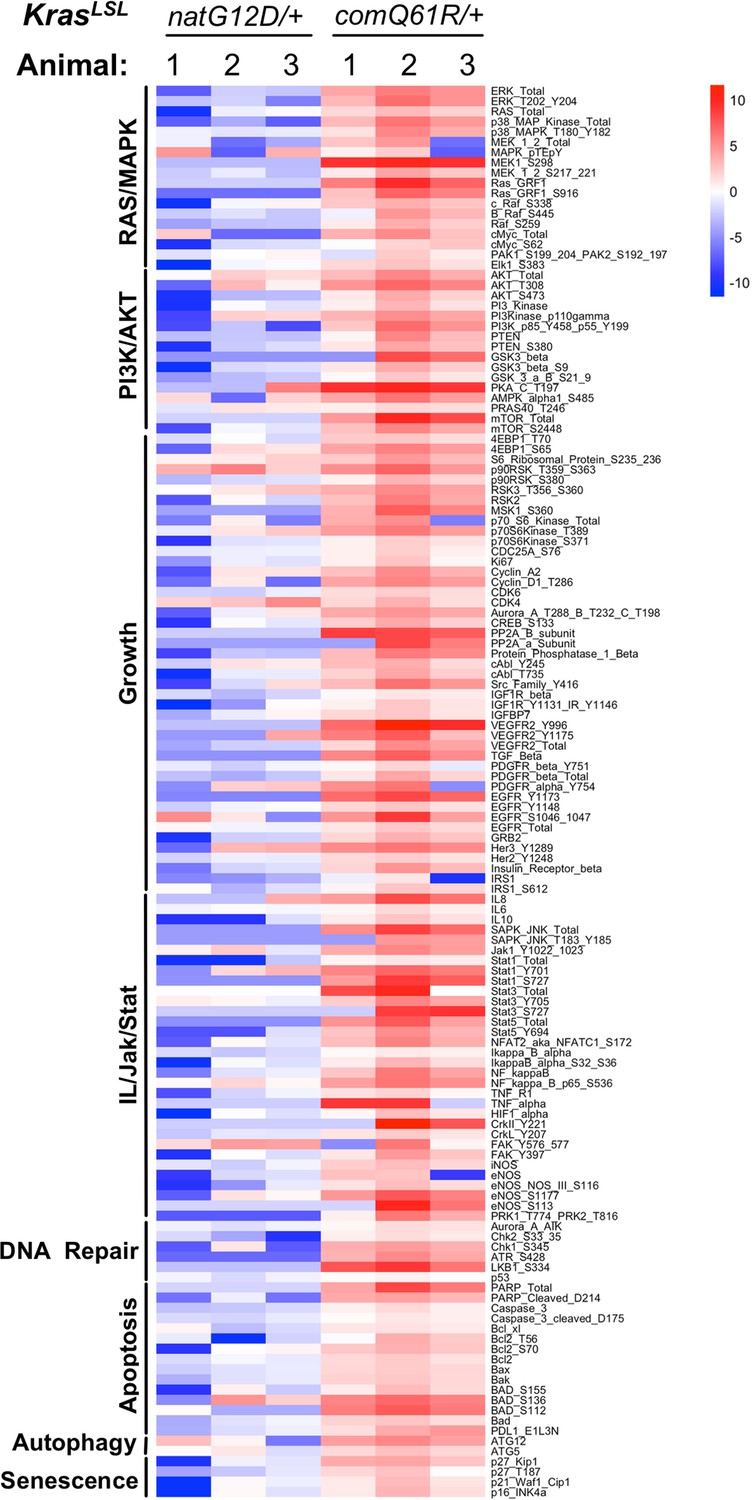
RPPA analysis of RAS downstream pathways upon activating the KrasLSL-natG12D versus KrasLSL-comQ61R allele.
Heatmap of the log2 fold change of abundance of proteins and phosphorylated proteins in the lungs of Rosa26CreERT2/+;KrascomQ61R/+ and Rosa26CreERT2/+;KrasnatG12D/+ mice in comparison to the control Rosa26CreERT2/+;Kras+/+ mice seven days after tamoxifen injection. The downstream pathways of RAS/MAPK, PI3K/AKT, Growth, IL/Jak/STAT, DNA repair, Apoptosis, Autophagy, and Senescence were selected based on the enrichment of the Gene Set Enrichment Analysis (GSEA) hallmarks in the lung transcriptome analysis in Figure 3D.
Figure 4 with 7 supplements
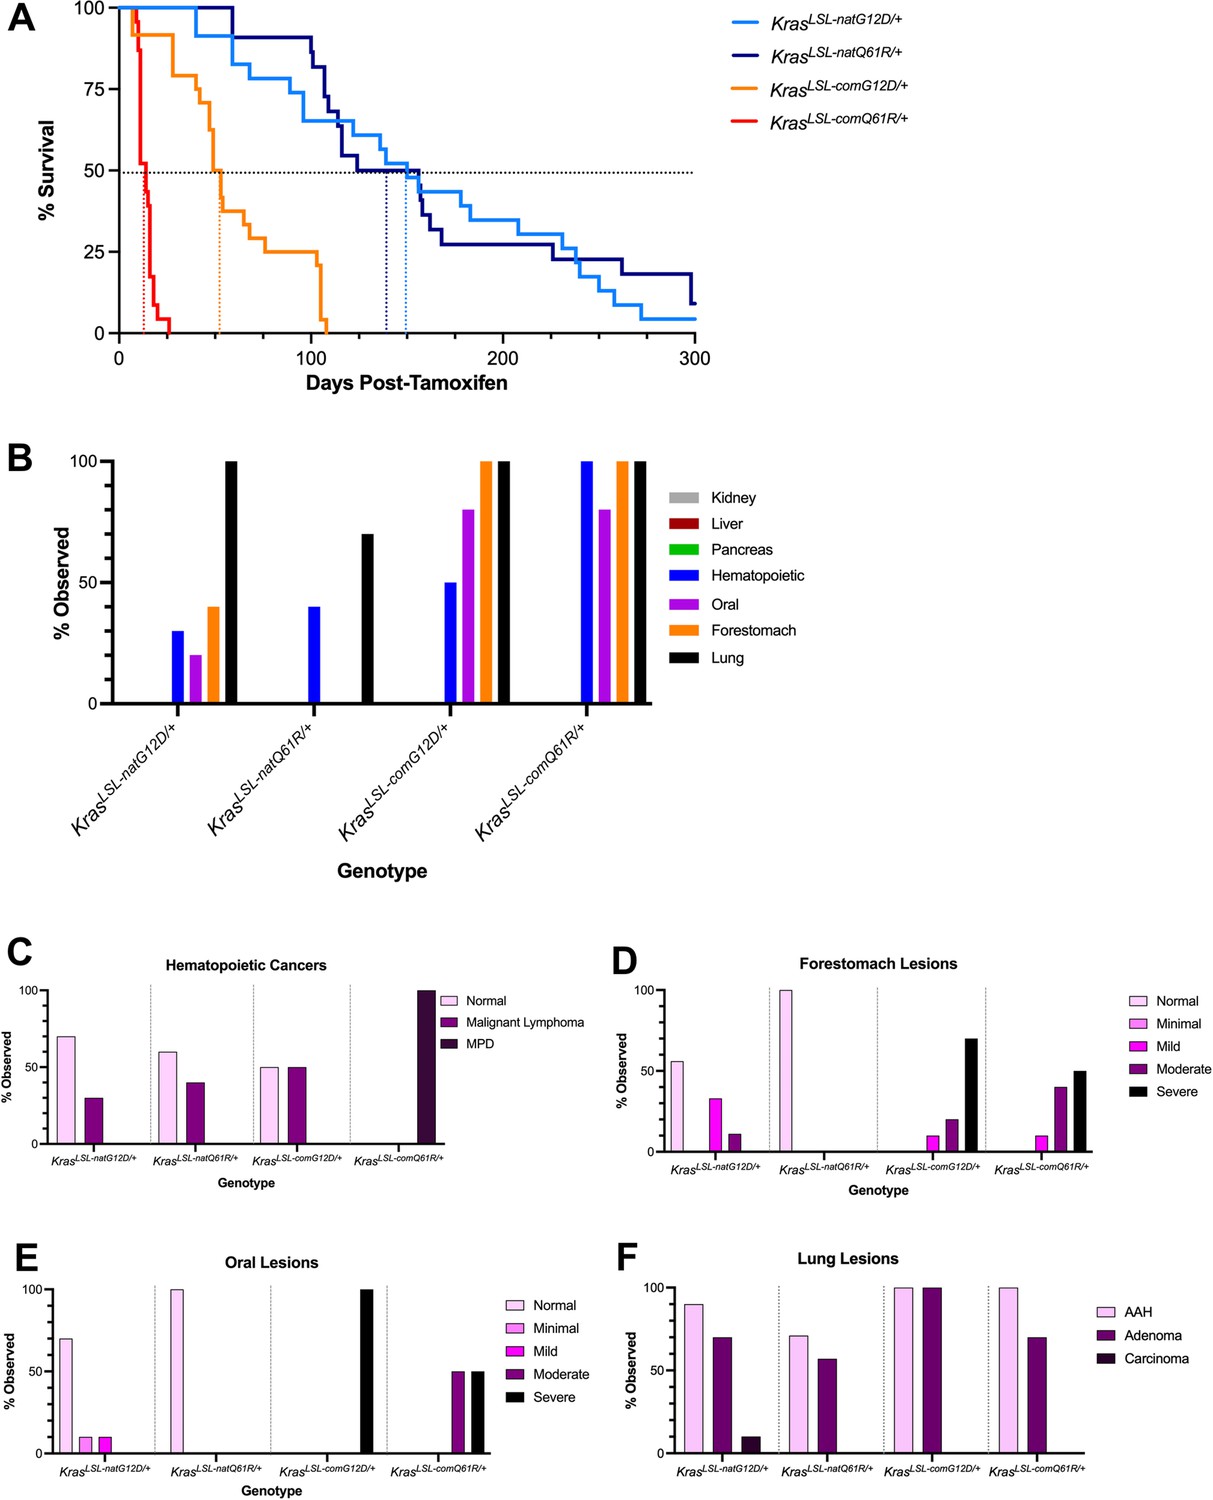
Tissue atlas of sensitivities to each oncogenic Kras allele.
(A) Kaplan–Meier survival curve of the mice with the indicated KrasLSL alleles after activation by tamoxifen. Dotted lines: 50% survival. (B) Number of mice with the indicated number of different tumor types. Examples of H&E-stained slides of the indicated tissues are provided in Figure 4—figure supplement 5. (C–F) Percentage of the indicated grades of hematolymphopoietic (C), forestomach (D), oral (E), and lung (F) lesions at moribundity endpoint in Rosa26CreERT2/+ mice (n = 8–10) with one of the four indicated KrasLSL alleles after activation by tamoxifen.
-
Figure 4—source data 1
Full-length gel images of the recombination PCRs, in Figure 4—figure supplement 2B.
- https://cdn.elifesciences.org/articles/75715/elife-75715-fig4-data1-v1.zip
Figure 4—figure supplement 1
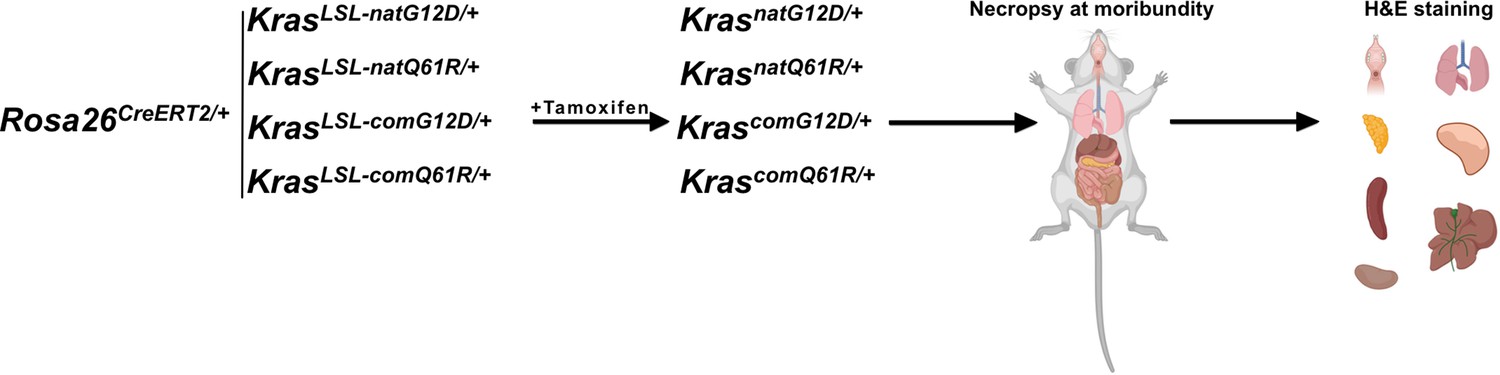
Global activation of each engineered KrasLSL allele using a ubiquitous Cre driver.
Schematic of the experimental design. Cohorts of three adult male and female Rosa26CreERT2/+;Kras LSL-natG12D/+, Rosa26CreERT2/+;Kras LSL-natQ61R/+, Rosa26CreERT2/+;Kras LSL-comG12D/+, and Rosa26CreERT2/+;Kras LSL-comQ61R/+ mice were injected with tamoxifen and euthanized at moribundity. Selected set of organs were fixed in formalin, sliced and embedded in paraffin, sectioned, and H&E stained.
Figure 4—figure supplement 2
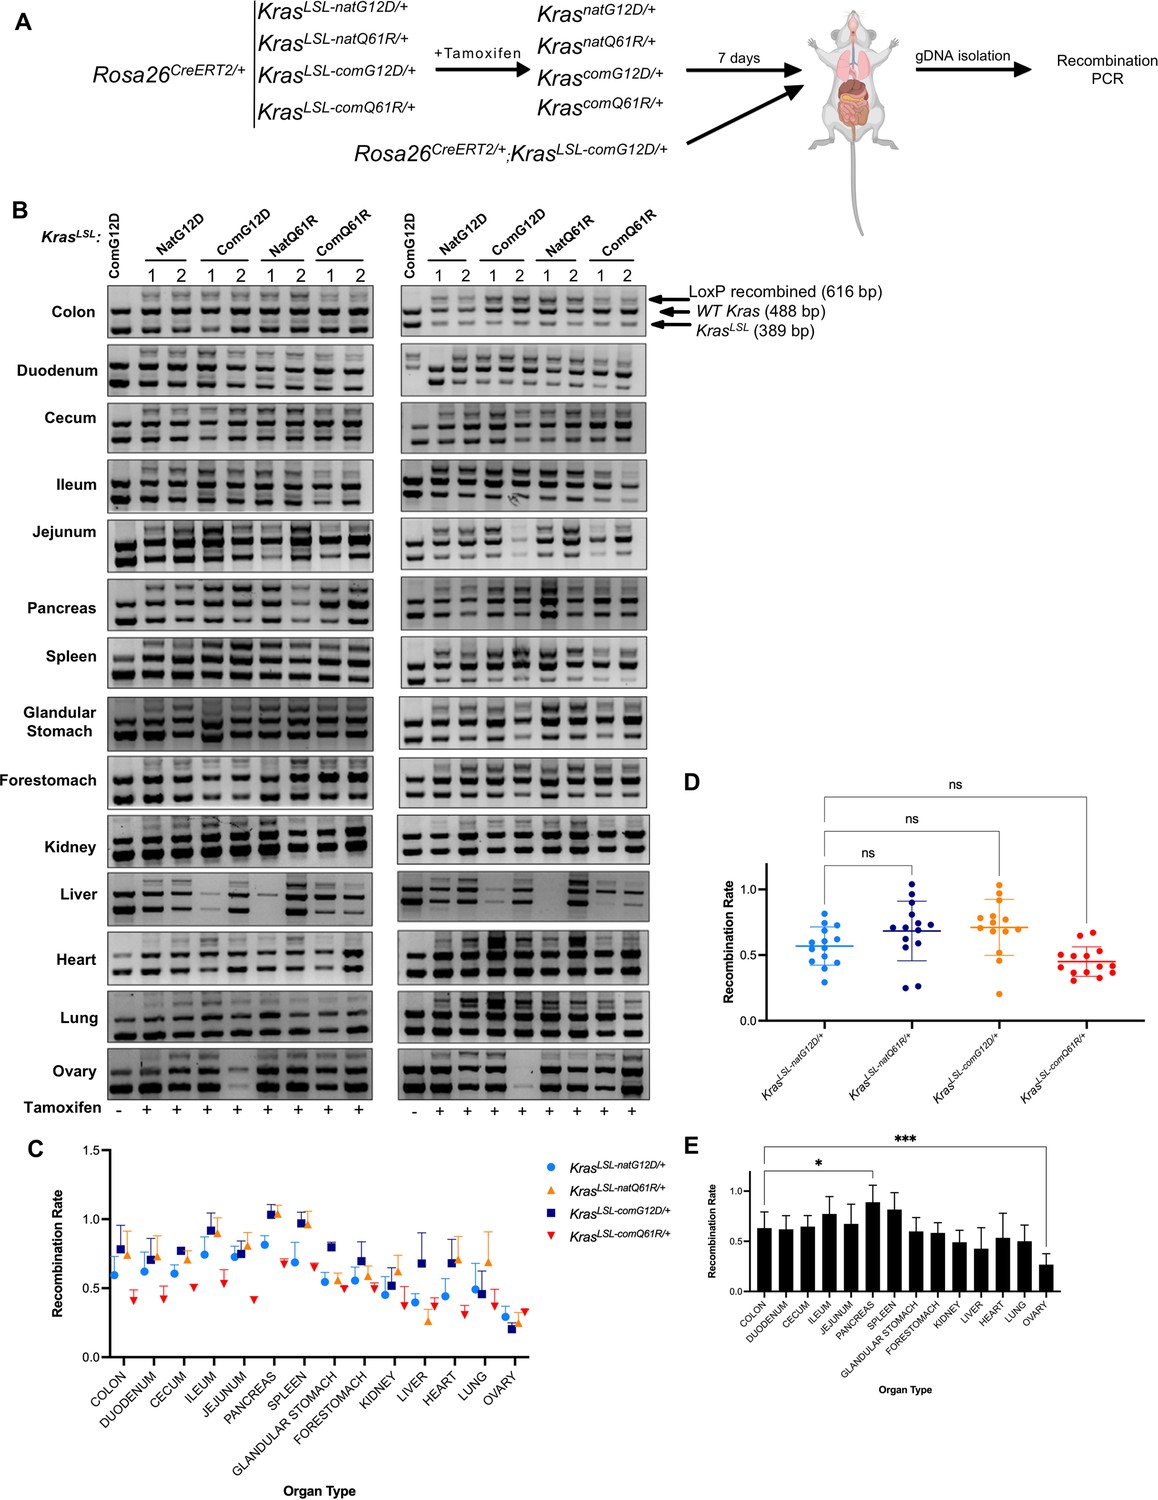
Tissue-specific recombination rates of each oncogenic KrasLSL allele upon global activation.
(A) Schematic of the experimental design. Two mice from each KrasLSL genotype in a Rosa26CreERT2/+ background seven days after tamoxifen injection were euthanized, and their organs were removed. Genomic DNA was isolated and subjected to genotyping PCR. One mouse in Rosa26CreERT2/+;Kras LSL-comG12D/+ background was used as a no-tamoxifen control. (B) Gel images from duplicate recombination analysis and (C) mean ± SEM of the ratio of the recombined KrasLSL (LoxP recombined, 616 bp) to unaltered wild-type Kras (WT, 488 bp) allele products determined by PCR genotyping. Two technical replicates of two biological replicates. Full-length gel images are provided at Figure 4—source data 1. (D, E) One-way ANOVA with Bonferroni’s multiple-comparisons test with a single pooled variance and a 95% CI shows variation in recombination rate across different alleles (D) compared to the KrasnatG12D/+ allele or across organs (E) compared to the colon, with the exception of ovary, was not statistically significant (*p<0.1 and ***p<0.001).
Figure 4—figure supplement 3
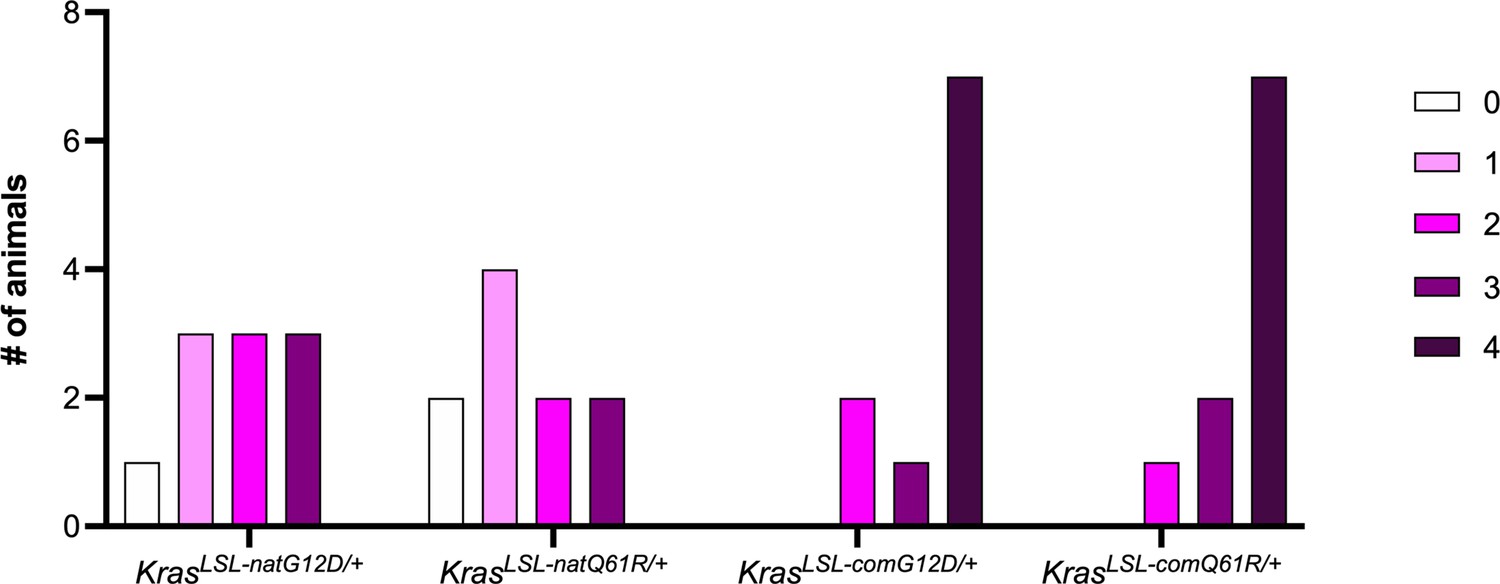
Number of tumor types induced upon globally activating each oncogenic KrasLSL allele.
Number of mice with the indicated number of different tumor types (see Supplementary file 4).
Figure 4—figure supplement 4
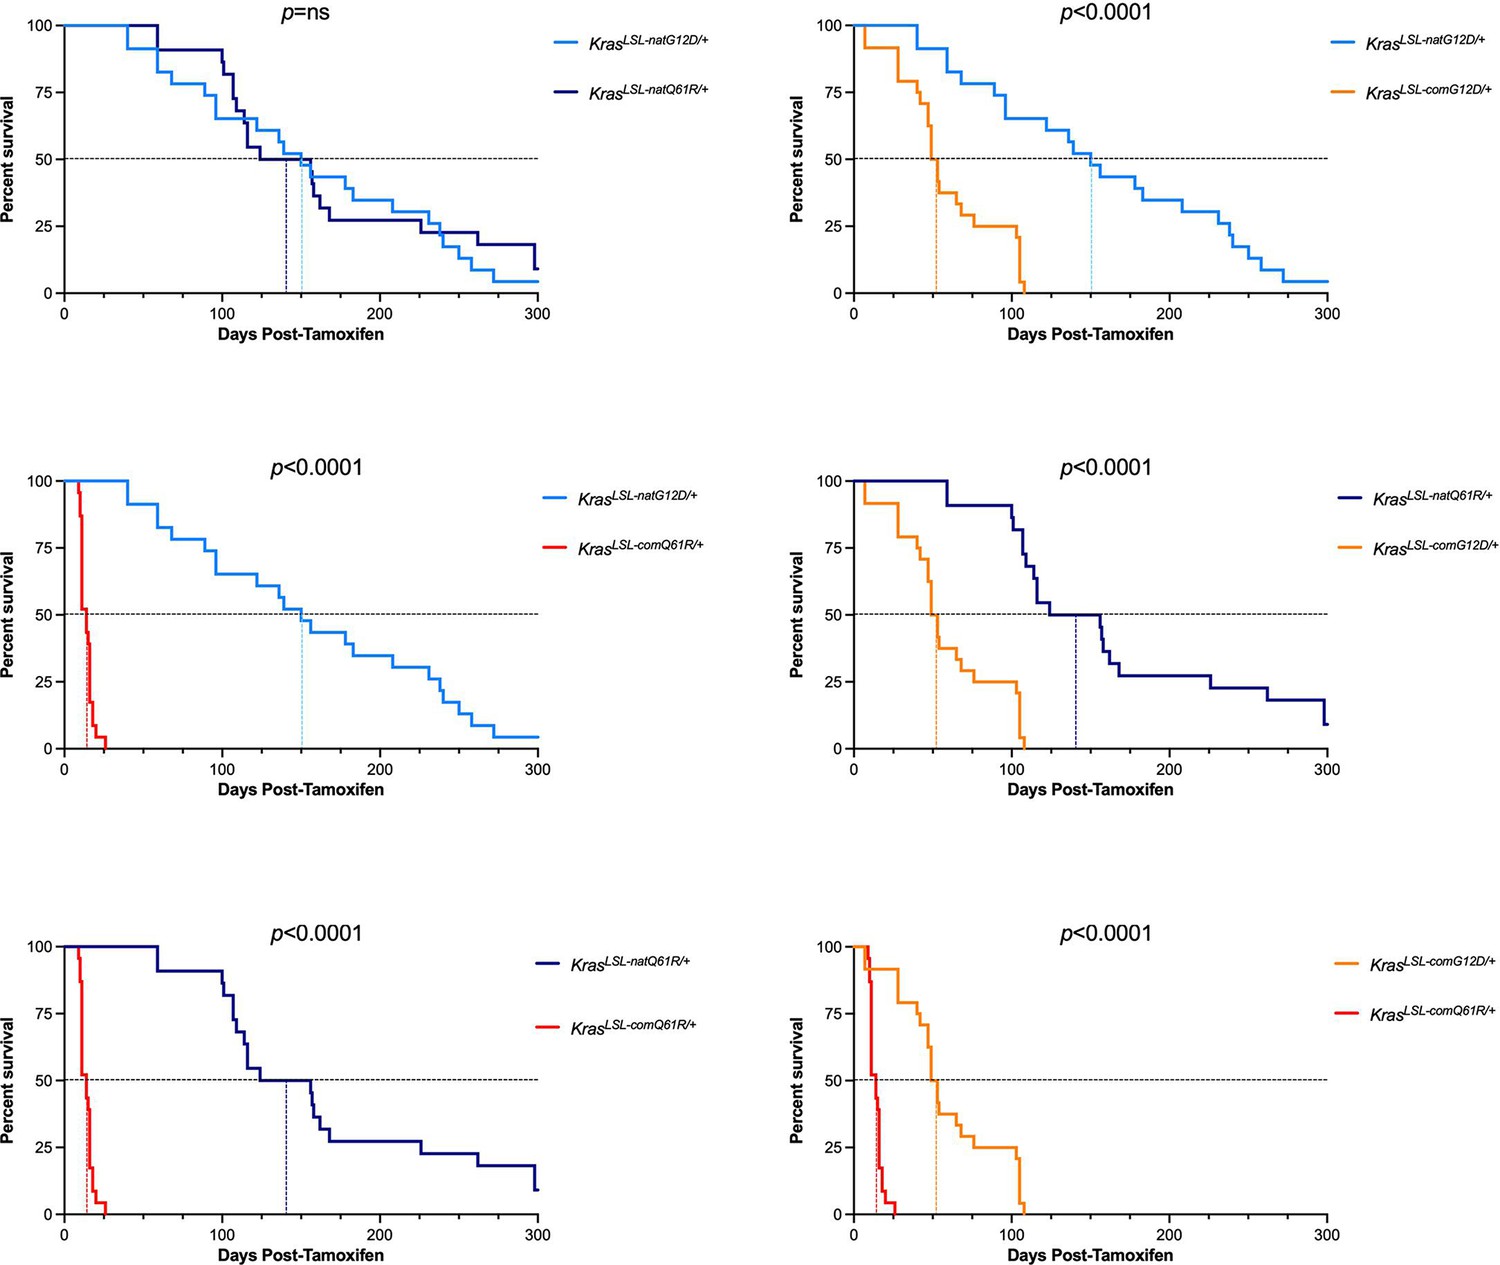
Pairwise comparisons of survival upon globally activating each oncogenic KrasLSL allele.
p-Values calculated by log-rank (Mantel–Cox) test of the pairwise comparisons of alleles (see Supplementary file 3).
Figure 4—figure supplement 5
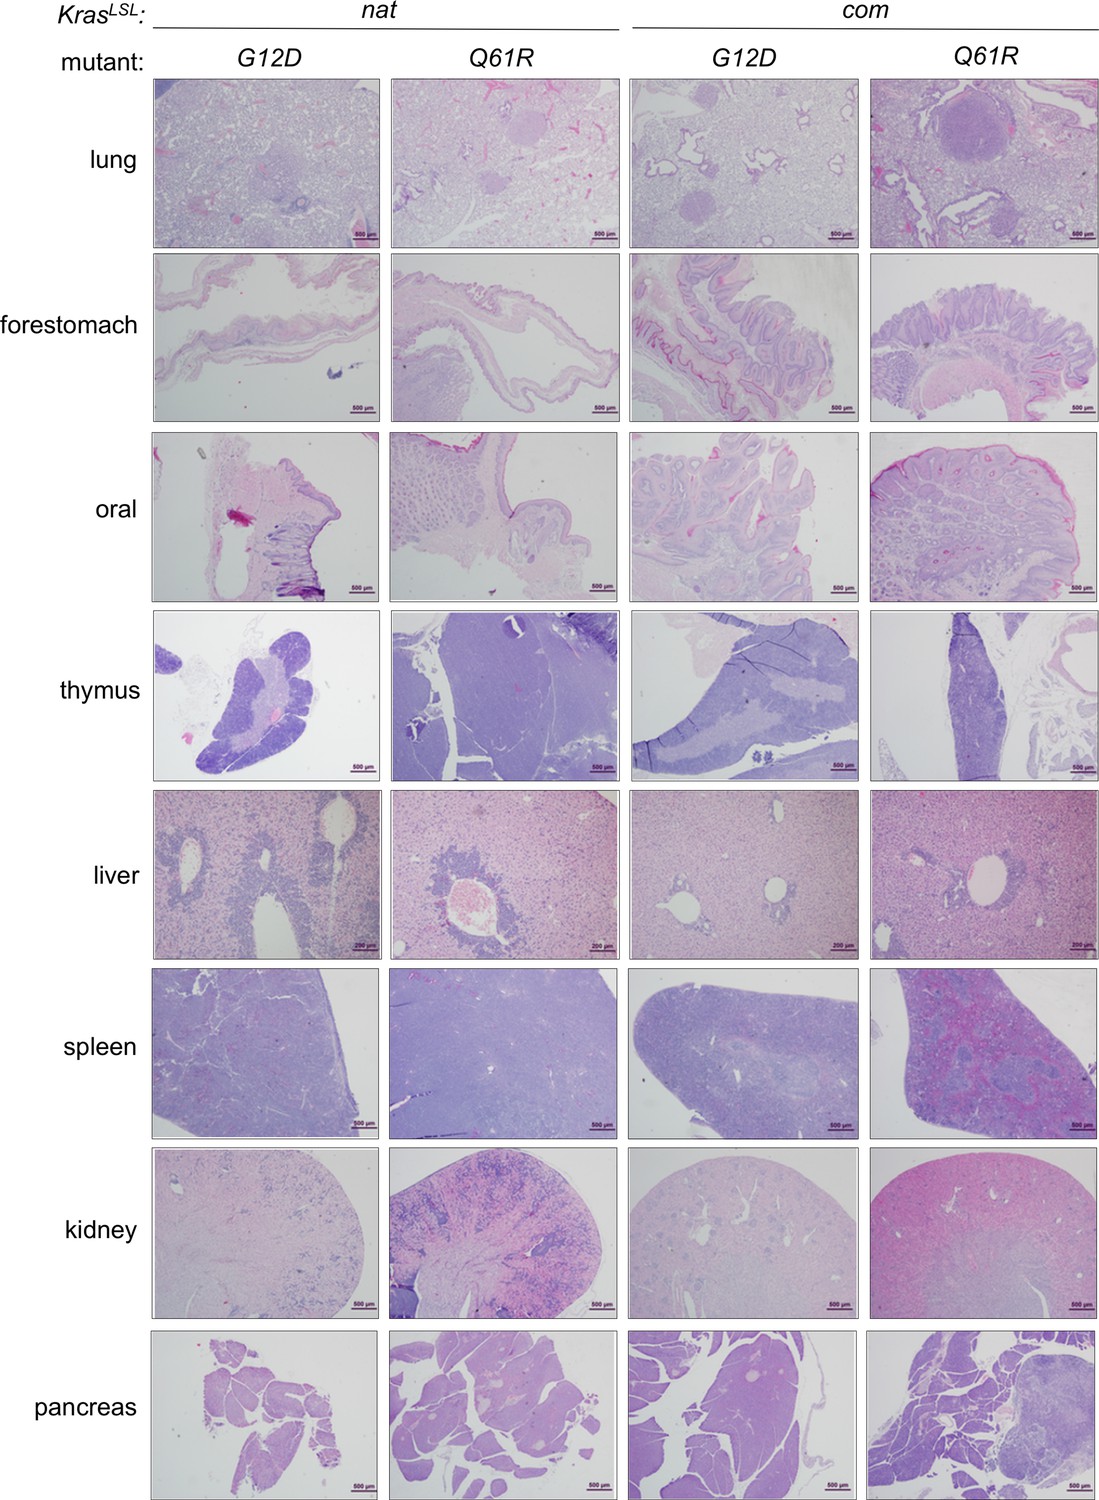
Proliferative lesions induced upon activating each oncogenic KrasLSL allele.
Examples of H&E-stained sections from the indicated organs in each allele upon global activation at the moribundity endpoint.
Figure 4—figure supplement 6
Histopathological analysis of pulmonary lesions induced upon activating each of the oncogenic KrasLSL alleles.
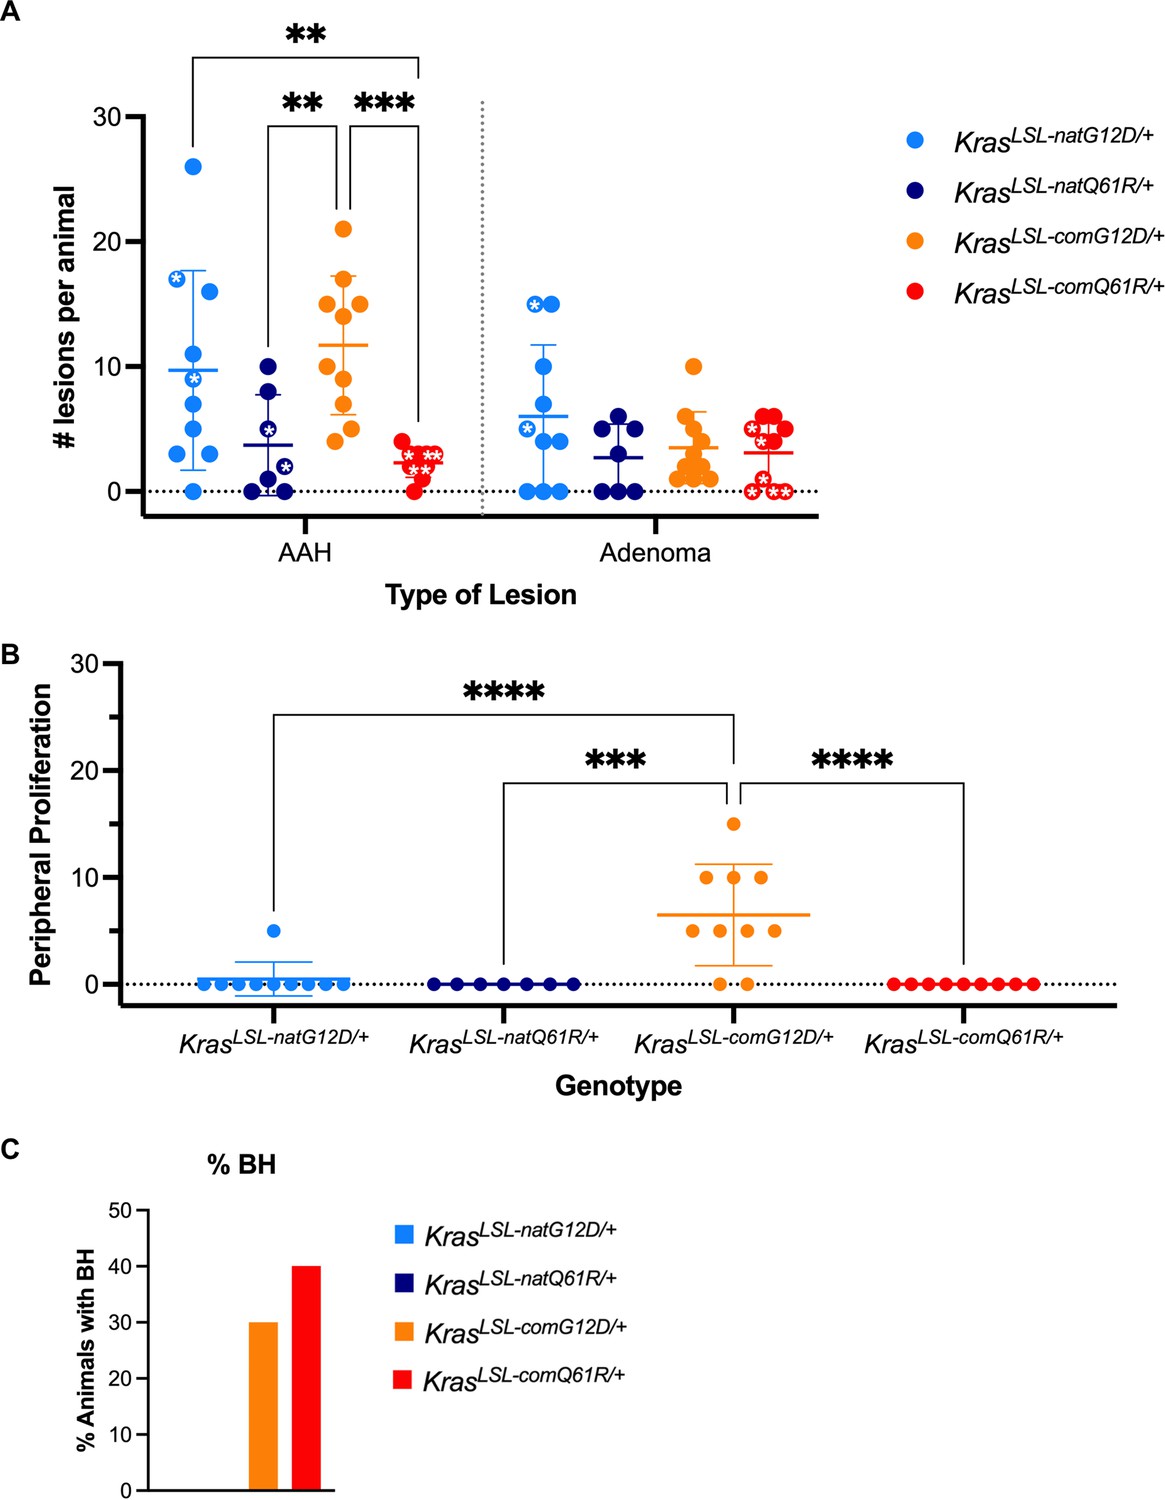
Mean ± SD of number of AHA and adenoma lesions per animal with stars denoting animals with extensive myeloid infiltration in the lungs (A), mean ± SD of peripheral lesions observed as percent surface area (B), and percent animals manifesting hyperplasia localized to bronchioles (C). p-Values calculated by two-way ANOVA multiple comparisons with Sidak testing (A) or one-way ANOVA multiple comparison with Tukey testing (B). **p<0.01, ***p<0.001, ****p<0.0001.
Figure 4—figure supplement 7
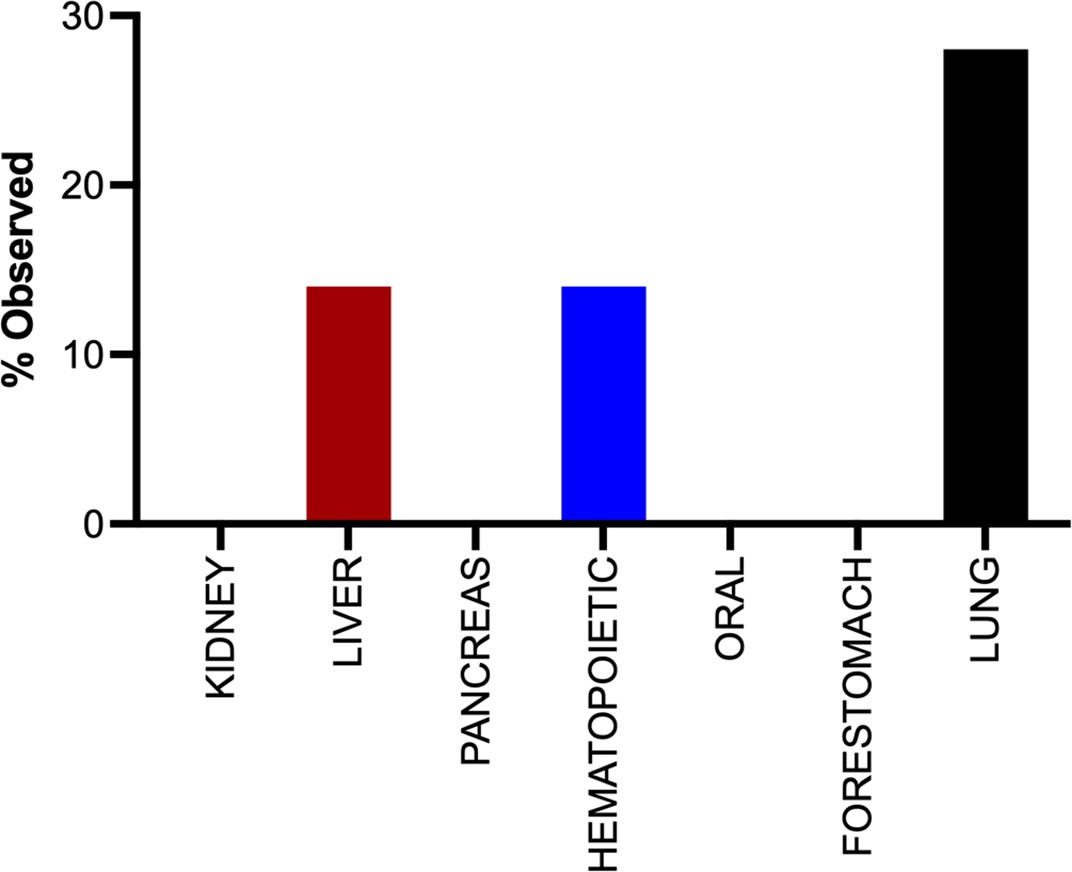
The tumor landscape of Rosa26CreERT2/+;KrasLSL-rareG12D/+ mice after tamoxifen injection.
Percent of the indicated organs with tumors from Rosa26CreERT2/+;KrasLSL-rareG12D/+ mice (n = 7) 20 months after tamoxifen injection.
Figure 5 with 1 supplement

Transcriptome analysis predicts unique pharmacological vulnerabilities.
Druggable kinases positively enriched in GSEA hallmarks identified in Figure 3D (blue KrasLSL-natG12D/+, red KrasLSL-comQ61R/+). * Adjusted p-value<5%.
Figure 5—figure supplement 1
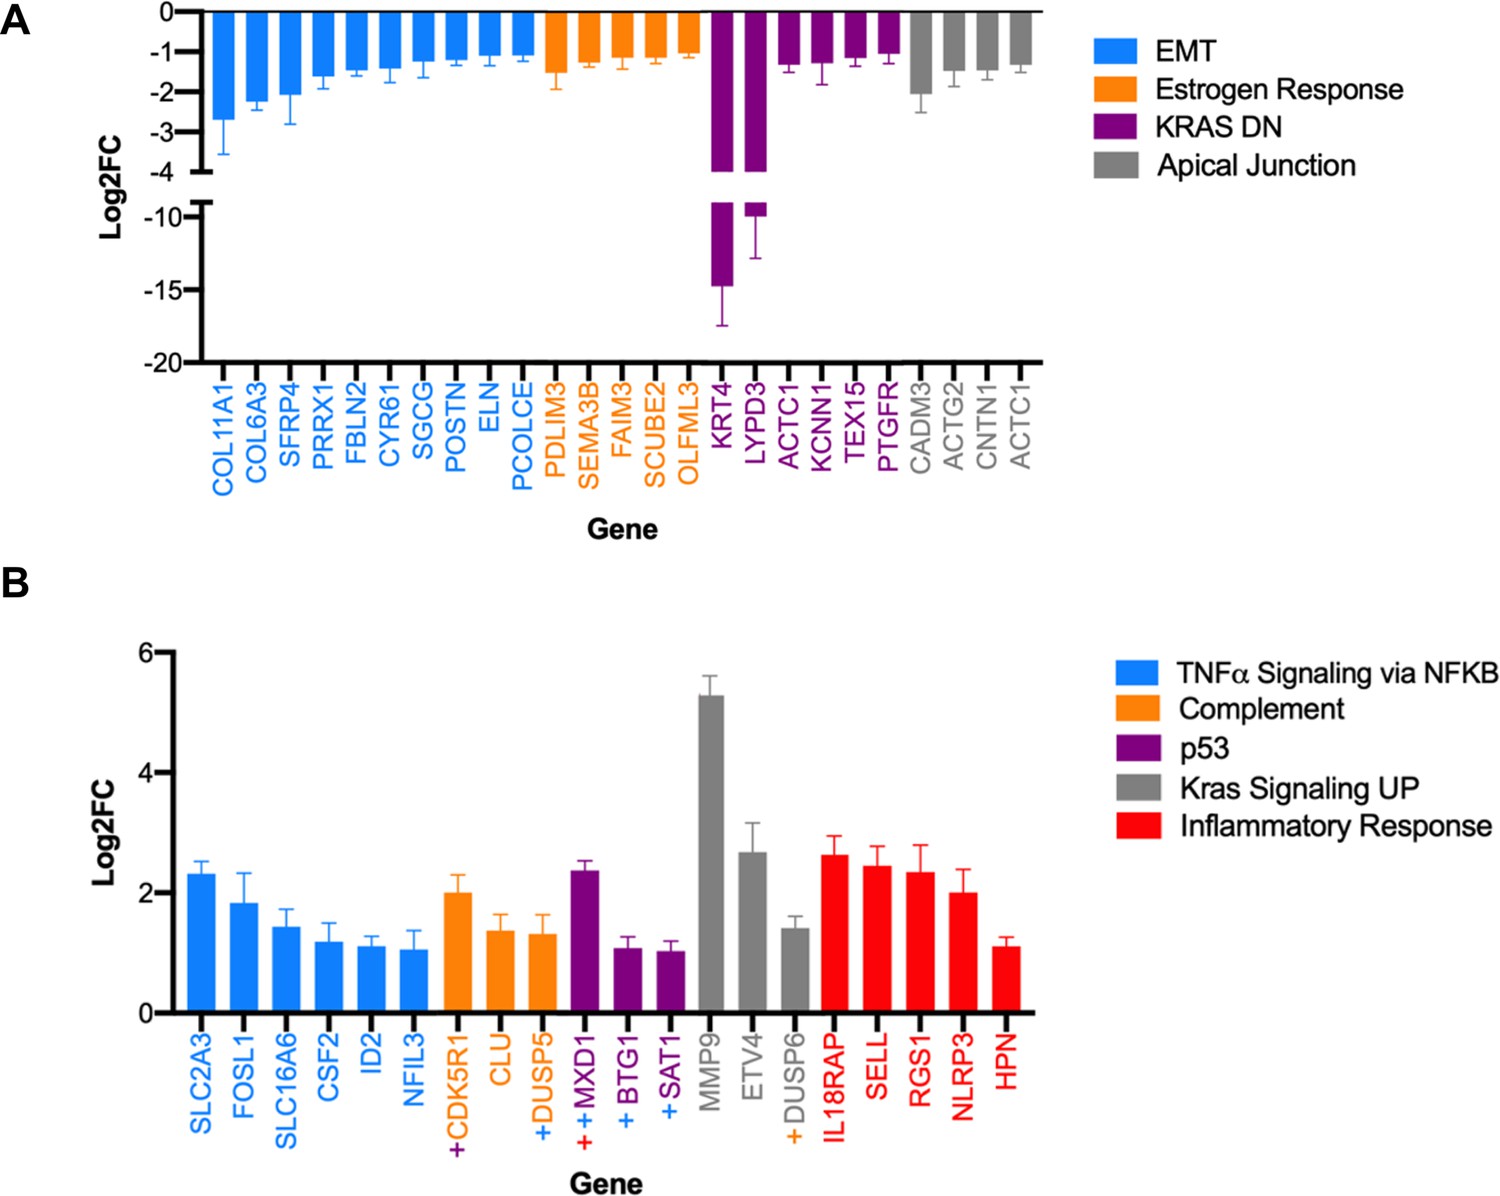
Differential expression of known transcription factors of genes enriched in the GSEA hallmarks identified in the transcriptome of lung tissue upon activating the KrasLSL-natG12D and KrasLSL-comQ61R alleles.
(A, B) Mean ± SEM of log2 fold change (Log2FC) differential expression of genes (Kras LSL-comQ61R versus Kras LSL-natG12D) activated by transcription factors enriched in GSEA hallmarks of (A) Kras LSL-natG12D, and (B) Kras LSL-comQ61R transcriptome (adjusted p-value less than 5%). +, genes common to more than one GSEA hallmark.
Tables
Key resources table
| Reagent type (species) or resource | Designation | Source or reference | Identifiers | Additional information |
|---|---|---|---|---|
| Antibody | Anti-FLAG (mouse monoclonal) | Sigma | F1804 | WB (1:1000) |
| Antibody | Anti-KRAS (mouse monoclonal) | Santa Cruz Biotechnology | sc-30 | WB (1:500) |
| Antibody | Anti-βTubulin (mouse monoclonal) | Sigma | T5201 | WB (1:10,000) |
| Antibody | Anti-SV40 large T antigen (rabbit monoclonal) | Cell Signaling | 15729 | WB (1:1000) |
| Strain, strain background (Escherichia coli) | STBL3 | Thermo Fisher Scientific | C737303 | Chemically competent cells |
| Commercial assay or kit | FuGENE 6 Transfection Reagent | Promega | E2691 | |
| Commercial assay or kit | DC Protein Assay | Bio-Rad | 5000112 | |
| Commercial assay or kit | DNeasy Blood and Tissue DNA extraction Kit | QIAGEN | 69504 | |
| Chemical compound, drug | Tamoxifen | Sigma-Aldrich | T5648-5G | |
| Commercial assay or kit | RNAeasy Kit | QIAGEN | 74104 | |
| Commercial assay or kit | RNase-Free DNase Set | QIAGEN | 79254 | |
| Commercial assay or kit | GenPoint kit | Agilent | K062011-2 | |
| Commercial assay or kit | MycoAlert PLUS Mycoplasma detection kit | Lonza | LT07-703 | |
| Antibody | Anti-rabbit IgG antibody | Vector Laboratories | BA-1000-1.5 | RPPA |
| Antibody | Anti-mouse IgG antibody | Vector Laboratories | BA-9200-1.5 | RPPA |
| Commercial assay or kit | Active Ras Detection Kit | Cell Signaling | 8821 | |
| Commercial assay or kit | Ras GTPase ELISA Kit | Abcam | ab134640 | |
| Cell line (Homo sapiens) | HEK-HT | Counter et al., 1992 | Cell line created and maintained in C. Counter lab, validated by immunoblot for SV40 Large T antigen | Cultured in DMEM and 10% FBS Tested negative for mycoplasma |
| Cell line (Mus musculus) | MEF derived from KrasLSL-natG12D/+ mice | This paper | Validated by genotyping PCR | Cultured in DMEM and 10% FBS Tested negative for mycoplasma |
| Cell line (M. musculus) | MEF derived from KrasLSL-natQ61R/+ mice | This paper | Validated by genotyping PCR | Cultured in DMEM and 10% FBS Tested negative for mycoplasma |
| Cell line (M. musculus) | MEF derived from KrasLSL-comG12D/+ mice | This paper | Validated by genotyping PCR | Cultured in DMEM and 10% FBS Tested negative for mycoplasma |
| Cell line (M. musculus) | MEF derived from KrasLSL-comQ61R/+ mice | This paper | Validated by genotyping PCR | Cultured in DMEM and 10% FBS Tested negative for mycoplasma |
| Strain, strain background (M. musculus) | KrasLSL-natG12D/+ | This paper | Generated in Counter Lab | |
| Strain, strain background (M. musculus) | KrasLSL-natQ61R/+ | This paper | Generated in Counter | |
| Strain, strain background (M. musculus) | KrasLSL-comG12D/+ | This paper | Generated in Counter Lab | |
| Strain, strain background (M. musculus) | KrasLSL-comQ61R/+ | This paper | Generated in Counter Lab | |
| Strain, strain background (M. musculus) | KrasLSL-rareG12D/+ | This paper | Generated in Counter Lab | |
| Strain, strain background (M. musculus) | ACTBFLPe/FLPe | Jackson Laboratory | 003800 | |
| Strain, strain background (M. musculus) | CC10CreER/CreER; Rosa26CAG-fGFP/CAG-fGFP | Xu et al., 2012 | ||
| Strain, strain background (M. musculus) | Rosa26CreERT2/CreERT2 | Jackson Laboratory | 008463 | |
| Recombinant DNA reagent | pcDNA3.1 | Thermo Fisher Scientific | V79020 | Mammalian expression vector backbone |
| Recombinant DNA reagent | pcDNA3.1+FLAG-KrasnatG12D | This study | Generated in Counter Lab | |
| Recombinant DNA reagent | pcDNA3.1+FLAG-KrasnatQ61R | This study | Generated in Counter Lab | |
| Recombinant DNA reagent | pcDNA3.1+FLAG-KrascomG12D | This study | Generated in Counter Lab | |
| Recombinant DNA reagent | pcDNA3.1+FLAG-KrascomQ61R | This study | Generated in Counter Lab | |
| Recombinant DNA reagent | pBABE-neo largeTcDNA | Hahn et al., 2002 | Addgene #1780 | |
| Recombinant DNA reagent | MSCV-Cre-Hygro | Wang et al., 2010 | Addgene #34565 | |
| Software, algorithm | ImageJ version 1.52k with Java 1.8.0_172 | Schneider et al., 2012 | https://imagej.nih.gov/ij/ | |
| Software, algorithm | Image Lab | Bio-Rad | https://www.bio-rad.com/en-us/product/image-lab-software | |
| Software, algorithm | GraphPad Prism v8 | GraphPad | https://www.graphpad.com/ | |
| Software, algorithm | bcl2fastq | Illumina | https://support.illumina.com/sequencing/sequencing_software/bcl2fastq-conversion-software.html | |
| Software, algorithm | STAR RNA-Seq alignment tool v2.7.8a | Dobin et al., 2013 | https://github.com/alexdobin/STAR | STAR (RRID:SCR_004463) |
| Software, algorithm | DESeq2 | Love et al., 2014 | http://www.bioconductor.org/packages/release/bioc/html/DESeq2.html | |
| Software, algorithm | GSEA | Mootha et al., 2003 | https://www.gsea-msigdb.org/gsea/ | |
| Software, algorithm | R Studio | R Development Core Team, 2020 | https://www.R-project.org | |
| Software, algorithm | MicroVigene Software Version 5.1.0.0 | VigeneTech | http://www.vigenetech.com/Protein.htm | |
| Software, algorithm | BioRender | http://www.biorender.com |
Appendix 1—table 1
Primer sequences for genotyping and qRT-PCR analysis.
| Reagent type (species) or resource | Designation | Source or reference | Identifiers | Additional information |
|---|---|---|---|---|
| Sequence-based reagent | Kras.in3.F | This paper | PCR primers | TTGGTGTACATCACTAGGCTTCA |
| Sequence-based reagent | Kras.in3.R | This paper | PCR primers | TGGAAAGAGTAAAGTGTGGTGGT |
| Sequence-based reagent | Kras.neo.F | This paper | PCR primers | GTGGGCTCTATGGCTTCTGA |
| Sequence-based reagent | KrasCOM5.F | This paper | PCR primers | CTTCCATTTGTCACGTCCTGC |
| Sequence-based reagent | KrasCOM5.R | This paper | PCR primers | TCTTCGGTGGAAACAACGGT |
| Sequence-based reagent | F-LSL | This paper | PCR primers | TAGTCTGTGGGACCCCTTTG |
| Sequence-based reagent | R-LSL | This paper | PCR primers | GCCTGAAGAACGAGATCAGC |
| Sequence-based reagent | KRASOP.A2 | This paper | PCR primers | CTAGCCACCATGGCTTGAGT |
| Sequence-based reagent | KRASOP.B | This paper | PCR primers | GTAATCACAACAAAGAGAATGCAG |
| Sequence-based reagent | LSL-F | This paper | PCR primers | GGGGAACCTTTCAGGCTTA |
| Sequence-based reagent | KrasRAR.F | This paper | PCR primers | TATGCGTACGGGTGAAGGTT |
| Sequence-based reagent | KrasRAR.R | This paper | PCR primers | GCAGAGCACAGACTCACGTC |
| Sequence-based reagent | F-CC10 WT | Xu et al., 2012 | PCR primers | ACTCACTATTGGGGGTGTGG |
| Sequence-based reagent | R-CC10 WT | Xu et al., 2012 | PCR primers | GGAGGACTTGTGGATCTTG |
| Sequence-based reagent | F-Cre | Xu et al., 2012 | PCR primers | TCGATGCAACGAGTGATGAG |
| Sequence-based reagent | R-Cre | Xu et al., 2012 | PCR primers | TTCGGCTATAGGTAACAGGG |
| Sequence-based reagent | F-Rosa-01 | Xu et al., 2012 | PCR primers | CACTTGCTCTTCCAAAGTCG |
| Sequence-based reagent | R-Rosa-02B | Xu et al., 2012 | PCR primers | TAGTCTAACTCGCGACACTG |
| Sequence-based reagent | F-CAG-02B | Xu et al., 2012 | PCR primers | GTTATGTAACGCGGAACTCC |
| Sequence-based reagent | R26R-univF | Jackson Laboratory | PCR primers | AAAGTCGCTCTGAGTTGTTAT |
| Sequence-based reagent | R26R-wtR | Jackson Laboratory | PCR primers | GGAGCGGGAGAAATGGATATG |
| Sequence-based reagent | CreER-R1 | Jackson Laboratory | PCR primers | CCTGATCCTGGCAATTTCG |
| Sequence-based reagent | GLI1-F | This paper | PCR primers | CCCATAGGGTCTCGGGGTCTCAAAC |
| Sequence-based reagent | GLI1-R | This paper | PCR primers | GGAGGACCTGCGGCTGACTGTGTAA |
| Sequence-based reagent | CDH1-F | This paper | PCR primers | GTCTCCTCATGGCTTTGC |
| Sequence-based reagent | CDH1-R | This paper | PCR primers | CTTTAGATGCCGCTTCAC |
| Sequence-based reagent | TWIST1-F | This paper | PCR primers | AGCGGGTCATGGCTAACG |
| Sequence-based reagent | TWIST1-R | This paper | PCR primers | GGACCTGGTACAGGAAGTCGA |
| Sequence-based reagent | ZEB2-F | This paper | PCR primers | GAGCTTGACCACCGACTC |
| Sequence-based reagent | ZEB2-R | This paper | PCR primers | TTGCAGGACTGCCTTGAT |
| Sequence-based reagent | SOX5-F | This paper | PCR primers | ATTGTGCAGTCCCACAGGTTG |
| Sequence-based reagent | SOX5-R | This paper | PCR primers | CTGCCTTTAGTGGGCCAGTG |
| Sequence-based reagent | IL6-F | This paper | PCR primers | CCGGAGAGGAGACTTCACAG |
| Sequence-based reagent | IL6-R | This paper | PCR primers | CAGAATTGCCATTGCACAAC |
| Sequence-based reagent | IL10-F | This paper | PCR primers | GGTTGCCAAGCCTTATCGGA |
| Sequence-based reagent | IL10-R | This paper | PCR primers | ACCTGCTCCACTGCCTTGCT |
| Sequence-based reagent | TNFa-F | This paper | PCR primers | CCCCAAAGGGATGAGAAGTT |
| Sequence-based reagent | TNFa-R | This paper | PCR primers | GTGGGTGAGGAGCACGTAGT |
| Sequence-based reagent | CCL2-F | This paper | PCR primers | AGGTCCCTGTCATGCTTCTG |
| Sequence-based reagent | CCL2-R | This paper | PCR primers | TCTGGACCCATTCCTTCTTG |
| Sequence-based reagent | LIF-F | This paper | PCR primers | AATGCCACCTGTGCCATACG |
| Sequence-based reagent | LIF-R | This paper | PCR primers | CAACTTGGTCTTCTCTGTCCCG |
| Sequence-based reagent | TNFSF9-F | This paper | PCR primers | GCAAGCAAAGCCTCAGGTAG |
| Sequence-based reagent | TNFSF9-R | This paper | PCR primers | TCCAGGAACGGTCCACTAAC |
| Sequence-based reagent | IFNg-F | This paper | PCR primers | CGGGAGGTGCTGCTGATGG |
| Sequence-based reagent | IFNg-R | This paper | PCR primers | AGGGACAGCCTGTTACTACC |
| Sequence-based reagent | FOS-F | This paper | PCR primers | CCTGCCCCTTCTCAACGAC |
| Sequence-based reagent | FOS-R | This paper | PCR primers | GCTCCACGTTGCTGATGCT |
| Sequence-based reagent | FOSL2-F | This paper | PCR primers | GAGTCCTACTCCAGCGGTG |
| Sequence-based reagent | FOSL2-R | This paper | PCR primers | GACTGTAGGGATGTGAGCGT |
| Sequence-based reagent | DUSP6-F | Li and Counter, 2021 | PCR primers | ACTTGGACGTGTTGGAAGAGT |
| Sequence-based reagent | DUSP6-R | Li and Counter, 2021 | PCR primers | GCCTCGGGCTTCATCTATGAA |
| Sequence-based reagent | EGR1-F | Li and Counter, 2021 | PCR primers | CCTGACCACAGAGTCCTTTTCT |
| Sequence-based reagent | EGR1-R | Li and Counter, 2021 | PCR primers | AGGCCACTGACTAGGCTGA |
| Sequence-based reagent | FOSL1-F | Li and Counter, 2021 | PCR primers | CAGGAGTCATACGAGCCCTAG |
| Sequence-based reagent | FOSL1-R | Li and Counter, 2021 | PCR primers | GCCTGCAGGAAGTCTGTCAG |
| Sequence-based reagent | ACTIN-F | Li and Counter, 2021 | PCR primers | CGTGAAAAGATGACCCAGATCATGT |
| Sequence-based reagent | ACTIN-R | Li and Counter, 2021 | PCR primers | CGTGAGGGAGAGCATAGCC |
Additional files
-
Supplementary file 1
Raw RPPA data from the lungs of mice upon activating the KrasLSL-natG12D versus KrasLSL-comQ61R allele with respect to the wild-type Kras allele.
- https://cdn.elifesciences.org/articles/75715/elife-75715-supp1-v1.xlsx
-
Supplementary file 2
Gel densitometer results of recombination analysis of 14 organs after tamoxifen injection in Figure 4—figure supplement 2.
- https://cdn.elifesciences.org/articles/75715/elife-75715-supp2-v1.xlsx
-
Supplementary file 3
Statistical analysis of pairwise comparisons of the survival plots upon activating the four inducible KrasLSL alleles in Figure 4A.
- https://cdn.elifesciences.org/articles/75715/elife-75715-supp3-v1.xlsx
-
Supplementary file 4
Histopathology report for H&E-stained tissues from multiple organs from each of the four KrasLSL alleles.
- https://cdn.elifesciences.org/articles/75715/elife-75715-supp4-v1.xlsx
-
Supplementary file 5
Grading of observed tumors in multiple organs from each of the four inducible KrasLSL alleles.
- https://cdn.elifesciences.org/articles/75715/elife-75715-supp5-v1.xlsx
-
Supplementary file 6
Transcription factors identified in Gene Set Enrichment Analysis (GSEA) hallmarks of lung transcriptome in Figure 5—figure supplement 1.
- https://cdn.elifesciences.org/articles/75715/elife-75715-supp6-v1.xlsx
-
MDAR checklist
- https://cdn.elifesciences.org/articles/75715/elife-75715-mdarchecklist1-v1.docx
Download links
A two-part list of links to download the article, or parts of the article, in various formats.
Downloads (link to download the article as PDF)
Open citations (links to open the citations from this article in various online reference manager services)
Cite this article (links to download the citations from this article in formats compatible with various reference manager tools)
Genetically manipulating endogenous Kras levels and oncogenic mutations in vivo influences tissue patterning of murine tumorigenesis
eLife 11:e75715.
https://doi.org/10.7554/eLife.75715


