Sampling alternative conformational states of transporters and receptors with AlphaFold2
- Department of Molecular Physiology and Biophysics, Vanderbilt University, United States
- Department of Chemistry, Vanderbilt University, United States
- Institute for Drug Discovery, Leipzig University, Germany
Figures
Figure 1 with 4 supplements
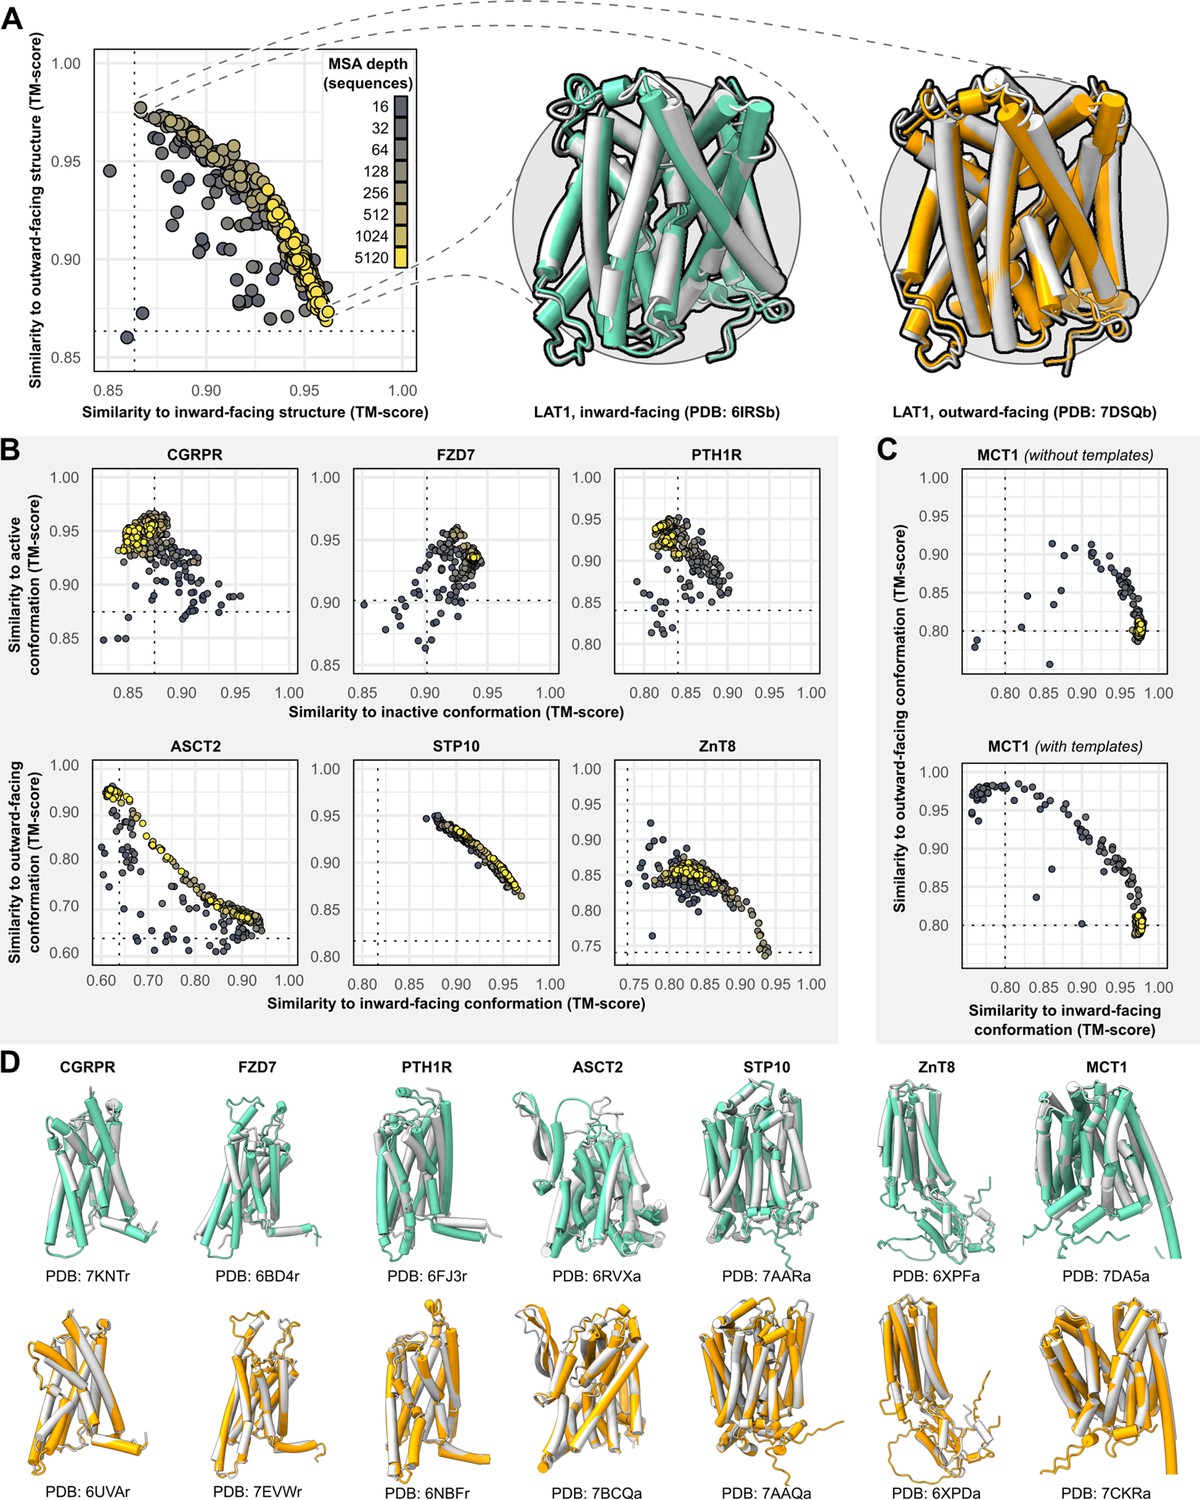
Alternative conformations of transporters and G-protein-coupled receptors (GPCRs) can be predicted by AlphaFold2 (AF2).
(A) Representative models of the transporter LAT1 in inward-facing (IF) and outward-facing (OF) conformations. Experimental structures shown in gray and models shown in colors. (B) Comparison of AF2 models with inactive/active or IF/OF experimental structures as a function of multiple sequence alignment (MSA) depth for GPCRs (top) and transporters (bottom), respectively. All models shown here were generated without templates. Dashed lines indicate the template modeling (TM) score between experimental structures and are shown for reference. (C) Supplementing shallow MSAs with OF templates allows AF2 to predict the OF conformation of MCT1. (D) Experimental structures superimposed over models with the greatest TM scores. Inactive/IF and active/OF cartoons shown on the top and bottom in teal and orange, respectively.
Figure 1—figure supplement 1
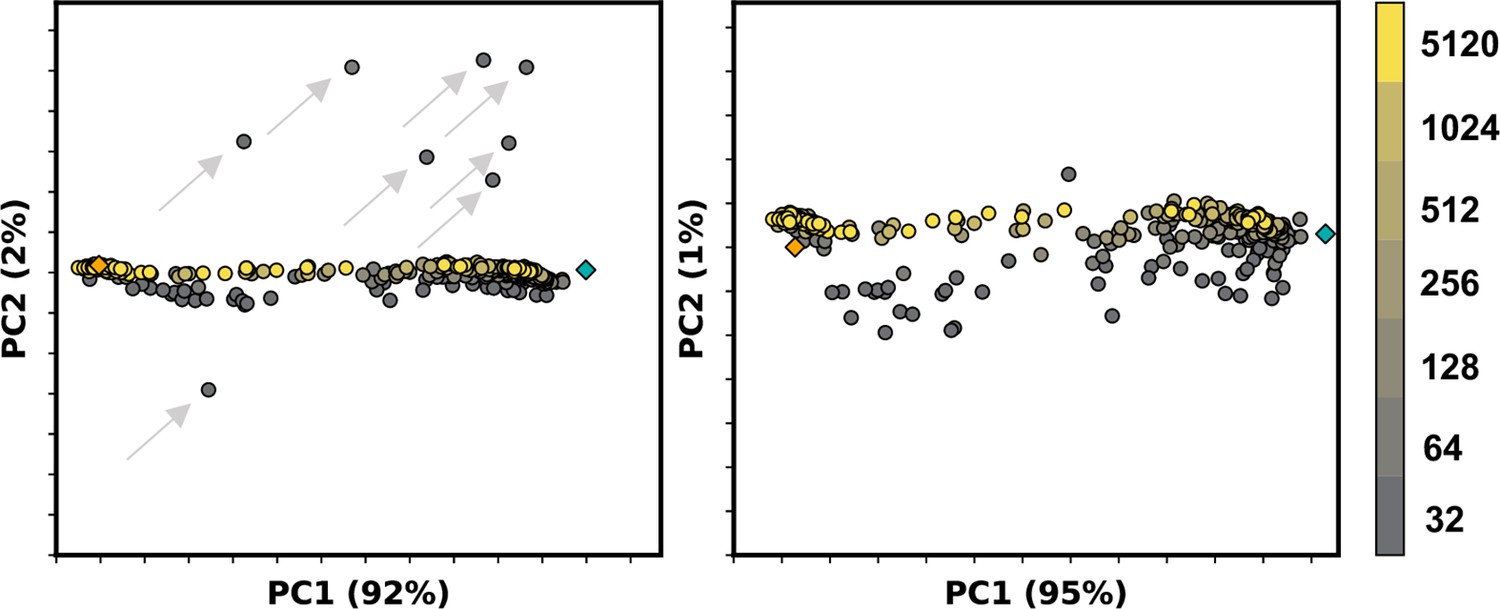
Example principal component analysis (PCA) of ASCT2 models generated by AlphaFold2 (AF2) containing outlier models.
Colors correspond to multiple sequence alignment (MSA) depth in sequences, while orange and teal diamonds refer to the outward- and inward-facing experimental structures, respectively. Left: outlier models are indicated by gray arrows and could be clearly delineated along PC2. Right: removal of these models reveal collective variables along PC2.
Figure 1—figure supplement 2
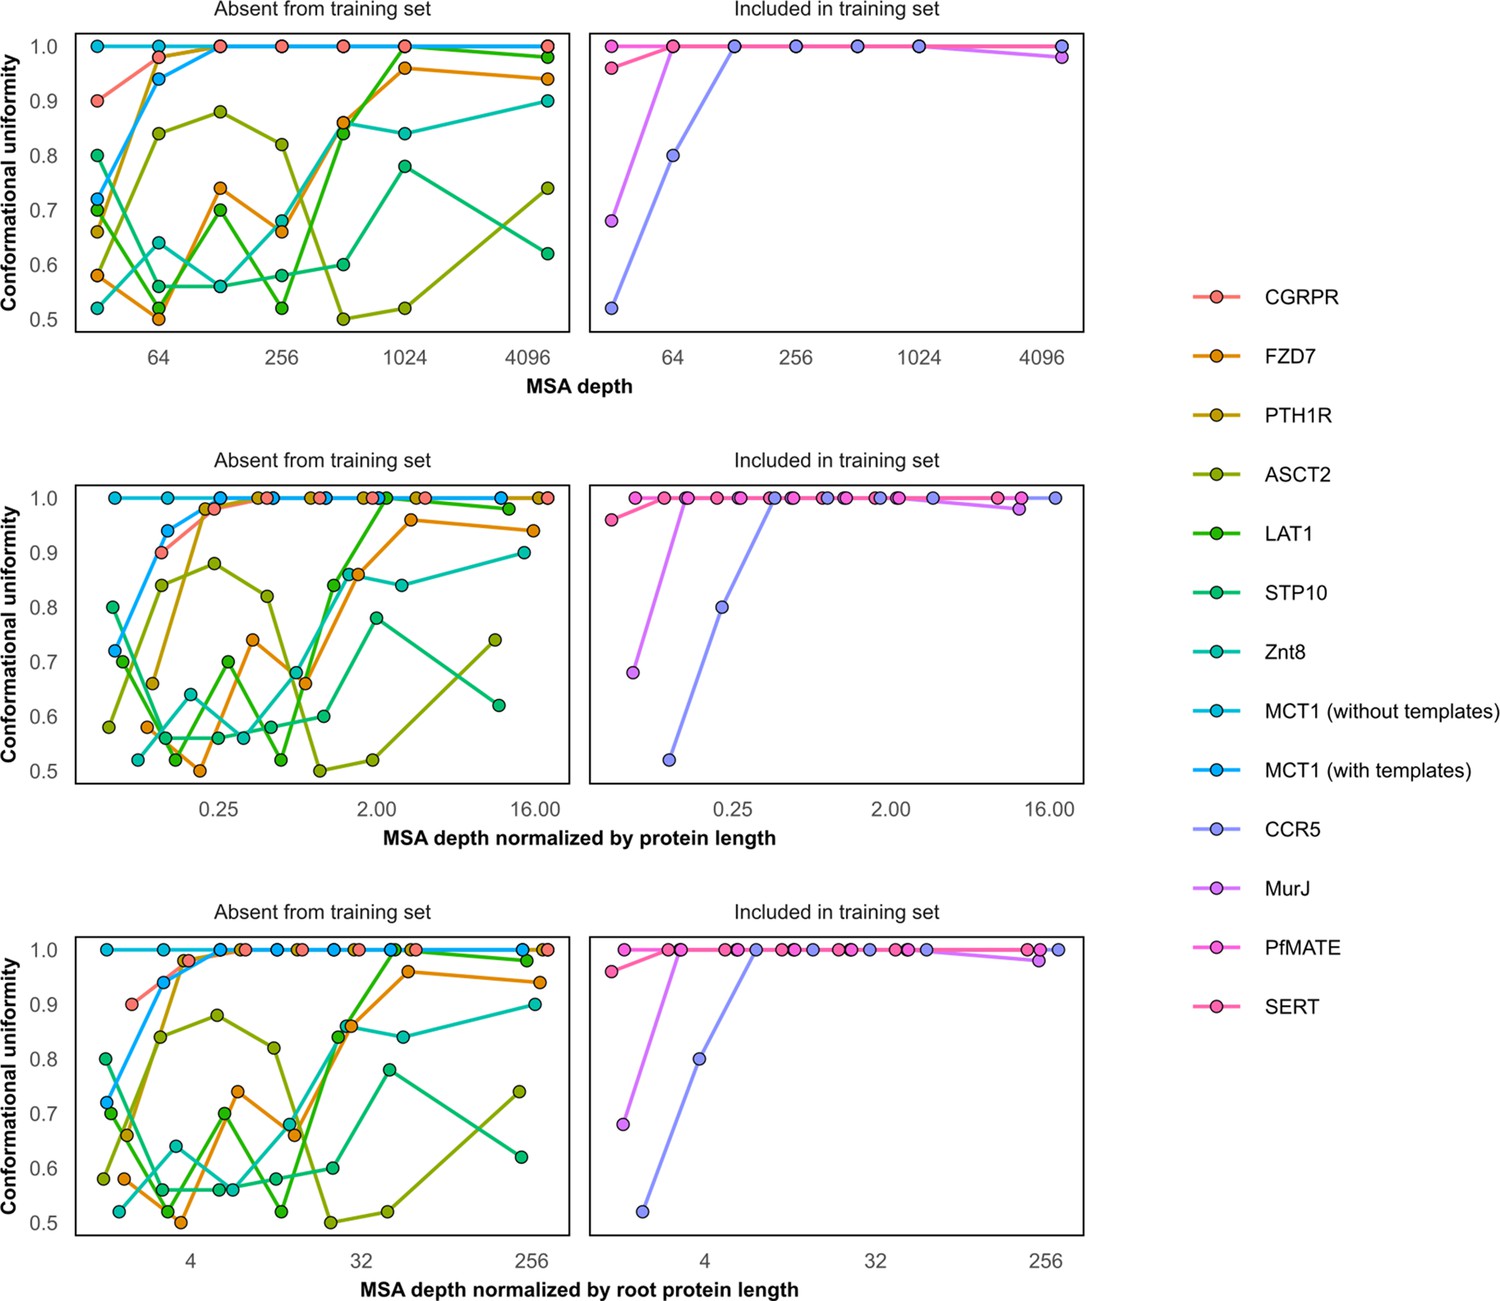
Conformational homogeneity as a function of multiple sequence alignment (MSA) depth.
Conformational homogeneity was defined by classifying models as more similar to one of the two experimental structures based on their template modeling (TM) scores and calculating the fraction of models in the larger group. MCT1 and proteins in the training set (CCR5, MurJ, PfMATE, and SERT) were biased toward one specific conformation (uniformity = 1) even when using shallow MSAs. X-Axis shown on log-2 scale for clarity. Models generated using MSAs with 16 sequences were omitted from this figure.
Figure 1—figure supplement 3
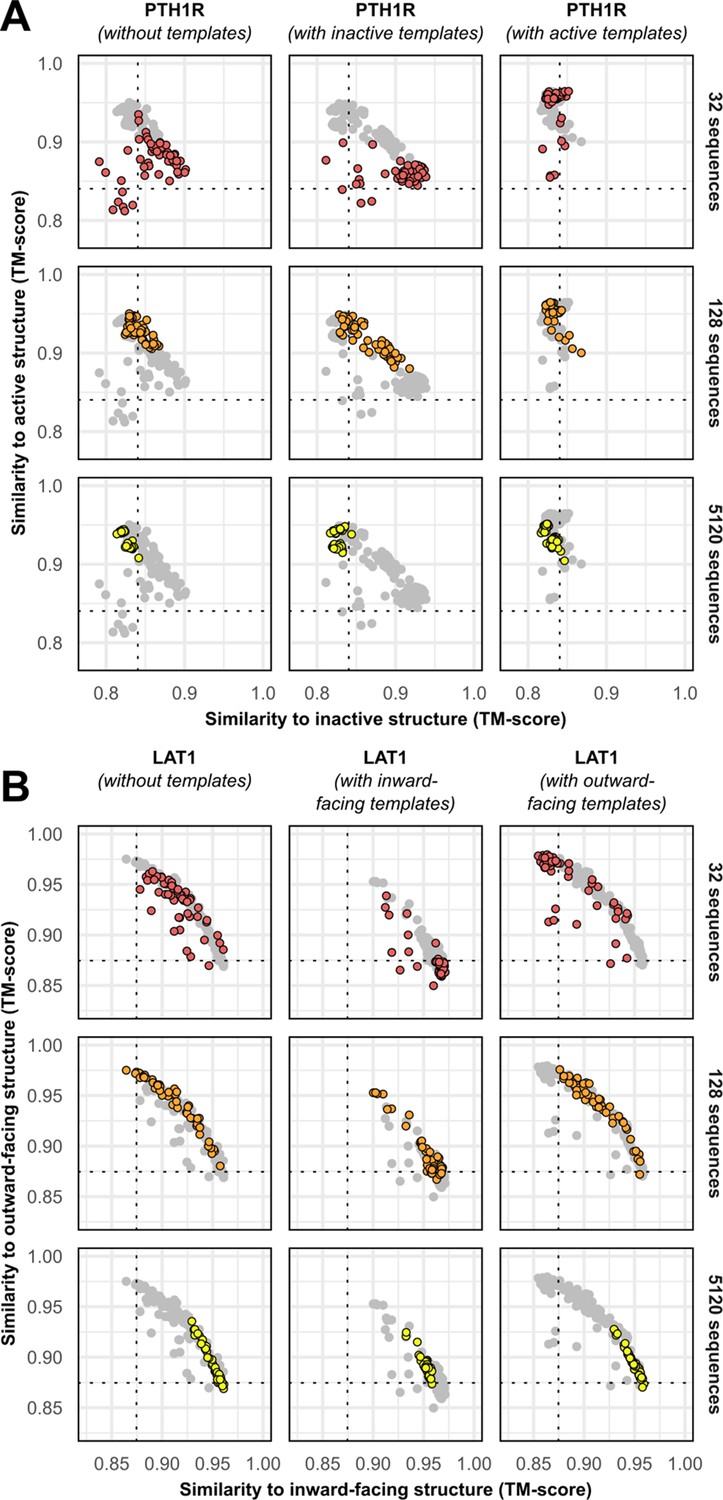
Templates contribute to conformational sampling only when shallow multiple sequence alignments (MSAs) are provided.
(A) PTH1R. (B) LAT1.
Figure 1—figure supplement 4
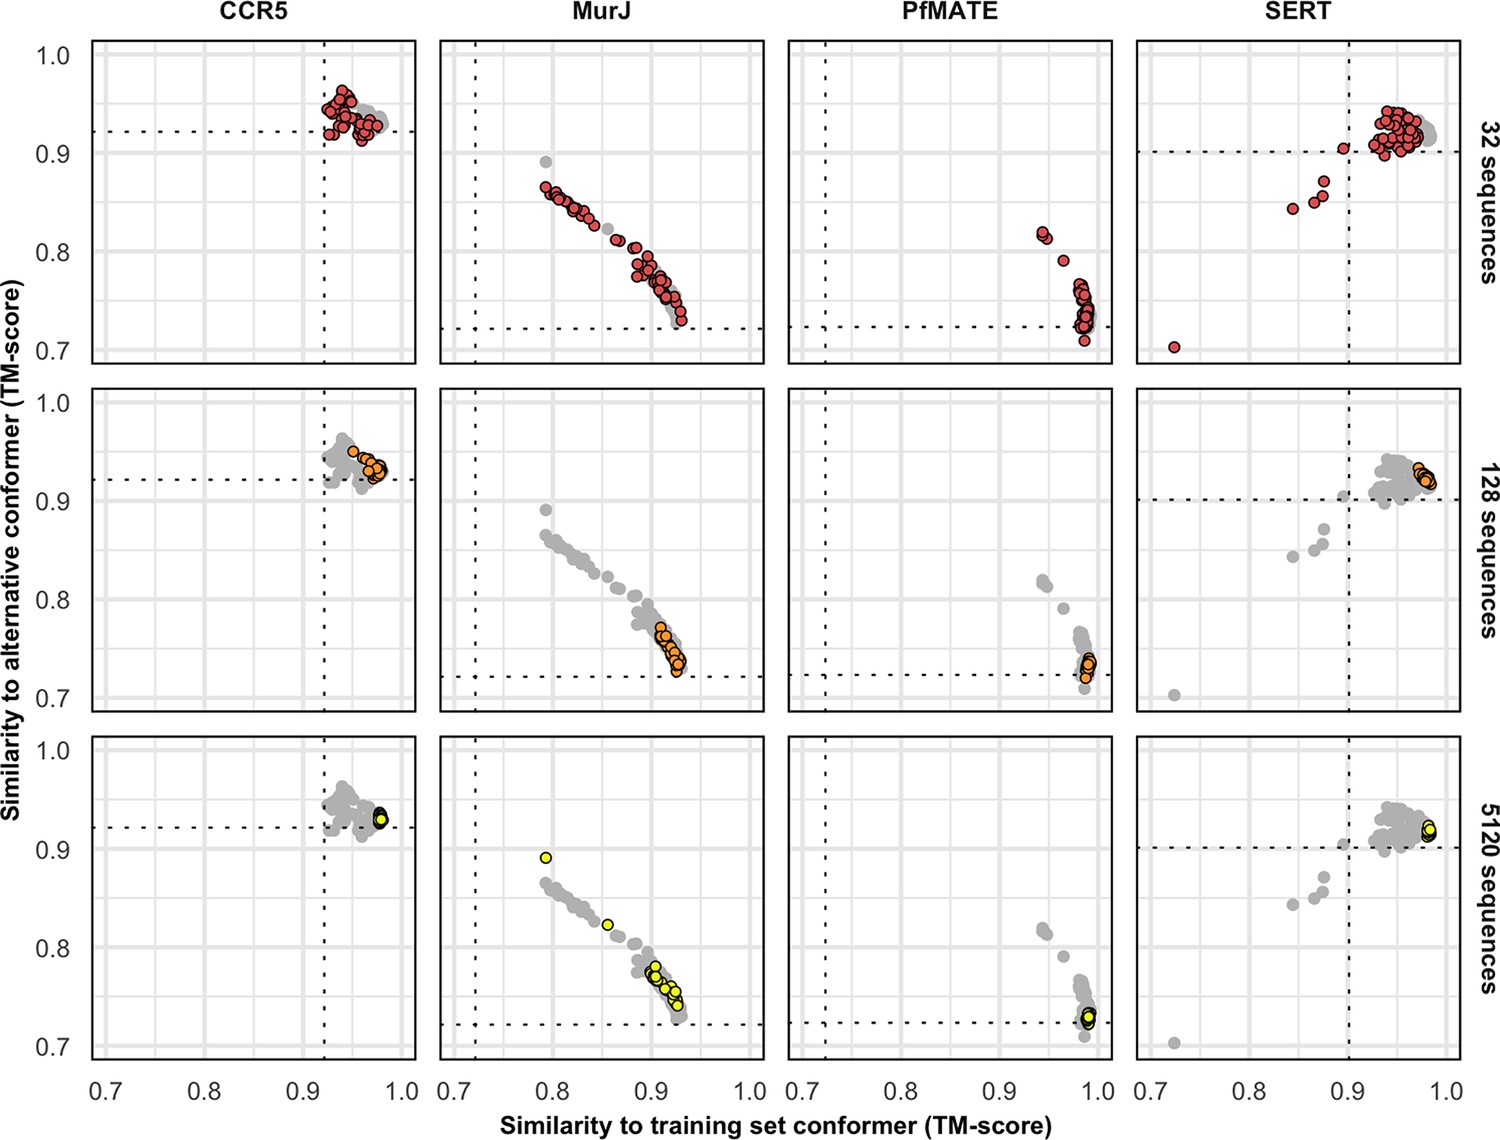
Protein targets with one conformation in the training set cannot be predicted in the alternative conformation.
The following experimental structures served as references for the training and the alternative conformations, respectively: 5UIWr and 7F1Qr (CCR5), 5T77a and 6NC9a (MurJ), 3VVNa and 6FHZa (PfMATE), and 5I6Xa and 6DZZa (SERT).
Figure 2 with 1 supplement

Comparison between the movement undergone by each Cα atom between the two superimposed experimental structures and their root mean square fluctuation (RMSF) values among AlphaFold2 (AF2) models.
Residues with low confidence (pLDDT ≤75) were omitted from this plot for all proteins except PTH1R. Multiple sequence alignment (MSA) sizes of 128 sequences were used for all predictions, except for MCT1 with templates, which instead used 32 sequences to capture the outward-facing (OF) conformation. pLDDT refers to each residue’s predicted accuracy, with a value of 100 indicating maximum confidence.
Figure 2—figure supplement 1
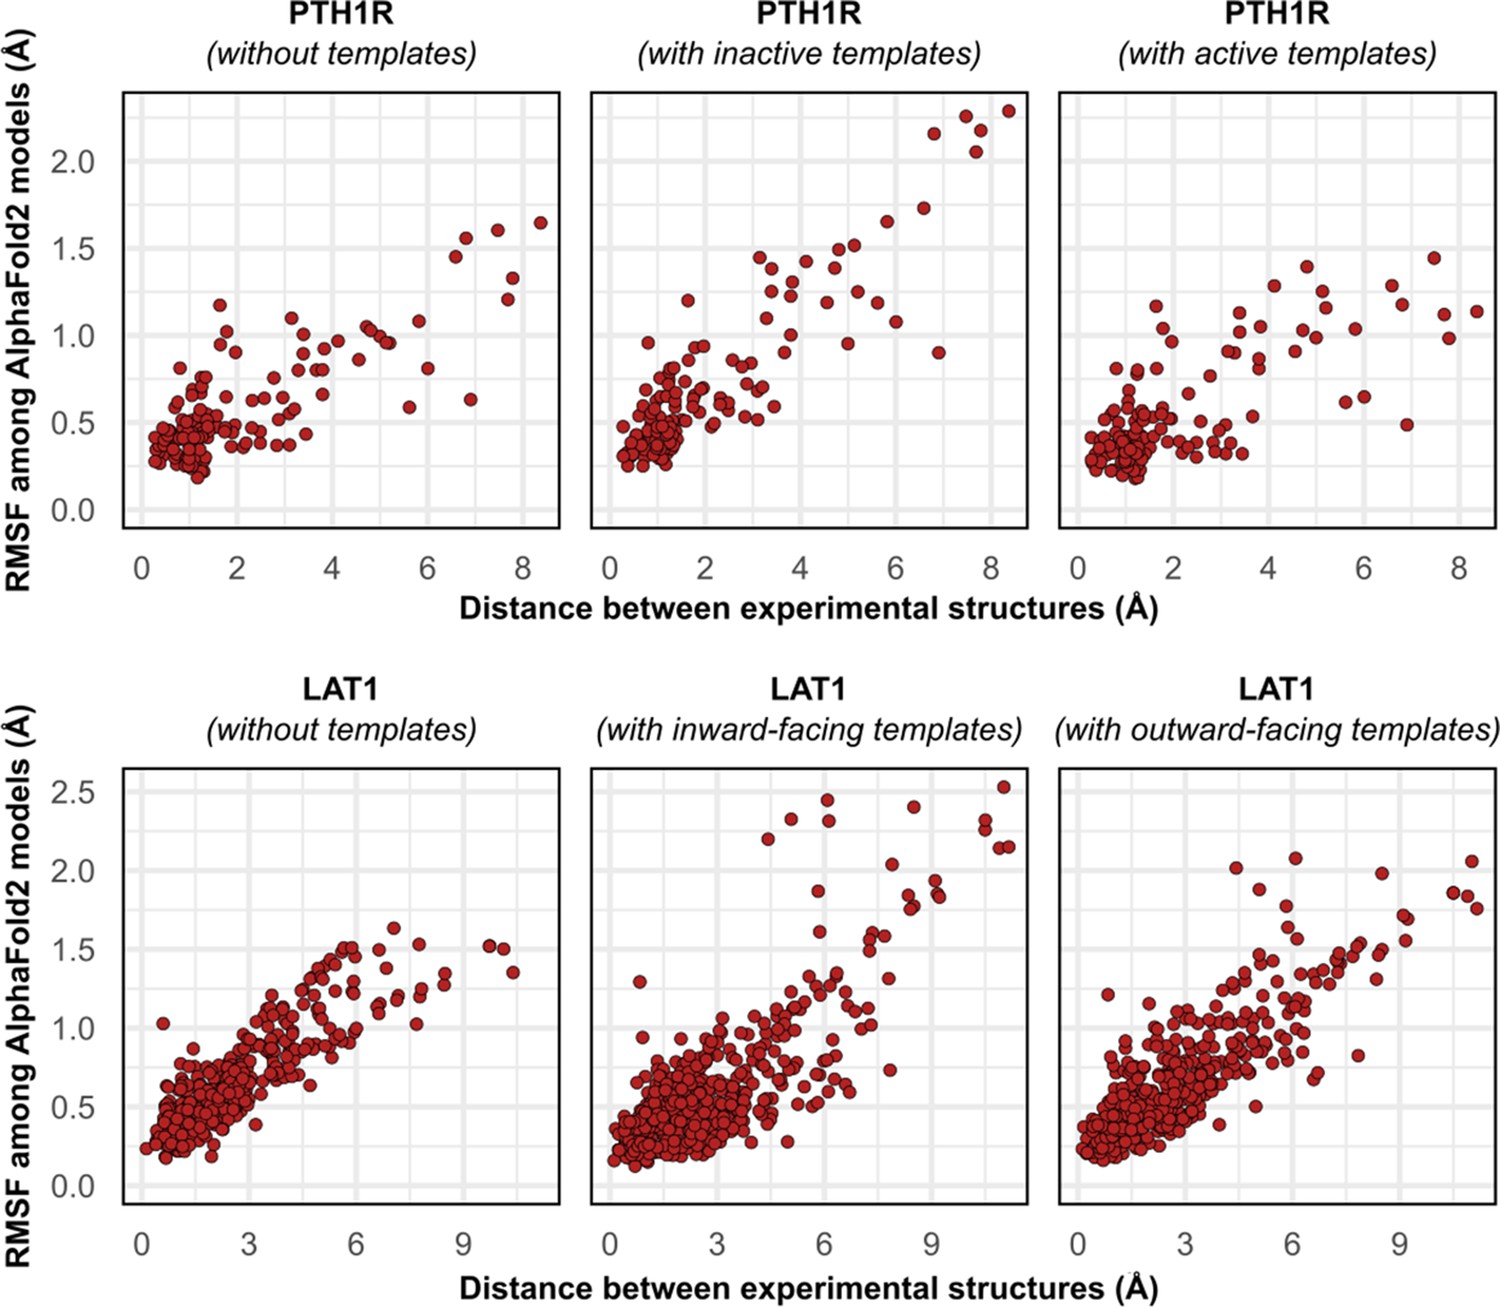
Comparison between the movement undergone by each Cα atom between the two superimposed experimental structures of PTH1R and LAT1 and their root mean square fluctuation (RMSF) values among AlphaFold2 (AF2) models generated with templates.
Figure 3 with 2 supplements
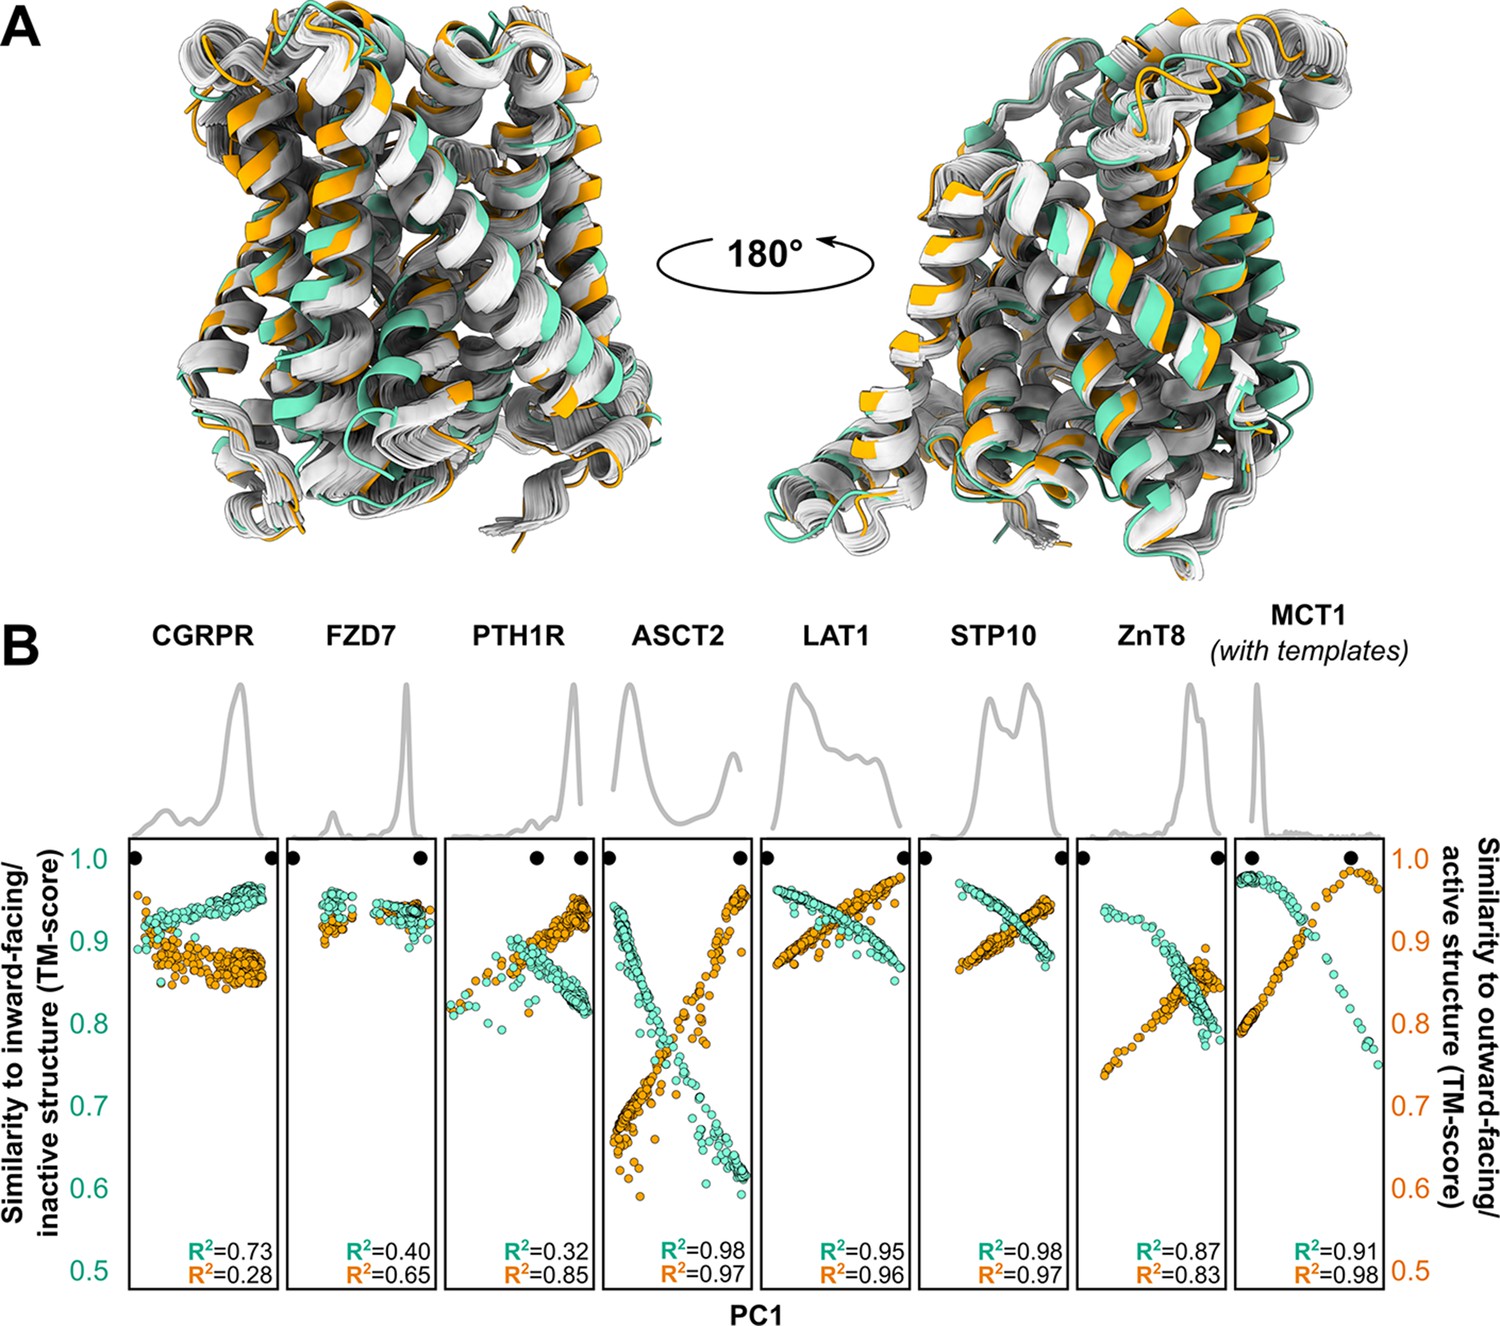
Distinct conformations can be delineated using principal component analysis (PCA).
(A) Conformational heterogeneity in AlphaFold2 (AF2) models of LAT1. Experimental inward-facing (IF) and outward-facing (OF) conformations shown in teal and orange, respectively, while the gallery of AF2 models generated using 128 sequences are shown in gray. (B) Distribution of AF2 models generated using multiple sequence alignments (MSAs) with 32 or more sequences across the first principal component (PC1) following PCA (gray traces). Scatter plots comparing each model’s position along PC1 and its structural similarity to experimentally determined structures. Teal: similarity to IF (transporters) or inactive (G-protein-coupled receptors, GPCRs) conformation. Orange: similarity to OF (transporters) or active (GPCRs) conformation. Each model is shown twice, once in teal and once in orange. Native structures are shown as black dots.
Figure 3—figure supplement 1
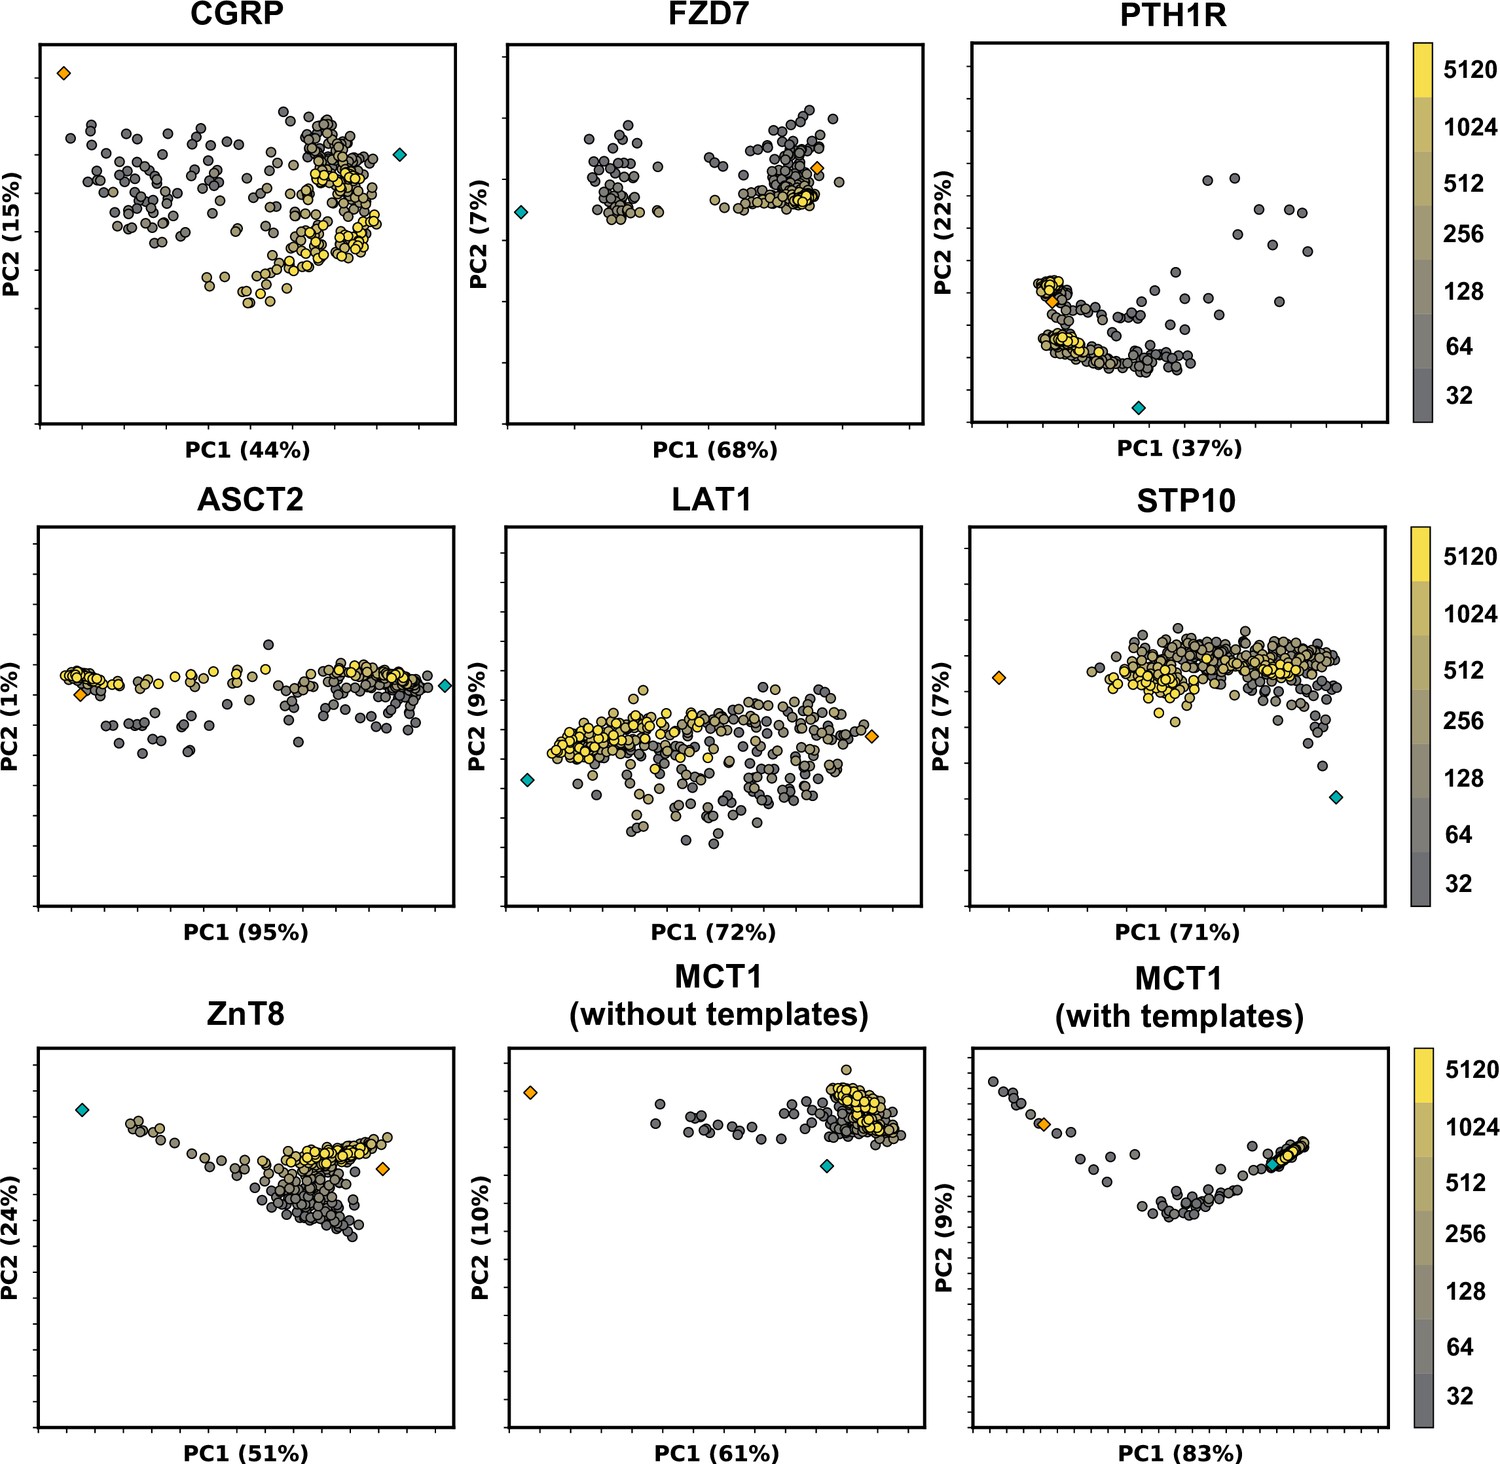
Models sampled by AlphaFold2 (AF2) in multiple conformations cannot be fully explained by linear interpolation of two end structures.
Principal component analysis (PCA) of AF2 models, with colors corresponding to the depth of the multiple sequence alignments (MSAs) used for prediction. Experimental structures in an inward-facing or inactive state are shown as teal diamonds, while structures in an outward-facing or active state are shown as orange diamonds.
Figure 3—figure supplement 2
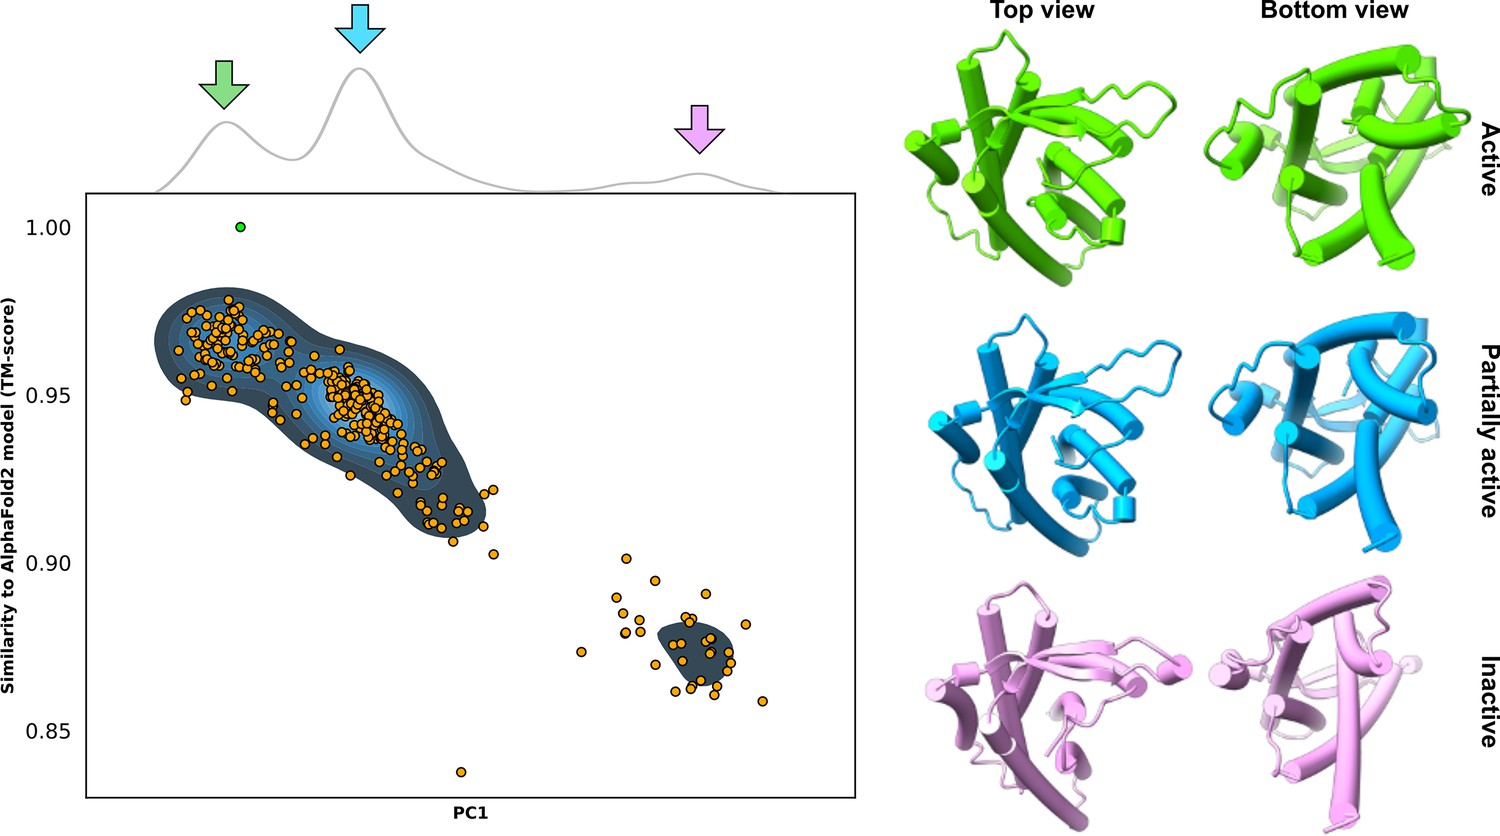
Example predictions of the adhesion G-protein-coupled receptor (aGPCR) GPR114/ADGRG5.
Top: kernel density estimate of the first principal component (PC1) following principal component analysis (PCA on all AlphaFold2 (AF2)) models. Bottom: comparison of PC1 and template modeling (TM) score values; alignments were measured from the AF2 database model, which is indicated by the green dot. Right: models extracted from the cluster centers appear to adopt three distinct conformations.
Additional files
Download links
A two-part list of links to download the article, or parts of the article, in various formats.
Downloads (link to download the article as PDF)
Open citations (links to open the citations from this article in various online reference manager services)
Cite this article (links to download the citations from this article in formats compatible with various reference manager tools)
Sampling alternative conformational states of transporters and receptors with AlphaFold2
eLife 11:e75751.
https://doi.org/10.7554/eLife.75751


