Von Willebrand factor A1 domain stability and affinity for GPIbα are differentially regulated by its O-glycosylated N- and C-linker
- Program in Cellular and Molecular Medicine, Boston Children’s Hospital and Department of Biological Chemistry and Molecular Pharmacology, Harvard Medical School, United States
- Department of Chemistry and Chemical Biology, Northeastern University, United States
- Department of Physics, East Carolina University, United States
Figures
Figure 1
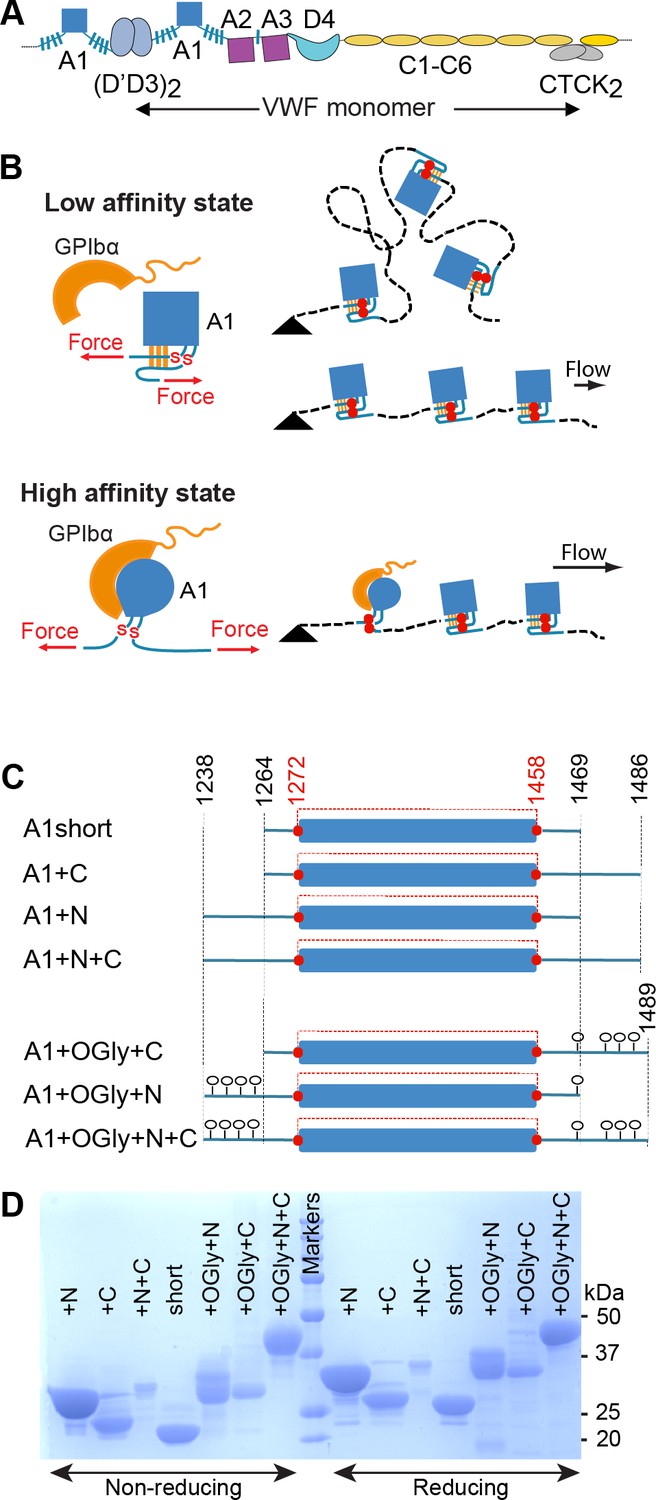
von Willebrand factor (VWF), hydrodynamic flow, A1 activation, and A1 linkers.
(A) N- and C-terminal linkage and domain organization of a VWF monomer in a VWF concatemer. Monomers are connected head-to-head and tail-to-tail. (B) When exposed to elongational flow and tethered (black triangle) on a vessel wall, VWF concatemers extend to a linear shape. At higher elongational flow, which exerts higher mechanical tension along the length of the concatemer (highest at the tether point and zero at the downstream end), A1 undergoes transition from a low- to a high-affinity state as a consequence of tensile forces transmitted to it through its linkers. The disulfide bond between Cys1272 and Cys1458 is indicated with red SS. (C) A1 protein constructs studied here that differ in length of linkers and were expressed in E. coli (not glycosylated) or in mammalian cells (O-glycosylated) (O-glycans shown as lollipops). The long-range disulfide bond is schematized in red. (D) A1 constructs were subjected to sodium dodecyl–sulfate polyacrylamide gel electrophoresis (SDS–PAGE) and stained with Coomassie Blue. Amount of protein added per lane differed between protein constructs but was identical for each construct on reducing and nonreducing PAGE.
Figure 2
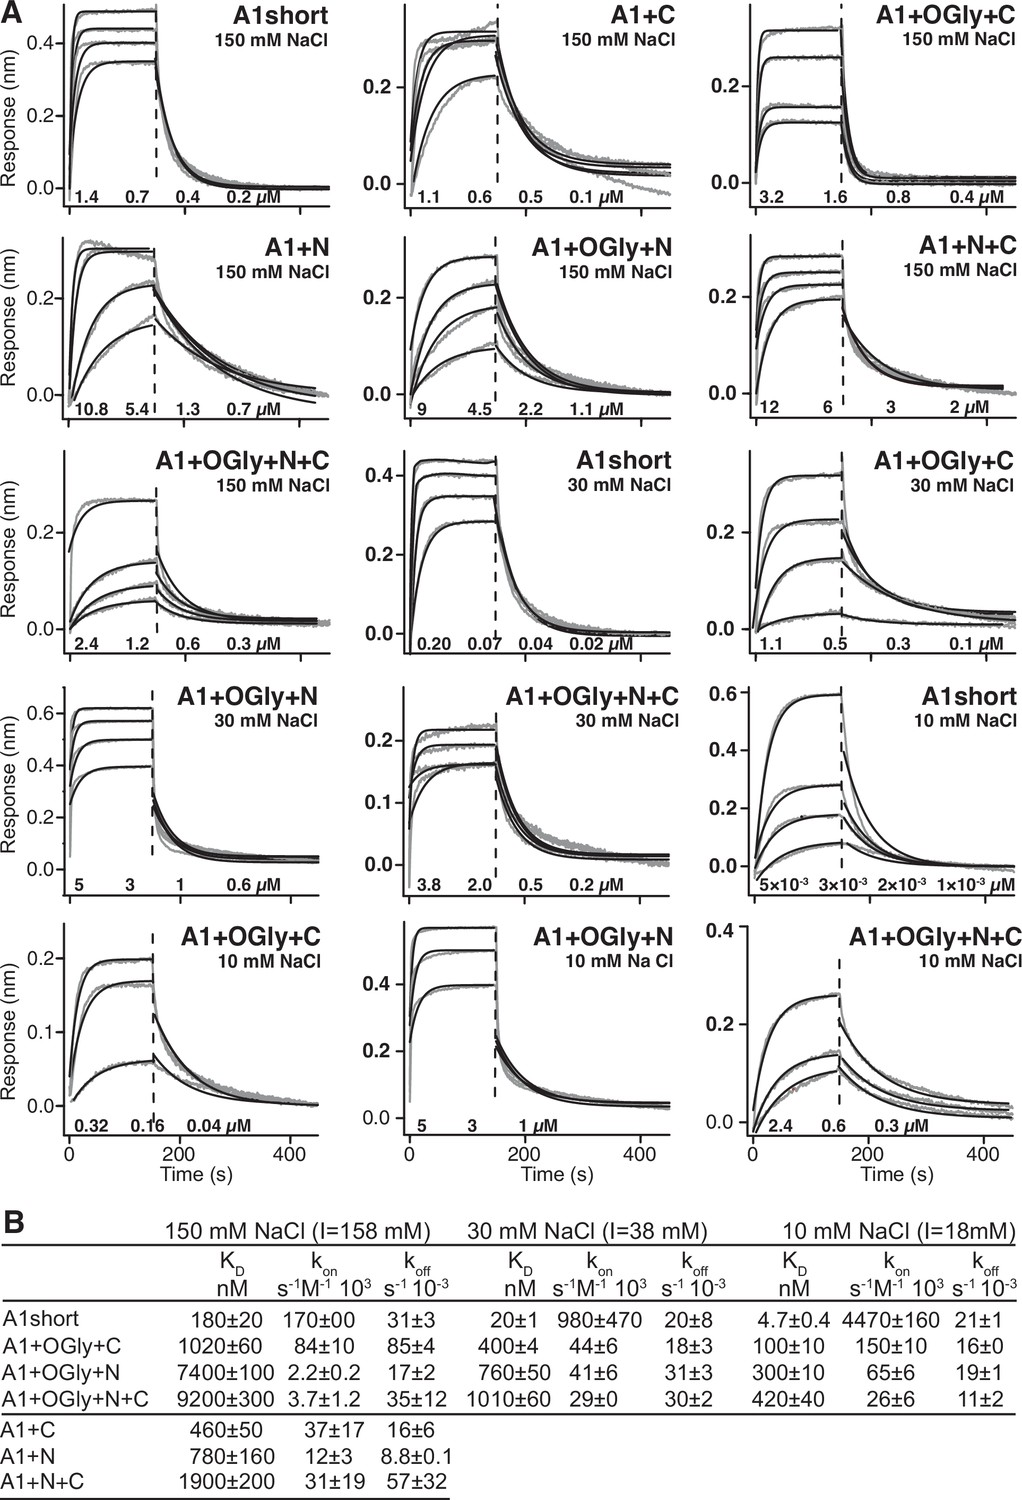
Effect of A1 linkers, their glycosylation, and ionic strength on GPIbα-binding kinetics.
(A) Biolayer interferometry (BLI) traces in gray are shown for the indicated concentrations of the indicated A1 construct at the indicated NaCl concentration. In each panel, all A1 concentrations were fit globally to a one-site-binding model to obtain a single kon and koff. Thin black lines show fits. Fitting errors ranged from 1% to 5% of the fit values. Vertical dashed lines mark the beginning of the dissociation phase. (B) Kinetic constants and derived KD. Errors show difference from mean of n = 2 independent experiments.
Figure 3
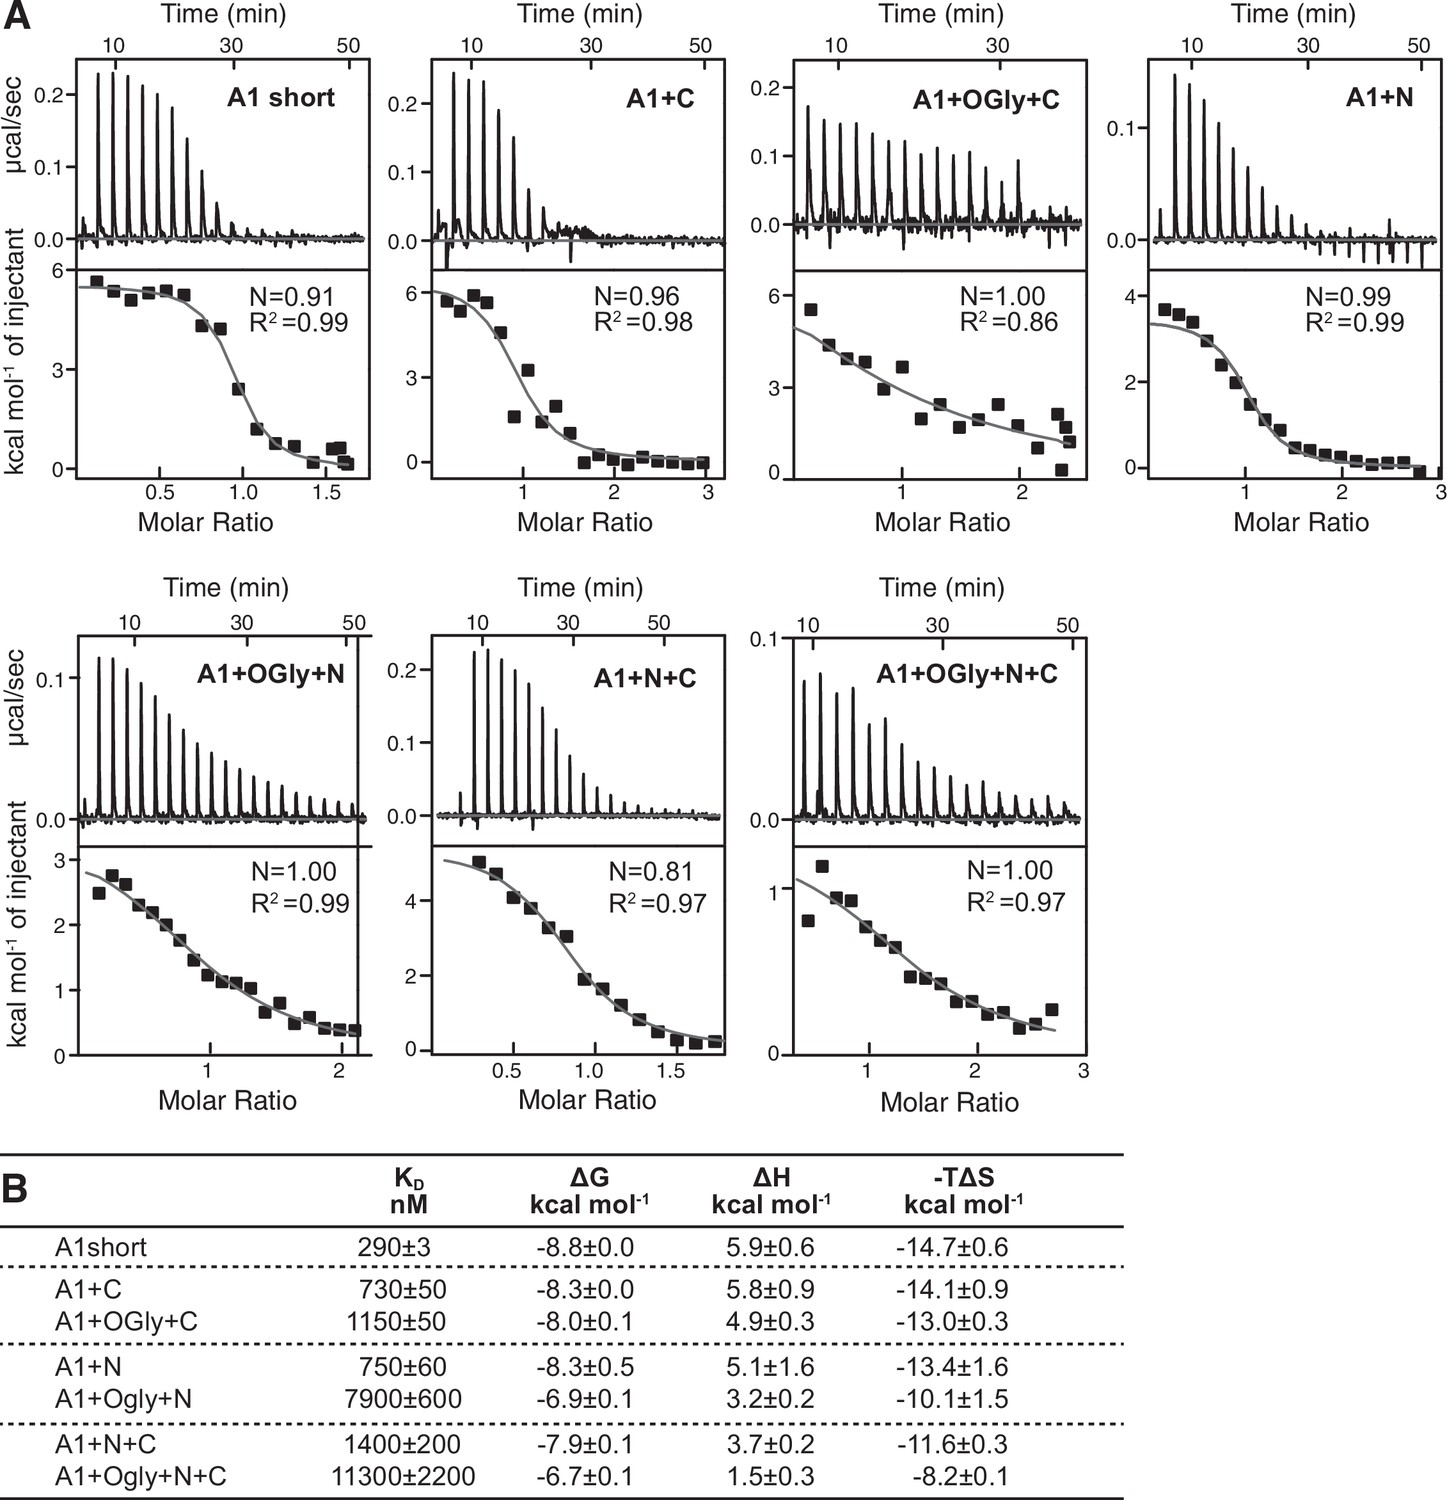
Effect of A1 linkers and their glycosylation on GPIbα-binding thermodynamics.
(A) Panels show ITC traces of heat absorption after each injection (above) and fit of enthalpy to the binding isotherm (below) in 150 mM NaCl at 22°C. (B) Table summarizing the reaction Gibbs free energies (∆G) and the enthalpic (∆H) and entropic (T∆S) contributions. Errors show difference from mean of n = 2 independent experiments, except for A1+N+C which shows the fitting error from one experiment.
Figure 4
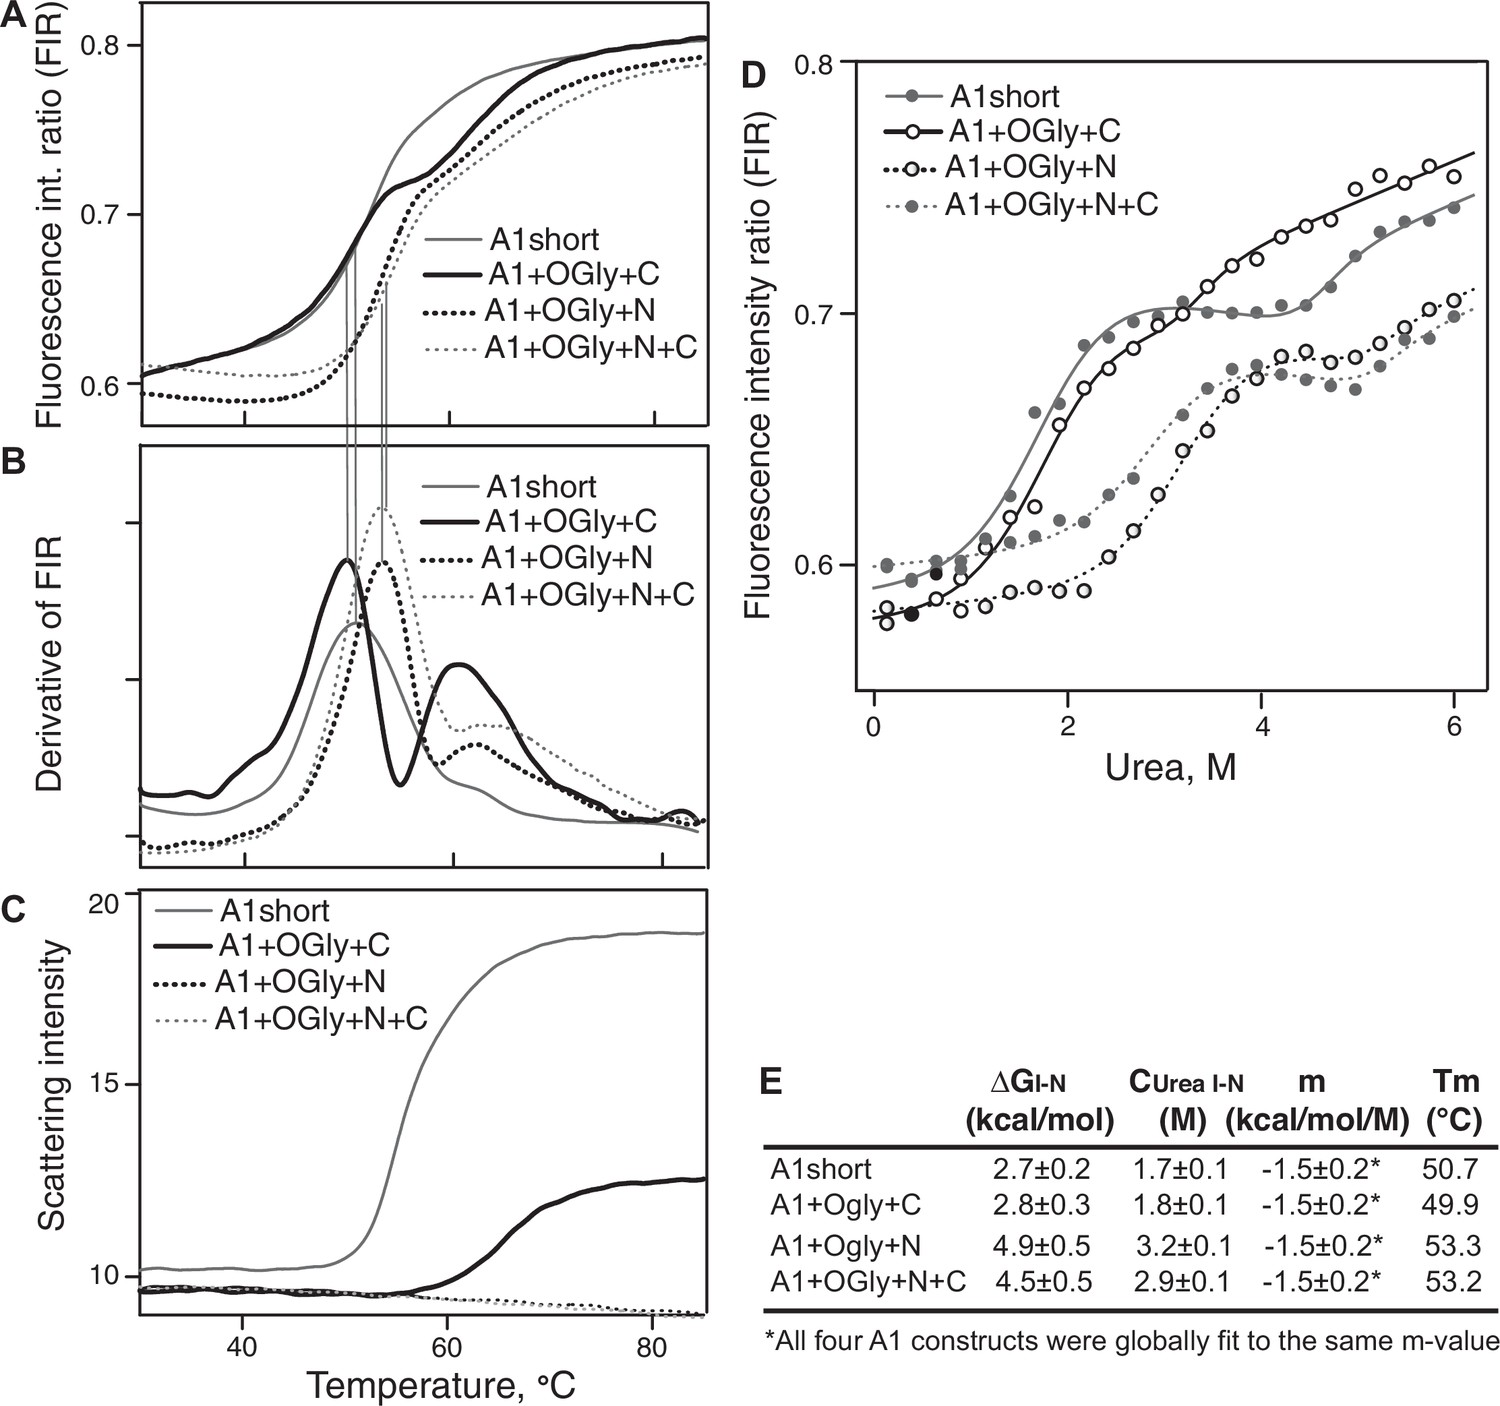
Stability of A1 constructs to heat and urea and free energy difference between the native and intermediate A1 states.
(A–C) Effect of heating from 30 to 85°C on A1 stability and aggregation. (A) Unfolding was measured by excitation of tryptophan at 275 nm and measuring the ratio of the fluorescence intensity at 350 and 330 nm (fluorescence intensity ratio [FIR] = I350/I330). (B) The derivative of data in A (dFIR/dT) shows two unfolding transitions for each A1 construct and provides evidence for three states of A1: N, I, and U as described in Results. (C) Backscattered light intensity as a measure of A1 aggregation. (D) Unfolding of A1 by urea measured at 20°C by FIR as in panel A. Lines show fits to the three-state model of A1 unfolding as described in Methods and Results (see also Source Data). (E) Tabulation of the melting temperature of the native state (Tm) from panels A and B and the free energy difference between the native and intermediate states of A1 (ΔGI–N), the concentration of urea at which the I and N states are equally populated (Curea I–N), and m, from the fits in panel D.
-
Figure 4—source data 1
A1 short.
- https://cdn.elifesciences.org/articles/75760/elife-75760-fig4-data1-v1.txt
-
Figure 4—source data 2
A1 short + C.
- https://cdn.elifesciences.org/articles/75760/elife-75760-fig4-data2-v1.txt
-
Figure 4—source data 3
A1 short + N.
- https://cdn.elifesciences.org/articles/75760/elife-75760-fig4-data3-v1.txt
-
Figure 4—source data 4
A1 short + NC.
- https://cdn.elifesciences.org/articles/75760/elife-75760-fig4-data4-v1.txt
Figure 5 with 5 supplements
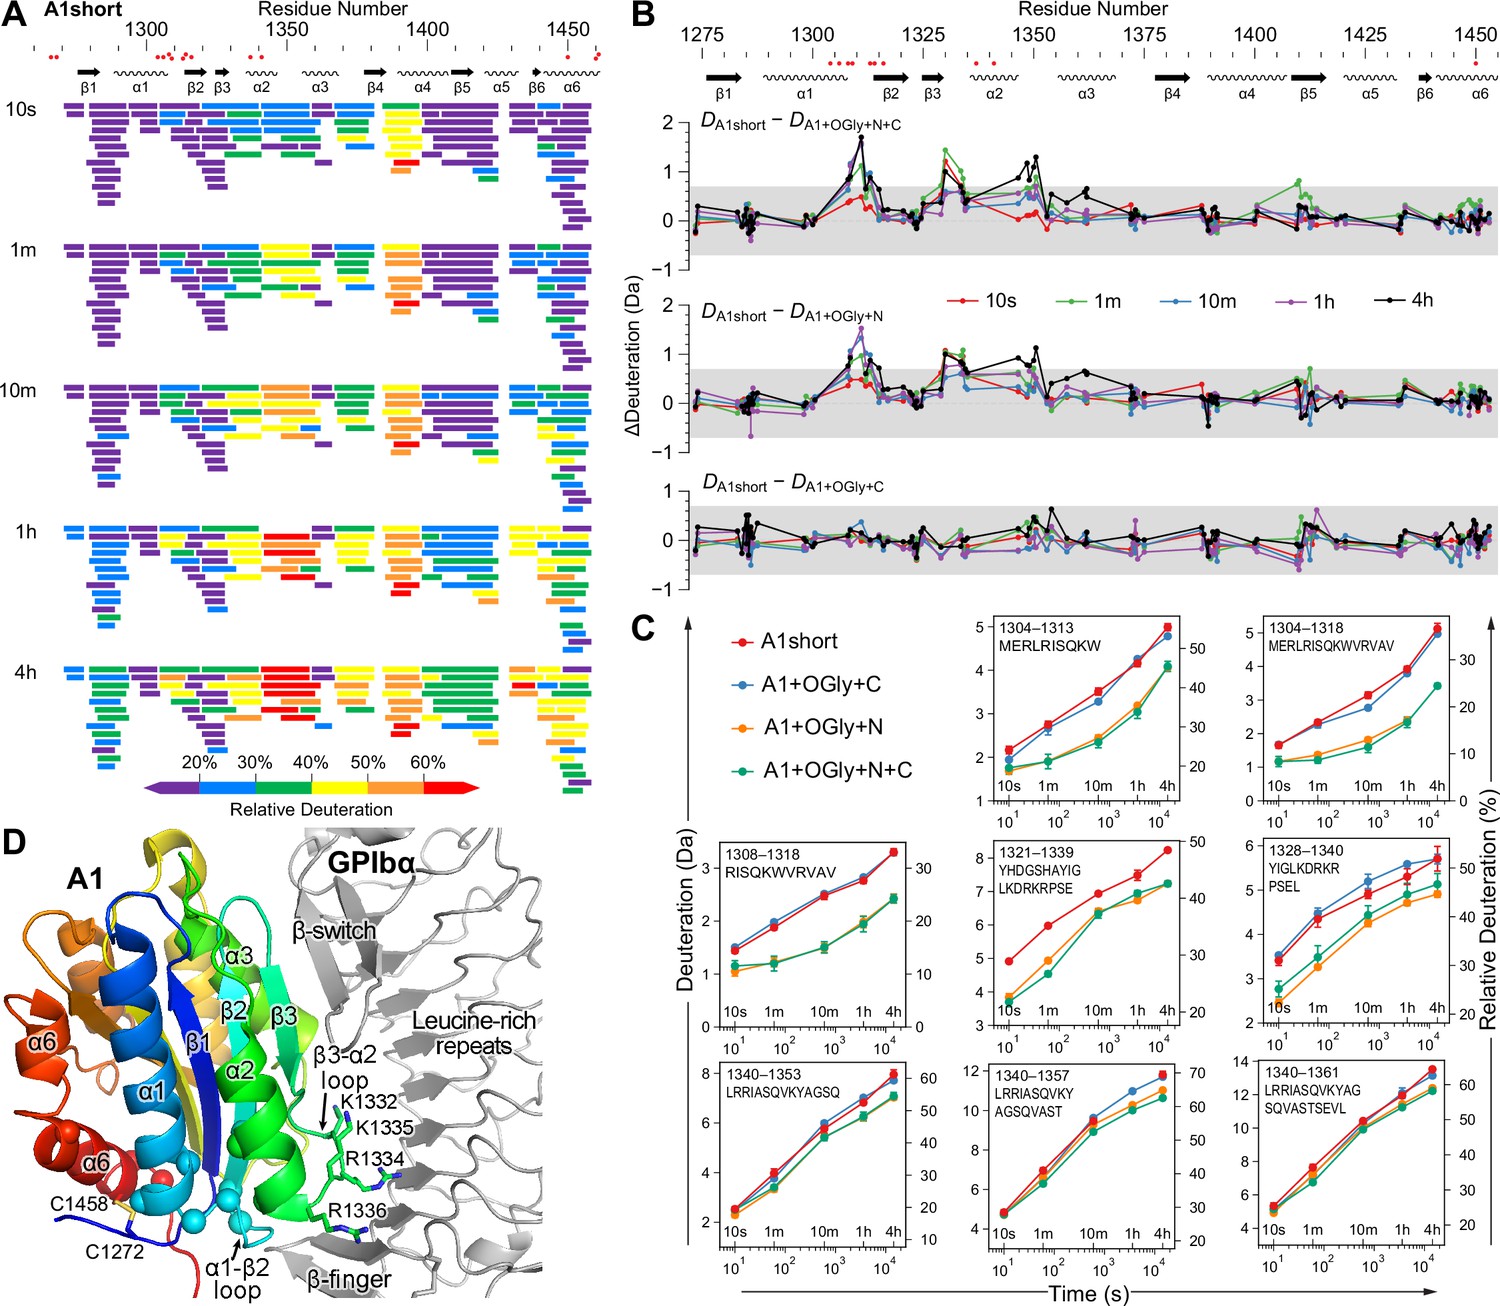
The N-linker decreases A1 dynamics measured by hydrogen deuterium exchange (HDX).
(A) Relative deuterium exchange at all time points for A1 short as % of the available amide backbone H atoms in each peptide, colored according to the key. Figure 5—figure supplements 1 and 2 show data for all constructs. (B) Difference (Δ) in HDX at all time points of A1 short minus HDX for the other three constructs as indicated. In (A) and (B), residues with VWD type 2B mutations are shown below sequence numbers as red circles. (C) Full HDX kinetics for selected peptides. Figure 5—figure supplements 3–5 show data for all peptides. (D) Structure of A1 bound to GPIbα (PDB 1SQ0). A1 is colored rainbow from N- (blue) to C-terminus (red). Residues with VWD type 2B mutations are shown as Cα atom spheres. Labeled residues are shown in stick. GPIbα is shown in silver, from the β-finger to the β-switch.
Figure 5—figure supplement 1
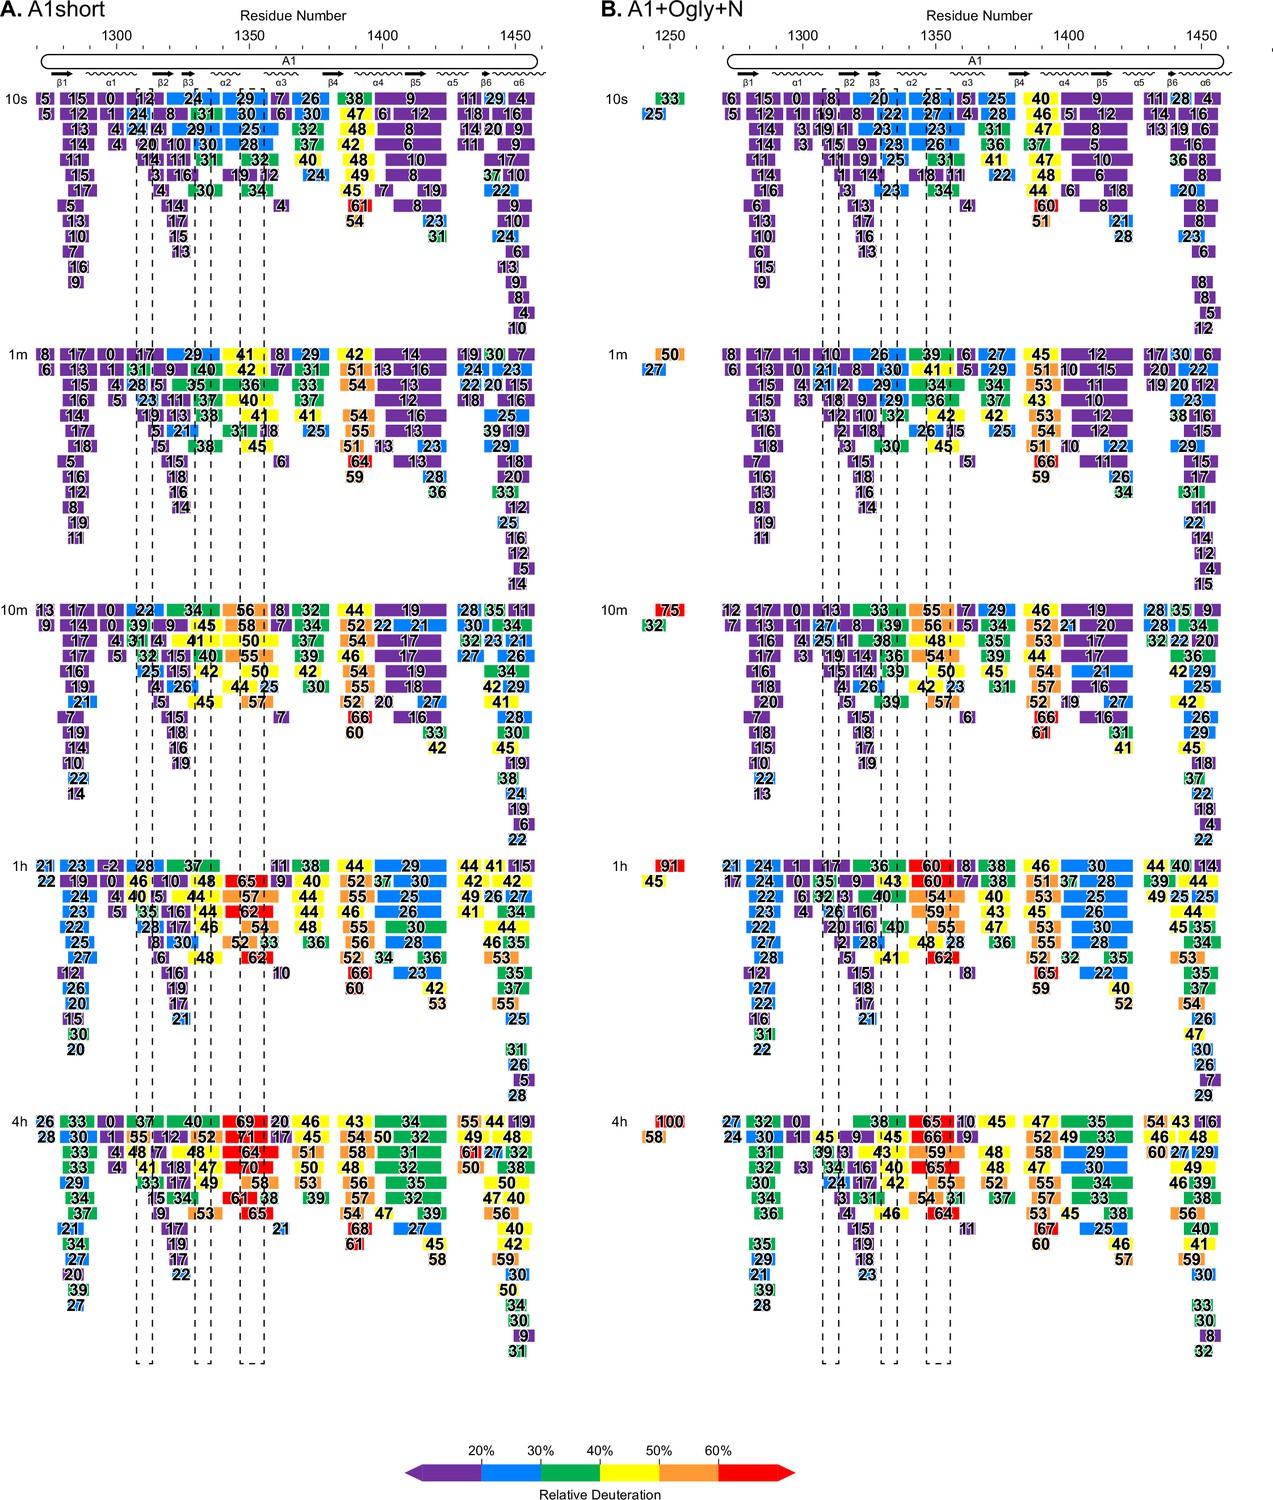
Complete hydrogen deuterium exchange (HDX) peptide coverage at each indicated time point.
(A, B) Peptides from the indicated A1 fragments are colored according to the key with deuterium exchange at all time points as % of the available amide backbone H atoms in each peptide. Residue number based on the immature sequence indicated above and secondary structures indicated below.
Figure 5—figure supplement 2

Complete hydrogen deuterium exchange (HDX) peptide coverage at each indicated time point.
(A, B) Peptides from the indicated A1 fragments are colored according to the key with deuterium exchange at all time points as % of the available amide backbone H atoms in each peptide. Residue number based on the immature sequence indicated above and secondary structures indicated below.
Figure 5—figure supplement 3
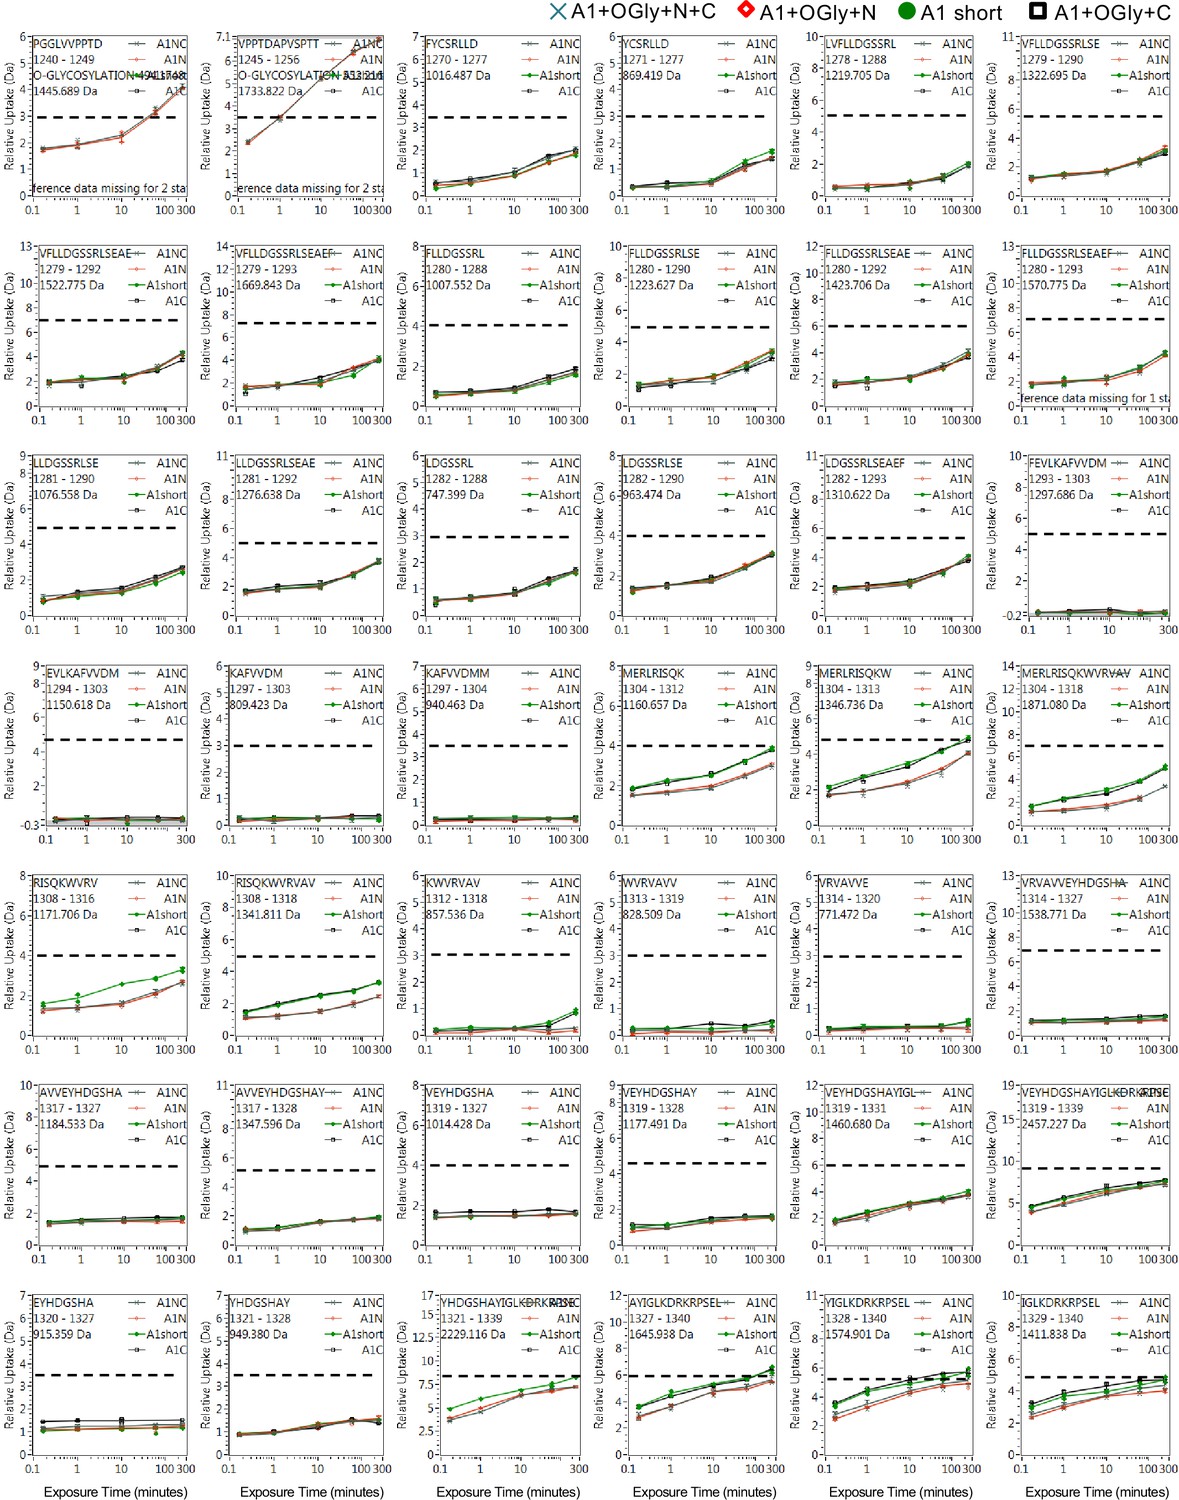
Full hydrogen deuterium exchange (HDX) kinetics for peptides, one of three figures.
Figure 5—figure supplement 4
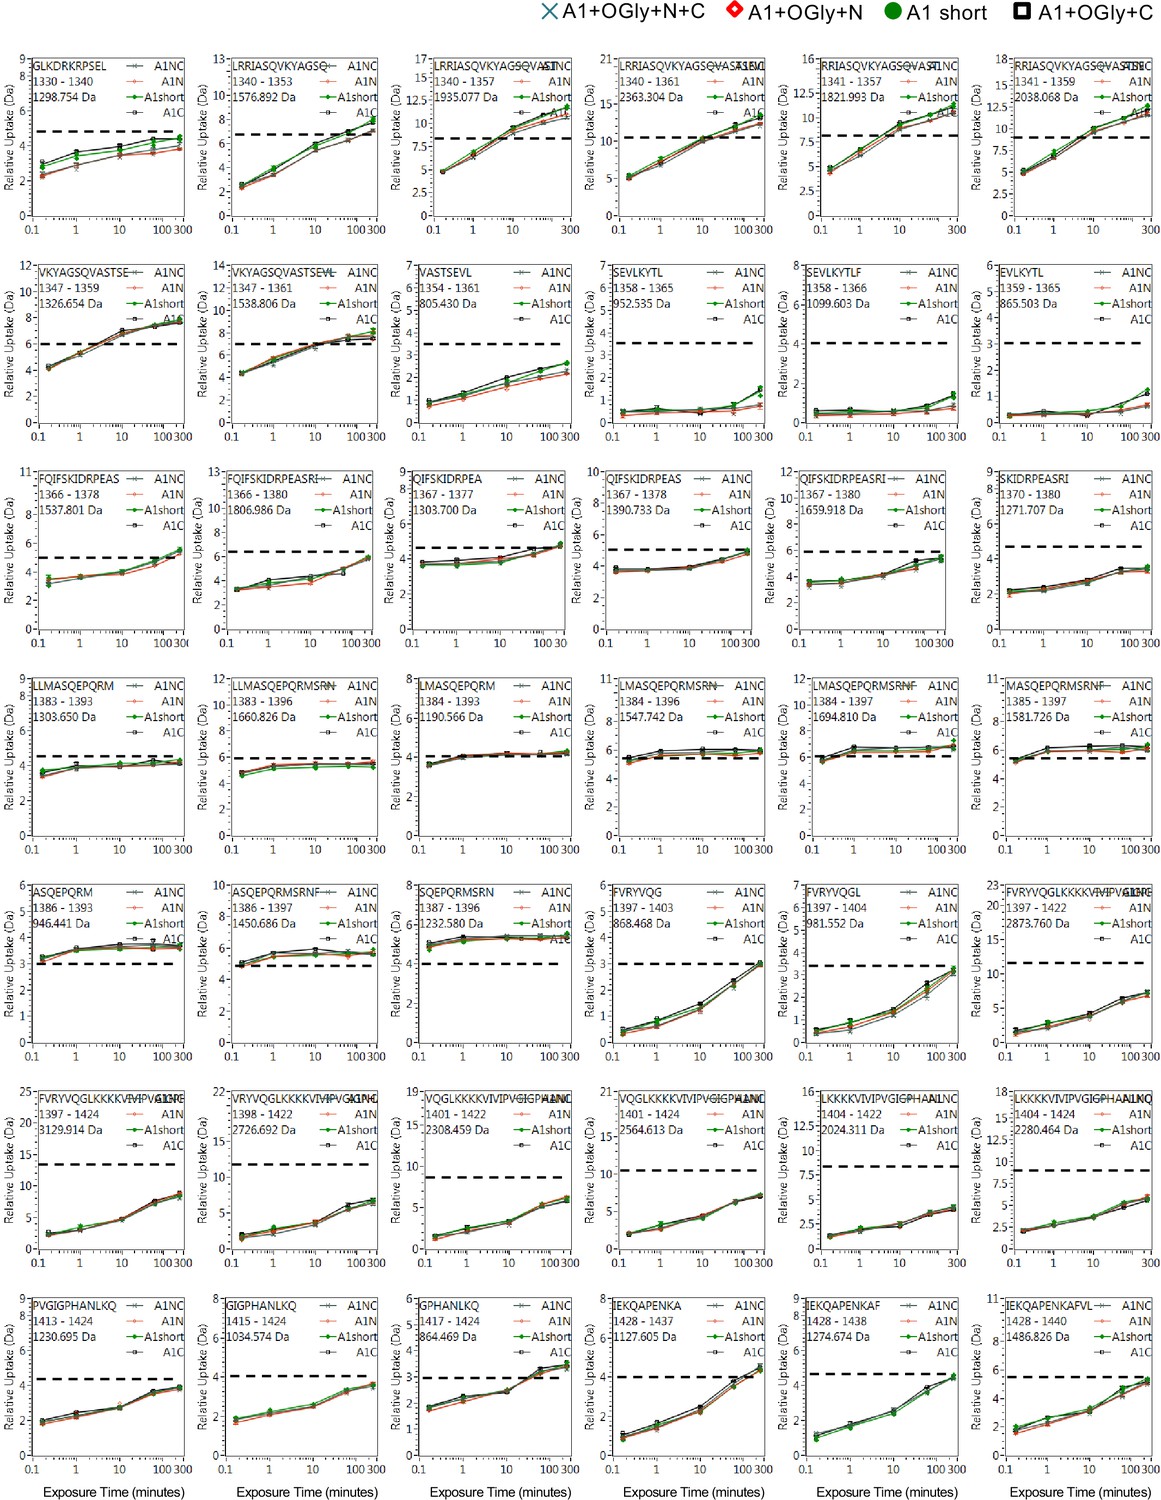
Full hydrogen deuterium exchange (HDX) kinetics for peptides, two of three figures.
Figure 5—figure supplement 5

Full hydrogen deuterium exchange (HDX) kinetics for peptides, three of three figures.
Tables
Table 1
Hydrogen deuterium exchange (HDX) MS data summary and list of experimental parameters.
| Dataset | A1 short | A1N | A1C | A1NC |
|---|---|---|---|---|
| HDX reaction details* | 15-Fold dilution with labeling buffer at 20°C, final D2O level = 93.3%, pHread = 7.10; equal volume quench buffer at 0°C, pHread = 2.5 | |||
| HDX time course | 10 s, 1 m, 10 m, 1 hr, 4 hr | |||
| HDX controls | 3 undeuterated for each condition | |||
| Back exchange | 30–35% | |||
| Number of peptides | 102 | 103 | 101 | 108 |
| Sequence coverage | 93.2% | 92.5% | 91.8% | 90.9% |
| Avg. peptide length (a.a.) | 12.3 | 12.2 | 12.3 | 12.3 |
| Redundancy | 5.4 | 5.14 | 4.89 | 5.77 |
| Replicates | 2 technical for each condition | |||
| HDXrepeatability† | ±0.15 relative Da | |||
-
*
Labeling buffer: 20 mM HEPES, 150 mM NaCl, 99% D2O, pD 7.5; quench buffer: 300 mM sodium phosphate, 0.25 M Tris (2-carboxyethyl)phosphine hydrochloride (TCEP-HCl), H2O pH 2.5.
-
†
All reported values are the average relative deuterium level as given by the DynamX software, which in some cases is an average of more than one charge state, across all peptides in both technical replicates. No statistical tests were applied to the HDX MS measurements.
Additional files
Download links
A two-part list of links to download the article, or parts of the article, in various formats.
Downloads (link to download the article as PDF)
Open citations (links to open the citations from this article in various online reference manager services)
Cite this article (links to download the citations from this article in formats compatible with various reference manager tools)
Von Willebrand factor A1 domain stability and affinity for GPIbα are differentially regulated by its O-glycosylated N- and C-linker
eLife 11:e75760.
https://doi.org/10.7554/eLife.75760


