Activation by cleavage of the epithelial Na+ channel α and γ subunits independently coevolved with the vertebrate terrestrial migration
- Department of Medicine, University of Pittsburgh, United States
- Department of Human Genetics, University of Utah, United States
- Computational and Systems Biology, University of Pittsburgh, United States
Figures
Figure 1
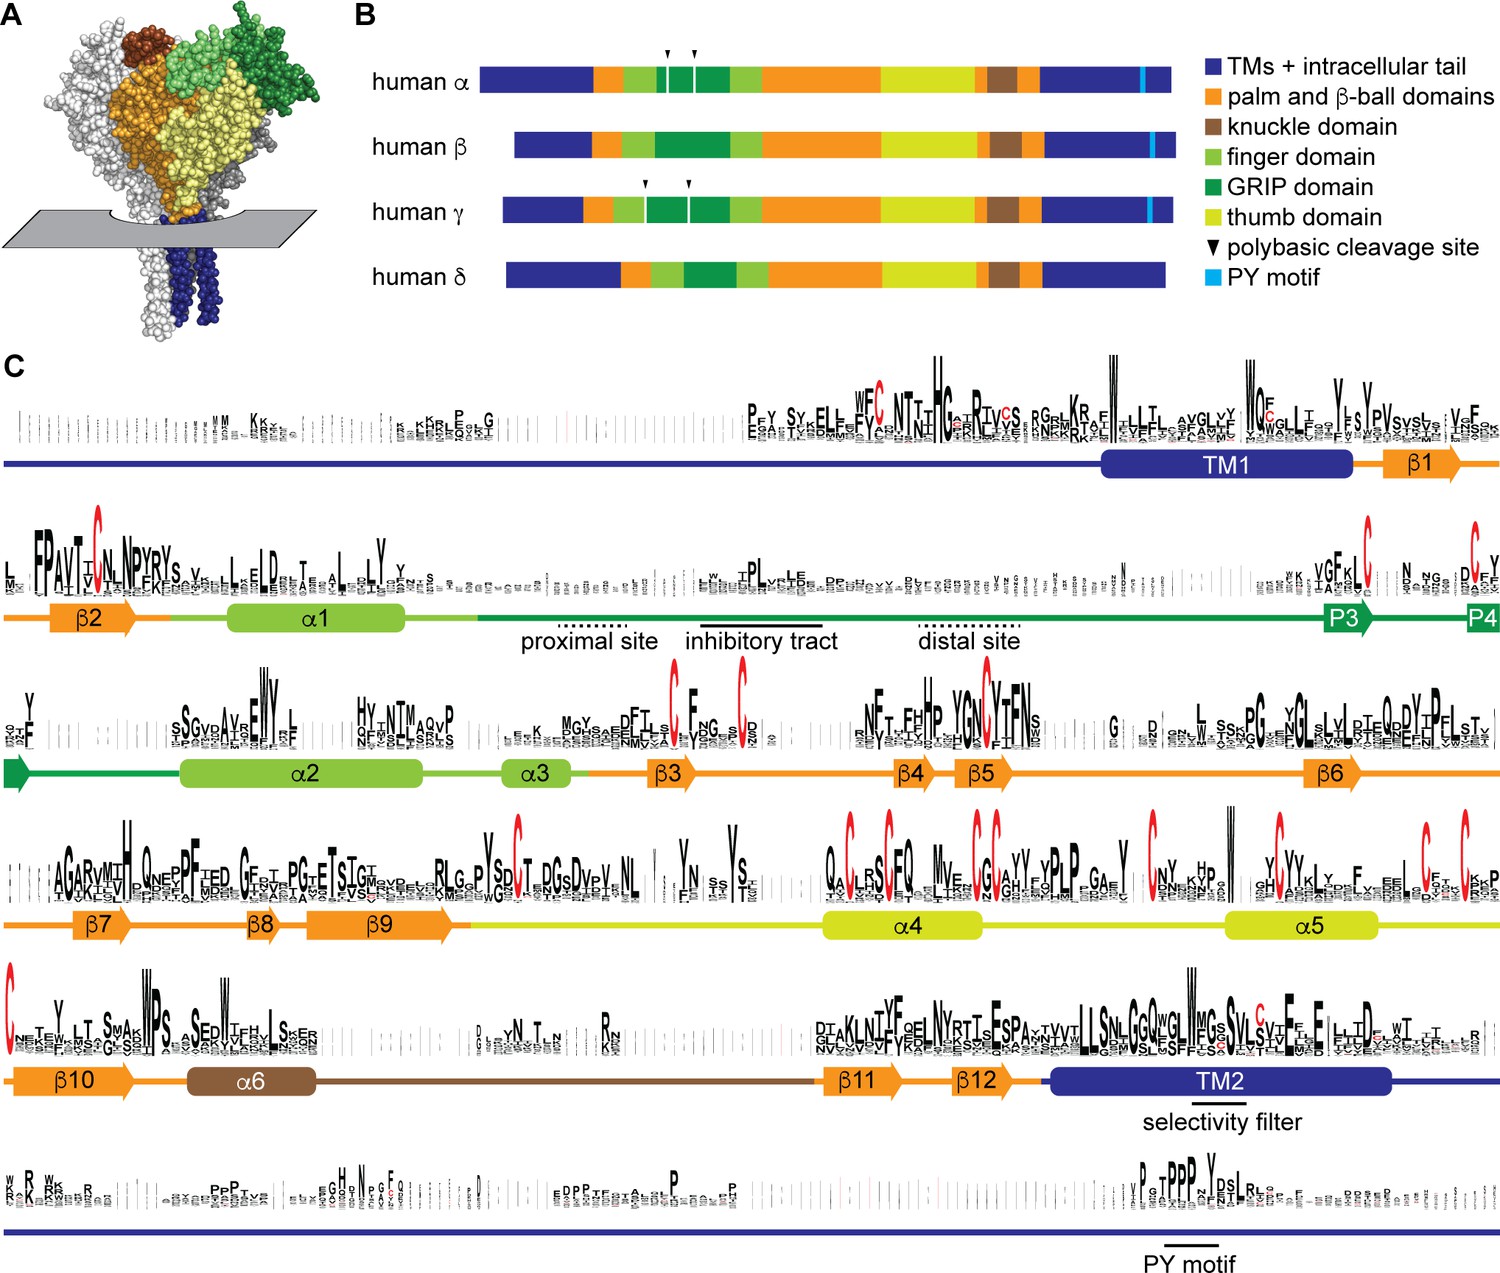
Sequence conservation in epithelial Na+ channel (ENaC) subunits.
(A) Space filling model of ENaC (pdb code: 6BQN) with plane indicating position of outer membrane border. The α and γ subunits are white and gray, respectively. The β subunit is colored by domain as indicated in panel B. Intracellular structures are absent in this structural model. (B) Linear model of human ENaC subunits showing domain organization and highlighting position of polybasic cleavage sites and PY motifs. (C) Sequences (Supplementary file 1) were aligned using MUSCLE (Edgar, 2004; Figure 1—source data 1). Residue symbol sizes are proportional to frequency at a given position. Key features in the sequence are indicated, as are the approximate position of α helices (rounded rectangles) and β-strands (arrows). Colors correspond to protein domains, as indicated in panel B. The GRIP (gating release of inhibition by proteolysis) domain is unique to ENaC subunits in the ENaC/Deg family. The P1 and P2 β-strands in the GRIP domain are not indicated, but are likely near the inhibitory tract and distal site, respectively, if present.
-
Figure 1—source data 1
Multiple sequence alignment of proteins in Supplementary file 1.
Residues are colored by domain, as in Figure 1: transmembrane and intracellular domains are blue, palm and β-ball domains are orange, finger domain is light green, GRIP (gating release of inhibition by proteolysis) domain is dark green, thumb domain is yellow-green, and the knuckle domain is brown. GRIP domain polybasic tracts and C-terminal PY motifs are underlined in red. Select conserved residues in epithelial Na+ channel (ENaC) subunits are bold.
- https://cdn.elifesciences.org/articles/75796/elife-75796-fig1-data1-v2.pdf
Figure 2
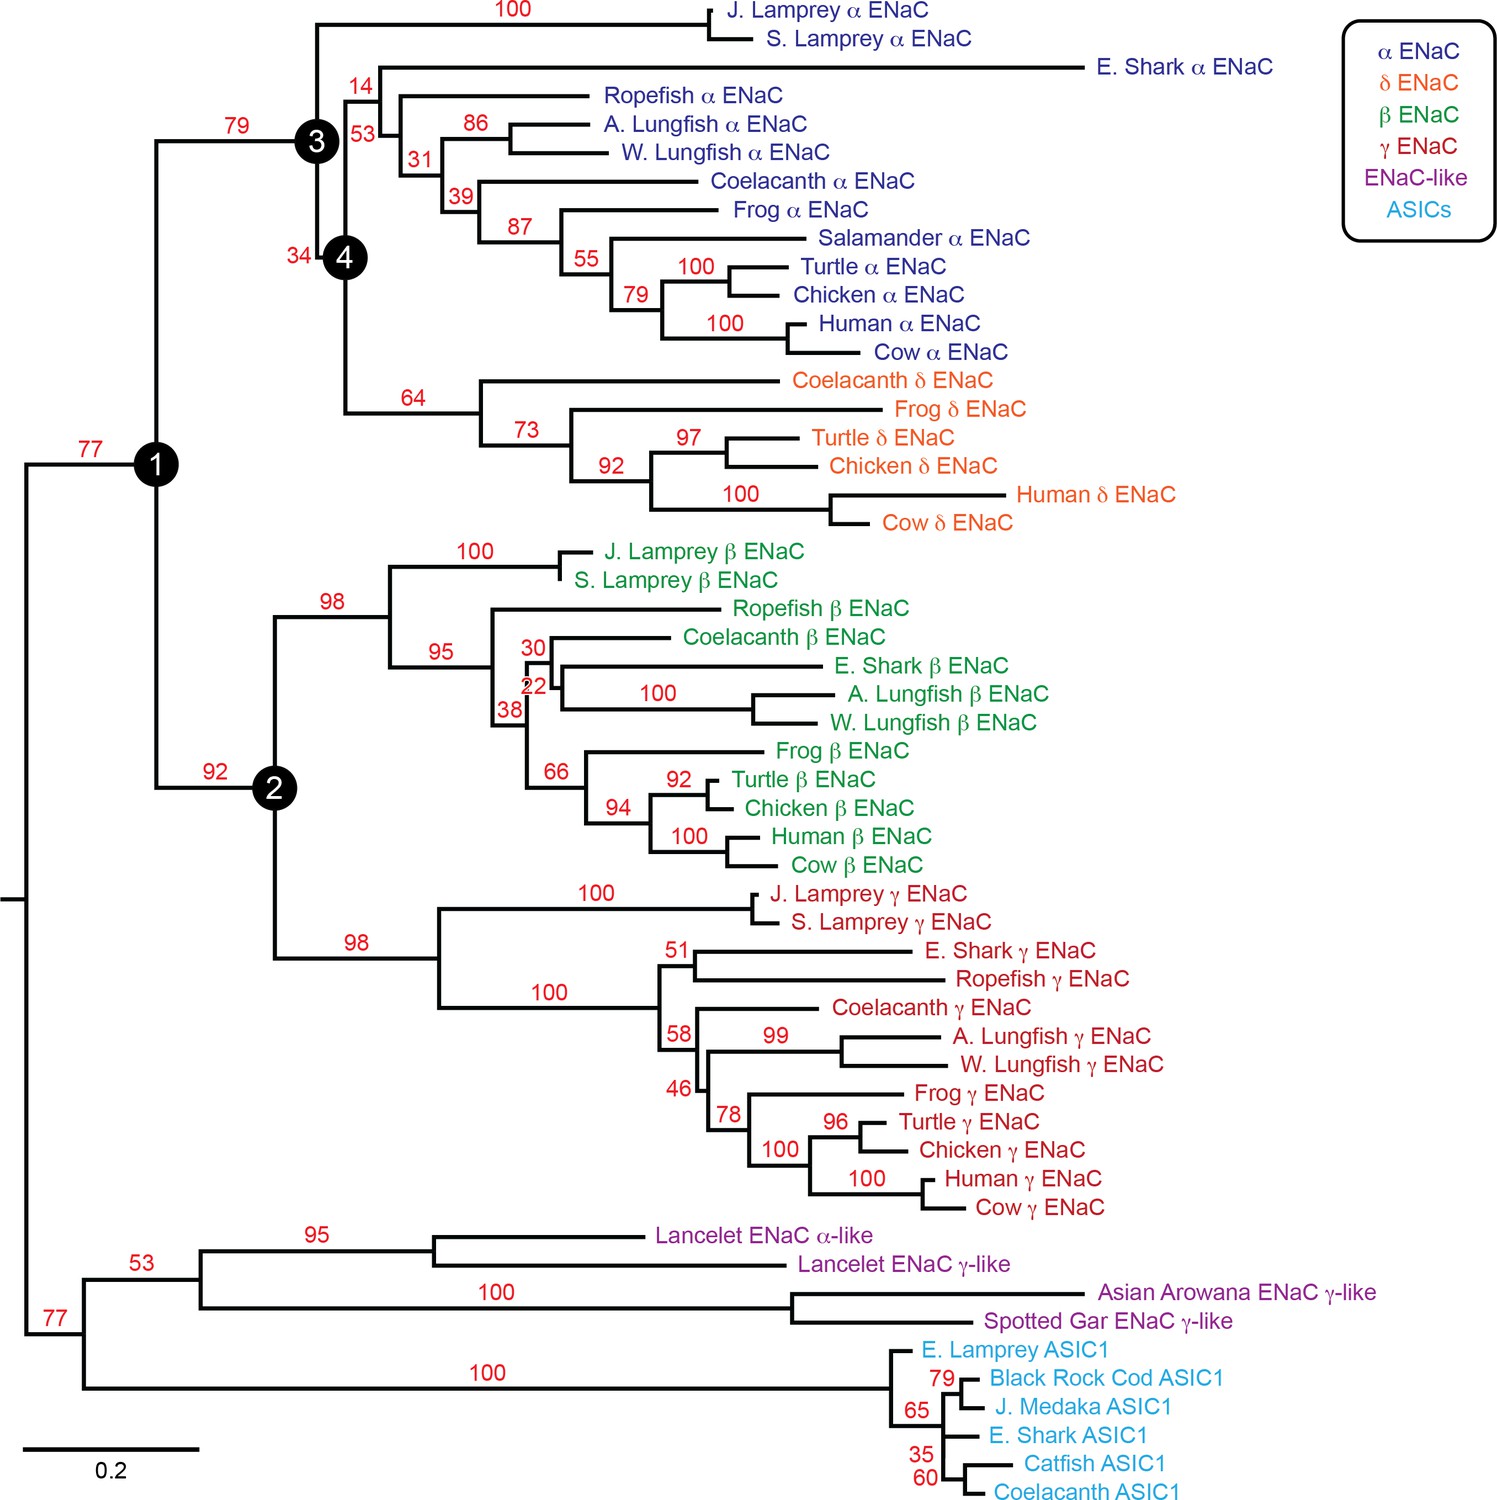
Phylogenetic tree of epithelial Na+ channel (ENaC) subunits.
Maximum likelihood tree calculated from ENaC subunit sequences of marine species and select terrestrial vertebrates, and ENaC-related proteins. Branch support bootstrap values are shown. Scale bar indicates the number of substitutions per site. Key ancestral nodes are indicated by circled numbers. A. Lungfish = Australian Lungfish, E. Shark = Elephant Shark, E. Lamprey = European River Lamprey, J. Lamprey = Japanese Lamprey, J. Medaka = Japanese Medaka, S. Lamprey = Sea Lamprey, W. Lungfish = West African Lungfish.
Figure 3
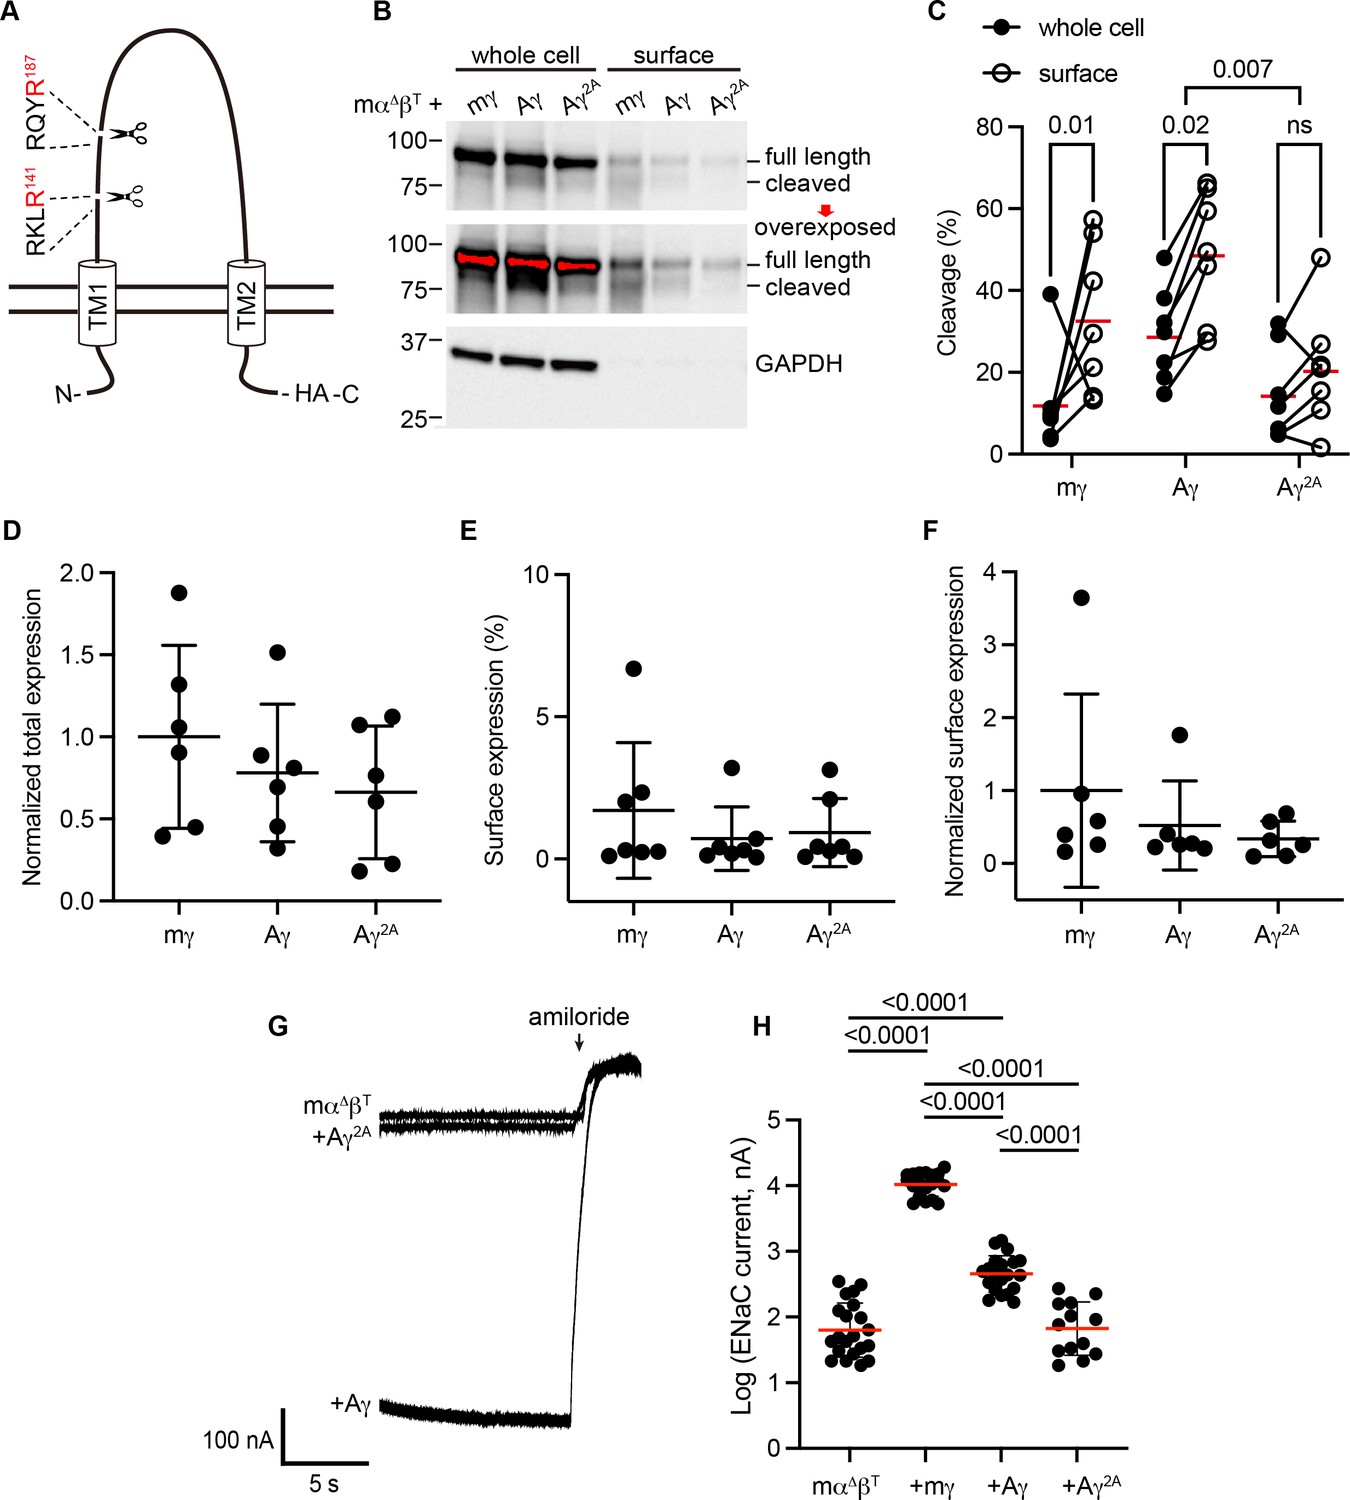
Predicted cleavage sites in the epithelial Na+ channel (ENaC) γ subunit from Australian lungfish are functional.
(A) Schematic of Aγ topology. Aγ has two predicted furin cleavage sites in its extracellular GRIP (gating release of inhibition by proteolysis) domain. All γ subunits were labeled with C-terminal epitope tags to facilitate detection of full-length subunits and the larger of the cleaved fragments. (B) Xenopus oocytes were injected with cRNAs encoding mα∆, mβT, and hemagglutinin (HA)-tagged γ subunits, as indicated. One day after injection, whole cell lysates and cell surface isolates were blotted and probed for HA and glyceraldehyde-3-phosphate dehydrogenase (GAPDH). Full-length and cleaved bands are indicated and band densities were quantified. An overexposed blot is shown to highlight cell surface bands. Over exposed areas are red. (C) Cleavage %, calculated as cleaved/(cleaved + full length) × 100 is shown. Data were analyzed by repeated measures two-way analysis of variance (ANOVA) with Šidák’s multiple comparison test. p values are shown for indicated comparisons. Cleavage was also greater for Aγ than for mγ (p = 0.05). (D) Normalized total expression was calculated by normalizing the sum of full-length and cleaved bands to the mean of mγ after normalizing each sample for loading based on GAPDH from the same blot. (E) Surface expression % was calculated using band densities adjusted for the fraction of the respective sample loaded. (F) Normalized surface expression was calculated by multiplying values from the same sample in D and E, and then normalizing to the mean of mγ. Data in D–F were analyzed by one-way ANOVA with Tukey’s multiple comparison test. No significant differences between groups were found. Note that due to the lack of GAPDH data for one blot, the number of replicates for D and F (n = 6) is one fewer than for C and E (n = 7). (G) Whole cell currents were measured in injected oocytes by two-electrode voltage clamp, with voltage clamped at −100 mV. Representative traces of indicated subunit combinations are shown. Currents were continuously recorded in a bath solution containing 110 mM Na+. The ENaC-blocking drug amiloride (100 µM) was added at the end of each experiment to determine the ENaC-mediated current. (H) Log-transformed amiloride-sensitive inward currents are plotted, and were analyzed by one-way ANOVA followed by Tukey’s multiple comparison test. p values for comparisons where p < 0.05 are shown. Bars indicate mean values; errors shown are standard deviation (SD).
-
Figure 3—source data 1
All uncropped blots used for quantification are shown with full-length and cleaved bands indicated.
Quantification for both blotting and two-electrode voltage clamp experiments are provided in a Microsoft Excel file.
- https://cdn.elifesciences.org/articles/75796/elife-75796-fig3-data1-v2.zip
Figure 4
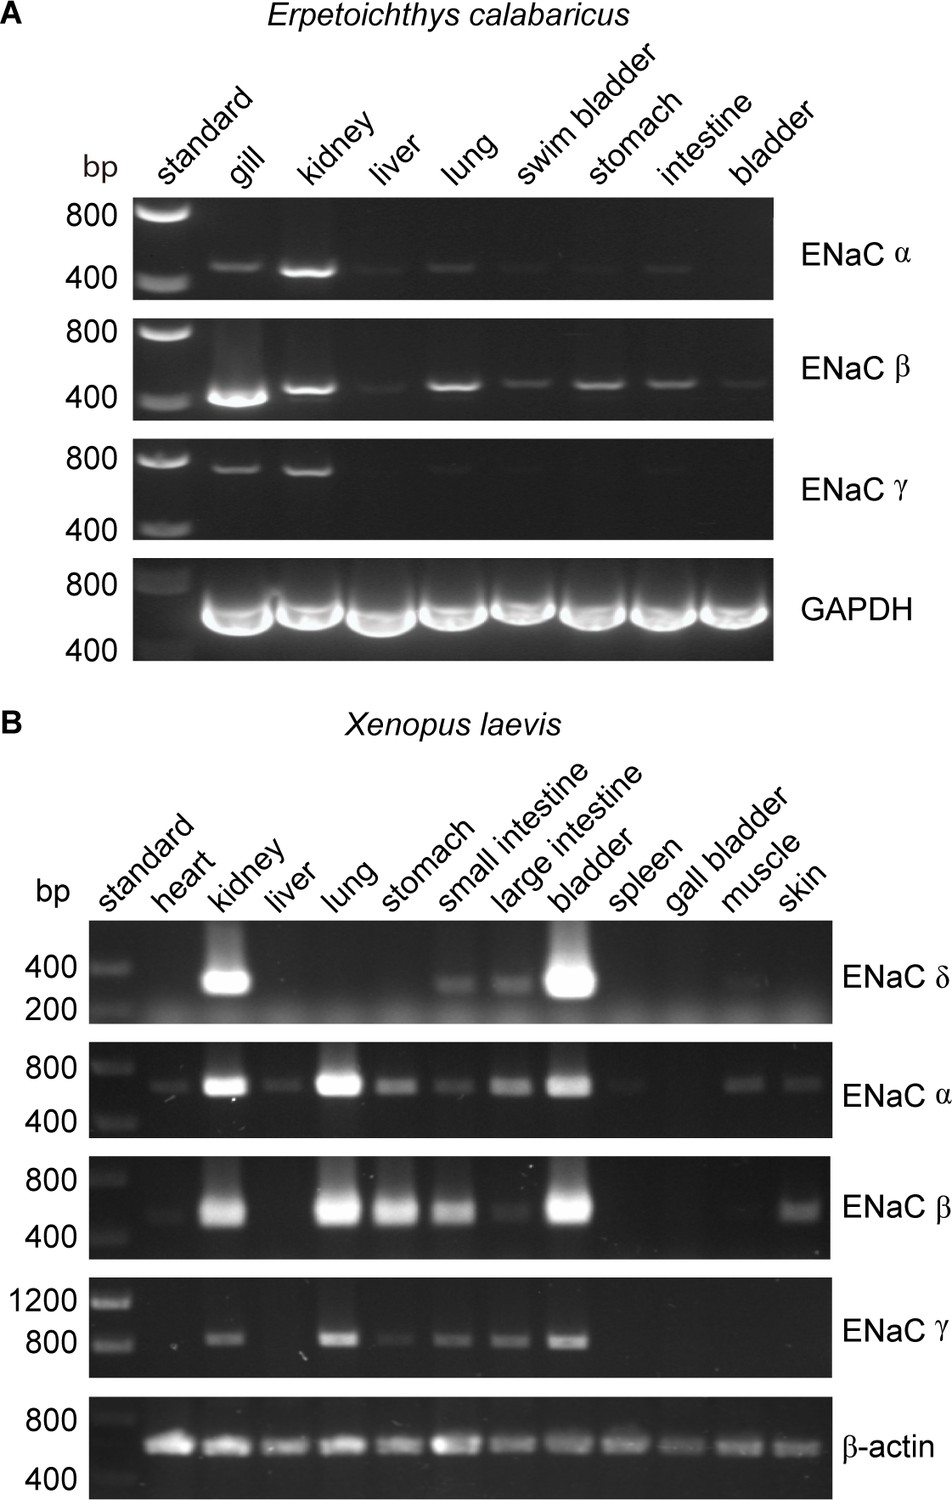
Tissue distribution of (A) Erpetoichthys calabaricus (ropefish) and (B) Xenopus laevis epithelial Na+ channel (ENaC) subunit transcripts by reverse transcription-PCR (RT-PCR).
cDNA libraries were generated from tissue homogenates. PCR reactions were performed using primers indicated in Supplementary file 3.
-
Figure 4—source data 1
Uncropped gels are shown with bands at the target size for a given primer pair indicated.
- https://cdn.elifesciences.org/articles/75796/elife-75796-fig4-data1-v2.zip
Figure 5
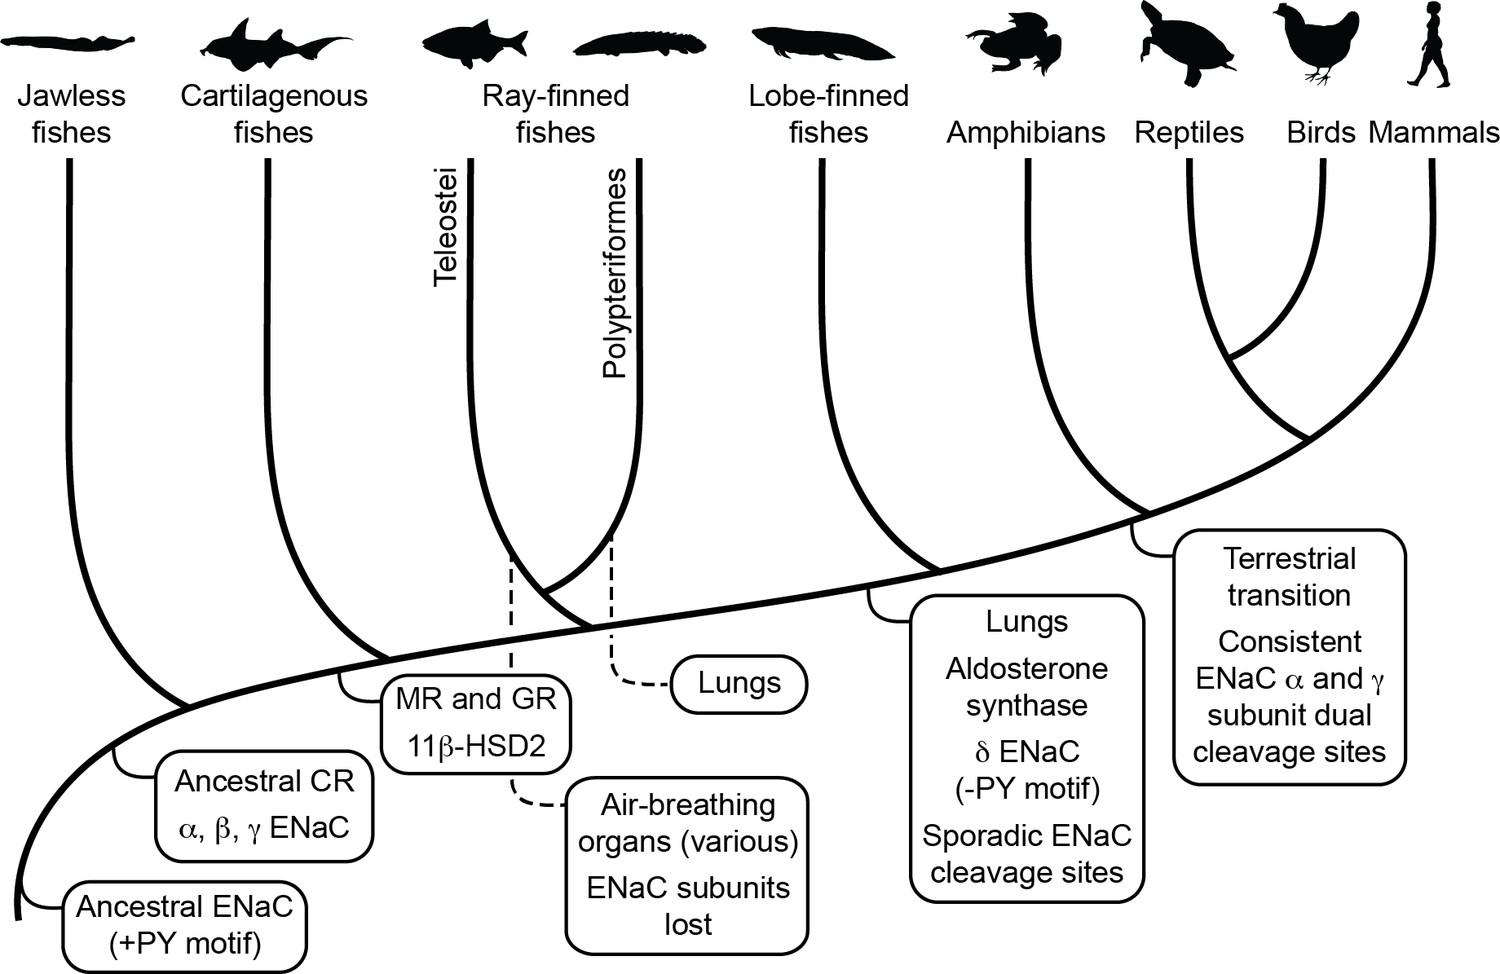
Schematic view of evolution of aldosterone signaling, air-breathing organs, epithelial Na+ channel (ENaC), and ENaC regulatory motifs.
ENaC subunits were not found in nonvertebrate chordates or in teleosts. The ancestral ENaC subunit likely had a PY motif and was a substrate for Nedd4-2-dependent regulation. Like mammalian ENaC α subunits, the ancient ENaC subunit may have formed functional homotrimers, or may have formed channels with other ENaC paralogs. ENaC α, β, and γ subunits appeared before the emergence of jawless fishes, whereas ENaC δ subunits first appeared in an ancestor of the lobe-finned coelacanth. Proteins required for aldosterone signaling (mineralocorticoid receptor [MR], 11β-hydroxysteroid dehydrogenase [11β-HSD2], and aldosterone synthase) evolved before the emergence of tetrapods. Lungs appeared in lobe-finned fishes on the lineage to tetrapods. Air-breathing organs (e.g., respiratory gas bladders and labyrinth organs) evolved independently in ray-finned fishes, including morphologically distinct lungs in Polypteriformes. Individual GRIP (gating release of inhibition by proteolysis) domain ENaC cleavage sites first appeared sporadically in marine species. Dual cleavage sites appeared consistently in the ENaC α and γ subunits in terrestrial vertebrates. CR, corticoid receptor; GR, glucocorticoid receptor. Animal silhouettes courtesy of PhyloPic (http://www.phylopic.org).
Tables
Table 1
Polybasic sequences aligning with human epithelial Na+ channel (ENaC) subunit proximal (site 1) and distal (site 2) cleavage sites.
Terr., terrestrial. Dashes indicate the absence of polybasic tract. 1The ENaC δ subunit in mammals has a polybasic sequence in the aligned region, but is not cleaved in human channels (Haerteis et al., 2009). Ø, no sequence was available. (⋯), GRIP (gating release of inhibition by proteolysis) domain sequence was missing in the available sequence. Species abbreviations are as in Figure 2.
| α | δ | β | γ | |||||||
|---|---|---|---|---|---|---|---|---|---|---|
| Animal | Terr. | Lungs | site 1 | site 2 | site 1 | site 2 | site 1 | site 2 | site 1 | site 2 |
| S.Lamprey | — | — | Ø | Ø | — | — | — | — | ||
| J.Lamprey | — | — | Ø | Ø | — | — | — | — | ||
| E.Shark | (⋯) | (⋯) | Ø | Ø | — | — | — | RQHR | ||
| Ropefish | X | — | — | Ø | Ø | — | — | RKRR | NRKR | |
| Coelacanth | RSNR | — | — | — | KRER | — | — | VKQR | ||
| W.Lungfish | X | — | — | Ø | Ø | — | — | — | — | |
| A.Lungfish | X | — | — | Ø | Ø | — | — | RKLR | RQYR | |
| Frog | X | X | RVKR | RVSR | — | — | — | — | RSKR | KRTR |
| Salamander | X | X | RERR | RVRR | Ø | Ø | Ø | Ø | Ø | Ø |
| Turtle | X | X | RSPR | RHKR | — | — | — | — | KVRR | NKRK |
| Chicken | X | X | RTSR | RQKR | — | — | — | — | KVRR | RKRK |
| Cow | X | X | RSRR | RGVR | — | RLQR1 | — | — | RKRR | RKRK |
| Human | X | X | RSRR | RRAR | — | RLQR1 | — | — | RKRR | RKRK |
Table 2
PY motifs (L/P-P-X-Y) in the C-terminal tails of epithelial Na+ channel (ENaC) subunits from various species.
Ø, no sequence was available. (⋯), sequence for the C-terminal region was missing in the available sequence. Species abbreviations are as in Figure 2.
| Animal | Terrestrial | Lungs | α | δ | β | γ |
|---|---|---|---|---|---|---|
| S.Lamprey | PPPSF | Ø | PPPHY | PPPQY | ||
| J.Lamprey | PPDY | Ø | PPPHY | PPPQY | ||
| E.Shark | (⋯) | Ø | PPPRY | PPPNY | ||
| Ropefish | X | PPPAY | Ø | PPPHY | PPPNY | |
| Coelacanth | PPAY | (⋯) | PPPNY | PPPTY | ||
| W.Lungfish | X | PPPAY | Ø | PPPHY | PPPQY | |
| A.Lungfish | X | PPPAY | Ø | PPPKY | PPPQY | |
| Frog | X | X | PPPAY | — | PPPNY | PPPKY |
| Salamander | X | X | PPPAY | Ø | Ø | Ø |
| Turtle | X | X | LPSY | — | PPPNY | PPPNY |
| Chicken | X | X | LPSY | — | PPPNY | PPPNY |
| Cow | X | X | PPPAY | — | PPPNY | PPPRY |
| Human | X | X | PPPAY | — | PPPNY | PPPKY |
Additional files
-
Supplementary file 1
Protein sequences were found using BLAST tools at NCBI (https://www.ncbi.nlm.nih.gov/) and UniProt (https://www.uniprot.org/).
#Annotated as epithelial Na+ channel (ENaCα) subunit in NCBI, but named ASIC1 here on the basis of calculated phylogenetic tree in Figure 2. *Protein sequences were originally found using the BLAST tool at A*STAR (http://jlampreygenome.imcb.a-star.edu.sg/ and http://esharkgenome.imcb.a-star.edu.sg/), but were no longer available at the time of publication. Coding sequences are available at the accession numbers shown at NCBI.
- https://cdn.elifesciences.org/articles/75796/elife-75796-supp1-v2.docx
-
Source data 1
Results of phylogenetic models of trait gain or loss are provided in a Microsoft Excel file.
- https://cdn.elifesciences.org/articles/75796/elife-75796-supp2-v2.xlsx
-
Supplementary file 2
BayesTraits run parameters.
1ML, maximimum likelihood run. All ML runs included the commands: MLTries 10,000; ScaleTrees 1000. 2Markov chain Monte Carlo run. All MCMC runs included the commands: ScaleTrees 1000; Stones 100, 10,000. 3Restricts reverse rate for trait 1–0. 4Restricts trait one forward rates to be independent of trait 2, and trait 1 reverse rates to 0. 5Restricts the equivalent sites 1 and 2 rates to be equal. 6Restricts the equivalent sites 1 and 2 rates to be equal, but dependent on the status of the other site. 7The AddTag and Fossil commands select and restrict a node given by the most recent common ancestor of the proteins specified. Nodes 1, 2, 3, and 4 in Figure 2 are specified in commands as ‘ENaC’, ‘bg’, ‘alpha’, and ‘ad’, respectively.
- https://cdn.elifesciences.org/articles/75796/elife-75796-supp3-v2.docx
-
Supplementary file 3
Primers for RT-PCR and expected product sizes.
- https://cdn.elifesciences.org/articles/75796/elife-75796-supp4-v2.docx
-
Supplementary file 4
Tree file.
- https://cdn.elifesciences.org/articles/75796/elife-75796-supp5-v2.docx
-
Transparent reporting form
- https://cdn.elifesciences.org/articles/75796/elife-75796-transrepform1-v2.docx
Download links
A two-part list of links to download the article, or parts of the article, in various formats.
Downloads (link to download the article as PDF)
Open citations (links to open the citations from this article in various online reference manager services)
Cite this article (links to download the citations from this article in formats compatible with various reference manager tools)
Activation by cleavage of the epithelial Na+ channel α and γ subunits independently coevolved with the vertebrate terrestrial migration
eLife 11:e75796.
https://doi.org/10.7554/eLife.75796


