Hyperreactivity to uncertainty is a key feature of subjective cognitive impairment
- Nuffield Department of Clinical Neurosciences, University of Oxford, United Kingdom
- Department of Experimental Psychology, University of Oxford, United Kingdom
Figures
Figure 1
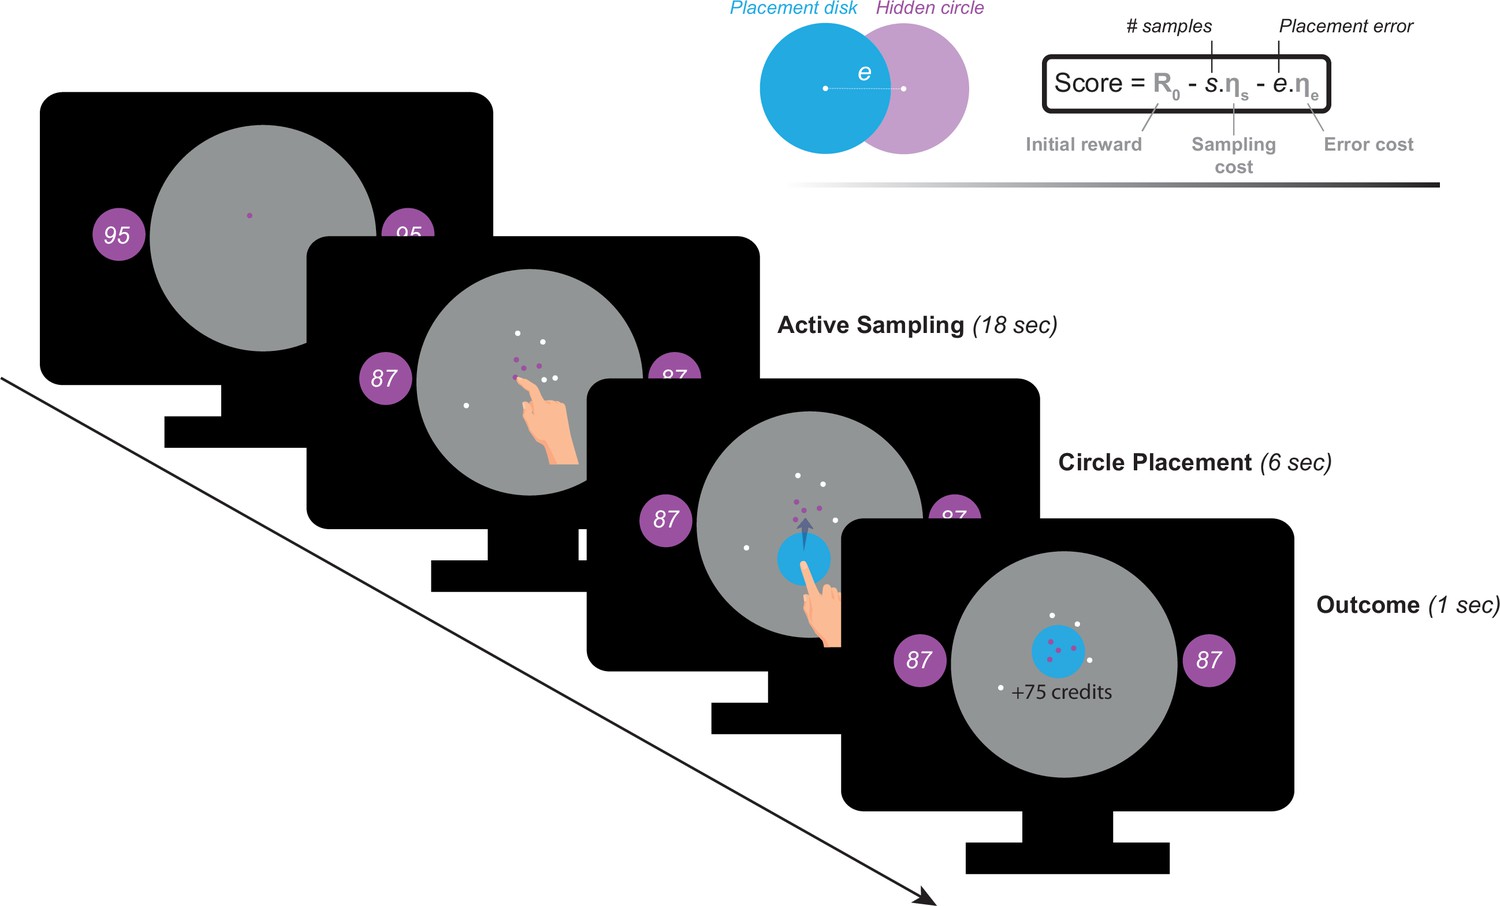
Task paradigm – Active information sampling.
Participants were required to find the location of a hidden purple circle as precisely as possible. Clues about the location of the hidden circles could be obtained by touching the screen at different locations. This yielded dots that were coloured either purple or white depending on whether they were situated inside or outside the hidden circle: purple dots were inside and white dots were outside. Two circles of the same size as the hidden circle were always on display on either side of the screen to limit memory requirements of the task. Inside these two circles, an initial credit reserve (R0) was displayed. There were two levels of R0: low = 95 credits and high = 130 credits. At the beginning of each trial, a purple dot was always shown to limit initial random sampling. Participants then had 18 s on each trial, during which they could sample without restrictions to speed, location or number of samples. Each time they touched the screen to add a dot, the number of credits available decreased depending on the cost of sampling () on that trial. There were two levels of : low = –1 credit/sample and high = –5 credits/sample. Once the 18 s had passed, a blue disc of the same size as the hidden circle appeared at the centre of the search field. Participants were then required to drag this disc on top of where they thought the hidden circle was located. Following this, the score they obtained on that trial was calculated and presented as feedback at the end of the trial.
Figure 2 with 2 supplements
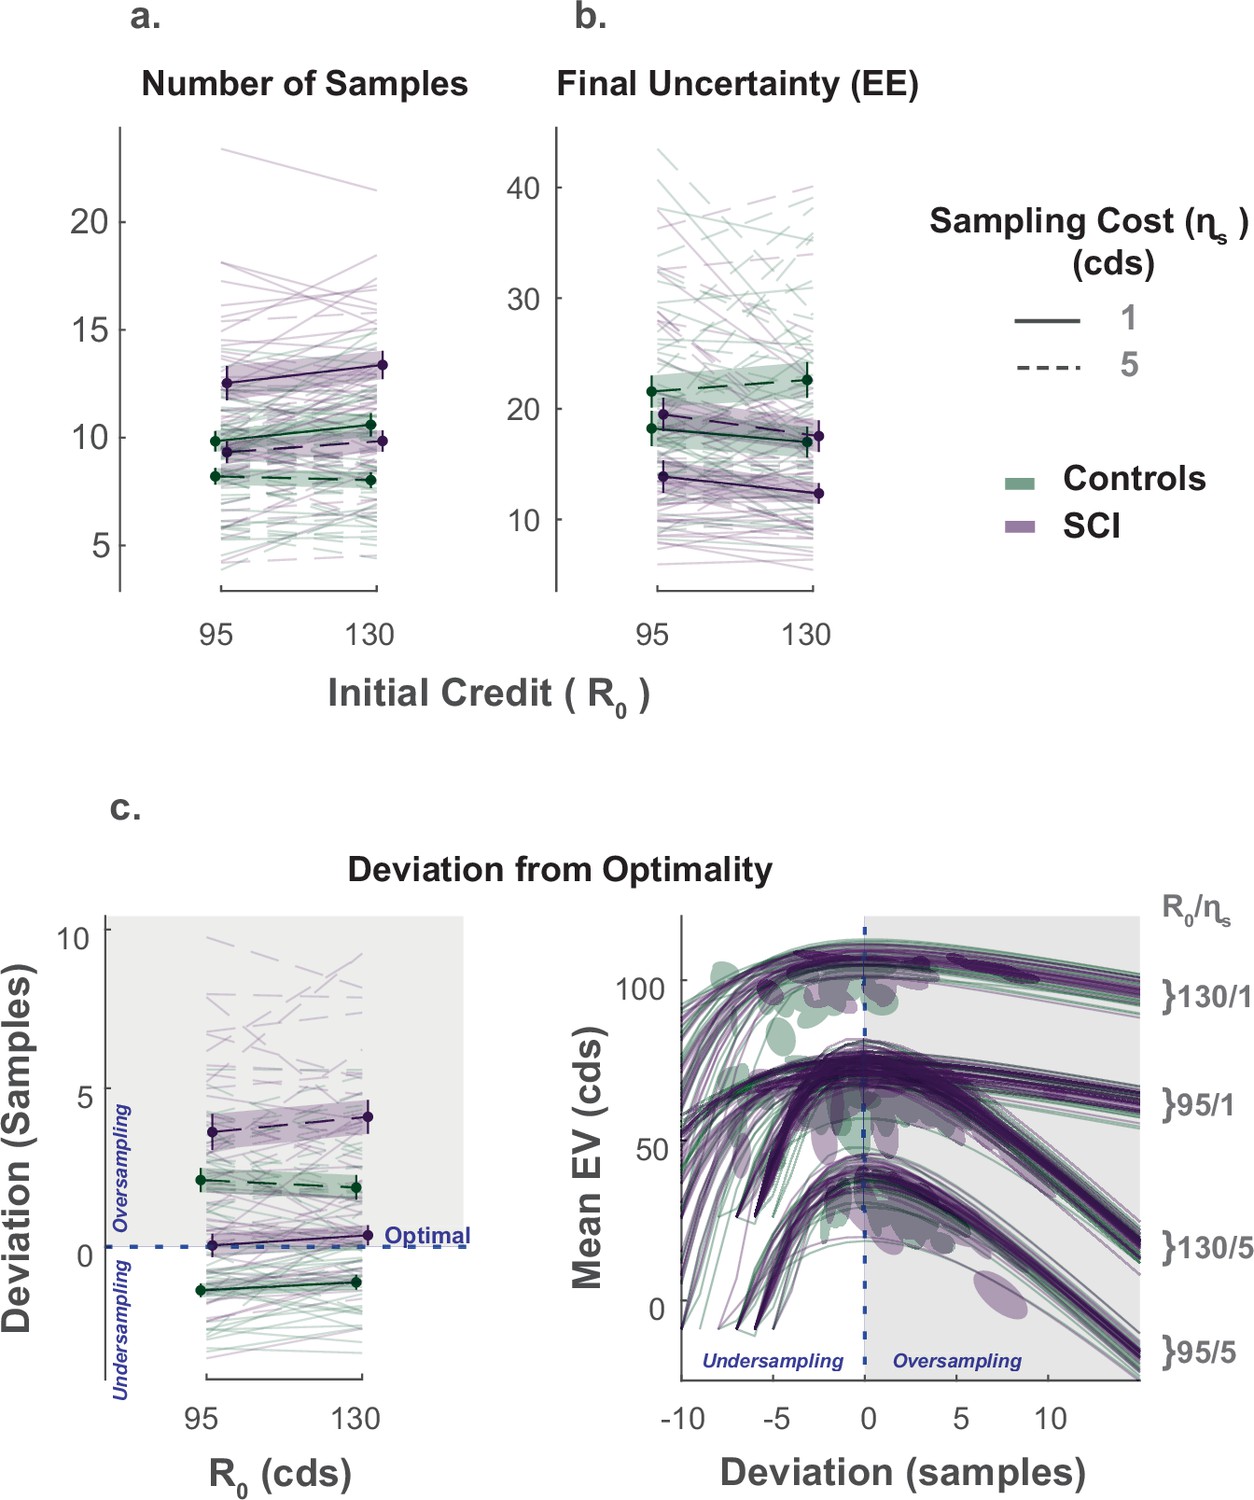
Extensive sampling in SCI.
(a) Across different conditions, individuals with SCI sampled more than healthy controls. (b) Consequently, SCI participants reached final uncertainty levels (EE) lower than controls prior to committing to decisions. (c) Healthy controls and individuals with SCI over-sampled when sampling cost was high. Over-sampling was more significant in SCI than healthy controls. When sampling cost was low, healthy controls under-sampled while SCI participants were optimal. The panel on the bottom right depicts the changes in expected value () as a function of the number of samples deviating from optimal. The optimal number of samples is when is maximum. Error bars show ± SEM. See Supplementary file 1, Supplementary file 2 and Supplementary file 3 for full statistical details.
Figure 2—figure supplement 1
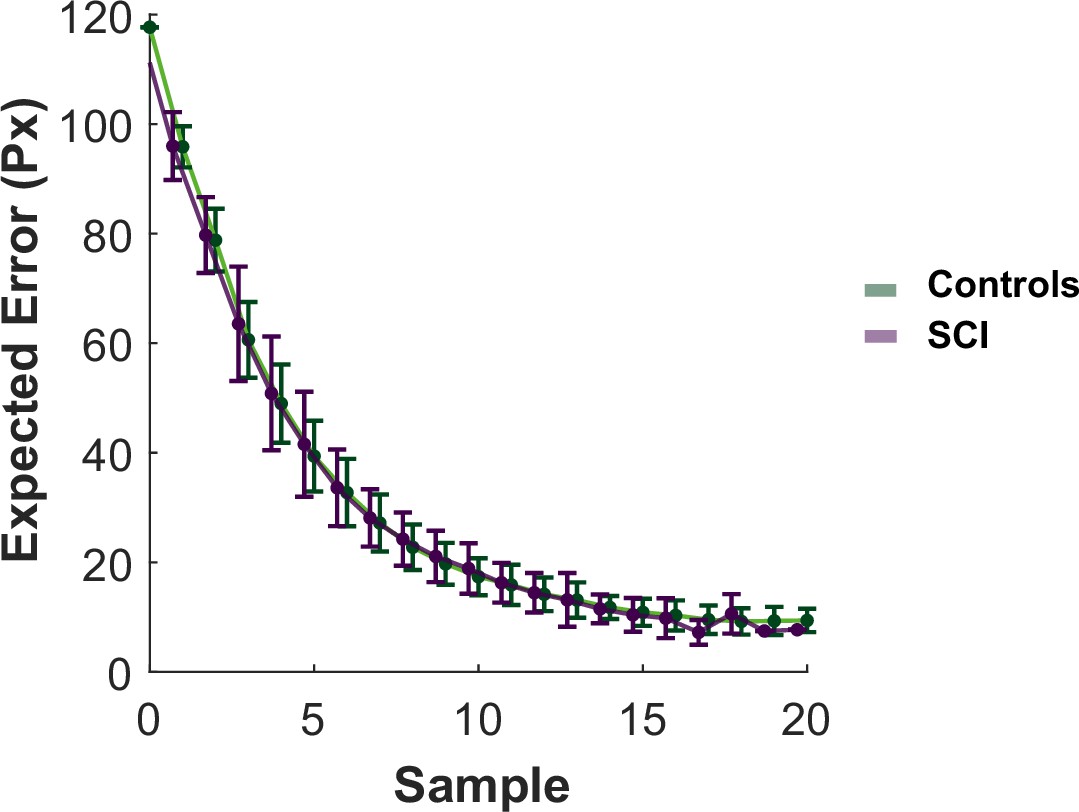
Expected error as a function of sampling.
Reduction in uncertainty (expected error, ) with successive sampling follows an exponential decay curve. The samples obtained towards the end of the search have limited benefits compared to the samples obtained earlier. Error bars show ± SEM.
Figure 2—figure supplement 2
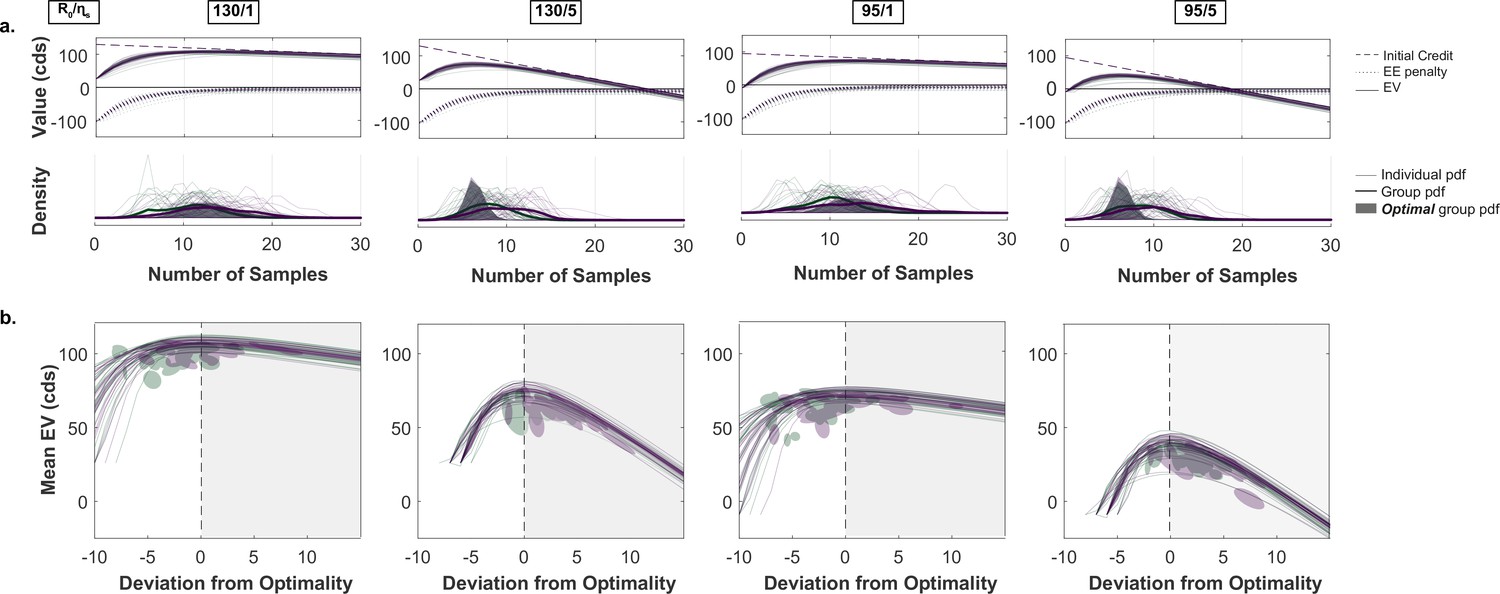
Optimal sampling.
(a) Expected value (EV) was calculated as (). This is the same as equation the scoring formula in Figure 1 but with the error term replaced with expected error (). The timecourse of EV as a function of sampling is shown for every condition () and every participant. Optimal model predictions were computed as the softmax over timecourse per condition and participant (filled distribution). The thin and thick lines represent individual and group distributions from data, respectively. (b) Deviation from optimal sampling was quantified as () where is the number of samples collected and is the optimal mean. Lines show EV timecourses centred at maximum which represent optimal stopping point (). Ellipses contain 90% CI of the means per participant.
Figure 3
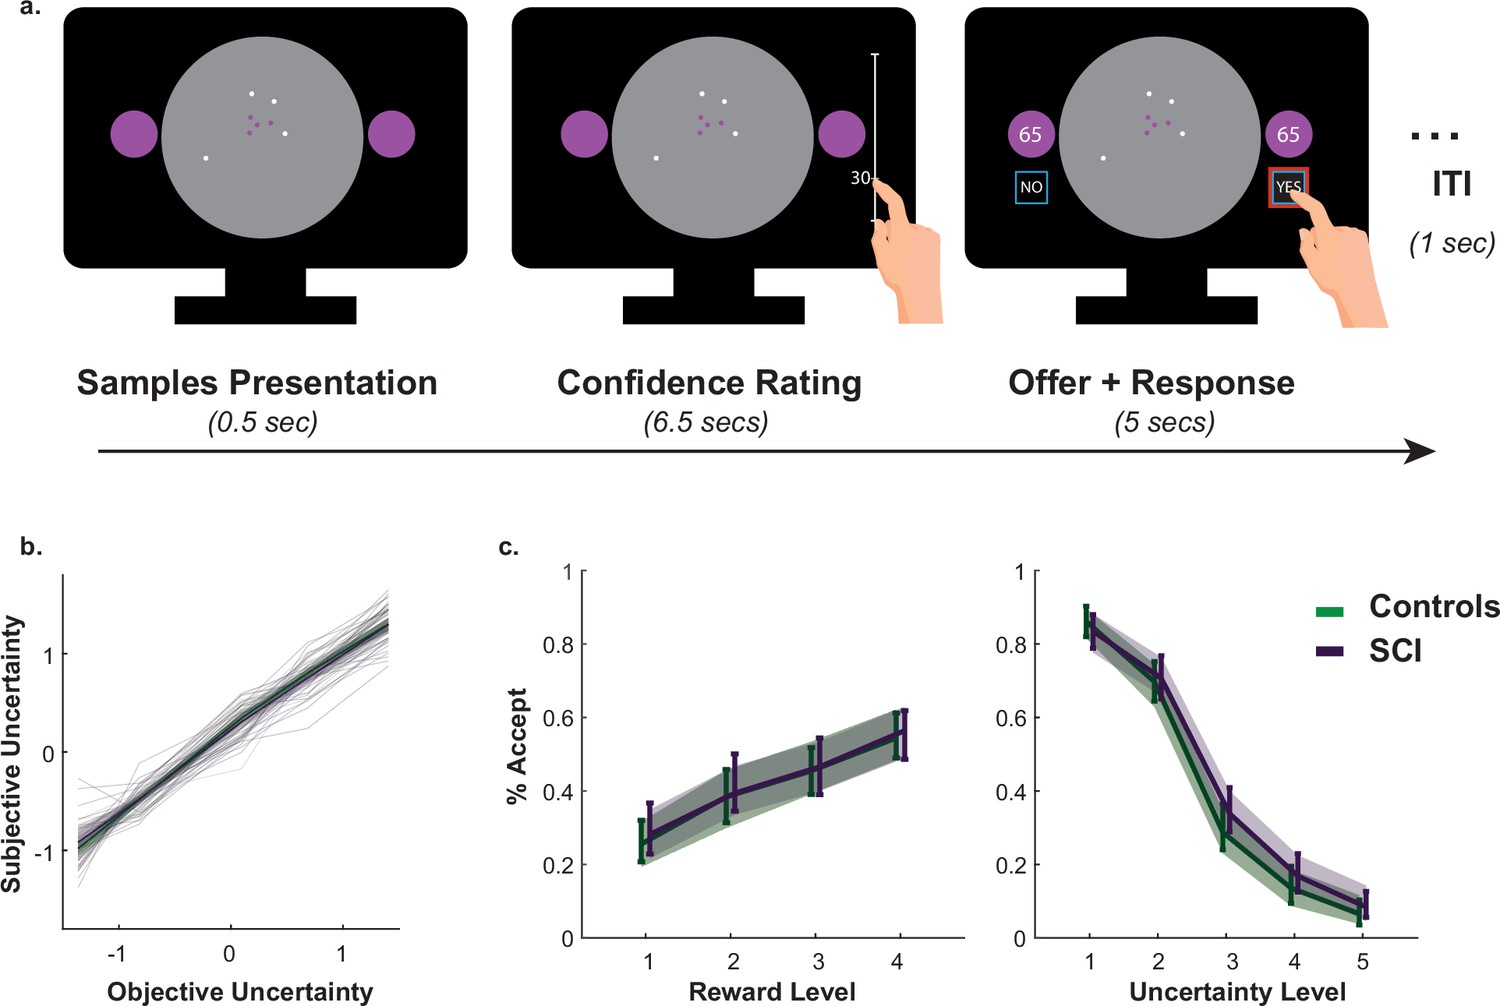
Intact metacognitive judgement and passive decision making in SCI.
(a) Subjective estimates of uncertainty (z-scored sign-flipped confidence ratings) mapped well onto experimentally defined uncertainty across study participants. There was no significant difference between SCI participants and controls in estimating uncertainty. (b) There was no significant difference in offer acceptance between individuals with SCI and controls, indicating similar weights assigned to uncertainty and reward when making decisions. Error bars show 95% CI. See Supplementary files 4 and 5 for statistical details.
Figure 4 with 1 supplement
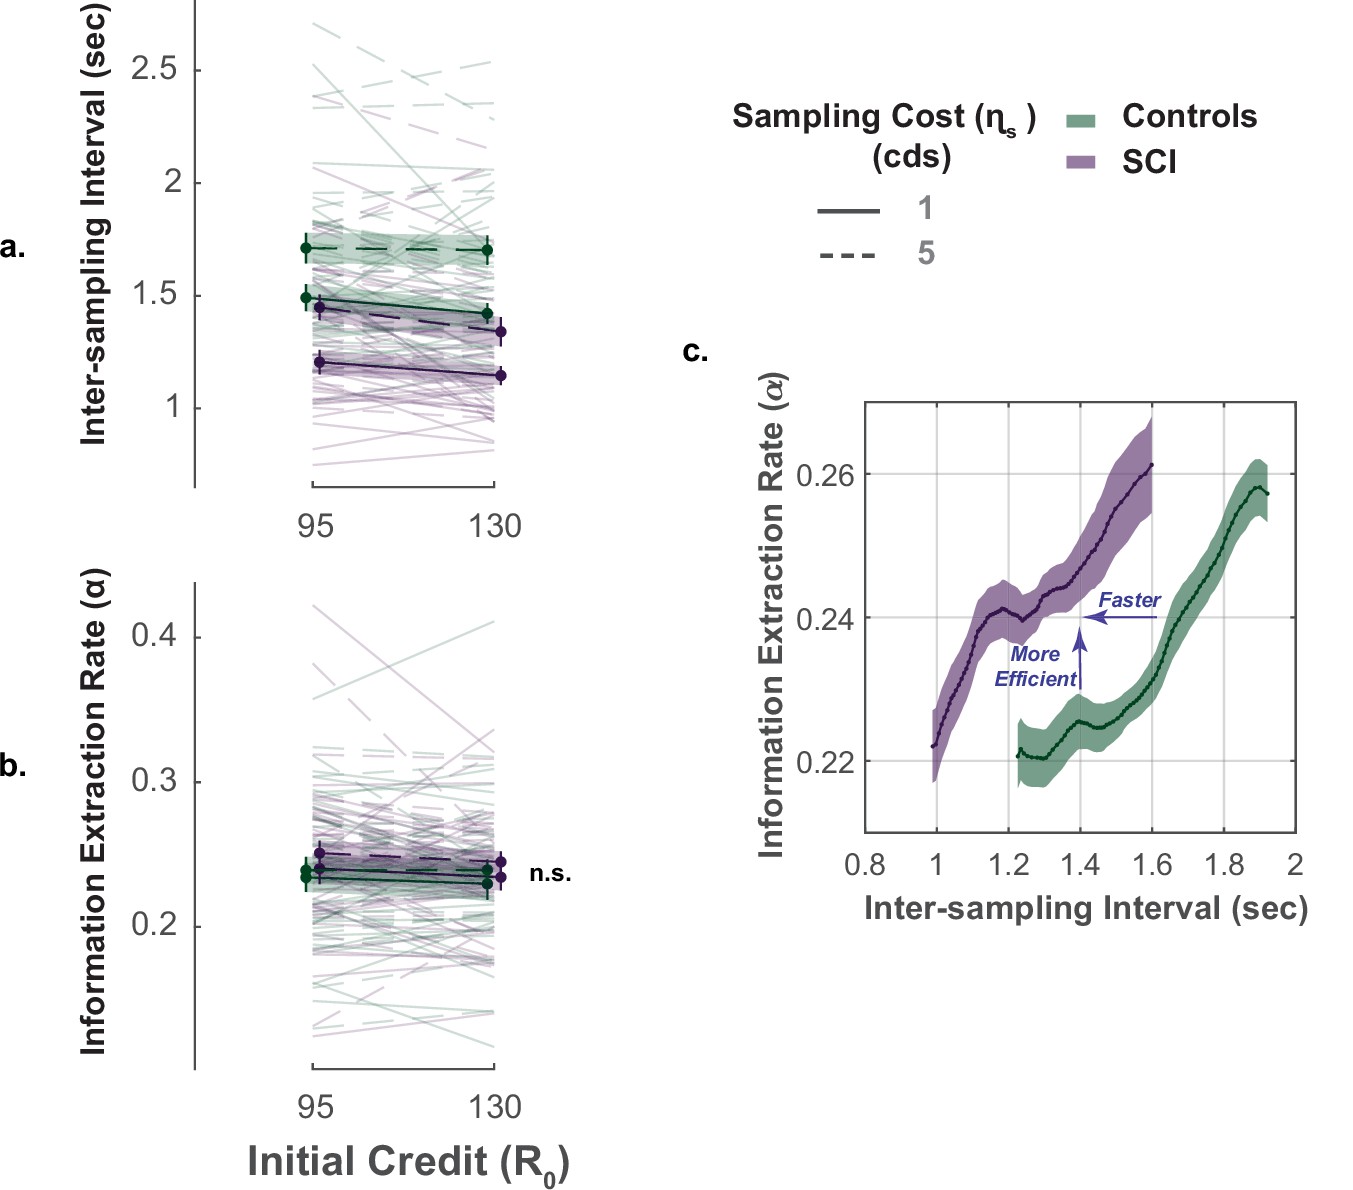
Faster but efficient sampling in SCI.
(a) Across different conditions of the task, SCI participants sampled faster than the healthy controls. (b) Sampling efficiency was not different between individuals with SCI and control. (c) Faster sampling was associated with lower efficiency giving rise to a speed-efficiency trade-off. SCI participants exceeded the speed efficiency trade-off that characterised controls’ sampling behaviour as they extracted more information than the control per unit time (sec). Conditional plot was generated by sliding 25% quantile bins of and computing average for each bin. Error bars show ± SEM. See Supplementary file 6 for full and statistical details.
Figure 4—figure supplement 1
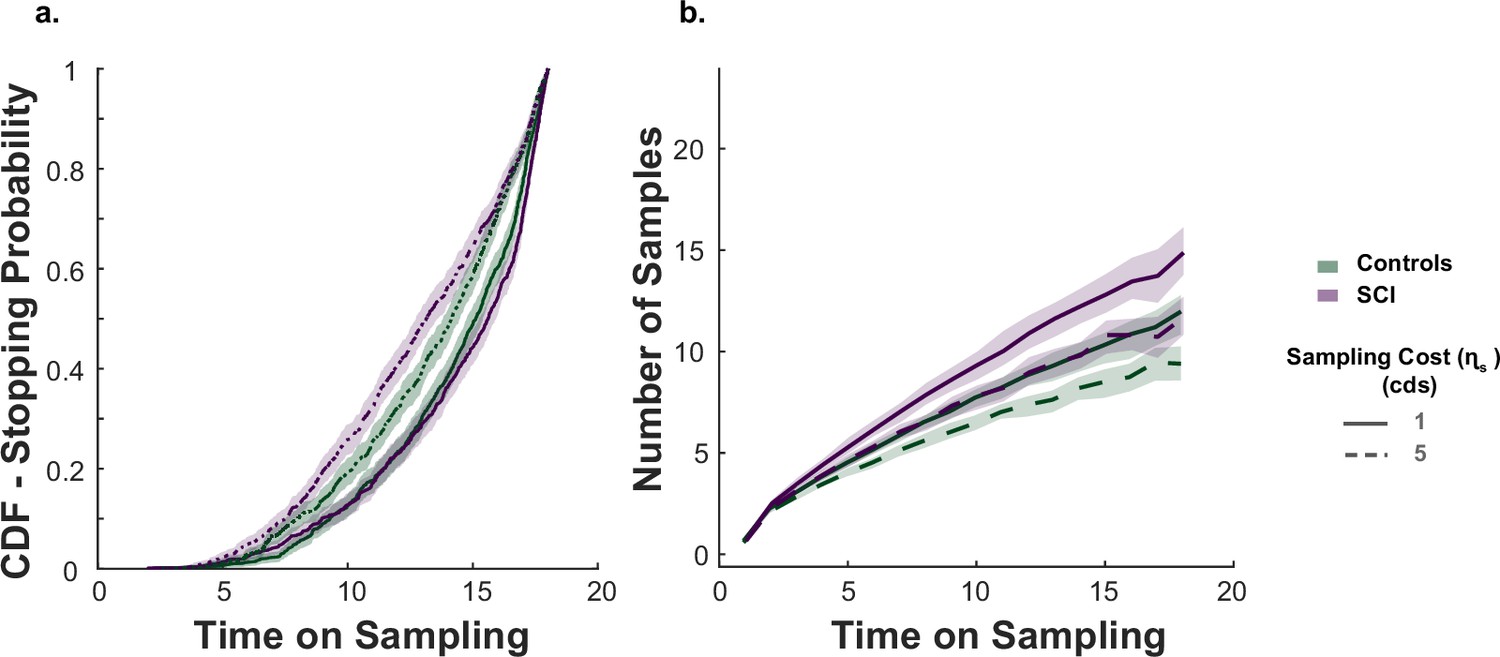
Sampling as a function of time.
(a) Probability to stop sampling at each time point during the sampling phase. When the sampling cost was high, participants were more likely to finish their sampling earlier. This effect was more evident in individuals with SCI as they had faster sampling rates (see Figures 2 and 4). (b) Number of samples as a function of time. This visualisation shows that SCI participants started to acquire more samples than controls early during the sampling phase. This suggests individuals with SCI opted to decrease uncertainty as soon as possible and that their faster sampling was evident throughout the sampling phase. Shadowed lines show 95% CI.
Figure 5

Affective burden correlates with faster and extensive sampling.
(a) Individuals with SCI were significantly more depressed and anxious than healthy matched control. (b) Anxiety scores and depression scores significantly correlated with each other across study participants of both groups. An affective burden score corresponding to severity of depression and anxiety was extracted using principal component analysis (PCA). This dimension accounted for 84% of the variance between anxiety and depression. (c) Affective burden was associated with increased reactivity to uncertainty indexed by speed and extent of sampling. More severe affective burden (i.e. higher severity of anxiety and depression) were associated with faster (shorter ) and more extensive sampling (i.e. over-sampling). BDI II: Beck’s Depression Inventory. HADS: Hospital Anxiety and Depression Scale (only anxiety score was included). ISI: Inter-sampling Interval in seconds. , . Error bars show ± SEM. Grey and purple lines show regression across all participants and within SCI group, respectively. Shaded area in correlation plots show 95% CI.
Figure 6
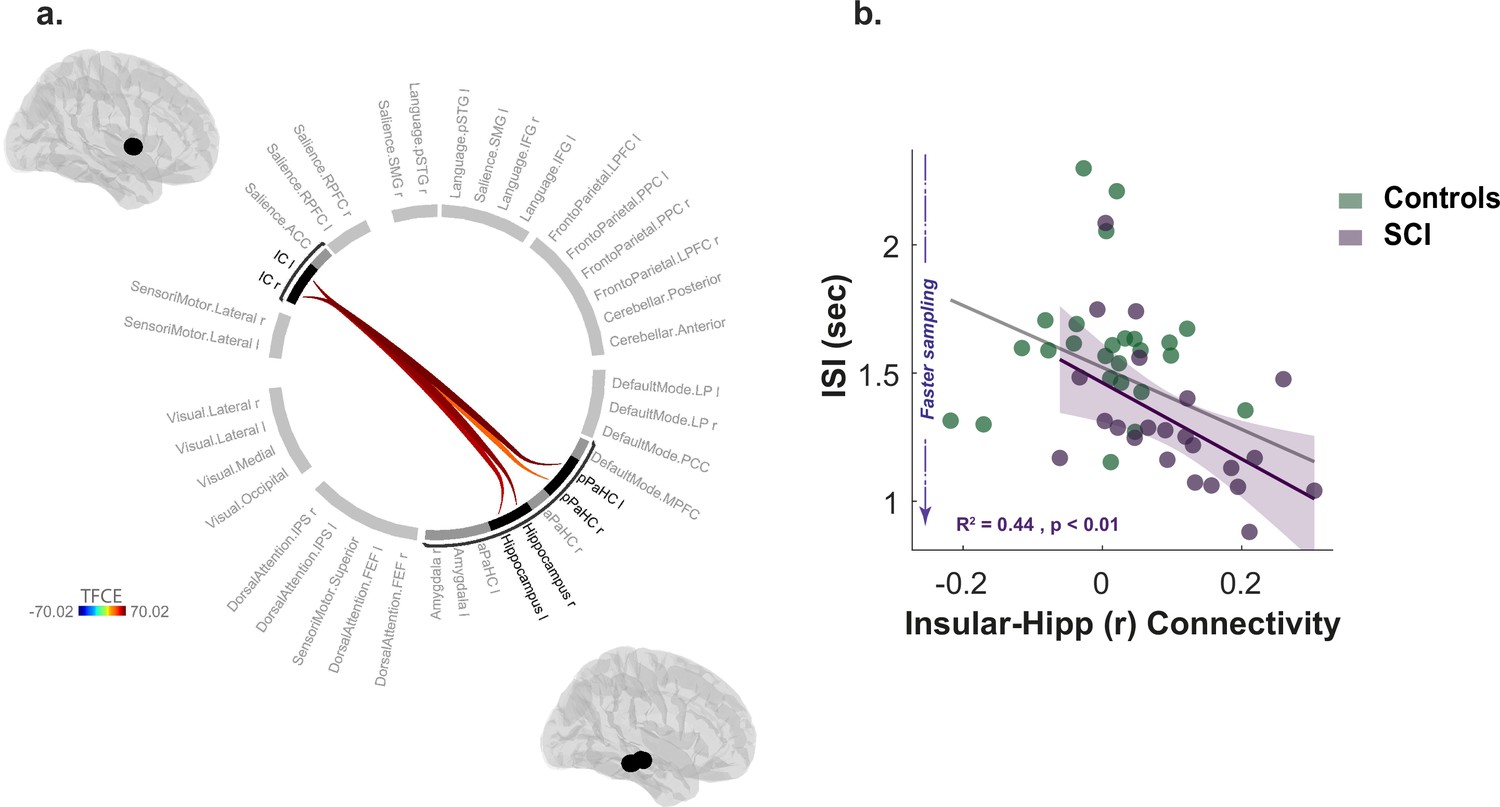
Increased insular hippocampal connectivity in individuals with SCI compared to healthy controls.
(a) Whole-brain ROI-to-ROI functional connectivity analysis with 40 ROIs from different brain networks and regions. SCI participants have increased functional connectivity between insular cortex (IC) and hippocampal/para-hippocampal (PaHC) regions. TFCE: Threshold Free Cluster Enhancement. See Supplementary file 9 for further statistical details. (b) Increased insular-hippocampal connectivity correlated with faster sampling (shorter ISI) in SCI, suggesting that hyperreactivity to uncertainty is related to this specific network. Grey and purple shaded line show regression across all participants and within SCI group, respectively. Shaded area show 95% CI.
Appendix 1—figure 1

SCI participants assign lower costs to speed and efficiency.
There was no significant difference in the weights SCI participants assigned to sampling benefit (we) or cost (ws), suggesting the differences in active sampling between the two groups were unlikely due to economic constraints of the task. On the other hand, individuals with SCI had lower weights assigned to efficiency () and speed (), indicating a lower cognitive cost to engage in faster and efficient sampling. w0 captures a subjective fixed cost of sampling that is not explicitly specified in the task (e.g. cost of the motor action). This was not significantly different between the two groups.
Author response image 1
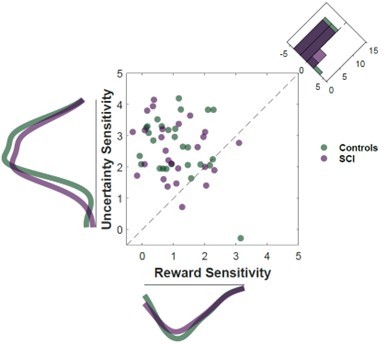
Intact passive decision making in SCI.
The weights that participants assigned to reward and uncertainty in the passive task were extracted from the generalised mixed effects model and plotted for visualisation. These represent the degree to which people change their acceptance as a function of change in the offer attribute (uncertainty and reward). There was no significant difference between SCI individuals and controls, indicating similar incentivisation by both attributes when making decisions..
Tables
Table 1
Demographics.
| N (M/F) | Controls | SCI | p-value* | ||
|---|---|---|---|---|---|
| 27 (13/14) | 27 (13/14) | ||||
| Mean | SD | Mean | SD | ||
| Age | 62.04 | 6.28 | 59.81 | 7.70 | 0.34 |
| ACE-III | 97.89 | 1.80 | 95.41 | 4.21 | 0.06 |
| BDI-II | 4.59 | 4.36 | 15.44 | 11.24 | <0.001 |
| HADS Dep. | 1.48 | 1.81 | 5.26 | 4.61 | <0.001 |
| HADS Anx. | 4.30 | 3.16 | 7.04 | 3.32 | <0.01 |
-
ACE-III: Addenbrooke’s Cognitive Examination. BDI-II: Beck Depression Inventory. HADS: Hospital Anxiety Depression Scale.
-
* Student-test or Wilcoxon rank-sum test for parametric and non-parametric data, respectively.
Additional files
-
Transparent reporting form
- https://cdn.elifesciences.org/articles/75834/elife-75834-transrepform1-v3.docx
-
Supplementary file 1
Active Search.
Generalised mixed effects models investigating the effect of the group (SCI vs. controls) on performance. Models were specified as follows: Response variable ~ 1 + group*η + group*R0 + ηs*R0 + group:ηs :R0 + (1 + ηs*R0 |participant). SCI: subjective cognitive impairment. R0 : initial credit reserve. ηs : sampling cost. EE: uncertainty before committing to decisions.
- https://cdn.elifesciences.org/articles/75834/elife-75834-supp1-v3.tex
-
Supplementary file 2
Active Search.
Number of samples obtained per condition. R0 : initial credit reserve. ηs : sampling cost.
- https://cdn.elifesciences.org/articles/75834/elife-75834-supp2-v3.tex
-
Supplementary file 3
Active Search.
Deviation from optimal (s−s*) for each condition. R0 : initial credit reserve. ηs : sampling cost. : number of samples obtained. s*: optimal number of samples.
- https://cdn.elifesciences.org/articles/75834/elife-75834-supp3-v3.tex
-
Supplementary file 4
Active Search.
Generalised mixed effects models investigating the effects ofthe group (SCI vs. controls) and affective burden on uncertainty estimation. Models were specified as follows: Subjective Uncertainty ~ 1 + group* EE+ (1 + EE |participant) + (1 |trial). Subjective Uncertainty ~ 1 + Burden* EE+ age + ACE-III +(1 + EE |participant) + (1 |trial). EE: Experimentally defined expected error. ACE-III: Addenbrook’s Cognitive Examination score.
- https://cdn.elifesciences.org/articles/75834/elife-75834-supp4-v3.tex
-
Supplementary file 5
Passive choices.
Generalised mixed effects models investigating effects of group (SCI vs. controls) and affective burden effect on passive decision making under uncertainty. Models were specified as follows: choice ~ 1 + group*R + group*EE + R*EE + group:R:EE + (1 + R*EE |participant). Choice ~ 1 + Burden*R + Burden*EE + R*EE + Burden:R:EE + Age + ACE-III (1 + R*EE|participant). R: reward on offer. EE: expected localisation error. SCI: subjective cognitive impairment group. ACE-III: Addenbrook’s Cognitive Examination score.
- https://cdn.elifesciences.org/articles/75834/elife-75834-supp5-v3.tex
-
Supplementary file 6
Active Search.
Generalised mixed effects models investigating the effect of the group (SCI vs. controls) on sampling speed (ISI) and efficiency (α). Models were specified as follows: Inter-sampling Interval (ISI) ~ 1 + group*ηs + group*R0 + ηs*R0 + group:ηs :R0 + (1 + ηs*R0 |participant); Information extraction rate (α) ~ 1 + group*ηs + group*R0 + ηs*R0 + group:ηs :R0 + (1 + ηs*R0 |participant).
- https://cdn.elifesciences.org/articles/75834/elife-75834-supp6-v3.tex
-
Supplementary file 7
Active Search – Inter-sampling interval per condition.
R0 : initial credit reserve. ηs : sampling cost.
- https://cdn.elifesciences.org/articles/75834/elife-75834-supp7-v3.tex
-
Supplementary file 8
Active Search.
Speed efficiency trade-off. Models were specified as follows: α ~ 1 + ISI + (1 +ISI |participant) + (1 + ISI |condition) + (1 |trial).
- https://cdn.elifesciences.org/articles/75834/elife-75834-supp8-v3.tex
-
Supplementary file 9
ROI to ROI resting functional connectivity.
PaHC: para-hippocampus. Hipp: hippocampus. IC: insular cortex. unc: uncorrected. FWE: family-wise error. FDR: false discovery rate.
- https://cdn.elifesciences.org/articles/75834/elife-75834-supp9-v3.tex
-
Supplementary file 10
ROI to ROI resting functional connectivity with potential outliers (three SCI individuals and one control with values above or below Q3 + 1.5IQR) excluded.
PaHC: parahippocampus. Hipp: hippocampus. IC: insular cortex. unc: uncorrected. FWE: family-wise error. FDR: false discovery rate.
- https://cdn.elifesciences.org/articles/75834/elife-75834-supp10-v3.tex
-
Supplementary file 11
Motion parameters and other quality control measures.
(a) Six motion parameters were used during realignment procedure for rfMRI processing. These correspond to six timeseries containing three transnational and three rotational parameters over time for each subject. None of these parameters was significantly different between SCI and controls groups (all ). (b) Five quality control estimates were used during preprocessing of neuroimaging data (Whitfield-Gabrieli and Nieto-Castanon, 2012). These included number of valid scans after scrubbing procedure, mean and maximum motion (extracted from the six parameters above), mean and maximum global signal change. None of these parameters was significantly different between the two groups (all ). Based on mean motion and mean global signal changes, four potential outliers (three SCI participants and one control with values above or below ) were identified. A second version of neuroimaging analysis was performed with these participants excluded (Supplementary file 10). There were no changes to the results or conclusions made in the paper. These findings suggest that rfMRI differences between SCI participants and controls are unlikely due to motion artifacts. Mean and max motion was calculated based on Power et al., 2012. Error bars show ± 95% CI.
- https://cdn.elifesciences.org/articles/75834/elife-75834-supp11-v3.pdf
-
Supplementary file 12
Quality control parameters do not correlate with task measures and affective burden.
Across study participants, no correlation was found between mean motion (or global signal change) and hyperreactivity to uncertainty ( or Deviation from optimal) or affective burden (all ). Specifically, no correlation between (the measure that correlates with insular-hippocampal connectivity) and these quality control measures (mean motion and mean GS change) across SCI participants ( , respectively). These findings suggest that correlation between and insular-hippocampal connectivity is unlikely due to motion artifacts. Correlations were controlled for age and gender. Error bars show ± 95% CI.
- https://cdn.elifesciences.org/articles/75834/elife-75834-supp12-v3.pdf
Download links
A two-part list of links to download the article, or parts of the article, in various formats.
Downloads (link to download the article as PDF)
Open citations (links to open the citations from this article in various online reference manager services)
Cite this article (links to download the citations from this article in formats compatible with various reference manager tools)
Hyperreactivity to uncertainty is a key feature of subjective cognitive impairment
eLife 11:e75834.
https://doi.org/10.7554/eLife.75834


