RNA-binding proteins direct myogenic cell fate decisions
- Department of Biochemistry, University of Colorado, United States
- Medical Scientist Training Program, University of Colorado Anschutz Medical Campus, United States
- Howard Hughes Medical Institute, University of Colorado, United States
- Department of Pathology, Stanford University, United States
- Department of Neuropathology, Stanford University, United States
- Department of Molecular and Cell Biology, University of California, Berkeley, United States
- Department of Molecular, Cellular and Developmental Biology, University of Colorado, United States
- Department of Surgery, University of Colorado, United States
- Molecular Biology Program and Department of Biochemistry and Molecular Genetics, University of Colorado Anschutz Medical Campus, United States
- Center for Personal and Dynamic Regulomes, Stanford University, United States
- Department of Neurology and Neurological Sciences, Stanford University School of Medicine, United States
- Paul F. Glenn Center for the Biology of Aging, Stanford University School of Medicine, United States
- Center for Tissue Regeneration, Repair, and Restoration, Veterans Affairs Palo Alto Health Care System, United States
- Howard Hughes Medical Institute, Stanford University, United States
- University of Colorado School of Medicine, RNA Bioscience Initiative, University of Colorado Anschutz Medical Campus, United States
Figures
Figure 1 with 1 supplement
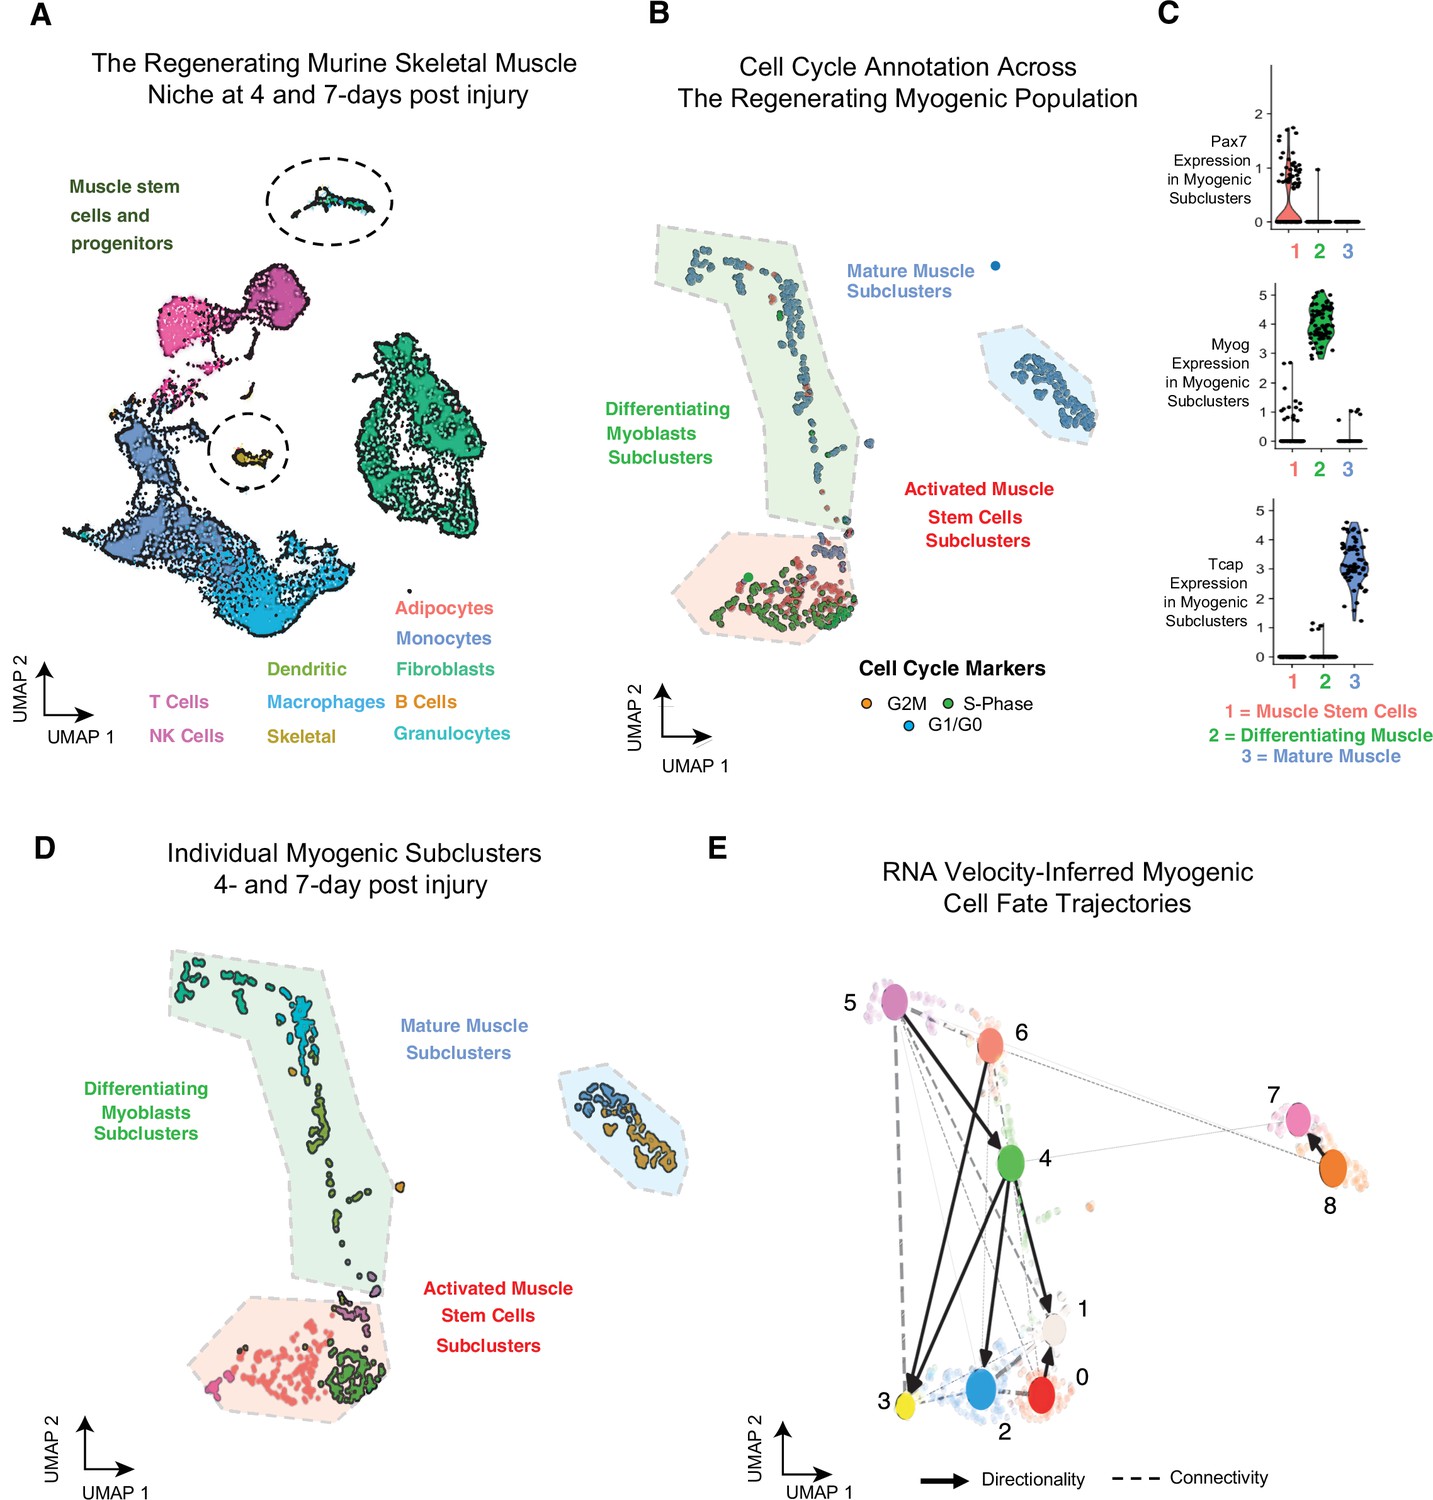
Single-cell analysis reveals myogenic cell fate transitions in regenerating skeletal muscle.
(A) Single-cell atlas of regenerating skeletal muscle at 4 and 7 days post injury (dpi). (B) Cell cycle scoring in regenerating myogenic subclusters. (C) Violin plots showing expression of myogenic markers of regeneration per myogenic clusters. (D) Myogenic subclusters comprising the regenerating myogenic cellular population. (E) RNA velocity-inferred myogenic cell fate trajectories. See also Figure 1—figure supplement 1.
Figure 1—figure supplement 1
Related to Figure 1.
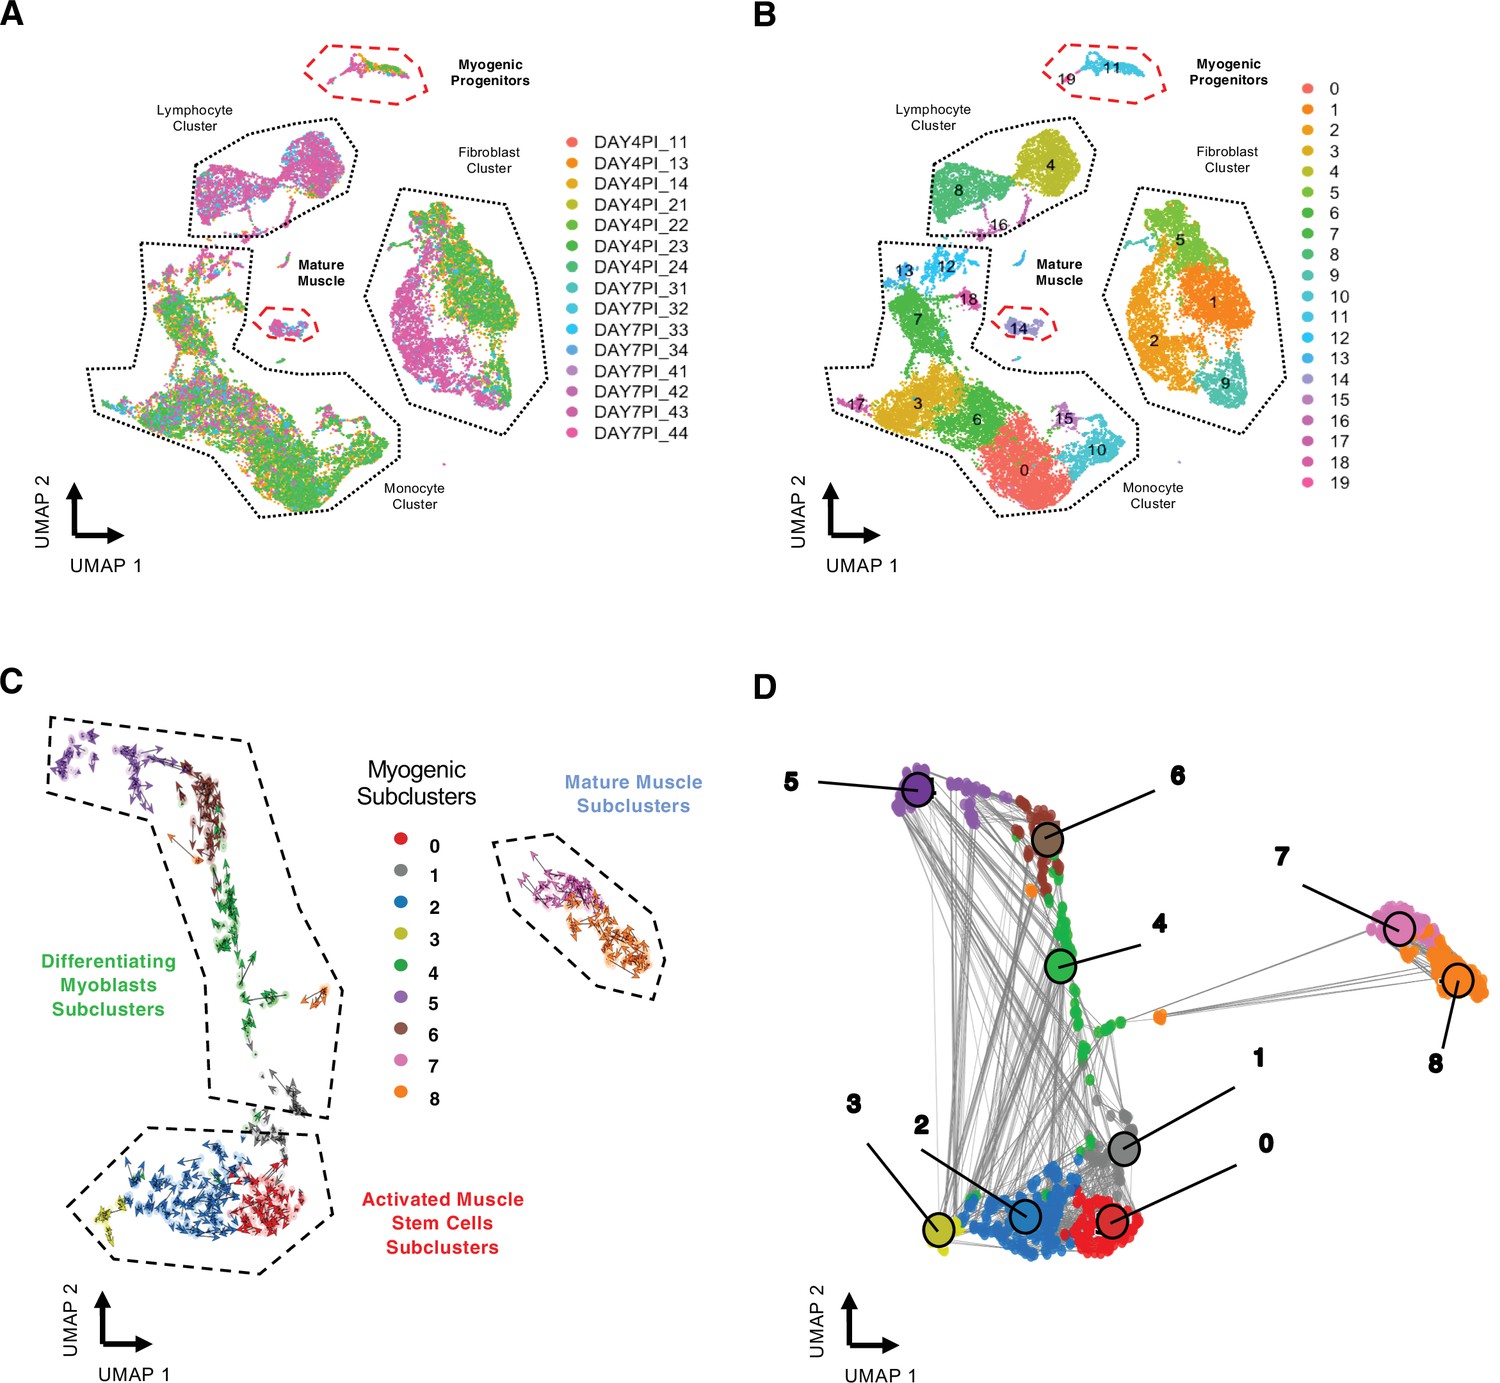
(A) Uniform manifold approximation and projection (UMAP) of regenerating skeletal muscle at 4 and 7 days post injury (dpi) with colored individual sequencing libraries (B) and by individual cellular clusters. (C) RNA velocity of myogenic subclusters. (D) Velocity-inferred cell–cell connectivity between myogenic subclusters.
Figure 2
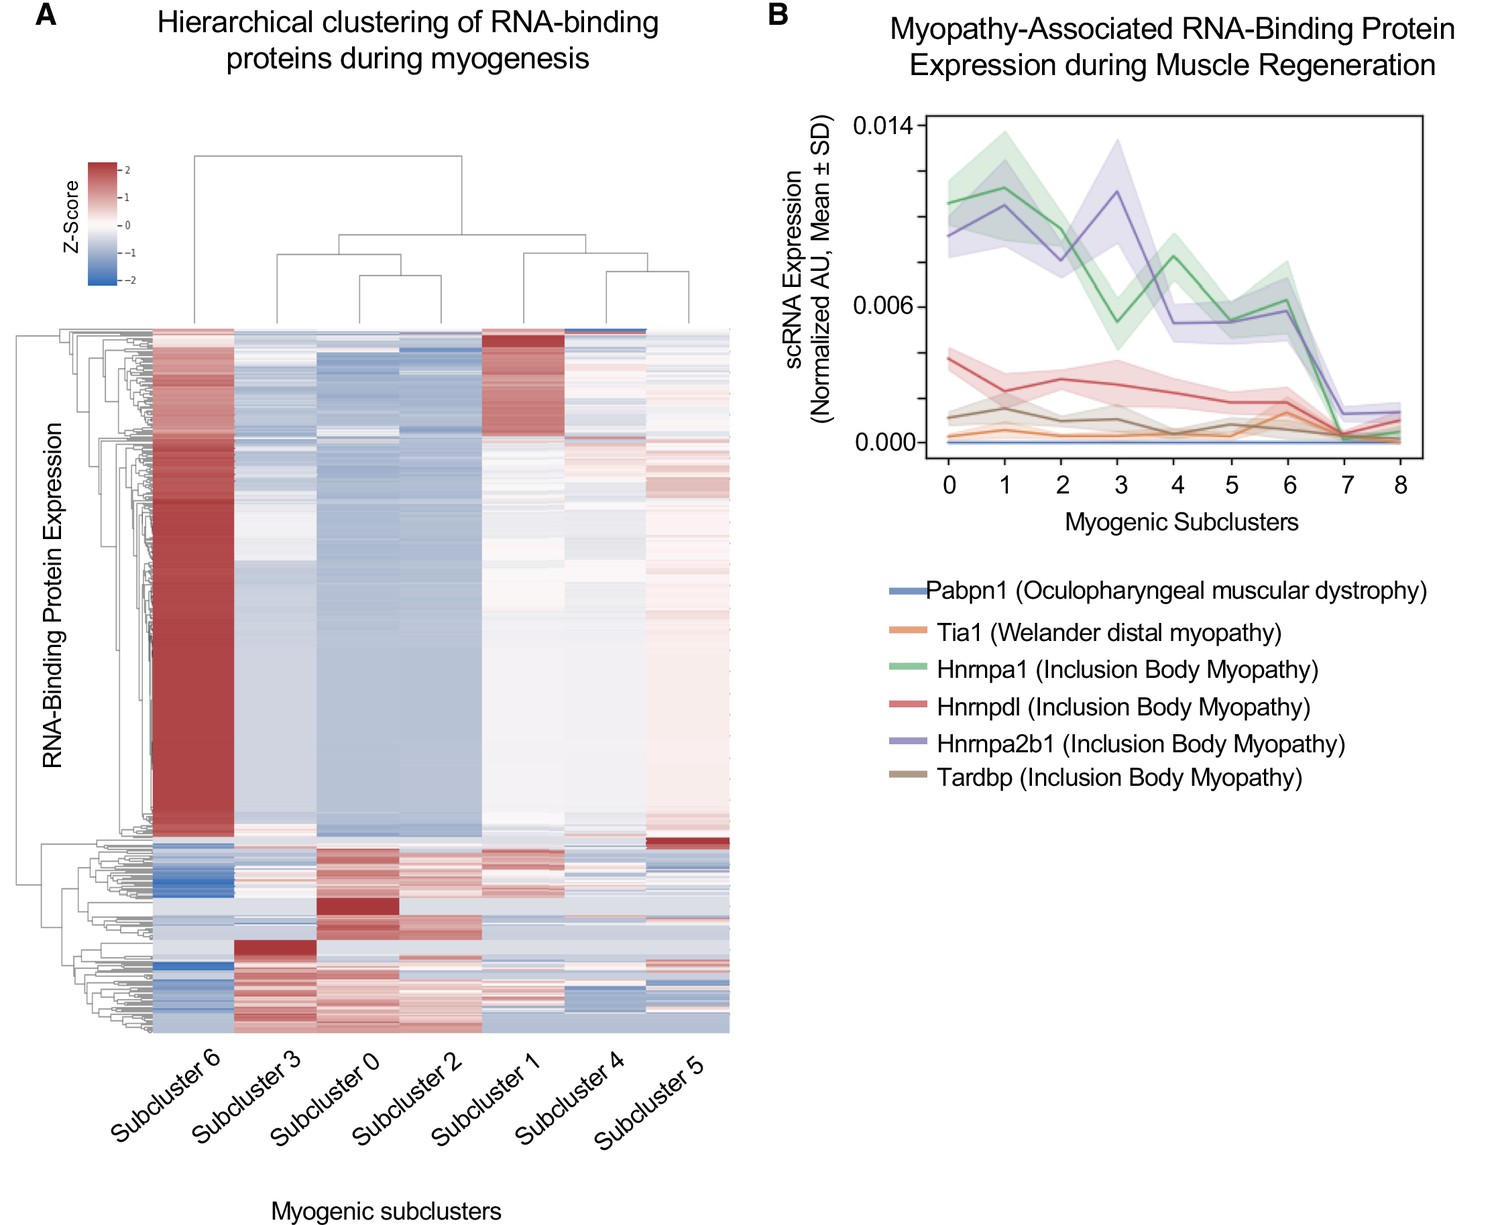
Cluster-specific RNA-binding protein expression is temporally defined during myogenesis.
(A) Hierarchical clustering of RNA-binding protein expression in myogenic subclusters 1–6 during myogenesis. (B) Line plot of select myopathy-associated RNA-binding protein expression in subclusters 0–8 during myogenesis.
Figure 3 with 1 supplement

Hnrnpa2b1 is upregulated in myogenic nuclei during skeletal muscle regeneration.
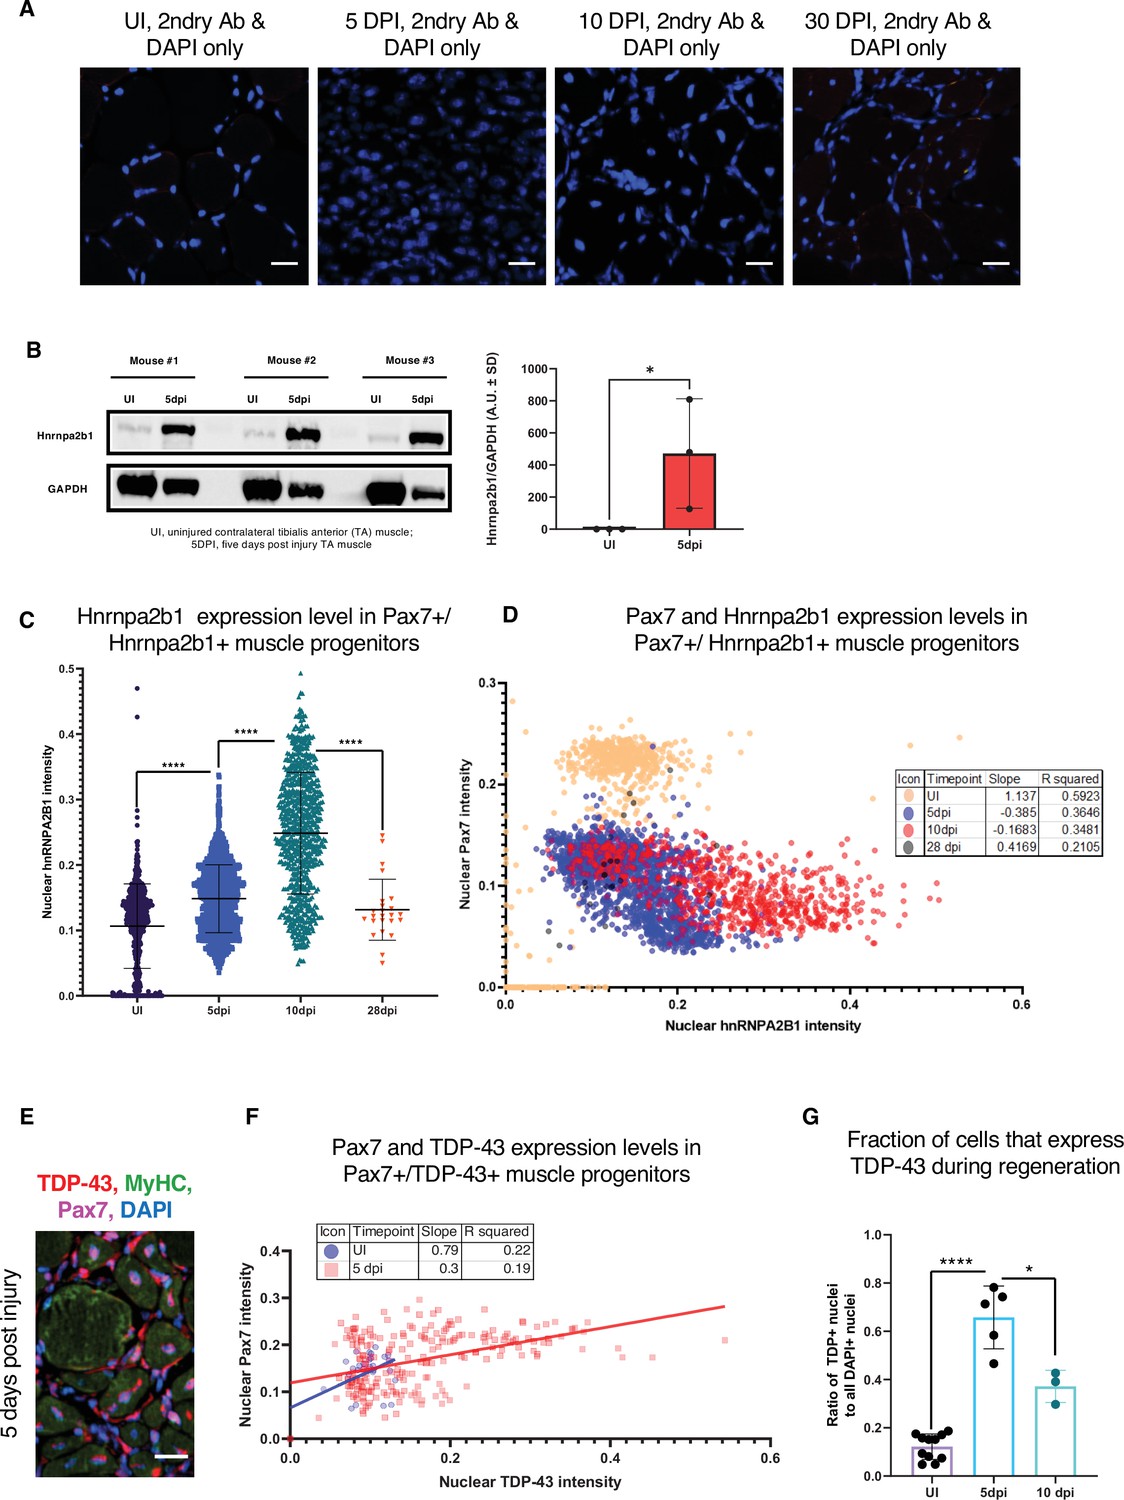
(A) Hnrnpa2b1 immunoreactivity in uninjured (UI), 5, 10, and 30 days post injury (dpi) regenerating mouse muscle. All images represent n = 3 biological replicates; scale = 20 µM. (B) Nuclear Hnrnpa2b1 immunoreactivity in UI, 5, 10, and 28 dpi regenerating muscle. (C) Nuclear Hnrnpa2b1 immunoreactivity intensity in either myonuclei or non-myonuclei in UI, 5, 10, and 28 dpi regenerating muscle. See also Figure 3—figure supplement 1.
Figure 3—figure supplement 1
Related to Figure 3.
(A) Secondary-only immunoreactivity controls of muscle sections for all time points assessed by immunofluorescence (IF) in Figure 1A. (B) Quantified Western blot analysis of Hnrnpa2b1 protein expression from whole uninjured (UI) and 5 days post injury (dpi) regenerating muscle (one-tailed Student’s t-test). (C) Hnrnpa2b1 nuclear intensity in Pax7-positive myonuclei in UI, 5, 10, and 28 dpi regenerating muscle. (D) Scatter plot and R2 values for expression changes in myonuclear Pax7 and Hnrnpa2b1 in UI, 5, 10, and 28 dpi regenerating muscle. (E) Immunoreactivity in 5 dpi regenerating muscle for Tardbp, myosin heavy chain (Myhc), and Pax7. (F) Scatter plot and R2 values for Tardbp expression changes in Pax7 myonuclei in UI and 5 dpi. (G) Tardbp nuclear protein in UI, 5 dpi , and 10 dpi regenerating muscle. All images represent n = 3 biological replicates; scale = 20 µM. All quantified data represent mean ± SD, two-tailed Student’s t-test p-value: *<0.05, **<0.01, ***<0.001, ****<0.0001 unless otherwise stated.
-
Figure 3—figure supplement 1—source data 1
Related to Figure 3B.
Raw and annotated Western blot image of Hnrnpa2b1 and Gapdh protein expression from whole uninjured (UI) and 5 days post injury mouse tibialis anterior muscle.
- https://cdn.elifesciences.org/articles/75844/elife-75844-fig3-figsupp1-data1-v2.zip
Figure 4 with 1 supplement
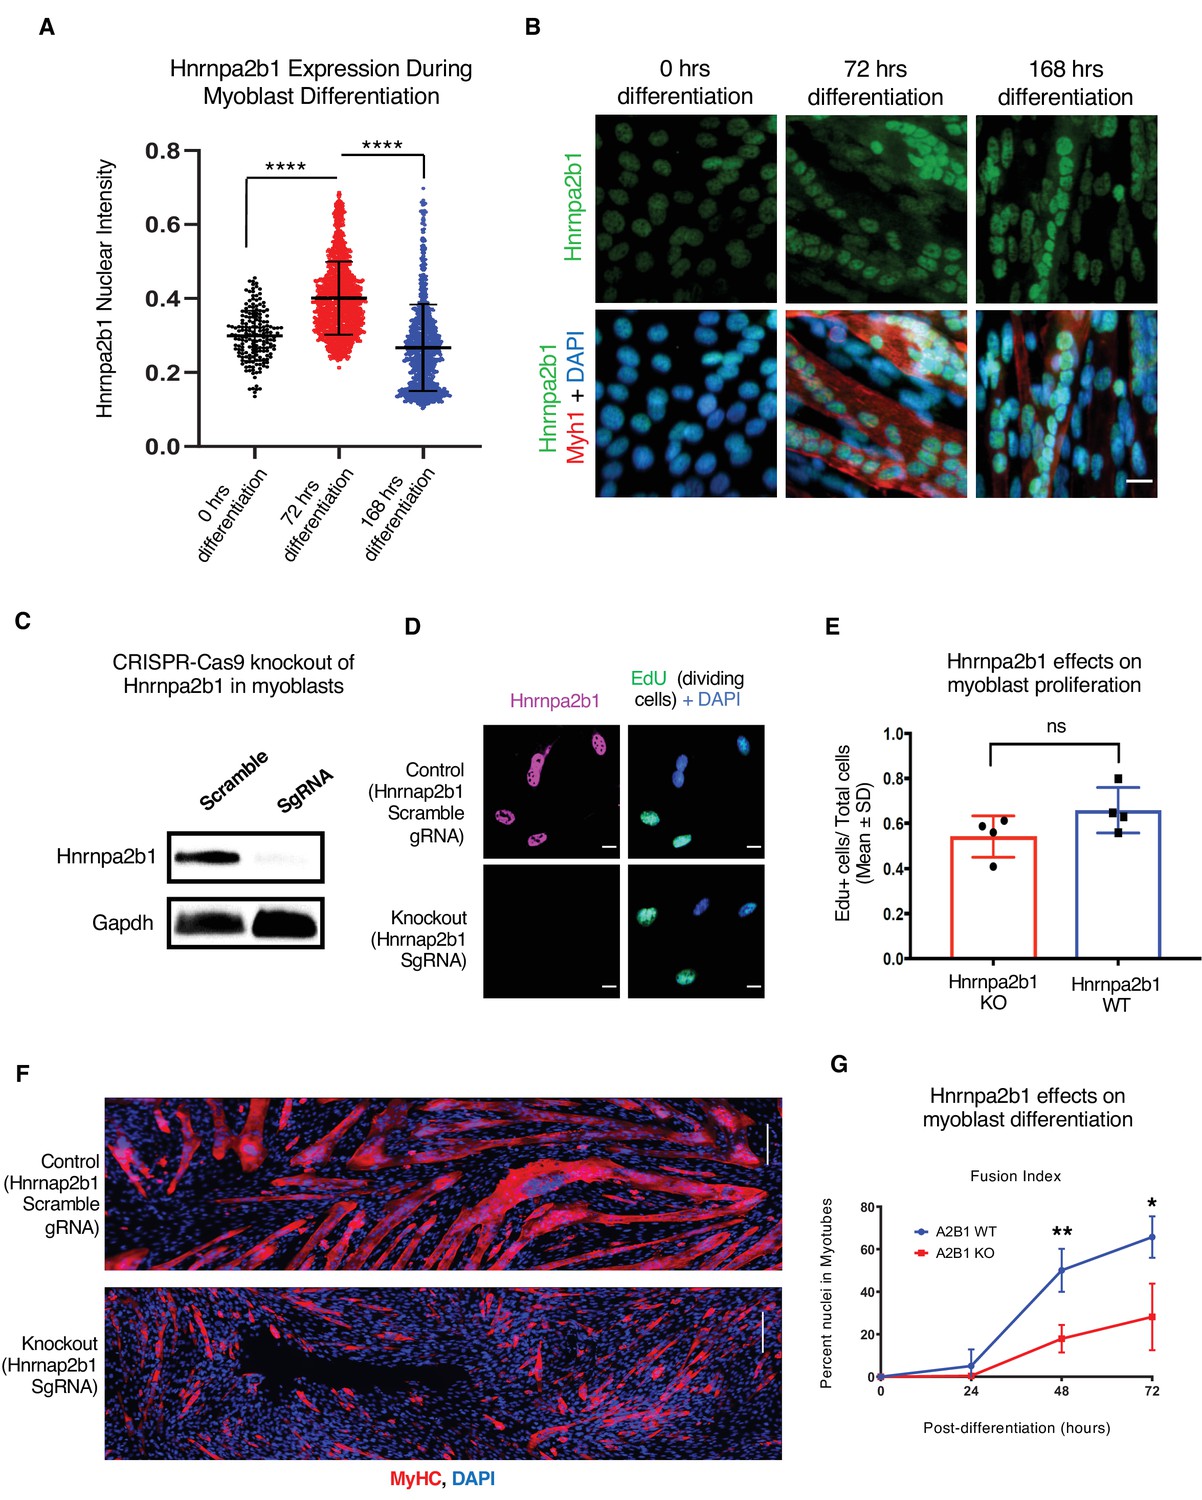
Hnrnpa2b1 is required for myogenic differentiation.
(A) Hnrnpa2b1 nuclear protein in exponentially growing myoblasts (0 hr) and differentiating myotubes at 72 and 168 hr. (B) Immunoreactivity of Hnrnpa2b1 in myoblasts and differentiating myotubes. (C) Western blot analysis of CRISPR-Cas9 knockout (KO) and scrambled sequence Hnrnpa2b1 sgRNA-treated C2C12 myoblasts. (D) EdU-pulsed wild type (WT) myoblasts and Hnrnpa2b1 KO myoblasts (scale = 10 µM). (E) Quantification of EdU incorporation in WT and KO Hnrnpa2b1 myoblasts (ns = nonsignificant). (F) Immunoreactivity for Myhc in differentiating WT and KO Hnrnpa2b1 myotubes (scale = 200 µM). (G) Quantification of Fusion Index (percentage of nuclei fused into myotubes) during differentiation in either WT or KO Hnrnpa2b1 myotubes. All quantified data represent mean ± SD, two-tailed Student’s t-test p-value: *<0.05, **<0.01, ***<0.001, ****<0.0001 unless otherwise stated. See also Figure 4—figure supplement 1.
-
Figure 4—source data 1
Related to Figure 4C.
Raw and annotated Western blot image of Hnrnpa2b1 and Gapdh in wild type (WT) and Hnrnpa2b1 knockout (KO C2C12 myoblasts).
- https://cdn.elifesciences.org/articles/75844/elife-75844-fig4-data1-v2.zip
Figure 4—figure supplement 1
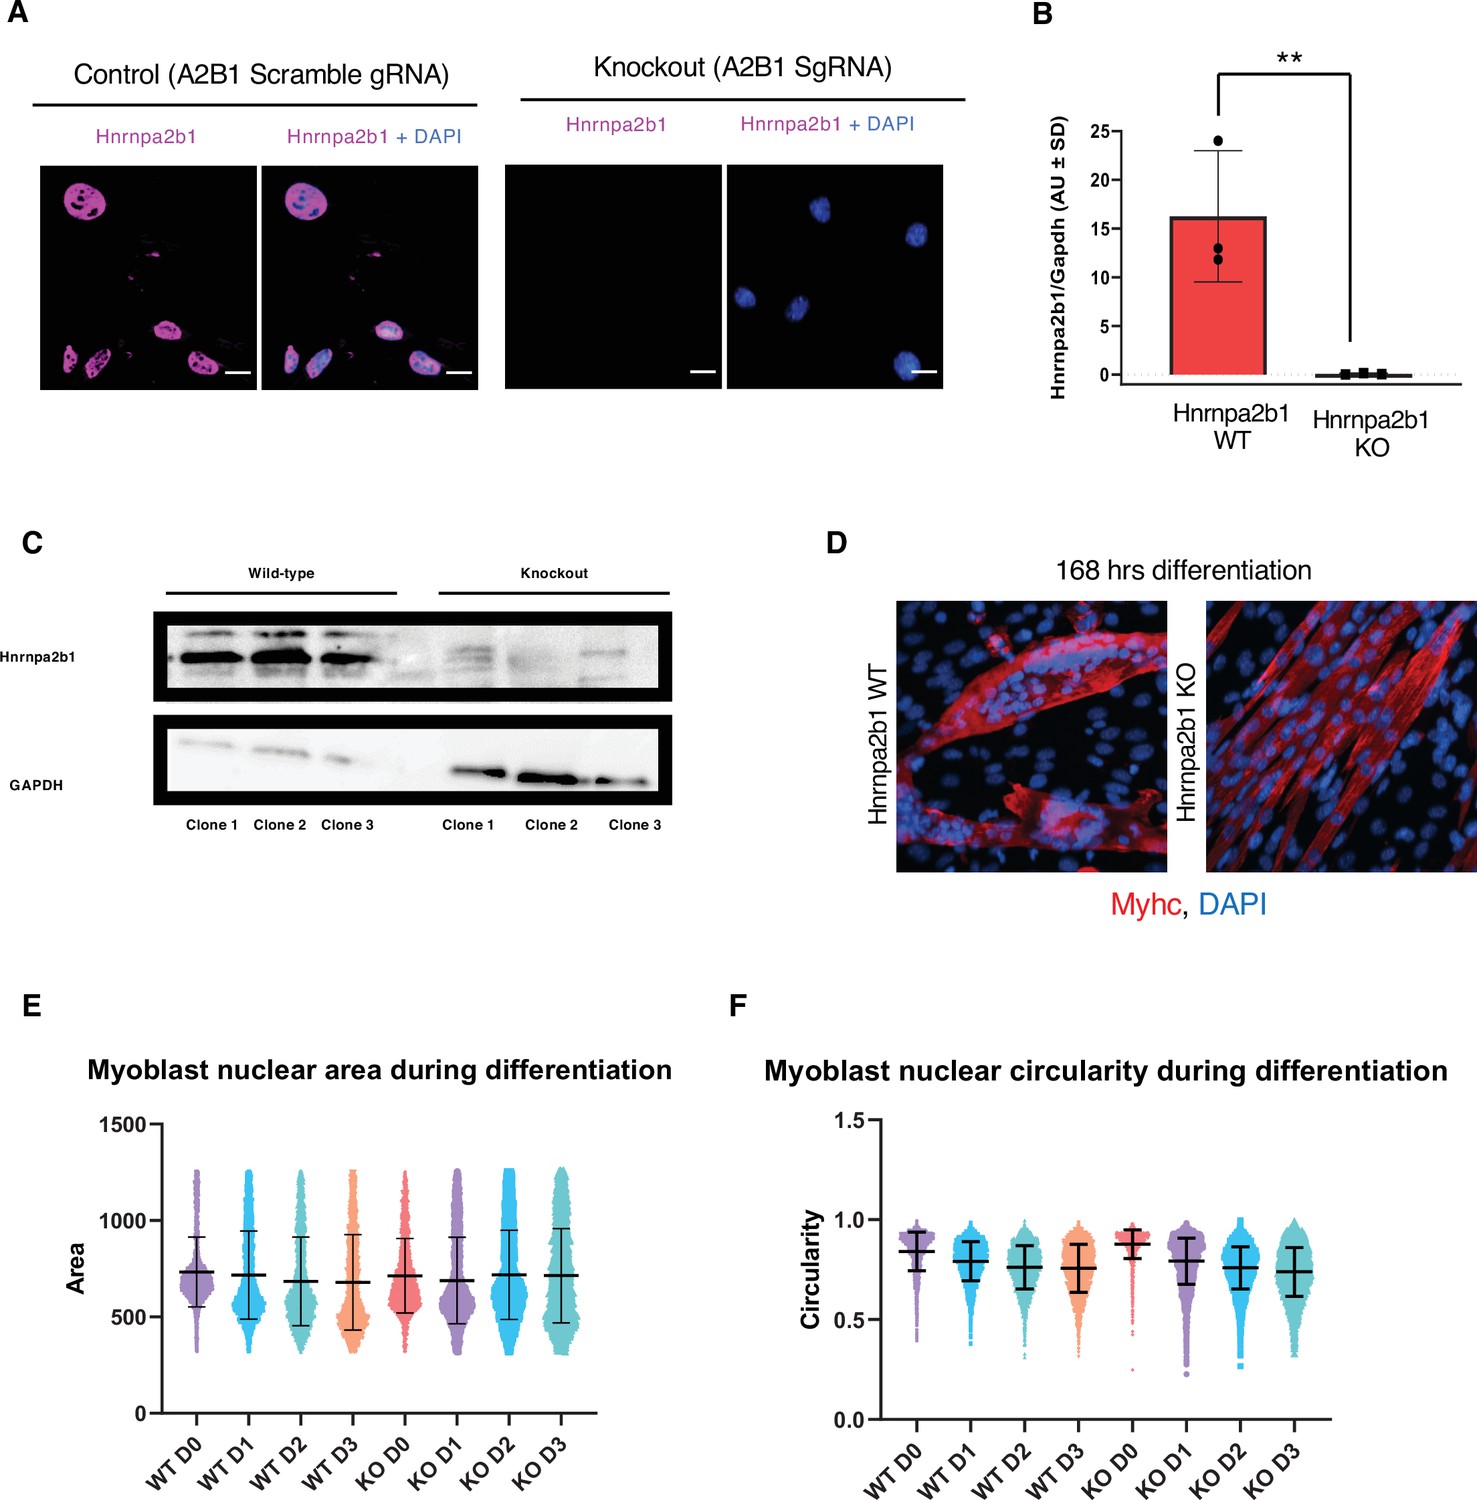
Related to Figure 4.
(A) Hnrnpa2b1 protein in wild type (WT) and Hnrnpa2b1 knockout (KO) myoblasts (scale = 10 µM). (B) Western blot intensity quantification of Hnrnpa2b1 in WT and Hnrnpa2b1 KO C2C12 myoblasts. (C) Western blot image of Hnrnpa2b1 in WT and Hnrnpa2b1 KO C2C12 myoblasts. (D) Myhc immunoreactivity in Hnrnpa2b1 WT and KO 168 hr differentiated C2C12 myotubes. (E, F) Quantification of Hnrnpa2b1 WT and KO myoblast nuclear area and circularity during differentiation. All images represent n = 3 biological replicates from three independent Hnrnpa2b1 WT and KO clones: scale = 20 µM. All quantified data represent mean ± SD, two-tailed Student’s t-test p-value: **<0.01.
Figure 5 with 2 supplements
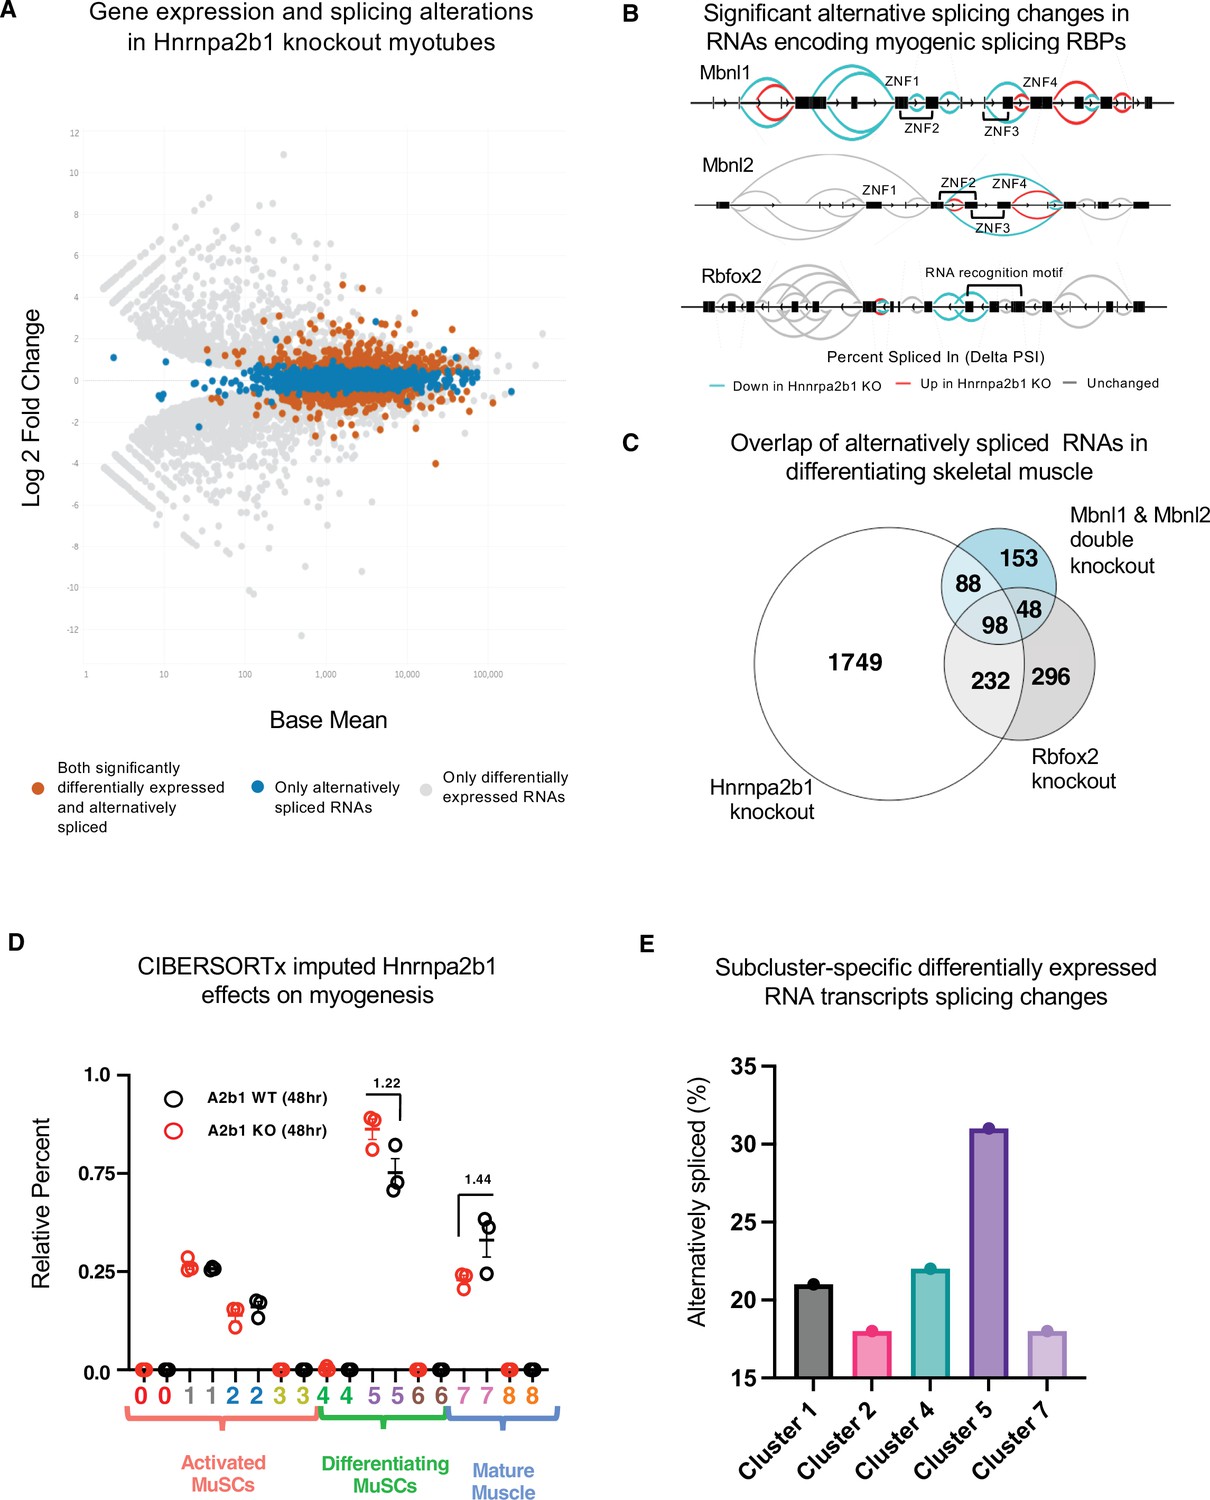
Hnrnpa2b1 is a myogenic splicing regulator critical for terminal myogenic differentiation.
(A) Differential gene expression identified by DESeq2 in wild type (WT) and Hnrnpa2b1 knockout (KO) myotubes after 48 hr of differentiation with alternative splicing changes identified by LeafCutter (differential gene expression significance p-adjusted<0.05, splicing false discovery rate [FDR] p-value<0.05). (B) Sashimi plots of significant alternative splicing changes (delta percent spliced in [dPSI]) for Mbnl1, Mbnl2, Rbfox2 in differentiating Hnrnpa2b1 KO myotubes. (C) Venn diagram of significantly altered spliced transcripts in Hnrnpa2b1 KO, Mbnl1/Mbnl2 double KO (Thomas et al., 2017), and Rbfox2 KO (Singh et al., 2014) differentiating myogenic cultures. (D) Myogenic-trained CIBERSORTx-imputed stacked bar chart of myogenic subcluster percentages in C2C12 differentiation time course (Trapnell et al., 2010). (E) Myogenic-trained CIBERSORTx machine learning imputed percentages of myogenic clusters from WT and KO Hnrnpa2b1 differentiating myotubes. Y-axis refers to fold change between myogenic cluster percentages. See also Figure 5—figure supplement 1.
Figure 5—figure supplement 1
Related to Figure 5.
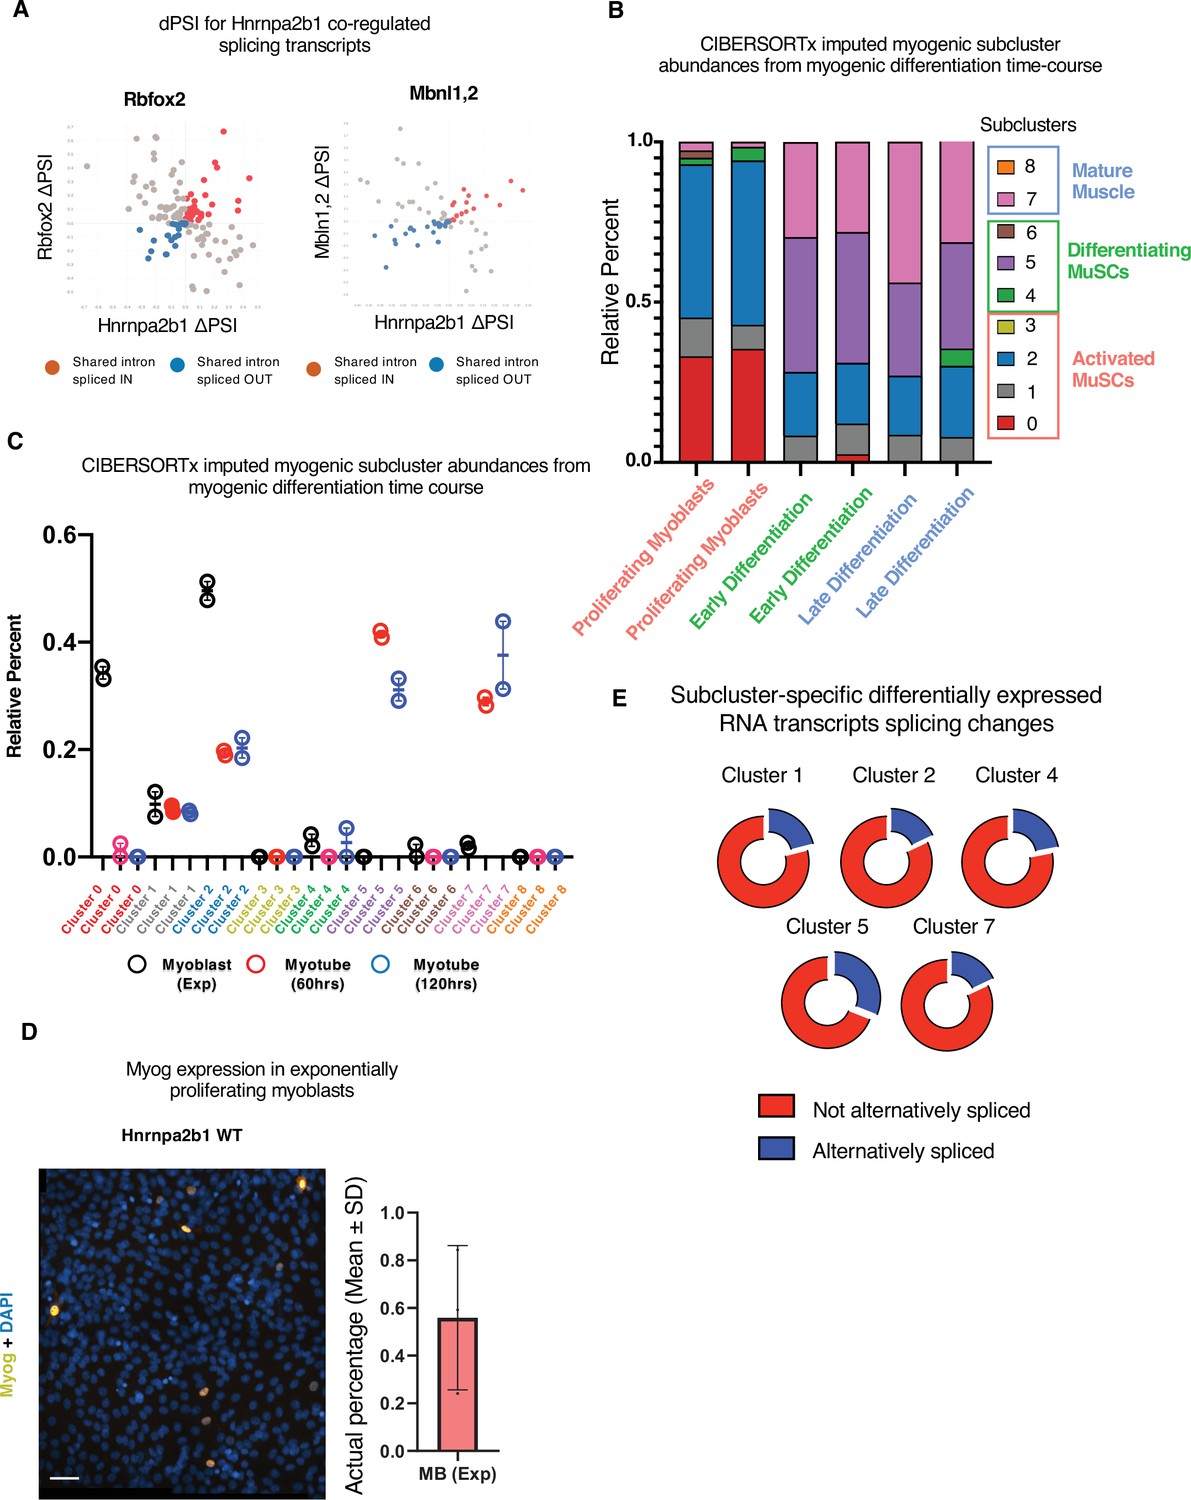
(A) Hnrnpa2b1-Rbfox or Hnrnpa2b1-Mbnl1/Mbnl2 delta percent spliced in (dPSI) changes in shared significantly altered spliced RNAs. (B, C) Myogenic-trained CIBERSORTx-imputed percentages of myogenic clusters from RNA-sequencing performed in biological duplicate of C2C12 differentiation time course (Trapnell et al., 2010). (D) Myogenin immunoreactivity and DAPI nuclear staining of exponentially proliferating C2C12 myoblasts. Bar plot represents percentage of myogenin+ proliferating C2C12 myoblasts, n = 3 biological replicates, scale = 50 µM. (E) Percentage of Hnrnpa2b1 knockout (KO) splicing alterations in significantly differentially expressed transcripts identified per myogenic cluster.
Figure 5—figure supplement 2
Related to Figure 5 – a distinct Hnrnpa2b1 gene expression and splicing program during differentiation.
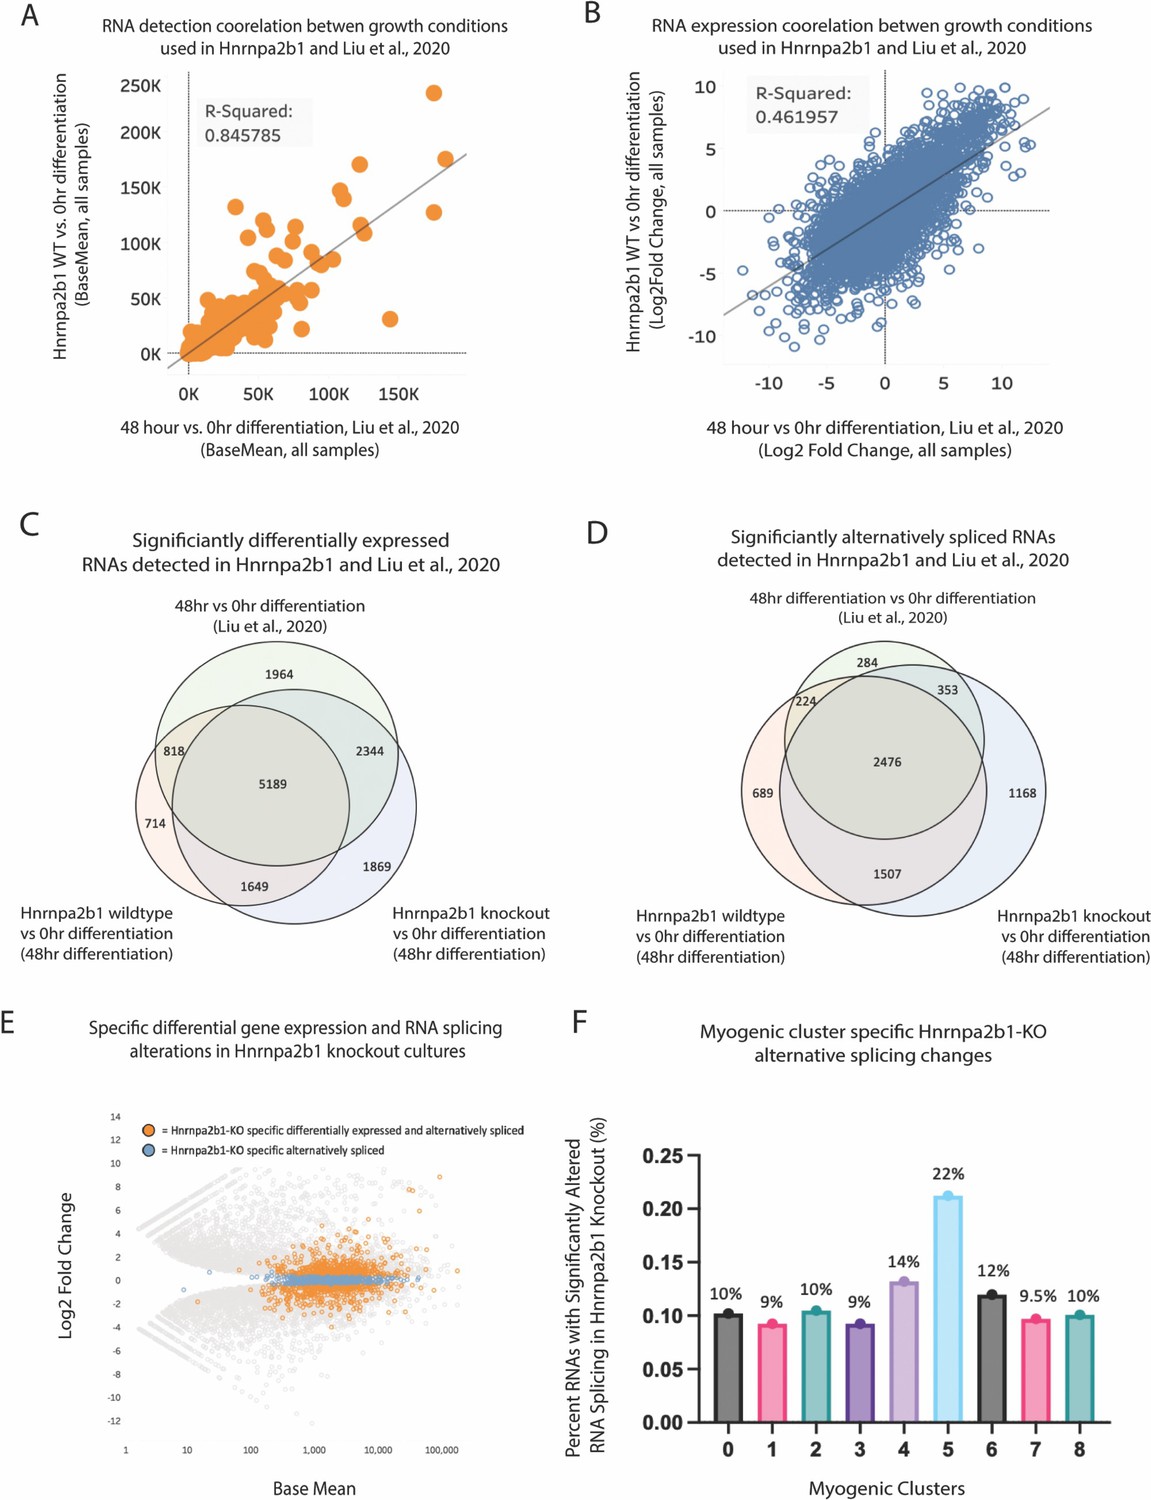
(A, B) Correlation of base mean and log2 fold change between Hnrnap2b1KO myoblasts and WT myoblasts differentiated for 48 hr and C2C12 myoblasts differentiated for 48 hr from Xue et al., 2020. RNA-sequencing data was compared against 0 hr proliferating myoblasts from Xue et al., 2020. (C, D) Venn diagrams showing differentially expressed genes identified by DESeq2 and alternative spliced transcripts identified by LeafCutter for 48 hr differentiation (Xue et al., 2020) for Hnrnpa2b1 WT cells and Hnrnpa2b1 KO cells. All data are compared to 0 hr proliferating myoblasts from Xue et al., 2020. (E) MA plot for differential gene expression changes identified in Hnrnpa2b1 KO cells compared to 0 hr proliferating myoblasts from Xue et al., 2020. Specific alternatively spliced transcripts identified in (D) are highlighted. (F) Impact of Hrnpa2b1 KO-specific alternatively spliced transcripts identified in (D) on differentially expressed transcripts present in single-cell myogenic clusters. Three independent RNA-sequencing datasets were analyzed for 0 and 48 hr cultures from Liu et al., and for Hnrnpa2b1 WT and KO.
Figure 6 with 3 supplements

RNA engagement scoring delineates functional timing of RNA-binding proteins (RBPs) during myogenesis.
(A) Genomic distribution of Hnrnpa2b1 enhanced UV crosslinking and immunoprecipitation (eCLIP) peaks in myoblasts and myotubes. (B) Native (non-denaturing) Hnrnpa2b1 RNA immunoprecipitation (RIP)-qRT-PCR of RNA targets identified by eCLIP. (C) Schematic for RBP-Target RNA engagement scoring. (D) RBP-Target RNA engagement scoring of Tardbp and Hnrnpa2b1 in myogenic subclusters (median ± 95% CI across all RBP-RNA engagement scores in each myogenic subcluster). (E) Differential gene expression analysis of myogenic subcluster 5. (F) Myog immunoreactivity in wild type (WT) and Hnrnpa2b1 knockout (KO) 48 hr differentiated myotubes. (G) Myog immunoreactivity signal intensity in differentiating WT and Hnrnpa2b1 KO myotubes (mean ± SD, two-tailed Student’s t-test p-value: ****<0.0001). See also Figure 6—figure supplement 1.
Figure 6—figure supplement 1
Related to Figure 6.
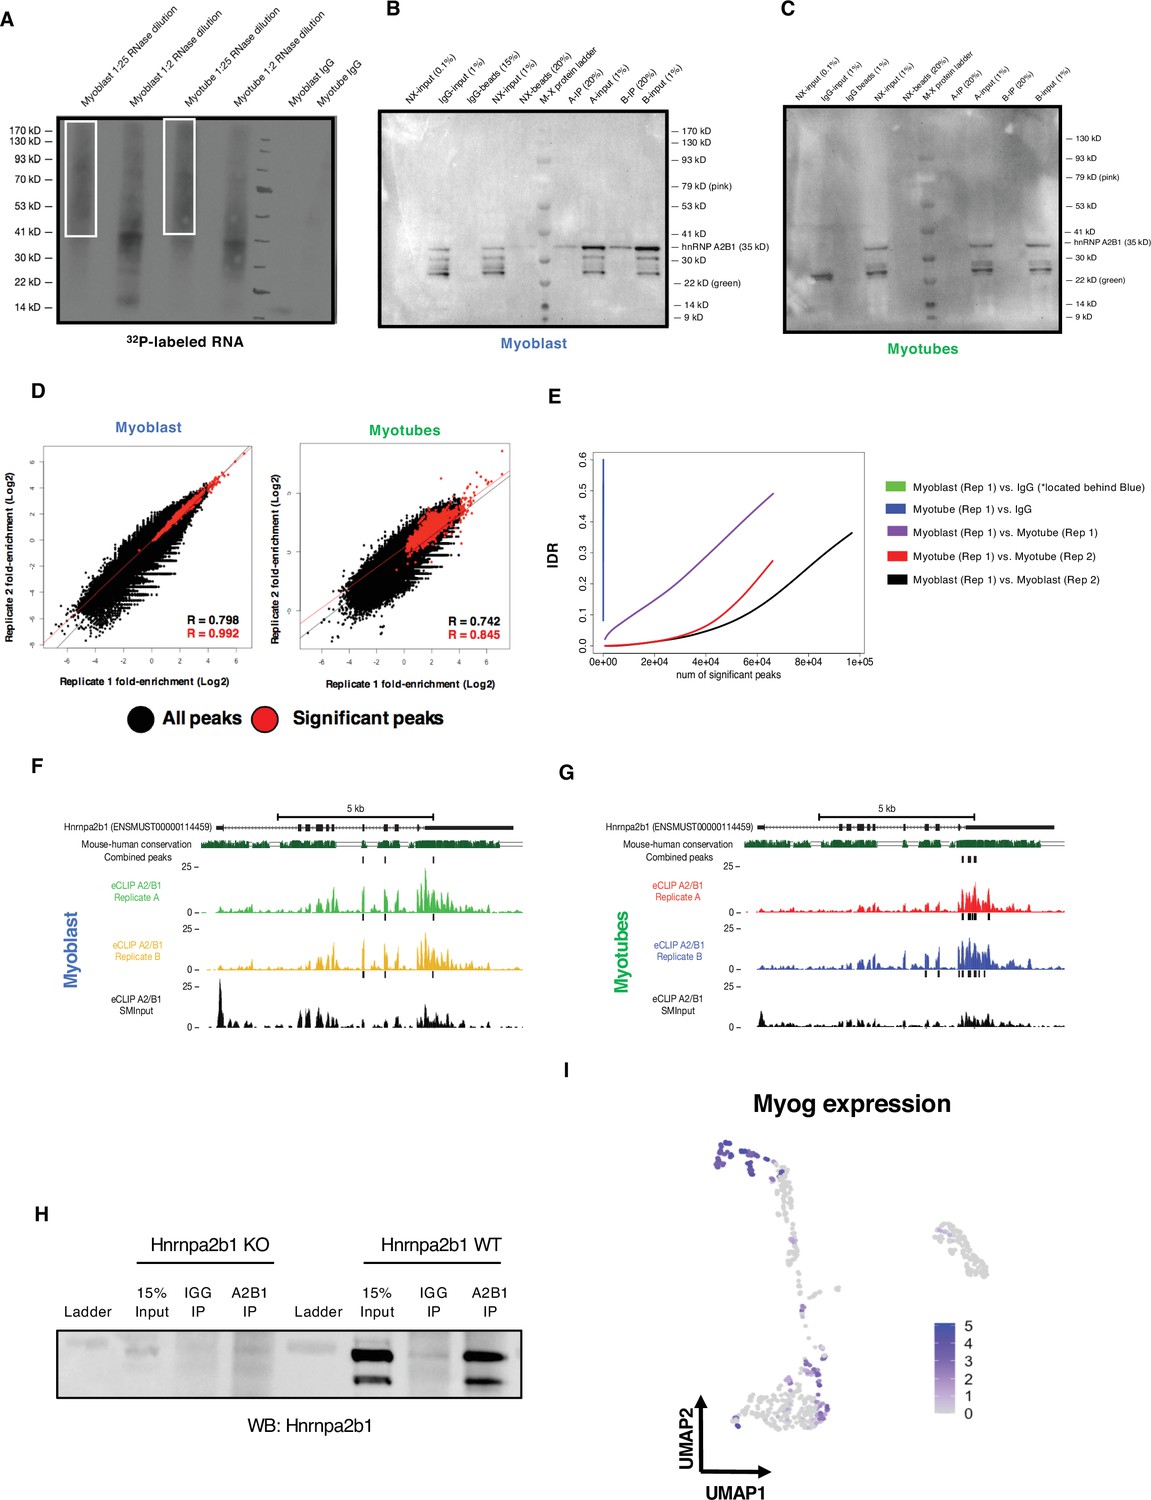
(A) Autoradiogram of 32P-labeled Hnrnpa2b1 RNA–RNA complexes fractionated by PAGE (B) and (C) immunoprecipitation of Hnrnpa2b1 RNA complexes used for enhanced UV crosslinking and immunoprecipitation (eCLIP) in C2C12 myoblasts or myotubes (n = 2 biologically independent samples). (D) Scatter plots indicate correlation between significant Hnrnpa2b1 RNA eCLIP peaks in biological replicates. Scatter plots represent fold enrichment for each region in Hnrnpa2b1 RNA eCLIP relative to paired size-matched input with significant peaks in red (p≤10–8 over size-matched input). (E) Irreproducible discovery rate (IDR) analysis comparing peak fold enrichment across indicated eCLIP datasets. (F) Integrative Genomics Viewer (IGV) tracing showing Hnrnpa2b1 RNA 3′UTR eCLIP peaks in Hnrnpa2b1 RNA transcript in myoblasts and (G) myotubes (H), where dark boxes denote significantly enriched binding sites above SMInput (p<10–8). Western blot for Hnrnpa2b1 used in RNA immunoprecipitation experiments in both Hnrnpa2b1 RNA wild type and knockout (KO) C2C12 cells. (I) Uniform manifold approximation and projection (UMAP) displaying Myog expression across myogenic single cells.
-
Figure 6—figure supplement 1—source data 1
Related to Figure 6—figure supplement 1A-C.
(A) Raw and annotated blot of autoradiogram of 32P-labeled Hnrnpa2b1 RNA–RNA complexes fractionated by PAGE (B) and (C) immunoprecipitation of Hnrnpa2b1 RNA complexes used for enhanced UV crosslinking and immunoprecipitation (eCLIP) in C2C12 myoblasts or myotubes (n = 2 biologically independent samples).
- https://cdn.elifesciences.org/articles/75844/elife-75844-fig6-figsupp1-data1-v2.zip
Figure 6—figure supplement 2
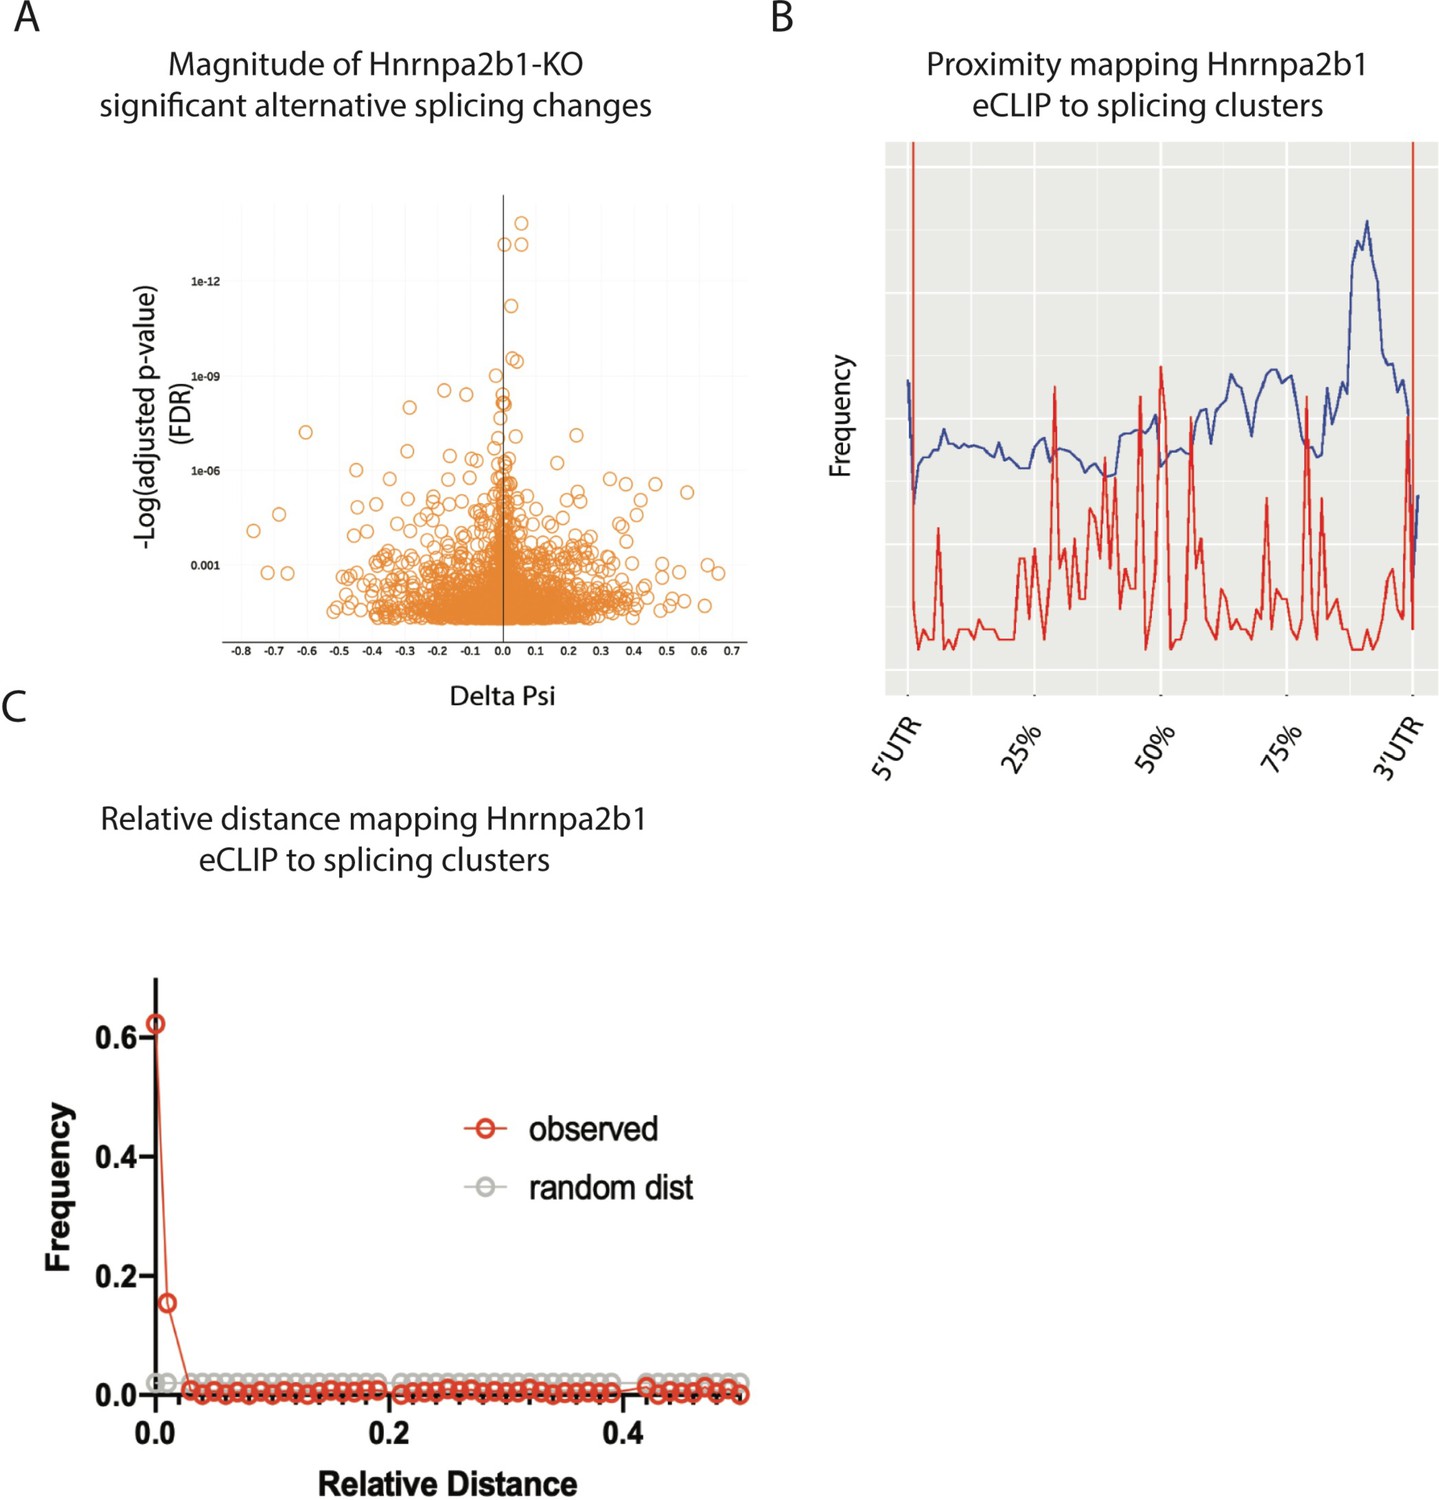
Related to Figure 6 – magnitude and spatial location for significant Hnrnap2b1 knockout (KO) splicing alterations.
(A) Volcano plot showing delta percent spliced in (dPSI) versus p-value (false discovery rate [FDR]) for significant splicing changes detected in Hnrnpa2b1 KO cells. (B) Global proximity mapping of Hnrnpa2b1 enhanced UV crosslinking and immunoprecipitation (eCLIP) sites and significantly alternatively spliced clusters. (C) Relative distance mapping for eCLIP sites to alternative splice clusters using bedtools reldist.
Figure 6—figure supplement 3
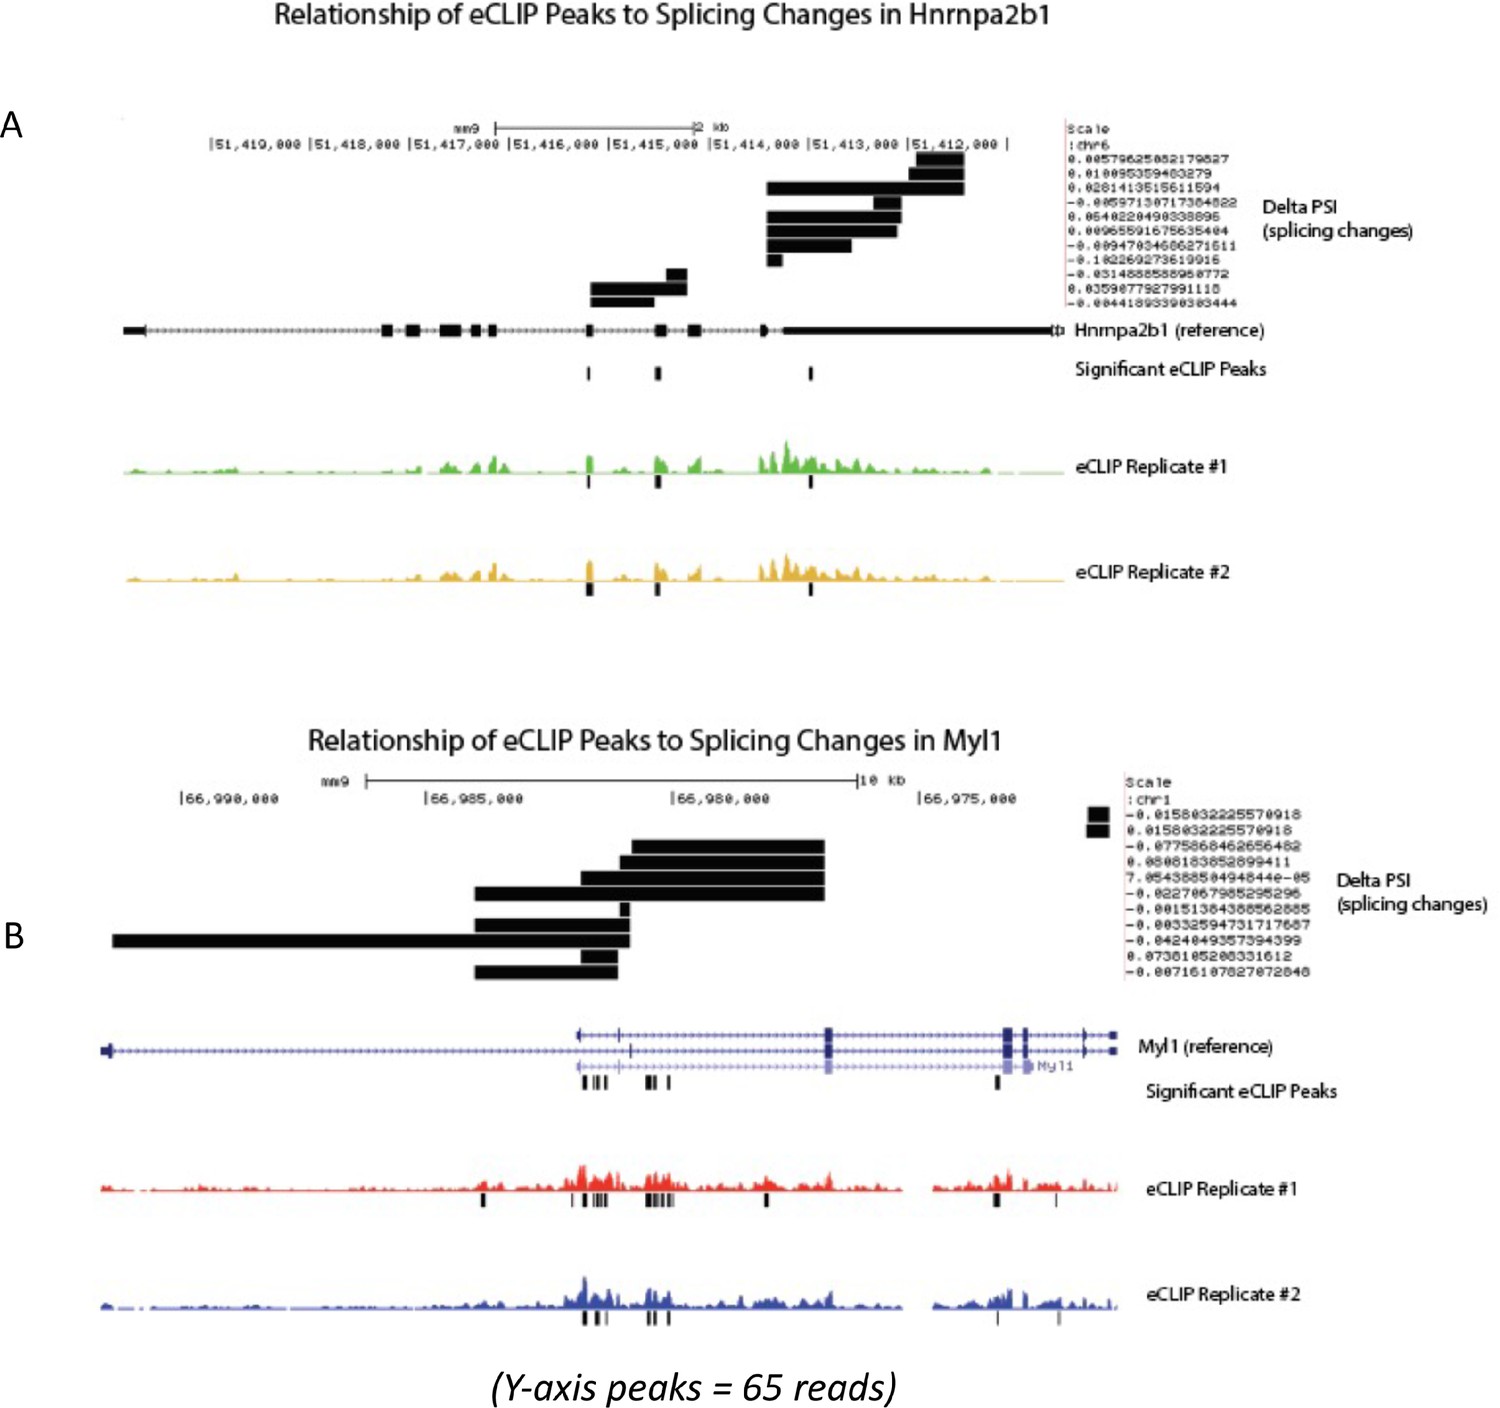
Related to Figure 6 – mapped relationship of enhanced UV crosslinking and immunoprecipitation (eCLIP) peaks to splicing change magnitude in significantly differentially spliced transcripts.
(A) UCSC gene track mapping delta percent sliced in (dPSI) (splicing changes) in reference to annotated Hnrnpa2b1 exons, introns, and Hnrnpa2b1 eCLIP-binding sites. (B) UCSC gene track showing dPSI (splicing changes) in reference to annotated Myl1 exons, introns, and Hnrnpa2b1 eCLIP-binding sites.
Figure 7
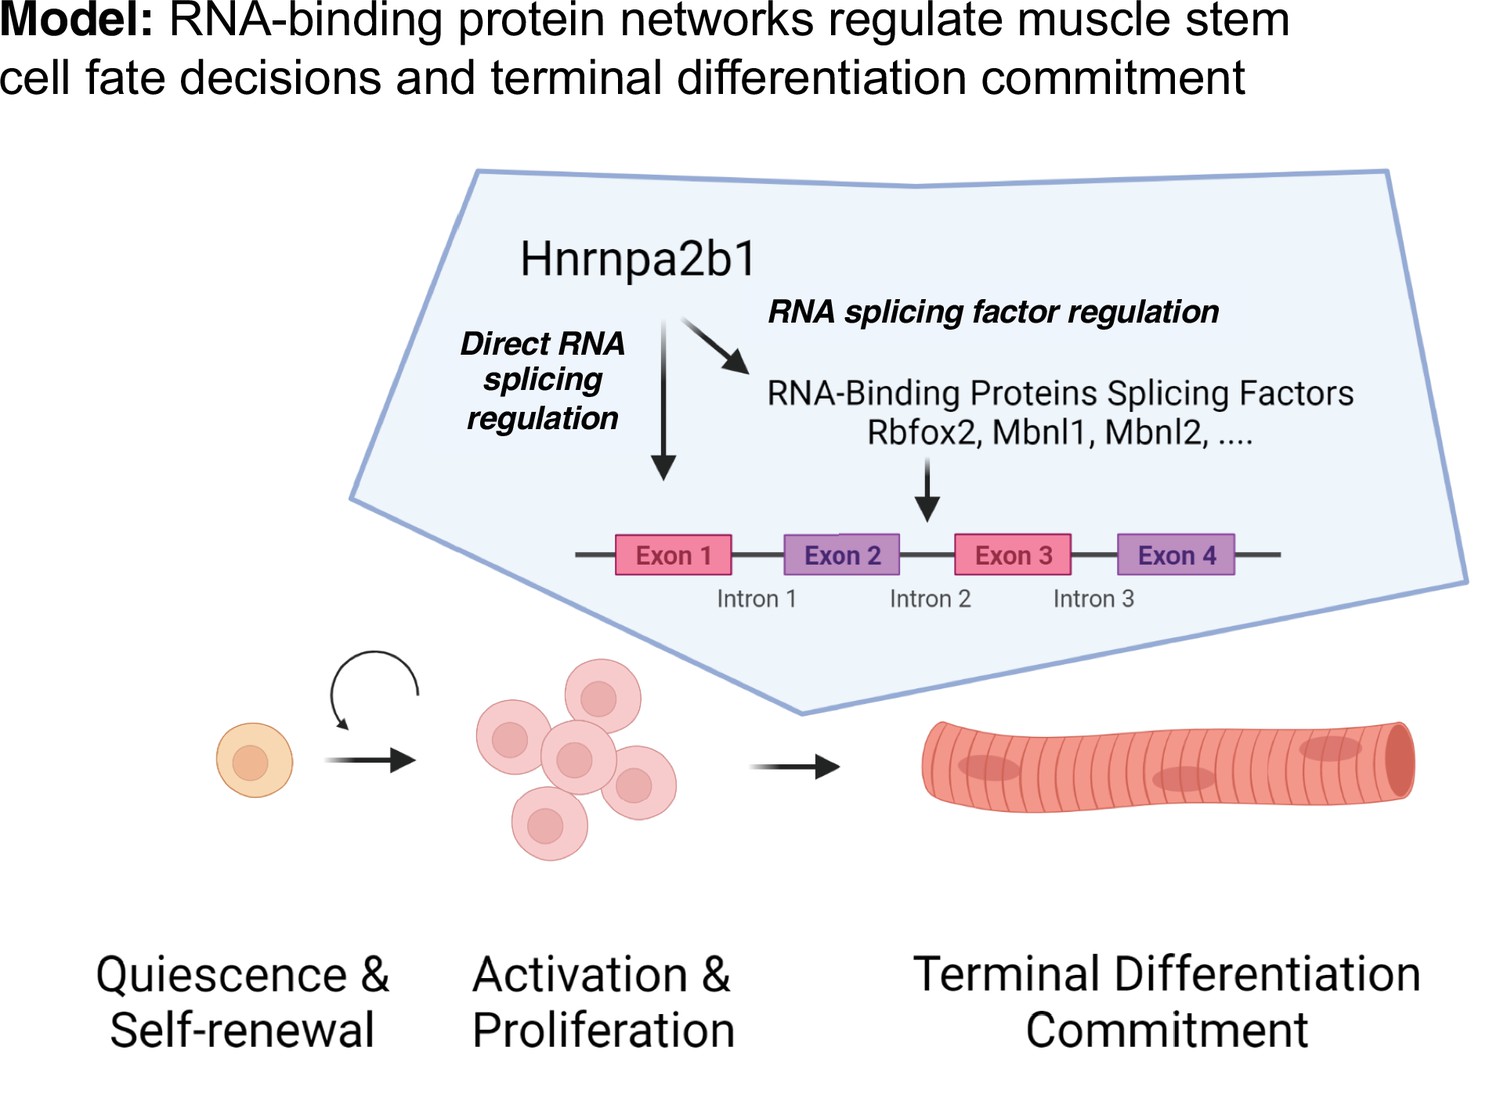
Discrete RNA-binding protein functional timing and expression as a dynamic post-transcriptional regulatory mechanism for directing myogenic fate decisions.
Author response image 1

Impact of Hnrnpa2b1 KO on mRNA splicing of myogenic cluster-specific differentially expressed mRNA transcripts.
(A) and (B) Differential gene expression analysis was performed on individual single cell myogenic clusters to identify significantly differentially expressed transcripts. The presence of splicing alterations identified in Hnrnpa2b1 KO cells were assessed in the significantly differentially expressed transcripts. Presented is the percentage of splicing alteration in significantly differentially expressed transcripts identified per myogenic cluster.
Author response image 2
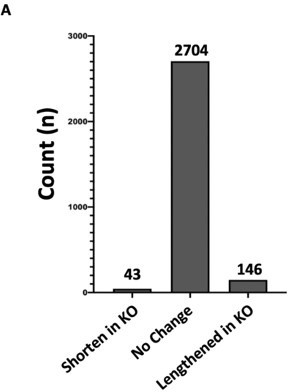
Hnrnpa2b1 KO has minimal effect on alternative polyadenylation site selection.
(A) Analysis of alternative polyadenylation (APA) from Hnrnpa2b1 wild type and KO RNA-seq data using QAPA (Quantification of Alternative Polyadenylation, HA et al., 2018) reveals loss of Hnrnpa2b1 results in no charge in the 3’UTR site selection for the majority of mRNA transcripts.
Author response image 3
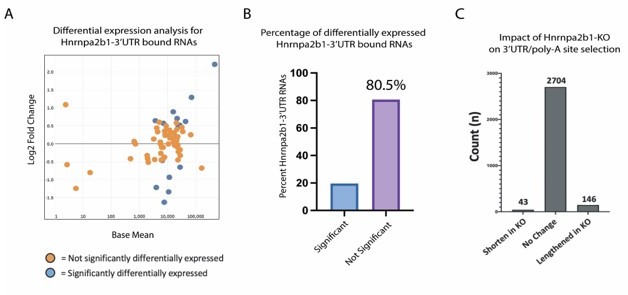
Hnrnpa2b1-KO shows limited impact on gene expression or poly-A site selection for 3’UTR-Hnrnpa2b1 bound transcripts.
(A) MA plot of Hnrnpa2b1-3’UTR bound RNA expression in Hnrnpa2b1-KO cells (B) Distribution of significantly differentially expressed transcripts in Hnrnpa2b1-KO cells. (C) QAPA analysis of Hnrnpa2b1-KO showing impact on 3’UTR and poly-A site selection.
Author response image 4
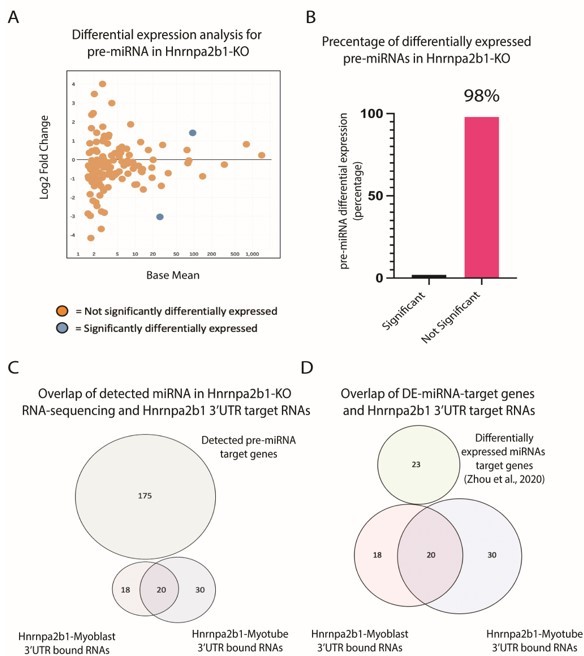
Impact of Hnrnpa2b1-KO on pre-miRNA expression and 3’UTR interaction.
(A) MA plot for pre-miRNA expressed in Hnrnap2b1-KO cells. (B) Percentage of significantly differentially expressed pre-miRNA in Hnrnap2b1-KO cells. (C) Venn diagram showing overlap between Hnrnpa2b1-3’UTR target RNAs and target genes for pre-miRNAs detected in Hnrnpa2b1-WT/KO RNA-sequencing. (D) Venn diagram showing overlap between Hnrnpa2b1-3’UTR target RNAs and differentially expressed miRNAs target genes (Zhou et al., 2020).
Author response image 5
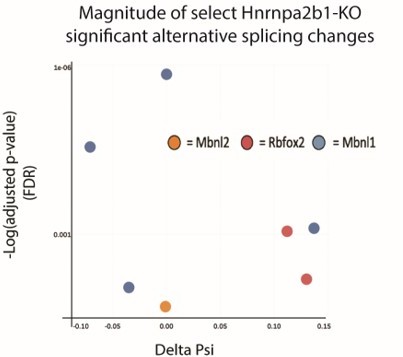
Magnitude and spatial location for significant Hnrnap2b1-KO splicing alterations.
Δ PSI and p-value for significant splicing changes detected in MBNL1/2 and Rbfox2.
Additional files
-
Transparent reporting form
- https://cdn.elifesciences.org/articles/75844/elife-75844-transrepform1-v2.pdf
-
Supplementary file 1
Primers used for RIP-qPCR.
- https://cdn.elifesciences.org/articles/75844/elife-75844-supp1-v2.xlsx
-
Supplementary file 2
Hnrnpa2b1 eCLIP mapping in Myoblasts and Myotubes.
- https://cdn.elifesciences.org/articles/75844/elife-75844-supp2-v2.xlsx
-
Supplementary file 3
Hnrnpa2b1 KO differential gene expression.
- https://cdn.elifesciences.org/articles/75844/elife-75844-supp3-v2.xlsx
-
Supplementary file 4
Hnrnpa2b1 KO cluster expression.
- https://cdn.elifesciences.org/articles/75844/elife-75844-supp4-v2.xlsx
-
Supplementary file 5
- https://cdn.elifesciences.org/articles/75844/elife-75844-supp5-v2.xlsx
-
Supplementary file 6
RNA-binding proteins expressed in myogenic clusters 0 - 6.
- https://cdn.elifesciences.org/articles/75844/elife-75844-supp6-v2.xlsx
Download links
A two-part list of links to download the article, or parts of the article, in various formats.
Downloads (link to download the article as PDF)
Open citations (links to open the citations from this article in various online reference manager services)
Cite this article (links to download the citations from this article in formats compatible with various reference manager tools)
RNA-binding proteins direct myogenic cell fate decisions
eLife 11:e75844.
https://doi.org/10.7554/eLife.75844


