Septin7 is indispensable for proper skeletal muscle architecture and function
- Department of Physiology, Faculty of Medicine, University of Debrecen, Hungary
- Doctoral School of Molecular Medicine, University of Debrecen, Hungary
- Department of Anatomy, Histology and Embryology, Faculty of Medicine, University of Debrecen, Hungary
- Division of Nuclear Medicine and Translational Imaging, Department of Medical Imaging, Faculty of Medicine, University of Debrecen, Hungary
Figures
Figure 1 with 1 supplement
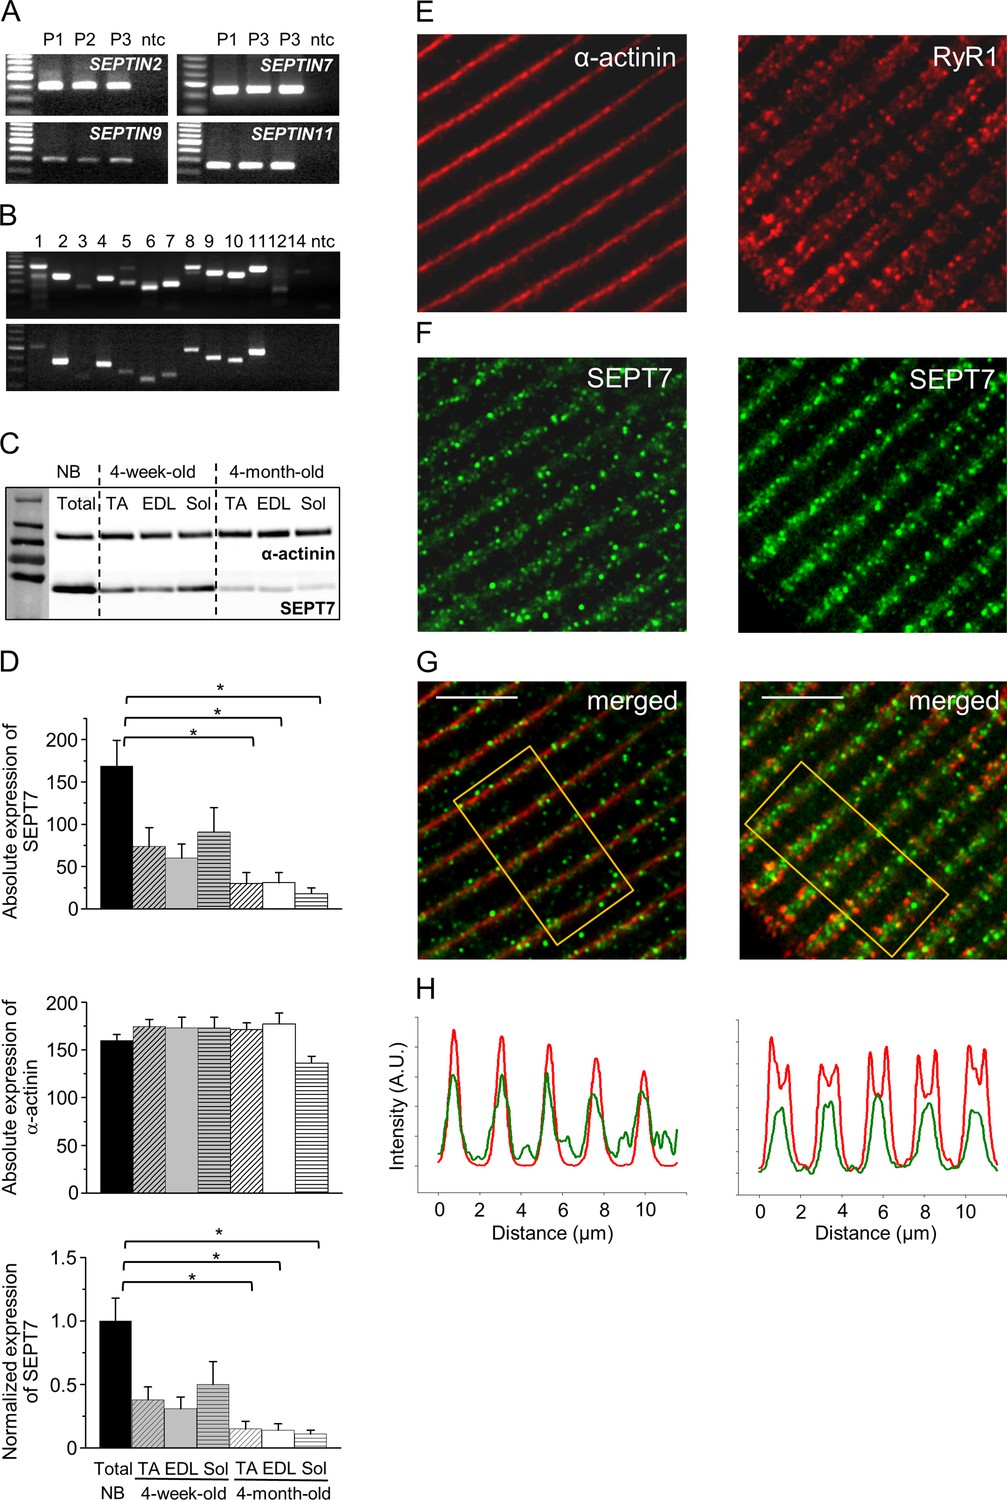
Septins are an integral part of the skeletal muscle cytoskeleton.
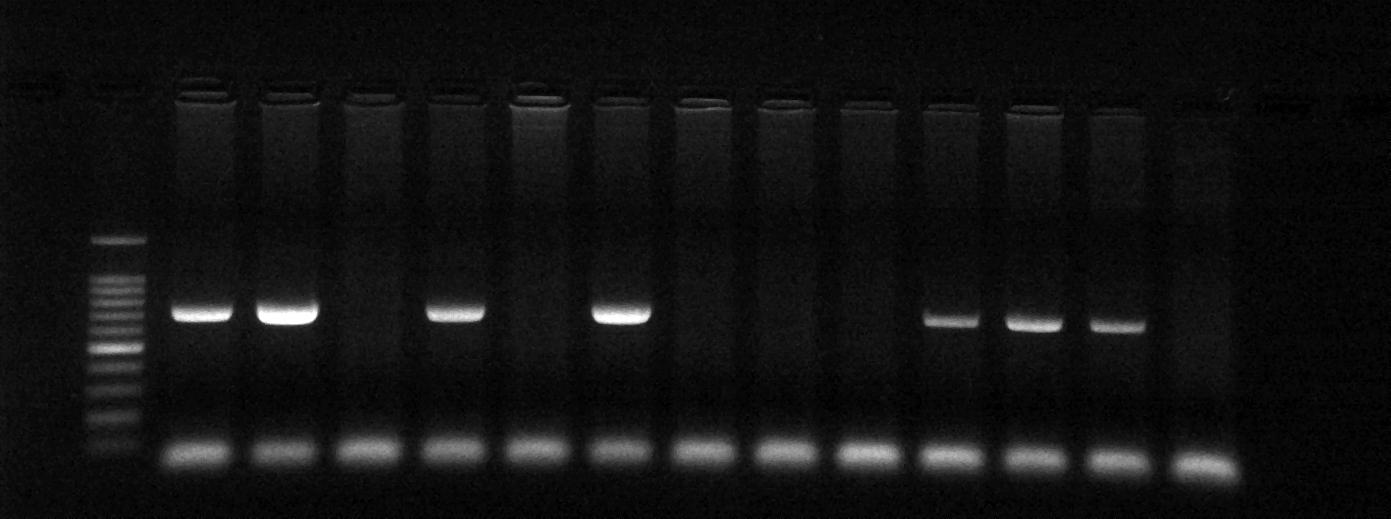
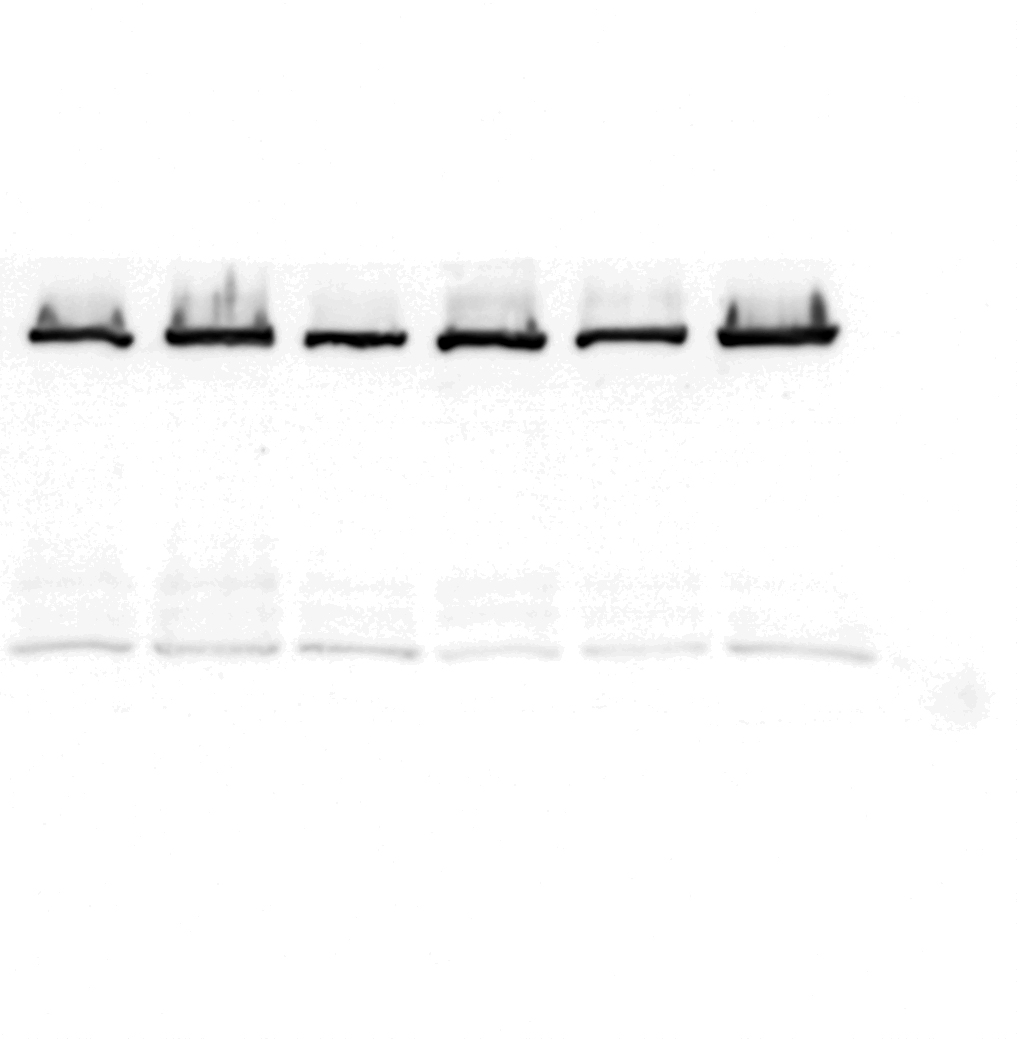
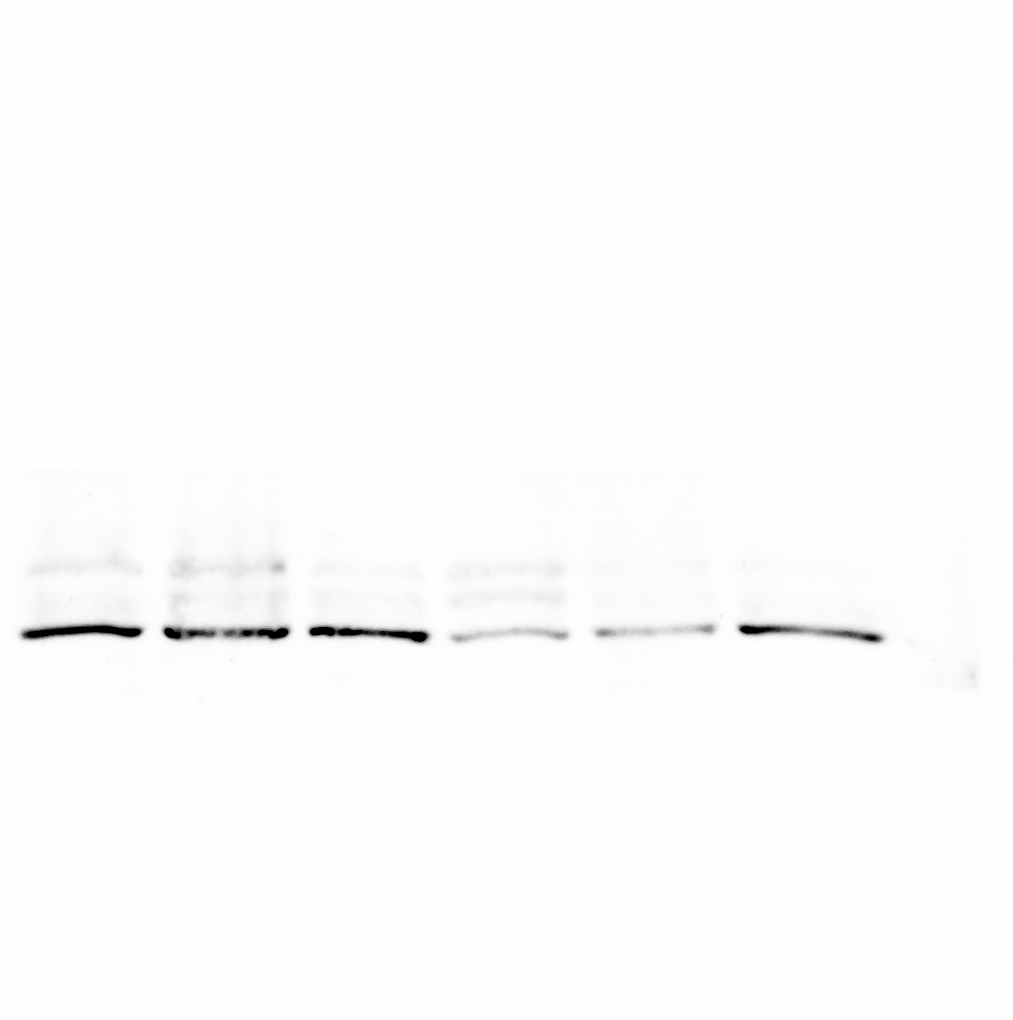
(A) Agarose gel images showing the expression of septin isoforms at mRNA level in human skeletal muscle (m. quadriceps femoris from amputated limbs). Representative members from each homology group are shown. Independent samples from three patients were examined. Here and in all subsequent figures DNA Ladder is from Promega (G2101). First and last lines in the ladders correspond to 200 and 800 bp, respectively. (B) Expression of all septin isoforms at mRNA level in neonatal (upper panel) and adult (lower panel) mouse skeletal muscle. Non-template control (ntc) samples contain nuclease-free water instead of cDNA. First and last lines in the ladders correspond to 200 and 700 bp, respectively. (C) Differential expression of Septin7 (SEPT7, 50 kDa) at protein level during development in different types of skeletal muscle in mice, and α-actinin (110 kDa) was used as a normalizing control. Bar graphs represent the absolute expression of Septin7, α-actinin, and the normalized Septin7 expression in the different samples. Total skeletal muscle lysate of newborns (NB), TA: m. tibialis anterior; EDL: m. extensor digitorum longus; and Sol: m. soleus. Here and all subsequent figure Page Ruler Plus Prestained Protein Ladder from Thermo Fisher (26620) was used. First and last lines in the ladder correspond to 55 and 250 kDa, respectively. (D) Pooled data of absolute expression of Septin7, absolute expression of actin, and normalized Septin7 expression during development. Representative data of three mice/age group. Data represent mean ± standard error of the mean (SEM), *p<0.05 from ANOVA. Intracellular localization of Septin7 (F) in adult skeletal muscle relative to α-actinin, and RyR1 (E) using immunofluorescence staining, and the merged images for the aforementioned proteins (G). Scale bar is 5 µm. (H) Fluorescence intensity changes of Septin7 (green) and α-actinin or RyR1 (red) along the fiber calculated from the rectangular area in panel (G). See also Figure 1—figure supplement 1.
-
Figure 1—source data 1
Agarose gel images showing the expression of Septin1-4 isoforms at mRNA level in human skeletal muscle (m. quadriceps femoris from amputated limbs).
Representative members from each homology group are shown. Independent samples from three patients were examined. Specific parts of the original gel images representing SEPTIN2, SEPTIN7, SEPTIN9, and SEPTIN11 mRNA expression are presented in Figure 1A.
- https://cdn.elifesciences.org/articles/75863/elife-75863-fig1-data1-v1.tif
-
Figure 1—source data 2
Agarose gel showing the expression of Septin5-8 isoforms at mRNA level in human skeletal muscle.
- https://cdn.elifesciences.org/articles/75863/elife-75863-fig1-data2-v1.tif
-
Figure 1—source data 3
Agarose gel showing the expression of Septin9-12 isoforms at mRNA level in human skeletal muscle.
- https://cdn.elifesciences.org/articles/75863/elife-75863-fig1-data3-v1.tif
-
Figure 1—source data 4
Expression of all septin isoforms at mRNA level in neonatal mouse skeletal muscle.
Non-template control (ntc) samples contain nuclease-free water instead of cDNA. Relevant parts of the original gel images are presented in Figure 1B.
- https://cdn.elifesciences.org/articles/75863/elife-75863-fig1-data4-v1.tif
-
Figure 1—source data 5
Expression of all septin isoforms at mRNA level in adult mouse skeletal muscle.
- https://cdn.elifesciences.org/articles/75863/elife-75863-fig1-data5-v1.tif
-
Figure 1—source data 6
Differential expression of Septin7 (50 kDa) at protein level during development in different types of skeletal muscle in mice represented without protein molecular weight.
α-Actinin (110 kDa) was used as a normalizing control. Total skeletal muscle lysate of newborns (NB), TA: m. tibialis anterior; EDL: m. extensor digitorum longus; and Sol: m. soleus. Relevant parts of the original gel images are presented in Figure 1C.
- https://cdn.elifesciences.org/articles/75863/elife-75863-fig1-data6-v1.tif
-
Figure 1—source data 7
Differential expression of Septin7 (50kDa) at protein level during development in different types of skeletal muscle in mice represented with protein molecular weight.
- https://cdn.elifesciences.org/articles/75863/elife-75863-fig1-data7-v1.jpg
Figure 1—figure supplement 1
Expression of different septin isoforms at mRNA and protein level in C2C12 cell culture, mouse and human skeletal muscle, highlighted genetic modification of Septin7 expression.
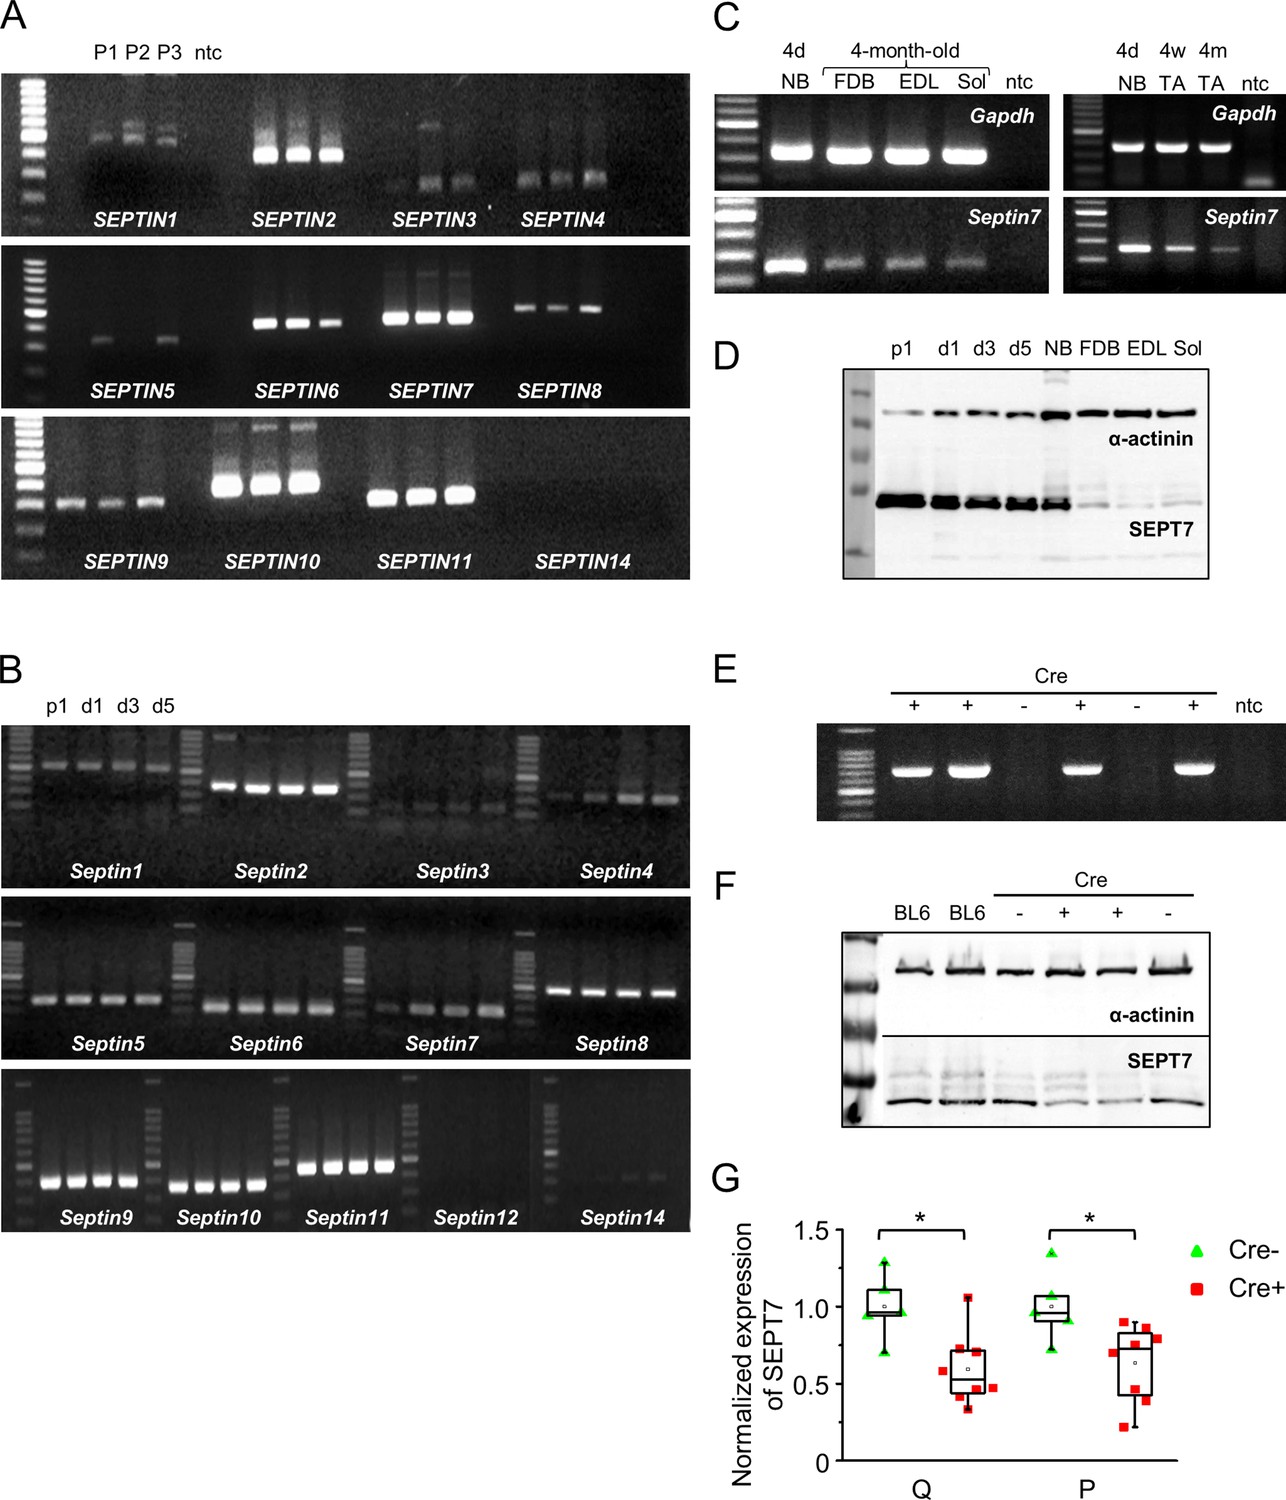
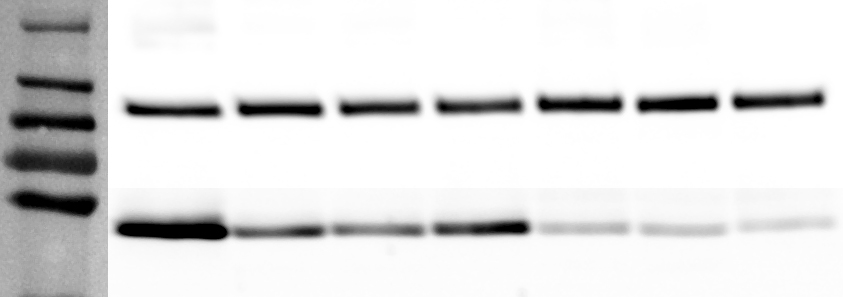
(A) Expression of different septin isoforms at mRNA level in human skeletal muscle (m. quadriceps femoris). Related to Figure 1 and Figure 2. Independent samples from three patients (P1–P3) were examined. Extended experiment of Figure 1A. First and last lines in the ladders correspond to 200 and 1000 bp, respectively. (B) mRNA expression of all septin isoforms in differentiating C2C12 myoblast cells. Proliferating cells (p1) and myotubes at different stages of development (d1, d3, and d5) are demonstrated. First and last lines in the ladders correspond to 100 and 900, 100 and 1500, and 200 and 1500 bp, from top to bottom panels, respectively. (C) Age-related (age of 4 days [4d], 4 weeks [4w], 4 months [4m]) mRNA expression of Septin7 in different skeletal muscle types of mouse. Gapdh was used as loading control; NB: newborn muscle; TA: m. tibialis anterior; FDB: m. flexor digitorum brevis; EDL: m. extensor digitorum longus; and Sol: m. soleus were examined. First and last lines in the ladders correspond to 200 and 700, 100 and 1000, 200 and 600, and 200 and 600 bp, from left to right and top to bottom panels, respectively.(D) Ontogenesis-dependent Septin7 protein expression in differentiating C2C12 cells, newborn and different muscle types of adult (4-month-old) mice; α-actinin was used as control. First and last lines in the ladder correspond to 35 and 130 kDa, respectively. (E) Screening for the presence of the HSA-MCM transgene from genomic DNA by PCR. First and last lines in the ladder correspond to 300 and 1500 bp, respectively. (F) Altered Septin7 expression in Cre+ mice following a tamoxifen diet compared to Cre- and control BL6 mice. The m. quadriceps femoris (Q) and m. pectoralis (P) were analyzed; α-actinin was used as a normalizing control. First and last lines in the ladder correspond to 55 and 130 kDa, respectively.(G) Pooled data of the Septin7 protein expression in different muscle types of tamoxifen-fed mice. Eight Cre+ and five Cre- were examined from three independent litters. Data represent mean ± standard error of the mean, *p<0.05 from t-test.
-
Figure 1—figure supplement 1—source data 1
Expression of SEPTIN1-4 isoforms at mRNA level in human skeletal muscle (m. quadriceps femoris).
Independent samples from three patients (P1–P3) were examined. Relevant parts of the original gel images are presented in Figure 1—figure supplement 1A.
- https://cdn.elifesciences.org/articles/75863/elife-75863-fig1-figsupp1-data1-v1.tif
-
Figure 1—figure supplement 1—source data 2
Expression of SEPTIN5-8 isoforms at mRNA level in human skeletal muscle.
- https://cdn.elifesciences.org/articles/75863/elife-75863-fig1-figsupp1-data2-v1.tif
-
Figure 1—figure supplement 1—source data 3
Expression of SEPTIN9,10,11,14 isoforms at mRNA level in human skeletal muscle.
- https://cdn.elifesciences.org/articles/75863/elife-75863-fig1-figsupp1-data3-v1.tif
-
Figure 1—figure supplement 1—source data 4
mRNA expression of Septin1-8 isoforms in C2C12 cultured cells.
Proliferating cells (p1) and myotubes at different stages of development (d1, d3, and d5) are demonstrated. Relevant parts of the original gel images are presented in Figure 1—figure supplement 1B.
- https://cdn.elifesciences.org/articles/75863/elife-75863-fig1-figsupp1-data4-v1.tif
-
Figure 1—figure supplement 1—source data 5
mRNA expression of Septin9-12 and Septin14 isoforms in C2C12 cultured cells.
- https://cdn.elifesciences.org/articles/75863/elife-75863-fig1-figsupp1-data5-v1.tif
-
Figure 1—figure supplement 1—source data 6
Age-related (age of 4 days [4d], 4 weeks [4w], 4 months [4m]) mRNA expression of Gapdh in newborn and in different skeletal muscle types (m. flexor digitorum brevis, m. extensor digitorum longus, and m. soleus) of adultmouse.
Gapdh was used as loading control; NB: newborn muscle; TA: m. tibialis anterior; FDB: m. flexor digitorum brevis; EDL: m. extensor digitorum longus; and Sol: m. soleus were examined. Relevant parts of the original gel images are presented in Figure 1—figure supplement 1C.
- https://cdn.elifesciences.org/articles/75863/elife-75863-fig1-figsupp1-data6-v1.tif
-
Figure 1—figure supplement 1—source data 7
Age-related mRNA expression of Gapdh in newborn and in m. tibialis anterior skeletal muscle type of adult mouse.
- https://cdn.elifesciences.org/articles/75863/elife-75863-fig1-figsupp1-data7-v1.jpg
-
Figure 1—figure supplement 1—source data 8
Age-related mRNA expression of Septin7 in newborn and in different skeletal muscle types (newborn, m. flexor digitorum brevis, m. externsor digitorum longus, and m. soleus) of adult mouse.
- https://cdn.elifesciences.org/articles/75863/elife-75863-fig1-figsupp1-data8-v1.jpg
-
Figure 1—figure supplement 1—source data 9
Age-related mRNA expression of Septin7 in newborn and in m. tibialis anterior skeletal muscle type of adult mouse.
- https://cdn.elifesciences.org/articles/75863/elife-75863-fig1-figsupp1-data9-v1.jpg
-
Figure 1—figure supplement 1—source data 10
Ontogenesis-dependent Septin7 (SEPT7) protein expression in proliferating and differentiated C2C12 cells, newborn and different muscle types of adult (4 months old) mice; α-actinin was used as control.
Relevant parts of the original gel images are presented in Figure 1—figure supplement 1D.
- https://cdn.elifesciences.org/articles/75863/elife-75863-fig1-figsupp1-data10-v1.tif
-
Figure 1—figure supplement 1—source data 11
Screening for the presence of the HSA-MCM transgene from genomic DNA by PCR in Cre+ and Cre- mice.
Relevant parts of the original gel images are presented in Figure 1—figure supplement 1E.
- https://cdn.elifesciences.org/articles/75863/elife-75863-fig1-figsupp1-data11-v1.jpg
-
Figure 1—figure supplement 1—source data 12
α-Actinin protein expression in Cre+ mice following a tamoxifen diet compared to Cre- and control BL6 mice.
α-Actinin was used as a normalizing control. Relevant parts of the original gel images are presented in Figure 1—figure supplement 1F.
- https://cdn.elifesciences.org/articles/75863/elife-75863-fig1-figsupp1-data12-v1.jpg
-
Figure 1—figure supplement 1—source data 13
Altered Septin7 protein expression in Cre+ mice following a tamoxifen diet compared to Cre- and control Bl6 mice.
- https://cdn.elifesciences.org/articles/75863/elife-75863-fig1-figsupp1-data13-v1.jpg
Figure 2 with 3 supplements
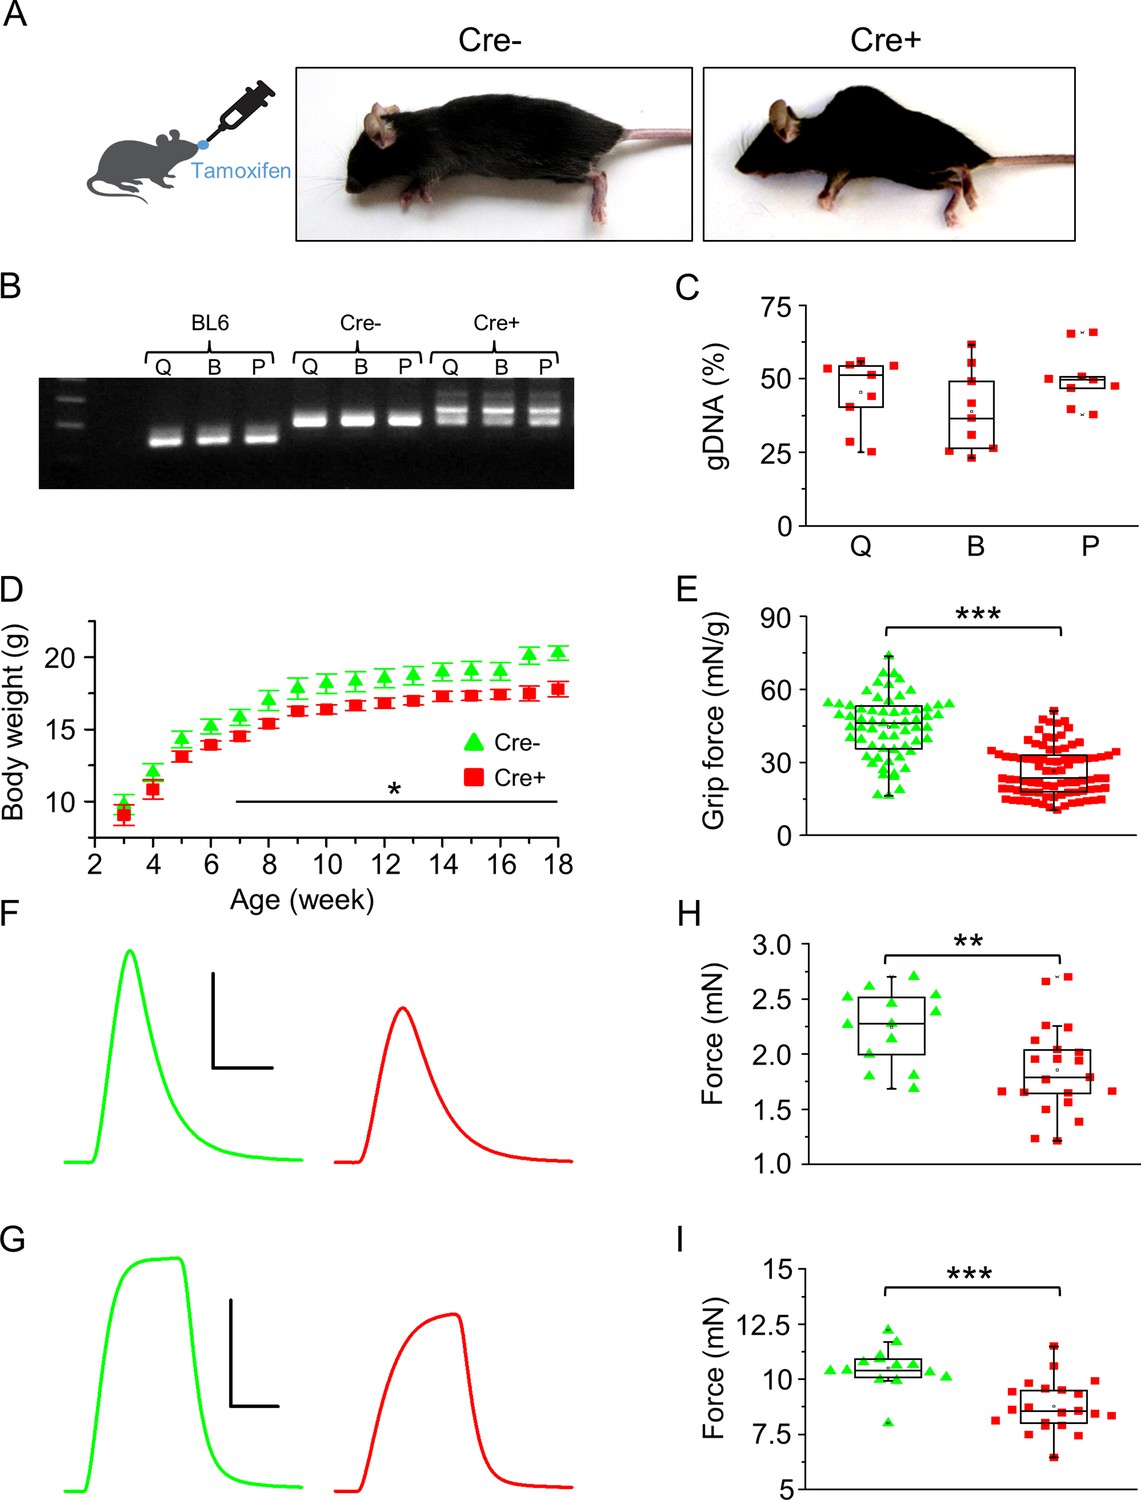
Skeletal muscle-specific knockdown of Septin7 resulted in a severe phenotype.
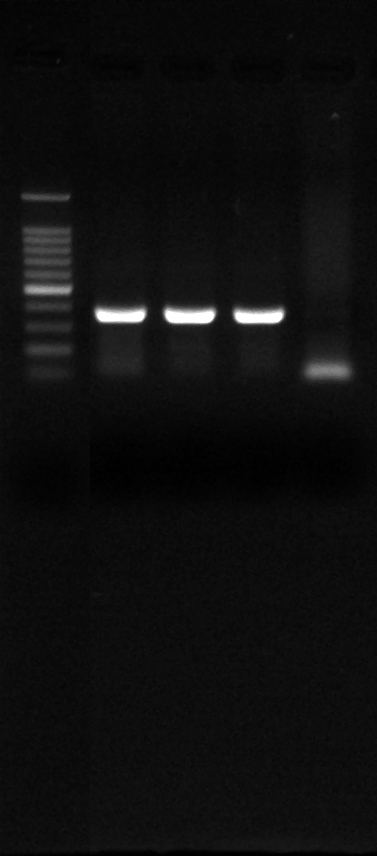
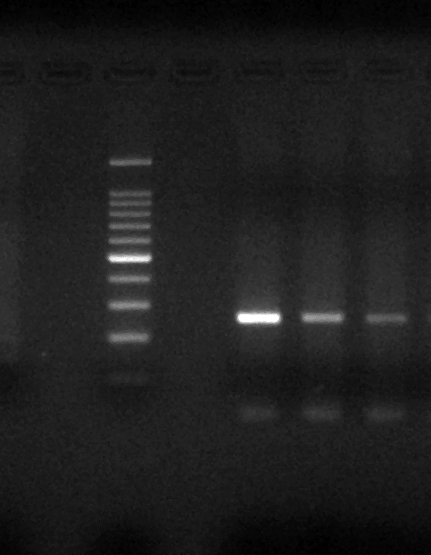
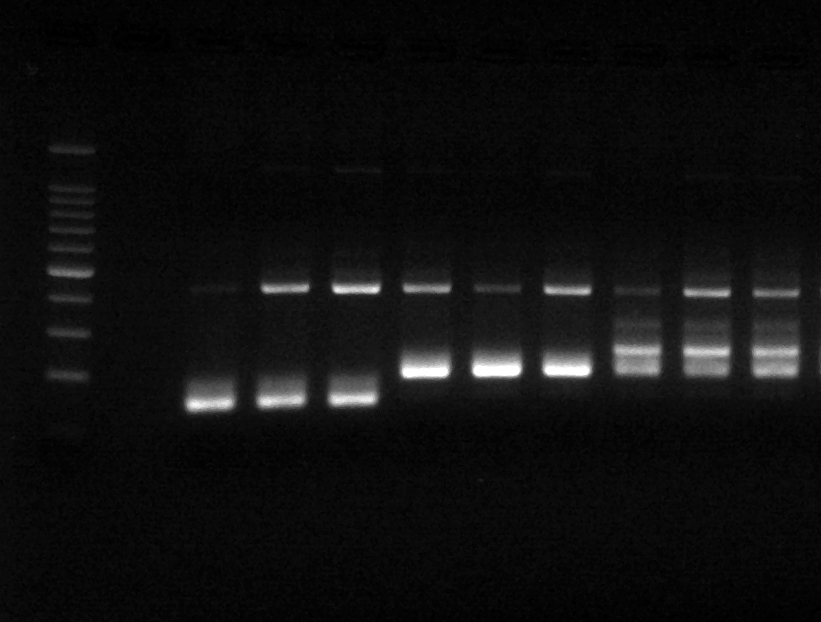
(A) Images of tamoxifen-fed Cre- and Cre+ mice (both Septin7flox/flox) at the age of 4 months (see Figure 2—figure supplement 1). (B) Three-primer PCR for detecting the partial deletion of the Septin7 gene in different skeletal muscle types of Cre+ mice (Q: m. quadriceps femoris; B: m. biceps femoris; P: m. pectoralis) and the lack of deletion in samples prepared from BL6 control and Cre- mice. In samples originated from Cre- animals, the floxed exon 4, while in wild-type tamoxifen-fed mice the unmodified exon 4 is demonstrated. First and last lines in the ladder correspond to 200 and 300 bp, respectively. (C) Pooled data of the percentage of exon 4 deletion in different muscle types of Cre+ mice. 14 littermates (nine Cre+ and five Cre-) were examined from three litters. Here and in all subsequent figures, the rectangles in the box plots present the median and the 25 and 75 percentile values, while the error bars point to 1 and 99%. (D) Changes of body weight in Cre- (green triangle, n = 11) and floxed Cre+ (red square, n = 14) mice. Black solid line shows where the difference is statistically different (p<0.05 from t-test). Error bars show SEM. (E) Grip force normalized to body weight in Cre- (n = 4) and Cre+ mice (n = 7). Representative twitch (F) and tetanic force (G) transients in m. extensor digitorum longus (EDL). Peak twitch (H) and tetanic force (I) in EDL from Cre- (n = 7) and Cre+ (n = 11) mice. Calibration in panel (F): 1 mN and 50 ms; (G): 5 mN and 100 ms. **p<0.01, ***p<0.001 (from t-test). See also Figure 2—figure supplement 2. Main contractile proteins (actin and myosin) and L-type calcium channel distribution within single m. flexor digitorum brevis (FDB) myofibers isolated from Cre- and Cre+ animals were also investigated (see Figure 2—figure supplement 3).
-
Figure 2—source data 1
Three-primer PCR was used to detect the partial deletion of the Septin7 gene in different skeletal muscle types of Cre+ mice (Q: m. quadriceps femoris; B: m. biceps femoris; P: m. pectoralis) and the lack of deletion in samples prepared from BL6 control and Cre- mice.
In samples originated from Cre- animals, the floxed exon 4, while in wild-type tamoxifen-fed mice the unmodified exon 4 is demonstrated. Relevant parts of the original gel images are presented in Figure 2B.
- https://cdn.elifesciences.org/articles/75863/elife-75863-fig2-data1-v1.jpg
Figure 2—figure supplement 1
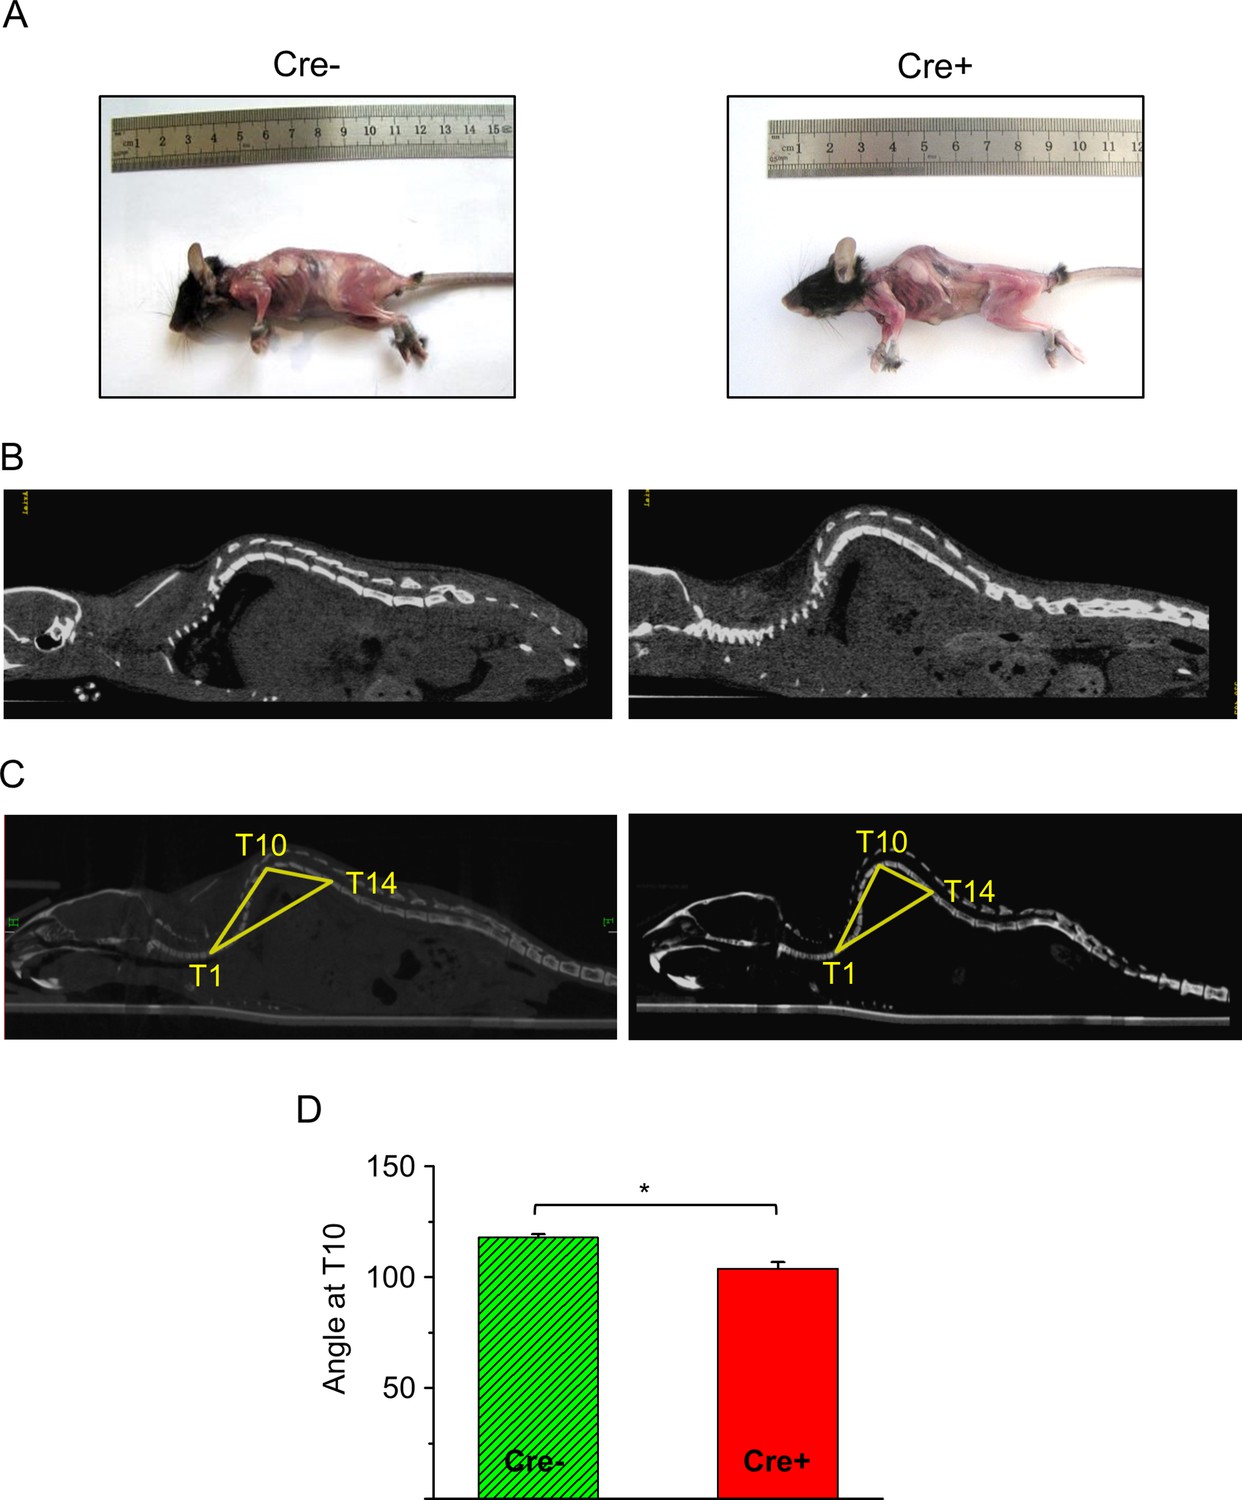
Effects of Septin7 knockdown on the phenotype of Cre+ mice.
(A) Images of a tamoxifen-fed control (Cre-) and Cre+ mice. (B) Coronal CT image of a Cre-and Cre+ mouse. (C) Reconstruction of the whole backbone from CT images. A triangle was drawn to the thoracic 1st (T1), 10th (T10), and 14th (T14) vertebra, and the angle at T10 was determined. (D) Average of angles at T10 from three Cre- and three Cre+ mice (*p<0.05 from t-test). Error bars show SEM.
Figure 2—figure supplement 2
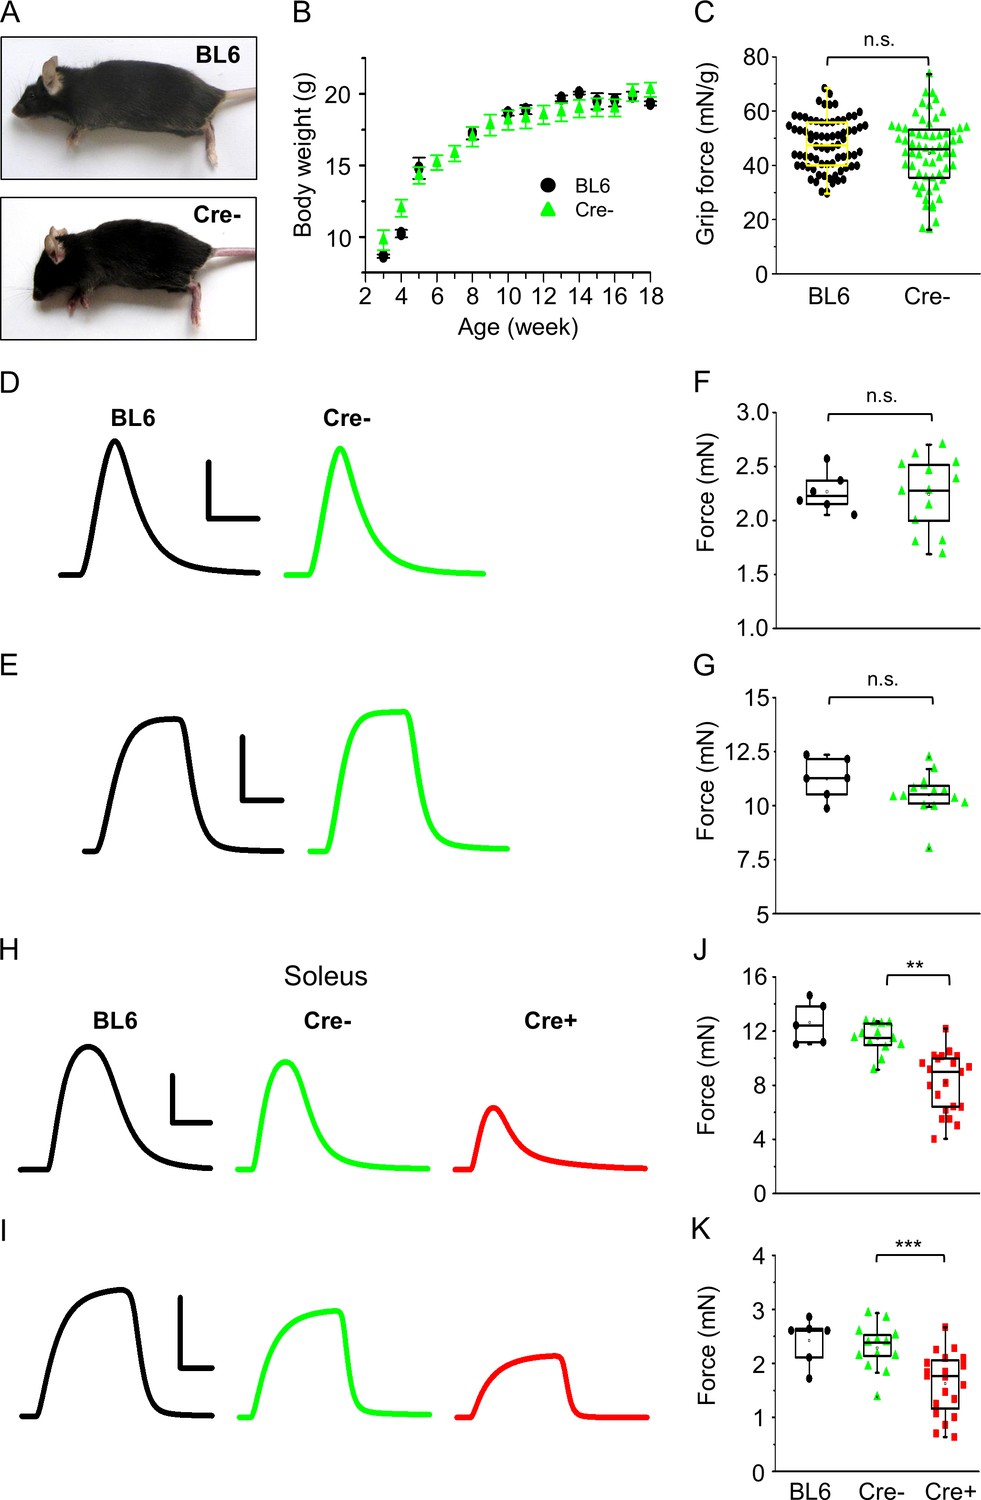
Effects of tamoxifen feeding on the phenotype of BL6 and Cre- mice.
(A) Images of tamoxifen-fed BL6 and Cre- mice. (B) Body weight increase in BL6 (black circle, n = 3) and Cre- (green triangle, n = 11) mice. (C) Grip force normalized to body weight in BL6 (n = 3) and Cre- (n = 4) mice. Representative twitch (D) and tetanic force (E) transients in m. extensor digitorum longus (EDL). Peak twitch (F) and tetanic force (G) in EDL from BL6 (n = 3) and Cre- (n = 7) mice. Representative twitch (H) and tetanic force (I) transients in m. soleus (Sol). Peak twitch (J) and tetanic force (K) in Sol from BL6 (n = 3), Cre- (n = 7), and Cre+ (n = 11) mice. Calibration in panel (D) 1 mN and 50 ms; (E) 5 mN and 100 ms; (H) 1 mN and 100 ms; (I) 10 mN and 200 ms (**p<0.01, ***p<0.001 from t-test).
Figure 2—figure supplement 3
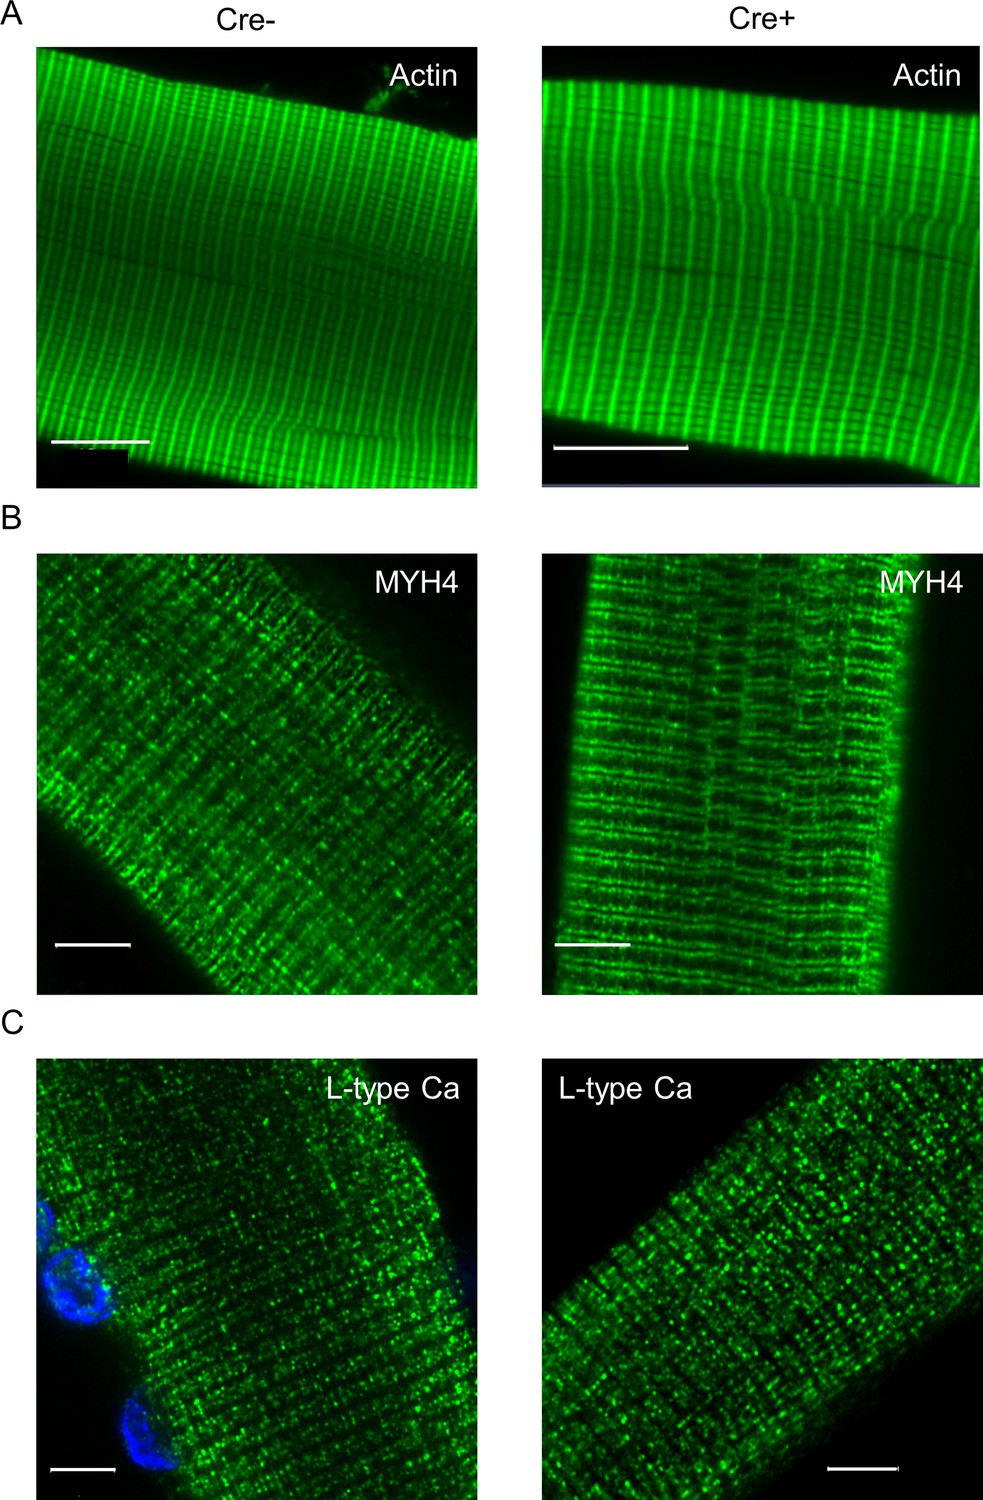
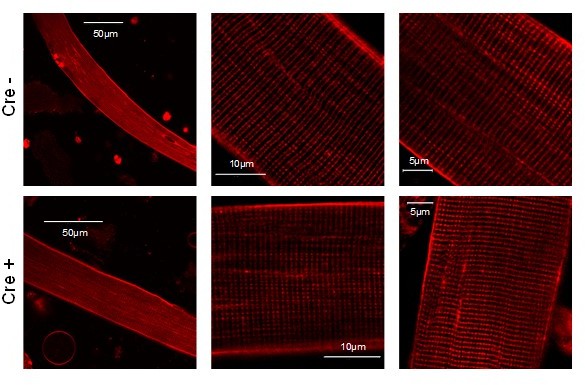
Expression and spatial distribution of actin, MYH4, and L-type calcium channels in single m. flexor digitorum brevis (FDB) muscle fibers isolated from Cre- and Cre+ animals.
(A). Images represent actin-specific fluorescent labeling of single fibers isolated from Cre- and Cre+ animals. FITC-conjugated phalloidin was used for the detection of contractile protein actin. (B) MYH4-specific fluorescent labeling on isolated skeletal muscle fibers. (C) The presence and localization of L-type calcium channels were investigated on single muscle fibers isolated from Cre- and Cre+ mice. Cell nuclei (blue) are stained with DAPI. Scale bars represent 10 µm in panel (A) and 5 µm in panels (B) and (C).
Figure 3 with 2 supplements
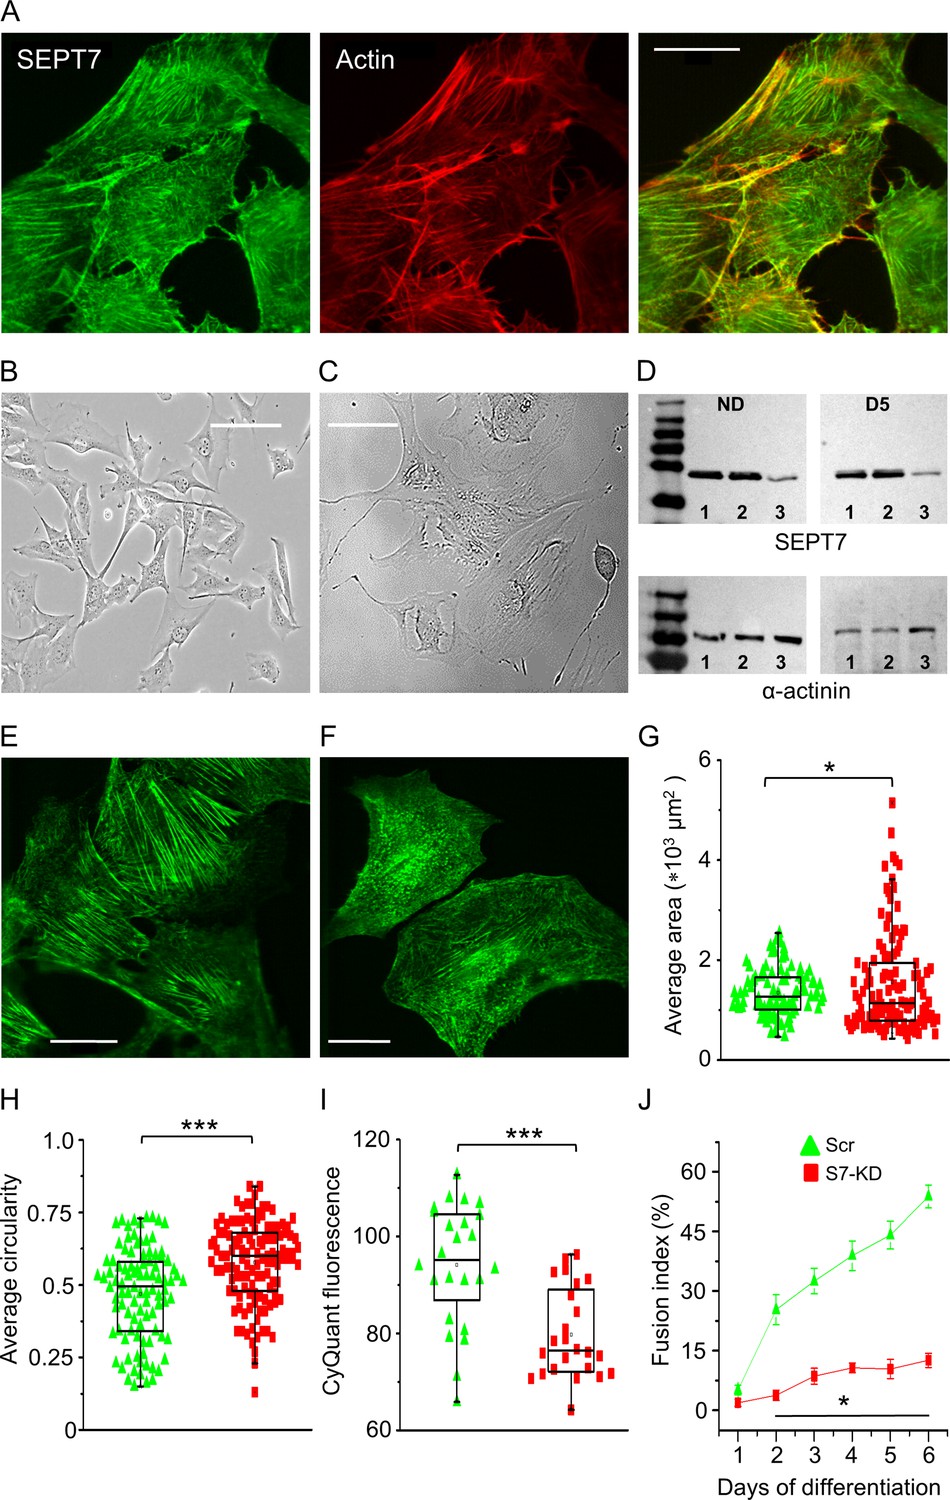
Septin7 is critical for proper cellular development and myotube differentiation.
(A) Confocal images of Septin7 immunolabeling (green) and actin filaments (red) and their co-localization in control C2C12 cells. Calibration is 20 µm. Transmitted light images of control (B) and Septin7 knockout (KO; C) cells demonstrating that complete KO of Septin7 in C2C12 cells prevents appropriate cell proliferation. Scale bar is 50 µm for both the control and KO cells. (D) Partial knockdown (KD) of Septin7 expression at proliferation stage (nondifferentiated [ND]) and 5 days after differentiation induction (D5). 8 µg of protein samples from absolute control (Ctrl), scrambled transfected (Scr), and S7-KD cells in each case were loaded to SDS-PAGE gel, and following electrophoresis and blot transfer into nitrocellulose membrane, Septin7 (50 kDa) and α-actinin (110 kDa) were probed with the appropriate primary antibodies. Numbers 1, 2, and 3 at the bottom of the gels indicate Ctrl, Scr, and S7-KD samples, respectively. First and last lines in the ladders correspond to 35 and 250, and 70 and 250 kDa, for the upper and lower panels, respectively. Immunolabeling of Septin7 filaments in Scr (E) and S7-KD cells (F) demonstrating altered filament structure, cell size, and shape. Scale bar is 20 µm. Quantification of changes in cell morphology, area (G) and circularity (H) in S7-KD cultures. Green triangles represent Scr, while red squares represent S7-KD cells. The number of cells investigated was 96 in Scr and 121 in S7-KD cultures; *p<0.05, ***p<0.001 from t-test; experiment was repeated twice (N = 2). (I) Decreased proliferation 3 days after the plating assessed as CyQUANT fluorescence (n = 24; N = 3) and (J) suppressed differentiation of S7-KD cells determined by the calculation of fusion index during 6 days of investigation (n = 20; N = 2). Horizontal line in (J) shows where the difference between Scr and S7-KD cells was statistically significant (*p<0.05 from t-test). See also Figure 3—figure supplement 1 and Figure 3—figure supplement 2.
-
Figure 3—source data 1
Partial knockdown (KD) of Septin7 protein expression at proliferation stage (nondifferentiated [ND]) and following differentiation induction (D1–D2).
8 µg of protein samples from absolute control (Ctrl), scrambled transfected (Scr), and S7-KD cells in each case were loaded to SDS-PAGE gel, and following electrophoresis and blot transfer into nitrocellulose membrane, Septin7 (50 kDa) and α-actinin (110 kDa) were probed with the appropriate primary antibodies. Numbers 1, 2, and 3 at the bottom of the gels indicate Ctrl, Scr, and S7-KD samples, respectively. Relevant parts of the original gel images are presented in Figure 3D.
- https://cdn.elifesciences.org/articles/75863/elife-75863-fig3-data1-v1.tif
-
Figure 3—source data 2
Partial knockdown (KD) of Septin7 protein expression following differentiation induction (D3-D6).
- https://cdn.elifesciences.org/articles/75863/elife-75863-fig3-data2-v1.tif
-
Figure 3—source data 3
α-actinin protein expression at proliferation stage (ND) and following differentiation induction (D1-D2) in cultured C2C12 cells.
- https://cdn.elifesciences.org/articles/75863/elife-75863-fig3-data3-v1.tif
-
Figure 3—source data 4
α-actinin protein expression following differentiation induction (D3-D6) of cultured C2C12 cells.
- https://cdn.elifesciences.org/articles/75863/elife-75863-fig3-data4-v1.tif
Figure 3—figure supplement 1
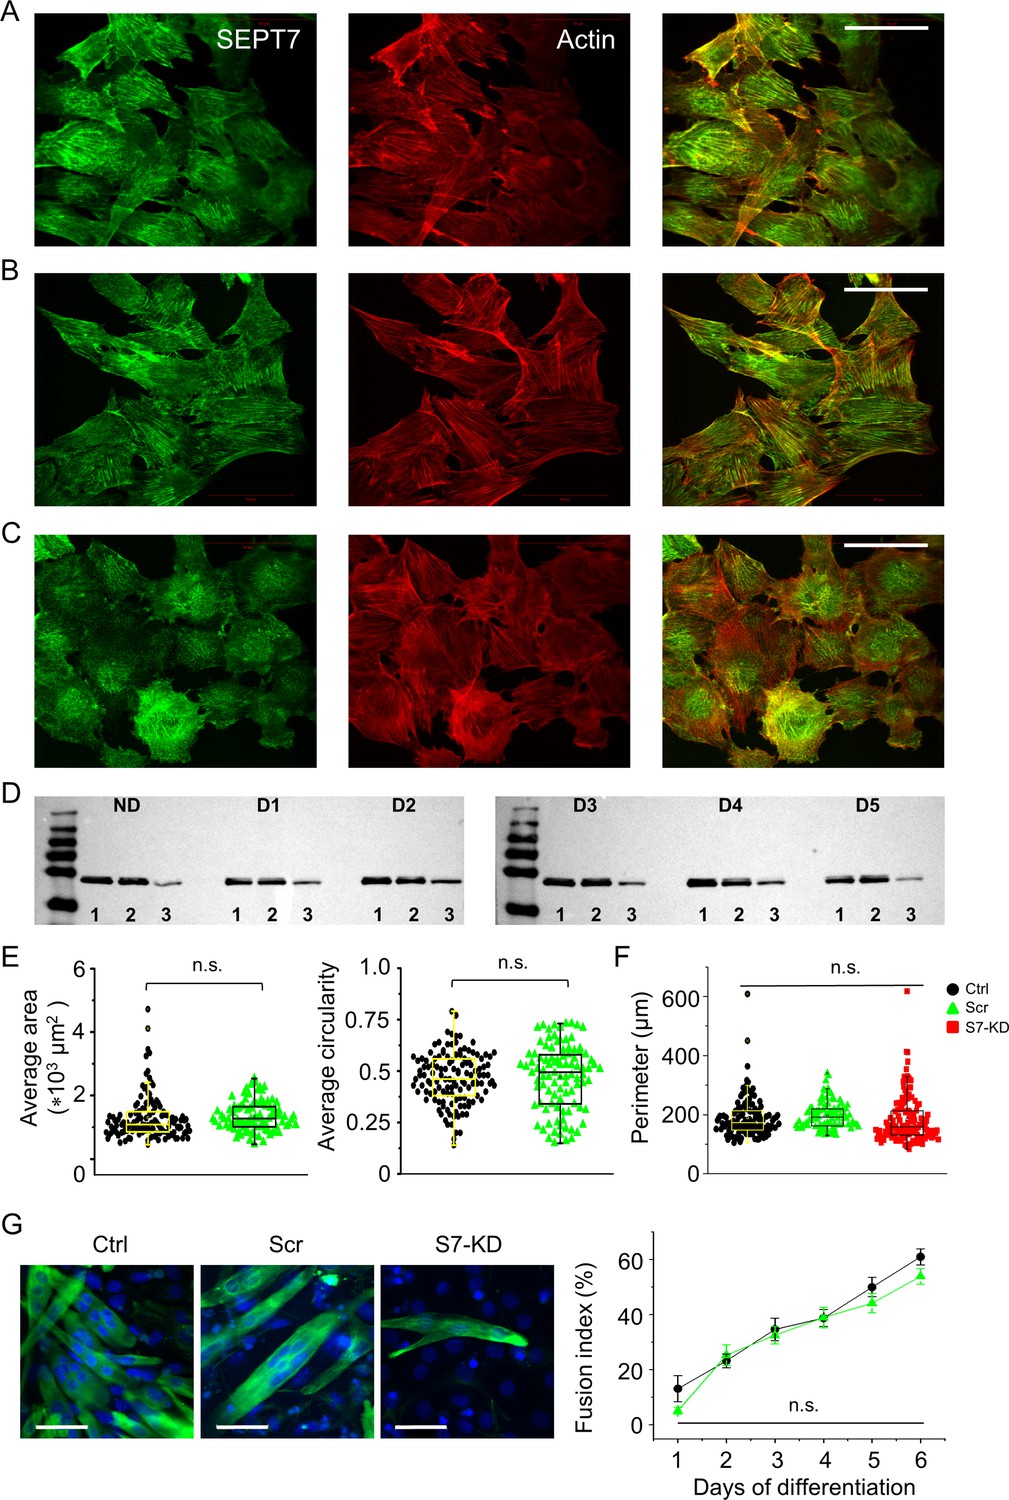
Septin7 filament structure and the effect of gene silencing on cellular parameters.
Intracellular localization of Septin7 (green) and actin (red) filaments individually and merged in control (Ctrl, A), scrambled (Scr, B), and S7-KD (C) C2C12 cells. Calibration is 50 µm. (D) Modified expression of Septin7 protein (50 kDa) was followed during the differentiation program of Ctrl, Scr, and S7-KD cells. ND refers to nondifferentiated, D1–D5 to appropriate days (1–5) following the induction of differentiation, while numbers 1, 2, and 3 at the bottom of the gels indicate Ctrl, Scr, and S7-KD samples, respectively. First and last lines in the ladders correspond to 35 and 250 kDa, respectively. (E) Quantitation of change in S7-KD cell morphology (area and circularity). Black circles represent data from control, while green triangles from scrambled cells. Individual data points (symbols) and average values (boxes with error bars) are shown for each group. The number of cells investigated was 127 in Ctrl, 96 in Scr, and 121 in S7-KD cultures; the experiment was repeated twice (N = 2). (F) Average perimeter was also calculated from different cells, and this data did not show significant difference between Ctrl (black), Scr (green), and S7-KD samples (red). (G) Representative confocal images from differentiated (D5) control, scrambled, and Septin7 KD cultures, where desmin (expressed only in myotubes) was fluorescently labeled using specific antibody (green), and nuclei were stained with DAPI (blue). Scale bars represent 50 µm. Differentiation during 6 days of culturing was assessed by calculating the fusion index in Ctrl (black) and Scr (green) cultures revealed to be not significantly different (n = 20; N = 2).
-
Figure 3—figure supplement 1—source data 1
Modified expression of Septin7 protein (50 kDa) in non-differentiated stage and 1-2 days following differentiation induction of Ctrl, Scr, and S7-KD cells.
ND refers to nondifferentiated, D1–D5 to appropriate days (1–5) following the induction of differentiation, while numbers 1, 2, and 3 at the bottom of the gels indicate Ctrl, Scr, and S7-KD samples, respectively. Relevant parts of the original gel images are presented in Figure 3—figure supplement 1D.
- https://cdn.elifesciences.org/articles/75863/elife-75863-fig3-figsupp1-data1-v1.tif
-
Figure 3—figure supplement 1—source data 2
Modified expression of Septin7 protein during the differentiation (D3-D6) program of Ctrl, Scr, and S7-KD cells.
- https://cdn.elifesciences.org/articles/75863/elife-75863-fig3-figsupp1-data2-v1.tif
Figure 3—figure supplement 2
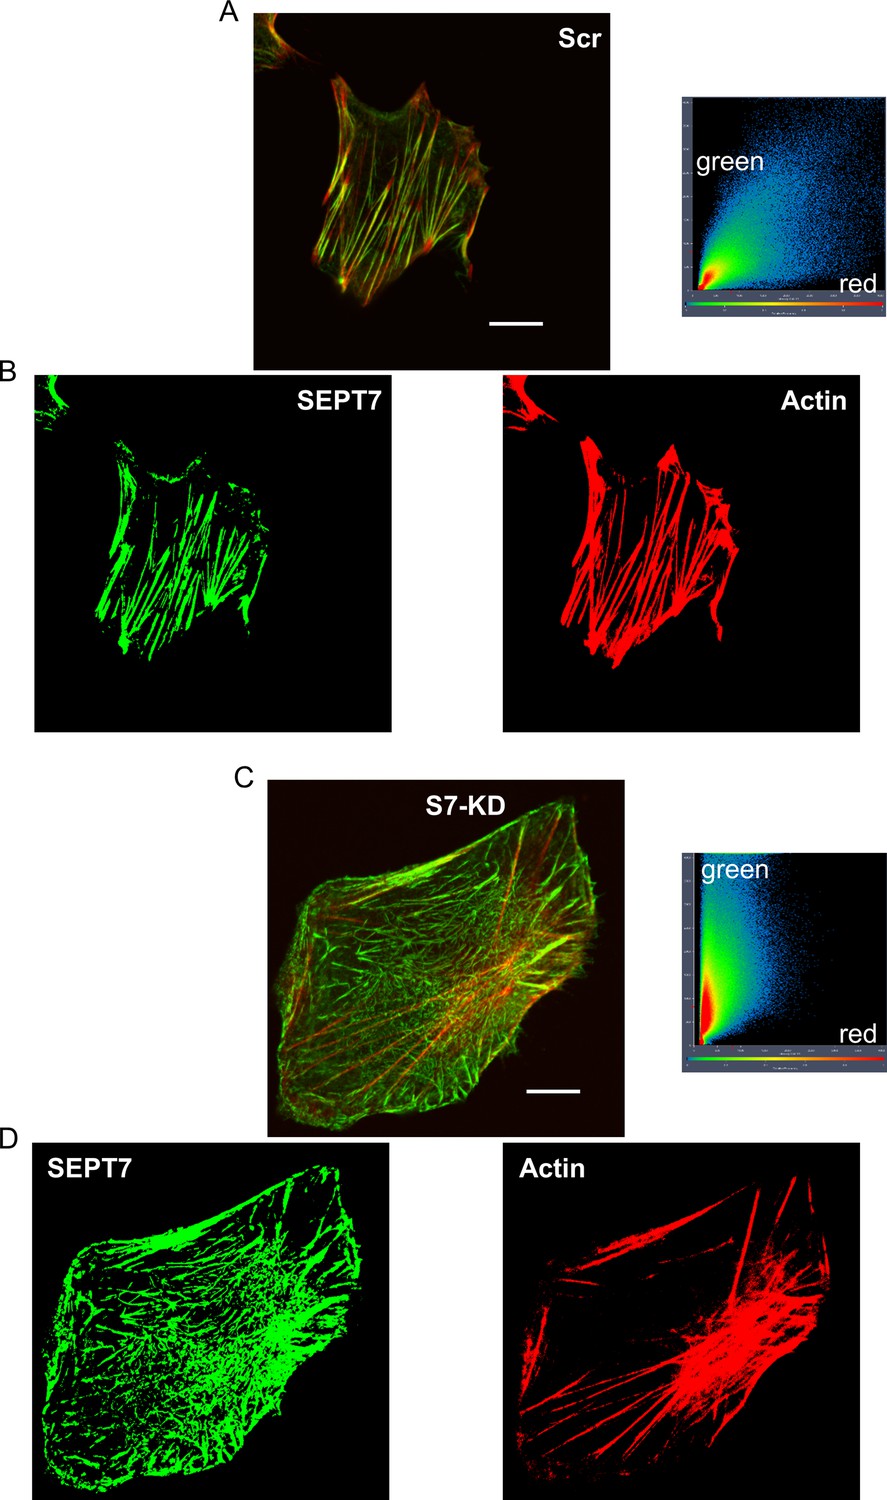
SEPT 7 downregulation modifies the intracellular architecture of C2C12 cells.
Representative confocal images of Septin7 (green) and actin (red) filaments in Scr (A) and a S7-KD (B) C2C12 cell, where co-localization analysis was also performed. The Pearson’s coefficient was smaller for the S7-KD (B, 0.648) than for the Scr (A, 0.833) C2C12 cell. From the original merged images of scrambled (A) and S7-KD cells (B), Septin7 (in green) and actin filaments (in red) are separately presented for scrambled (C) and S7-KD (D) cells, respectively. Note the asymmetric distribution of intensities in case of S7-KD cells. Filamentous images (C, D) were created with thresholding of the separate channels. Scale bar in panels (A) and (B) corresponds to 10 μm.
Figure 4 with 1 supplement
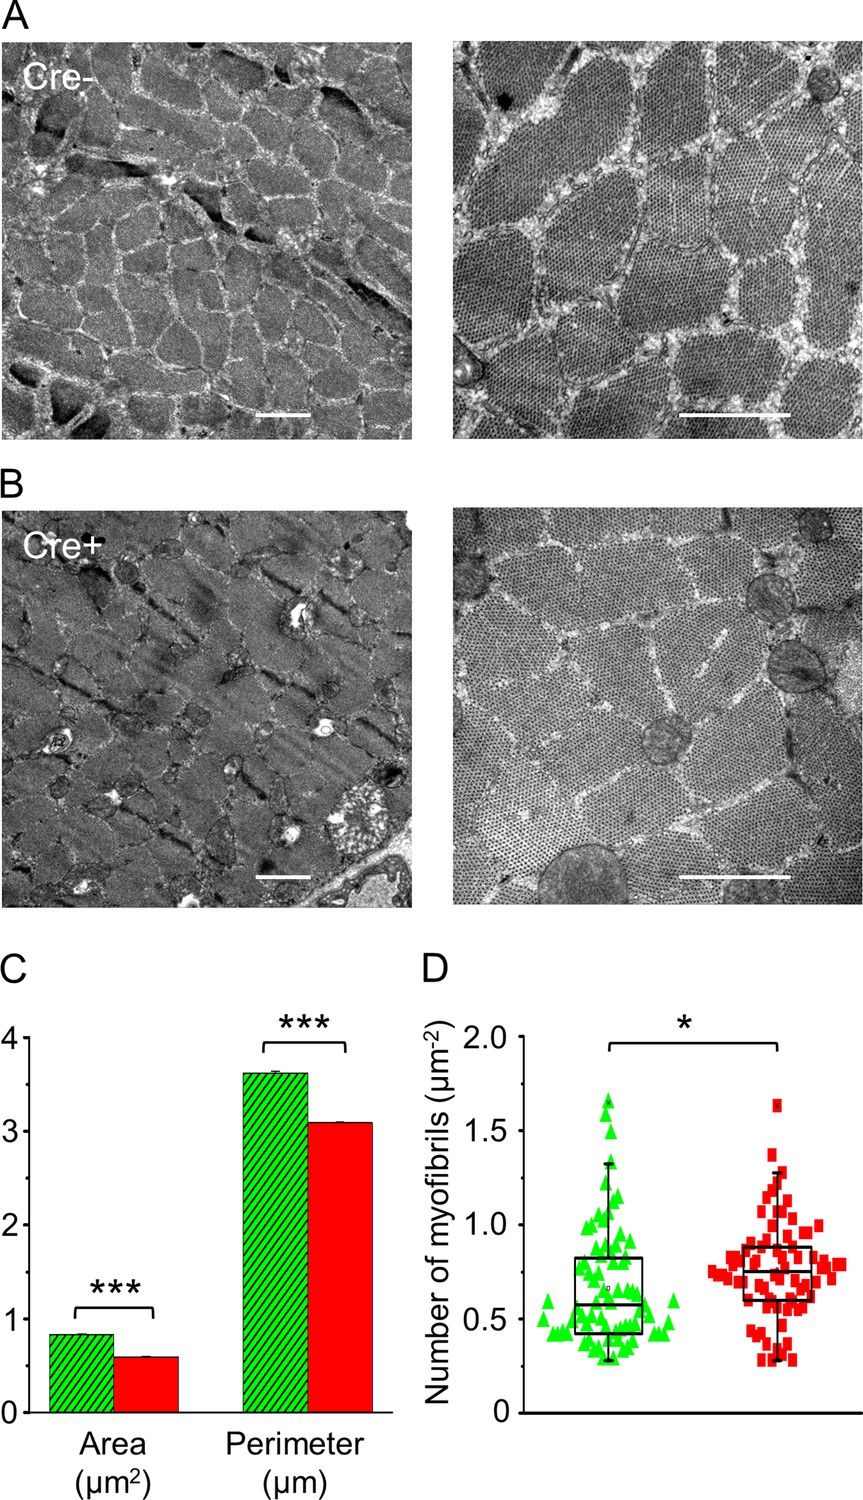
In vivo knockdown of Septin7 alters myofibrillar structure.
(A, B) Representative electron microscopy (EM) images of myofibrils from cross-sectional samples of m. tibialis anterior (TA) muscles from Cre- and Cre+ mice at smaller (left) and larger (right) magnification where scale bars represent 1 μm. (C, D) Area and perimeter of the individual myofibrils and the number of myofibrils within 1 µm2 of an appropriate visual field were determined from EM images. Here and in all subsequent figures, green columns represent data from Cre-, while red columns from Cre+ animals (average ± SEM). The total number of myofibrils counted for area and perimeter was 3012 and 3174 in Cre- and Cre+ mice, respectively, while the number of visual fields examined was 72 and 74, for calculating the number of myofibrils (*p<0.05; ***p<0.001 from t-test). See also Figure 4—figure supplement 1.
Figure 4—figure supplement 1
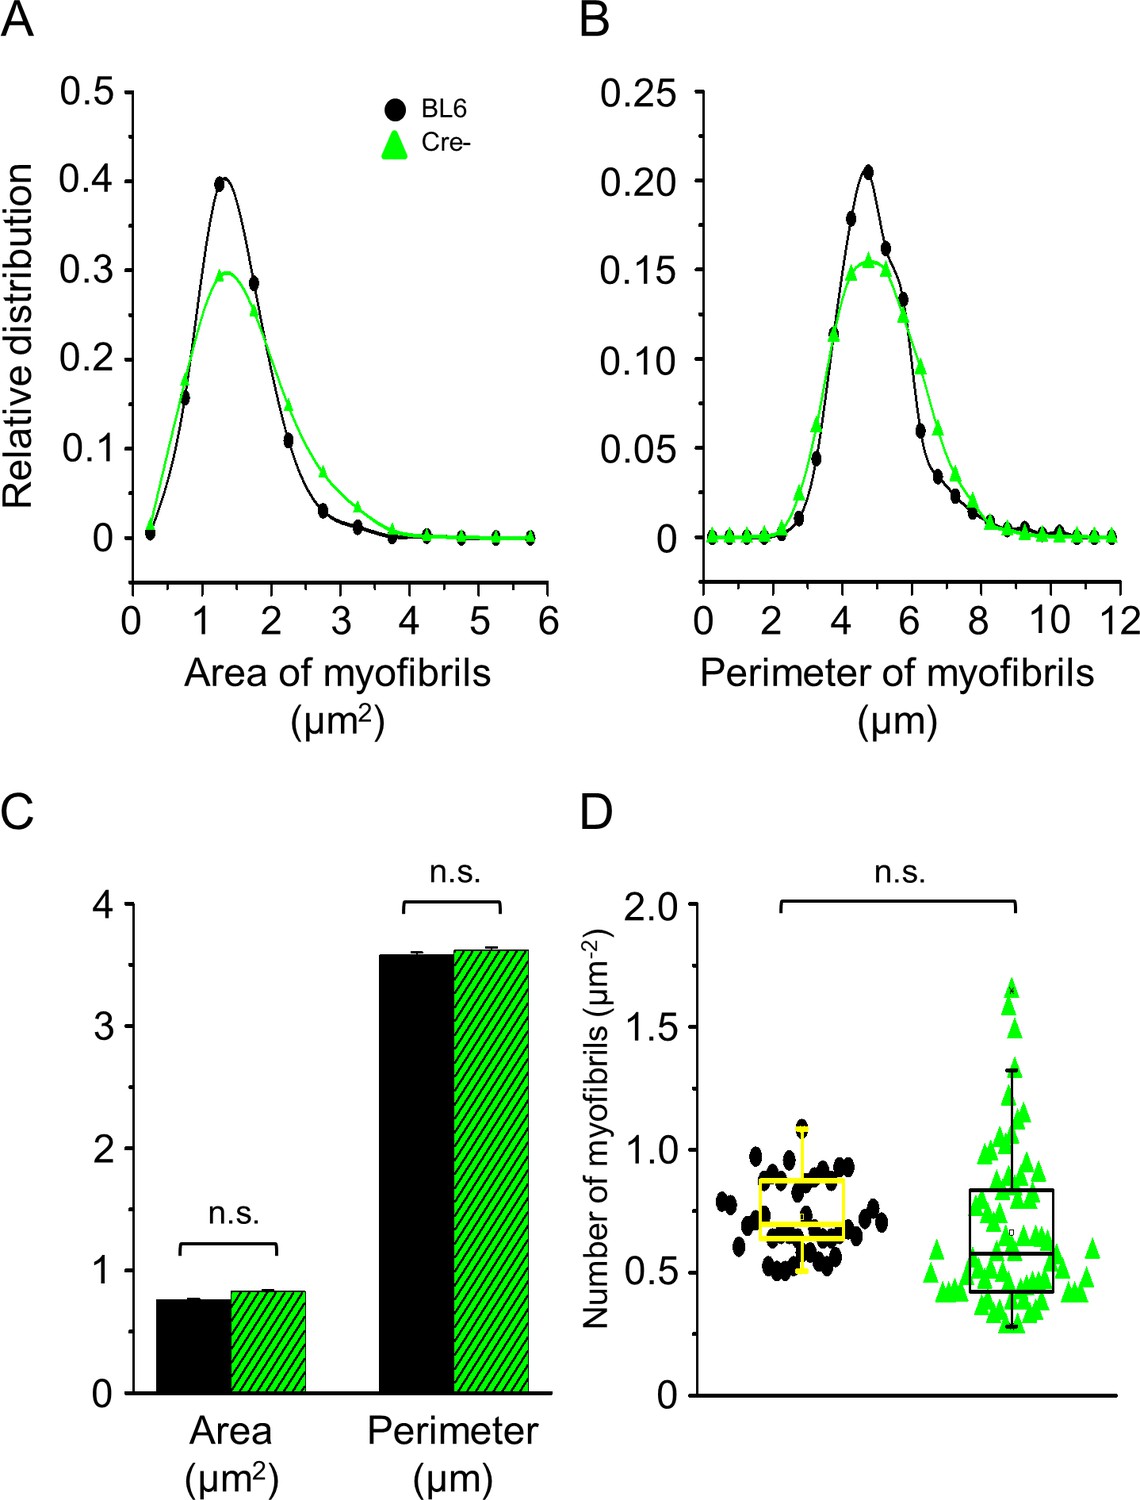
Changes in myofibrillar parameters with in vivo knockdown of Septin7.
Myofibrillar parameters calculated from cross-sectional electron microscopy (EM) pictures of m. tibialis anterior (TA) muscles of control BL6 (black) and Cre- (green) mice. Histograms represent the distribution of mitochondrial area (A) and perimeter (B) in control and Cre- samples, respectively. (C) Average of mitochondrial area and perimeter (average ± SEM). The number of individual myofibrils (for area and perimeter) was 1916 and 3012, respectively (D). The number of myofibrils within 1 µm2 of visual field in control BL6 and Cre- mice. The number of visual fields used for the calculation of myofibrillar data was 42 and 72 in samples originated from BL6 and Cre- mice, respectively.
Figure 5 with 2 supplements
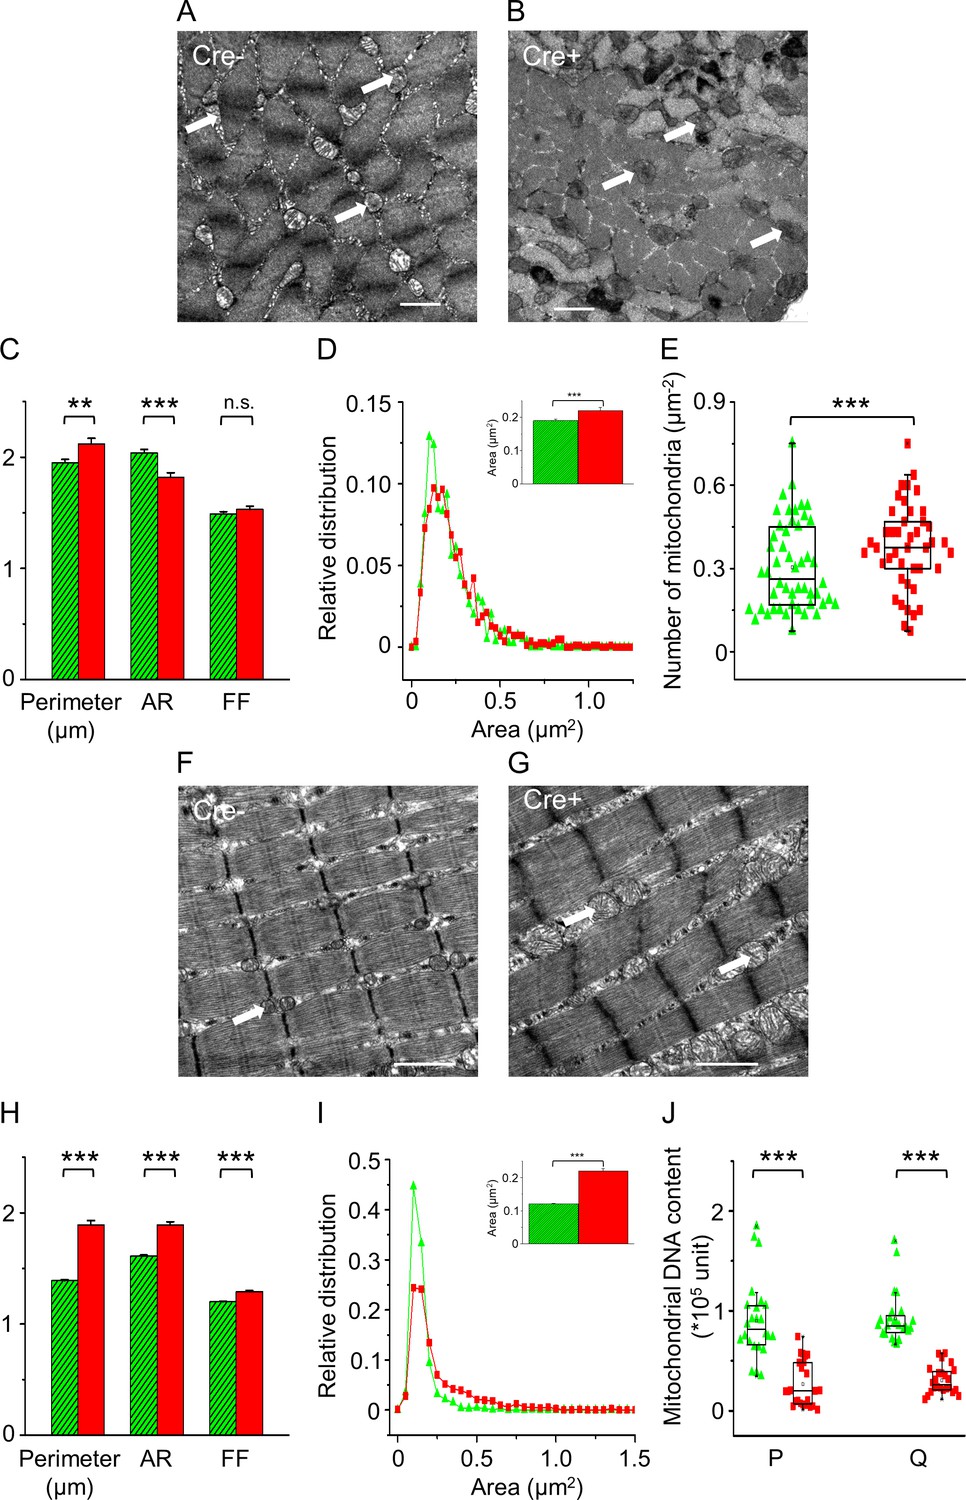
In vivo knockdown of Septin7 alters mitochondrial parameters.
(A, B) Representative electron microscopy (EM) images of myofibrils with mitochondria from cross-sectional samples of m. tibialis anterior (TA) muscles of Cre- and Cre+ mice. (C) Perimeter, aspect ratio (AR), and form factor (FF) of the individual mitochondria (average ± SEM; **p<0.01, ***p<0.001 from t-test). (D) Statistical distribution of mitochondrial area determined from EM images of Cre- (green) and Cre+ (red) samples. The average area with SE is presented in the inset of this panel. (E) The number of mitochondria within 1 µm2 of an appropriate visual field was calculated from EM images. The total number of mitochondria counted for area, perimeter, AR, and FF was 811 and 866 in Cre- and Cre+, respectively, while the number of visual fields examined was 50 and 43 for calculating the number of mitochondria (***p<0.001 from t-test). (F, G) Representative EM images of myofibrils and mitochondria from longitudinal sections of TA muscle samples originating from Cre- and Cre+ mice. (H) Perimeter, AR, and FF were determined from the longitudinal sections in both Cre- (n = 1635) and Cre+ (n = 713) samples (average ± SEM; ***p<0.001 from t-test). (I) The relative distribution of mitochondrial area, average area of mitochondria in Cre- and Cre+ skeletal muscle fibers is presented in the inset of this panel. The number of visual fields investigated was 42 and 41, respectively (average ± SEM; ***p<0.001 from t-test). Scale bars are equal to 1 µm in all images. (J) Mitochondrial DNA content was determined from m. pectoralis (P) and m. quadriceps femoris (Q) of Cre- and Cre+ mice using specific qPCR primers. The number of samples was 8, while in each case experimental triplicate was performed (***p<0.001 from t-test). See also Figure 5—figure supplement 1. Changes in mitochondrial morphology following Septin7 depletion were also studied in cultured C2C12 cells. For these results, see Figure 5—figure supplement 2.
Figure 5—figure supplement 1

Changes in mitochondrial parameters with in vivo knockdown of Septin7.
Mitochondrial parameters calculated from cross or longitudinal electron microscopy (EM) sections of m. tibialis anterior (TA) muscles from control (black) and Cre- (green) mice. Distribution of mitochondrial area (A) and perimeter (B) calculated from the transversal muscle sections of control BL6 and Cre- mice; the average of these parameters is presented in panel (C). The number of individual mitochondria (for area and perimeter) was 877 and 1589, respectively (average ± SEM). (D) The number of mitochondria within 1 µm2 of visual field in samples from BL6 control and Cre- mice. The number of visual fields for the calculation was 44 and 81, respectively. (E) The total area of mitochondria within the actual visual fields (n = 21 and 29, respectively) in samples of control and Cre- animals.
Figure 5—figure supplement 2
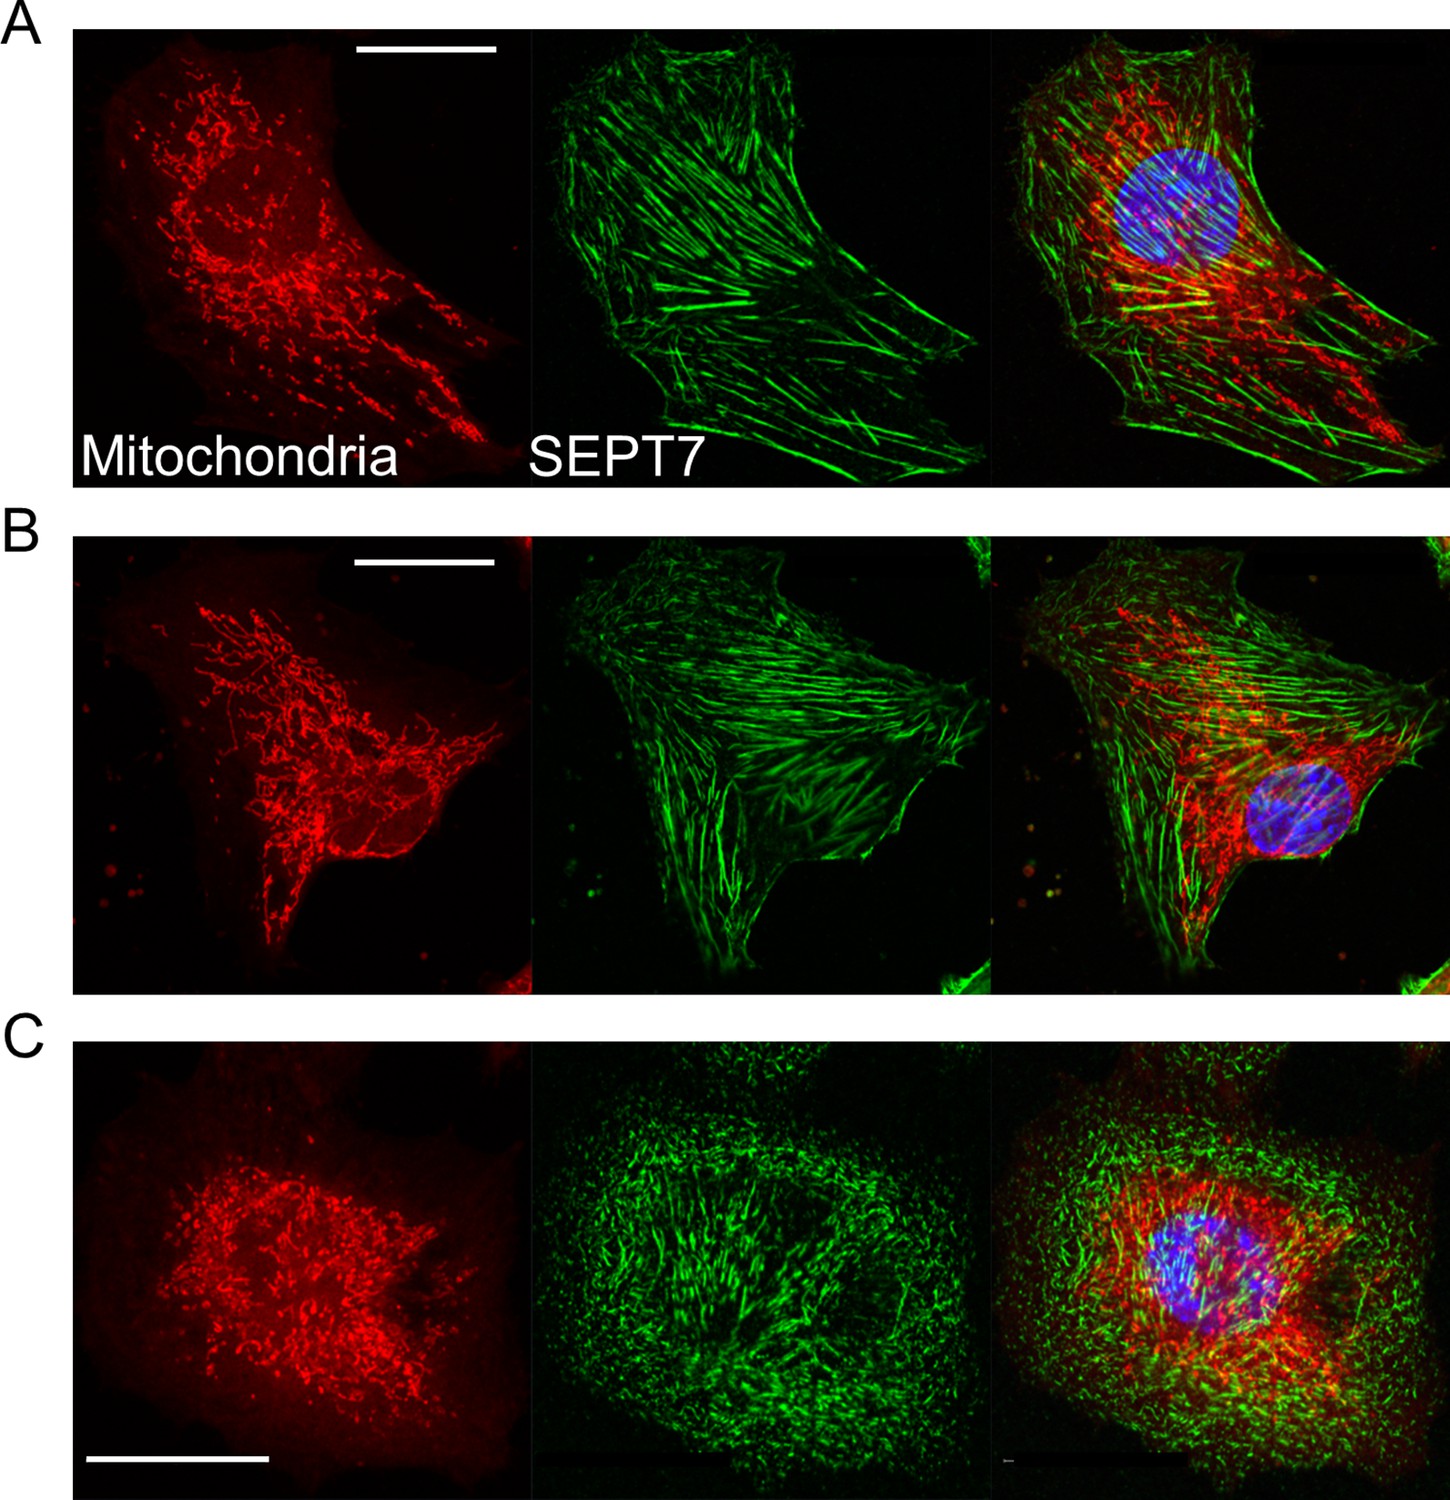
Alteration of mitochondrial network and septin filaments following Septin7 deletion in C2C12 cultures.
Representative images demonstrate fluorescently labeled mitochondria (red) and filament formation of Septin7 proteins (green) in control (A), scrambled (B), and Septin7 knockdown (KD) (C) proliferating myoblasts. Nuclei are labeled with DAPI. Scale bars represent 20 µm.
Figure 6 with 1 supplement
Septin7 and muscle regeneration.
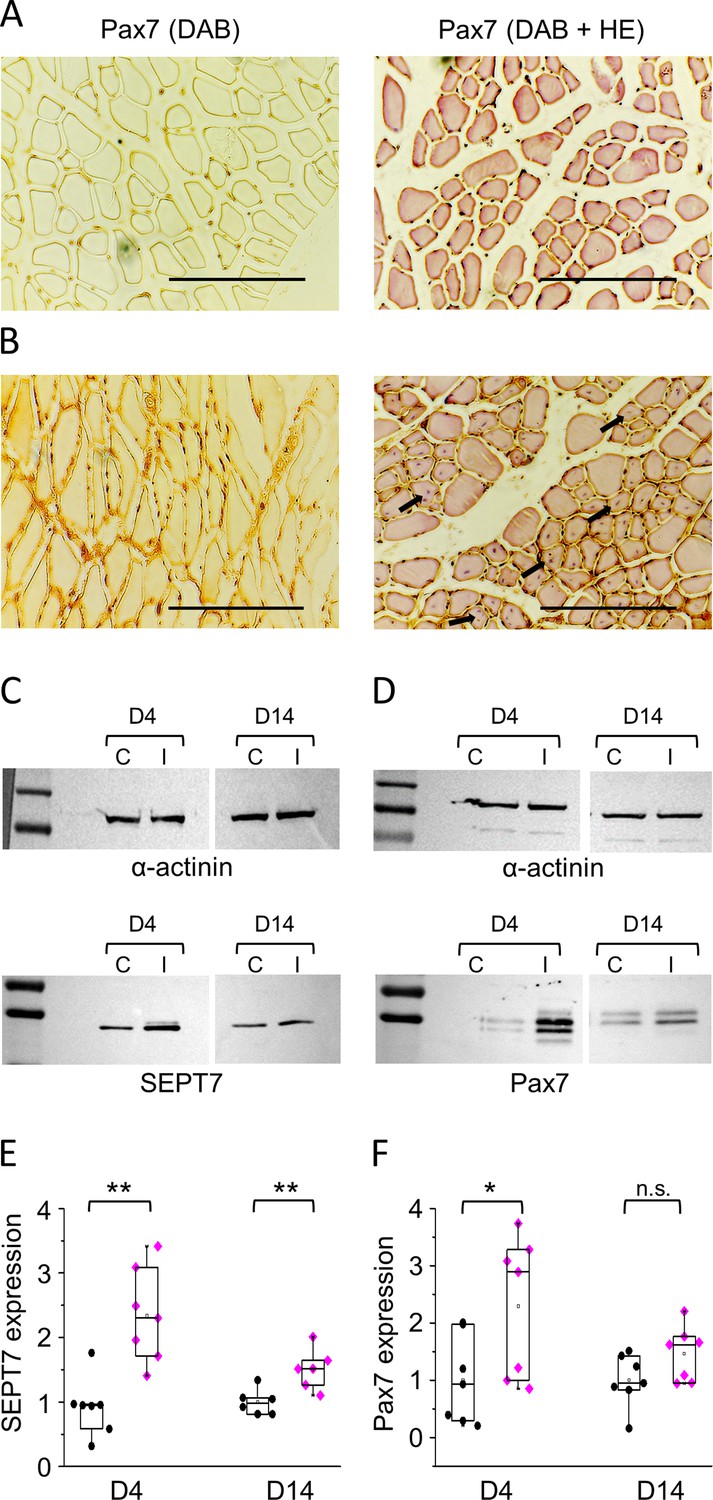
Representative histological images from noninjected (A) and BaCl2-injected (B) m. tibialis anterior (TA) muscles of BL6 mice 14 days following the muscle injury. The 6 µm cryosections were subjected to Pax7-specific immunostaining either alone (left panels) or together with HE-staining (right panels); the latter represents regenerating myofibrils with central nuclei in BaCl2-injected samples (some indicated by arrows). Scale bars are equal to 100 µm. (C, D) Protein samples were prepared from control (C) and injected (I) muscles at appropriate time points (day 4 [D4] and day 14 [D14]). Septin7 and Pax7 protein expression was determined in each sample pair, and α-actinin was used as normalizing control. First and last lines in the ladders correspond to 100 and 130, and 55 and 70 kDa in panel C, while 70 and 130, and 55 and 70 kDa in panel D, for upper and lower panels, respectively. Normalized Septin7 (E) and Pax7 (F) expression level was determined in control (black circles) and injected muscles (magenta diamonds), and plotted individually at each time point of investigation. Each point represents individual data (*p<0.05, **p<0.01 from t-test). See also Figure 6—figure supplement 1.
-
Figure 6—source data 1
α-actinin protein expression incontrol (C) and injected (I) m. tibialis anterior (TA) muscle samples at appropriate time points (day 4 [D4] and day 14 [D14]).
Septin7 protein expression was determined in each sample pair, and α-actinin was used as normalizing control. Relevant parts of the original gel images are presented in Figure 6C.
- https://cdn.elifesciences.org/articles/75863/elife-75863-fig6-data1-v1.tif
-
Figure 6—source data 2
Septin7 protein expression in control (C) and injected (I) m. tibialis anterior (TA) muscle samples at appropriate time points (D4 and D14).
- https://cdn.elifesciences.org/articles/75863/elife-75863-fig6-data2-v1.tif
-
Figure 6—source data 3
α-actinin protein expression in samples prepared from control (C) and injected (I) m. tibialis anterior (TA) muscles at appropriate time points (day 4 [D4] and day 14 [D14]).
Pax7 protein expression was determined in each sample pair, and α-actinin was used as normalizing control. Relevant parts of the original gel images are presented in Figure 6D.
- https://cdn.elifesciences.org/articles/75863/elife-75863-fig6-data3-v1.tif
-
Figure 6—source data 4
Pax7 protein expression in samples prepared from control (C) and injected (I) m.tibialis anterior muscles at appropriate time points (D4 and D14).
- https://cdn.elifesciences.org/articles/75863/elife-75863-fig6-data4-v1.tif
Figure 6—figure supplement 1
Involvement of Pax7 in muscle regeneration.
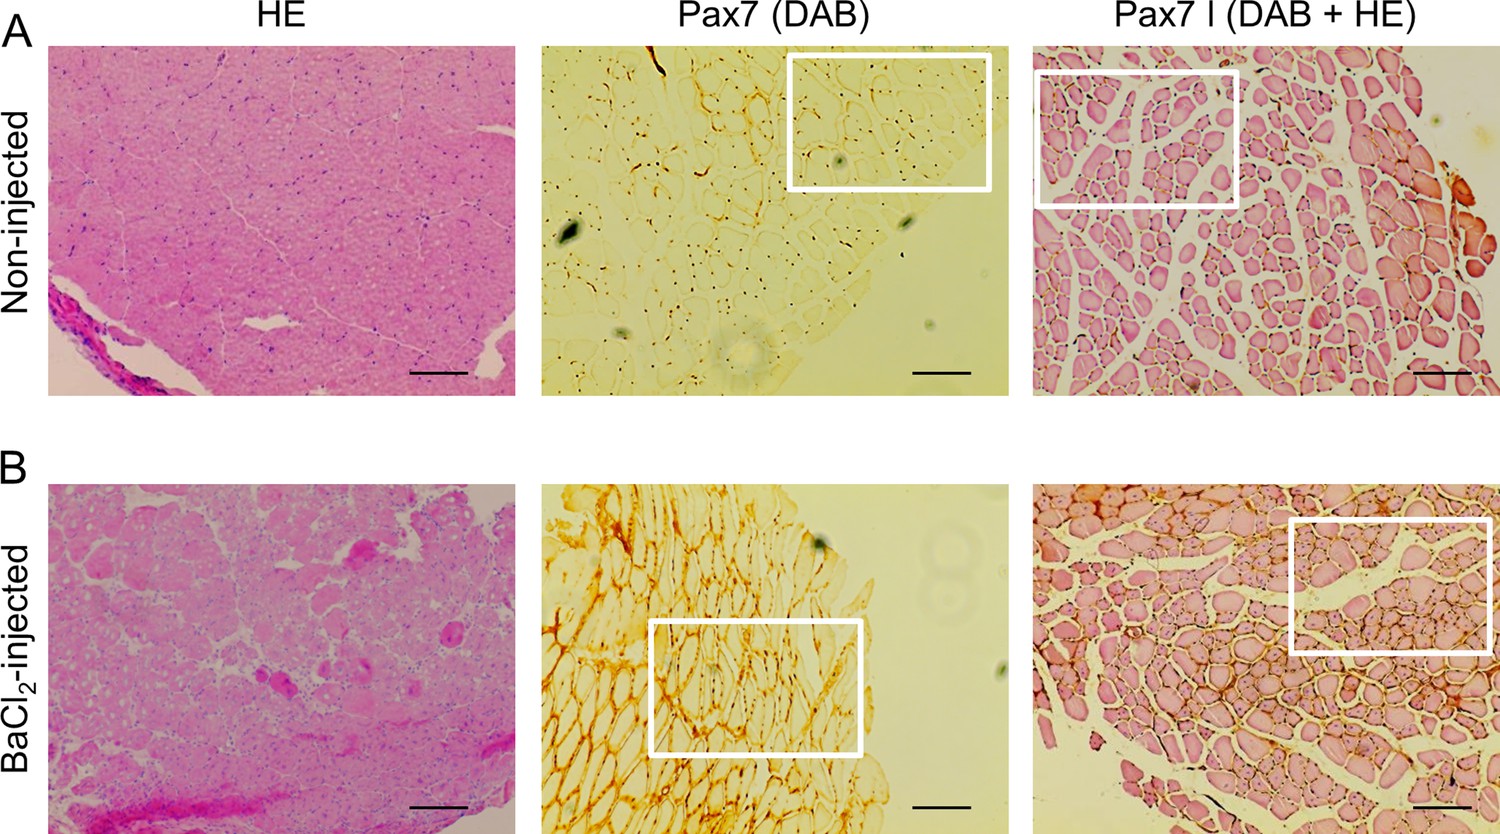
Cryosections from noninjected (A) and injected (B) m. tibialis anterior (TA) muscle samples were subjected to hematoxylin-eosin (HE) and Pax7-specific immunostaining visualized with DAB reagent. Representative images from the aforementioned reactions were presented either alone (left and middle panels) or in combination (right panels). Scale bar is 100 µm. Specific areas from the representative images (indicated by squares) were further magnified (shown in Figure 6A and B) to represent different signal intensity for Pax7 staining and central nuclei in the injected samples.
Author response image 1
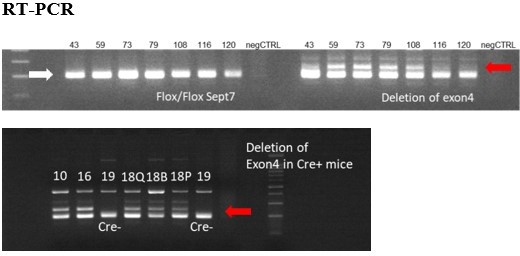
Figure represents the presence of floxed sites at Septin7 gene (white arrow) and the deletion of exon 4 (red arrows) in the appropriate DNA samples isolated from mice treated with Tamoxifen from different age and using different methods and periods of Tamoxifen application.
Exon 4 deletions were less than 20%, therefore these trials were not continued. Numbers above each lane correspond to the animal ID-s presented in the table above. Q – m. quadriceps, B- m. biceps femoris, P – m. pectoralis.
Author response image 2
Images representing the T-tubule system of a single muscle fibers isolated from Cre- and Cre+ FDB muscle.
Di-8-ANEPPS staining reveal no considerable difference between the two type of animals suggesting that the reduction of Septin7 expression do not alter the T-tubular system of skeletal muscle cells.
Tables
Key resources table
| Reagent type (species) or resource | Designation | Source or reference | Identifiers | Additional information |
|---|---|---|---|---|
| Gene (Homo sapiens) | Human reference genome NCBI | Genome Reference Consortium | http://www.ncbi.nlm.nih.gov/projects/genome/assembly/human | |
| Gene (Mus musculus) | Mouse reference genome NCBI | Genome Reference Consortium | http://www.ncbi.nlm.nih.gov/projects/genome/assembly/mouse | |
| Strain, strain background (Escherichia coli) | JM 109 competent E. coli cells | Promega | Cat# L2005 | |
| Strain, strain background (M. musculus) | B6.Cg-Tg(ACTA1-cre)79Jme/J mice (ssC0) | Jackson Laboratory | Cat#006149; RRID:IMSR_JAX:006149 | |
| Strain, strain background (M. musculus) | C57BL6 Septin7flox/flox (SS00) mice | Prof. Dr. Matthias Gaestel | Institute of Physiological Chemistry Hannover Medical School | |
| Cell line (M. musculus) | Mouse immortalized C2C12 | ATCC | Cat# CRL-1772; RRID:CVCL_0188 | |
| Biological sample (Homo sapiens) | Human m. quadriceps femoris | Kenézy Gyula Teaching Hospital of the University of Debrecen | https://kenezykorhaz.unideb.hu/en | |
| Antibody | Anti-Septin7 (rabbit monoclonal) | IBL | Cat# JP18991; RRID:AB_1630825 | IF (1:200), WB (1:250) |
| Antibody | Anti-α-actinin (mouse monoclonal) | Santa Cruz Biotechnology | Cat# sc-17829; RRID:AB_626633 | WB (1:250) |
| Antibody | Anti-Pax7 (mouse monoclonal) | Sigma | Cat# SAB1404168; RRID:AB_10738723 | IF (1:200), WB (1:200) |
| Antibody | Anti-desmin (rabbit polyclonal) | Sigma | Cat# D8281; RRID:AB_476910 | IF (1:200), WB (1:250) |
| Antibody | Anti-Ryanodin receptor 1 (mouse monoclonal) | Thermo Fisher Scientific | Cat# MA3-925; RRID:AB_2254138 | IF (1:250) |
| Antibody | Anti-α-actinin (skeletal muscle specific) (mouse monoclonal) | Sigma | Cat# A7811; RRID:AB_476766 | IF (1:500) |
| Antibody | Anti-myosin4 (MYH4; MF20) (mouse monoclonal) | Thermo Fisher Scientific | Cat# 14-6503-80 | IF (1 µg/ml) |
| Antibody | Anti-L-type calcium channel (rabbit polyclonal) | Santa Cruz Biotechnology | Cat# sc-16229-R | IF (1:250) |
| Antibody | HRP-conjugated anti-rabbit (goat monoclonal) | Bio-Rad Laboratories | Cat# 170-6515; RRID:AB_11125142 | WB (1:500) |
| Antibody | HRP-conjugated anti-mouse (goat monoclonal) | Bio-Rad Laboratories | Cat# 170-6516; RRID:AB_11125547 | WB (1:500) |
| Antibody | Alexa Fluor 488 conjugated anti-rabbit IgG (goat monoclonal) | Thermo Fisher Scientific | Cat# A32731; RRID:AB_2633280 | IF (1:500) |
| Antibody | Cyanine3 conjugated anti-Mouse IgG (goat monoclonal) | Thermo Fisher Scientific | Cat# A10521; RRID:AB_1500665 | IF (1:500) |
| Recombinant DNA reagent | Septin7-specific CRISPR/Cas9 KO plasmid constructs | Santa Cruz Biotechnology | Cat# sc-433427 | |
| Recombinant DNA reagent | Septin7-specific HDR plasmid constructs | Santa Cruz Biotechnology | Cat# sc-433427-HDR | |
| Recombinant DNA reagent | Septin7-specific shRNA constructs in retroviral pGFP-V-RS vectors | Origene | Cat# TR30007 | |
| Commercial assay or kit | Omniscript RT kit | QIAGEN | Cat# 205113 | |
| Commercial assay or kit | RNase free DNase kit | Thermo Fisher Scientific | Cat# EN0521 | |
| Commercial assay or kit | SYBRGreen mix | PCR Biosystems | Cat# PB20.11-51 | |
| Commercial assay or kit | High-specificity TaqMan assays | Thermo Fisher Scientific | Cat# 4331182 | |
| Commercial assay or kit | CyQUANT NF Cell Proliferation Assay Kit | Invitrogen | Cat# C35006 | |
| Commercial assay or kit | SuperSignal West Pico PLUS Chemiluminescent Substrate | Thermo Fisher Scientific | Cat# 34577 | |
| Chemical compound, drug | Tamoxifen containing chow | Envigo | Cat# TD 130857 | |
| Chemical compound, drug | Type I collagenase | Sigma | Cat# SCR103 | |
| Chemical compound, drug | Isoflurane | Forane | Cat# NDC 10019-360 | |
| Chemical compound, drug | Durcupan epoxy resin | Sigma | Cat# 44611 | |
| Chemical compound, drug | EZ-Vision Dye 6X | VWR Life Science | Cat# 97064-190 | |
| Chemical compound, drug | MitoTracker Red CMXRos | Thermo Fisher Scientific | Cat# M7512 | (0.5 µM) |
| Chemical compound, drug | Lipofectamine 2000 | Thermo Fisher Scientific | Cat# 11668019 | |
| Chemical compound, drug | Opti-MEM Reduced Serum medium | Thermo Fisher Scientific | Cat# 31985070 | |
| Software, algorithm | Nucline and InterView FUSION software | Mediso Ltd. | http://ctamed.com/en/portfolio/software-solutions/#fusion | |
| Software, algorithm | Axotape software | Axon Instruments | https://www.bioz.com/result/axotape/product/Molecular%20Devices%20Llc | |
| Software, algorithm | Primer Premier 5.0 software | Premier Biosoft | http://downloads.fyxm.net/Primer-Premier-101178.html | |
| Software, algorithm | Program to design target-specific primers for PCR | Primer-BLAST | https://www.ncbi.nlm.nih.gov/tools/primer-blast/ | |
| Software, algorithm | Statistical program Prism | GraphPad Software | https://www.graphpad.com/scientific-software/prism/ | |
| Software, algorithm | Image processing program ImageJ | Image J1.40g | https://imagej.nih.gov/ij/download.html | |
| Software, algorithm | Origin 8.6 | OriginPro | https://originpro.informer.com/8.6/ | |
| Other | DAB substrate kit | Thermo Fisher Scientific | Cat# 34002 | Histological labeling reagent used for the detection of Pax7 expression on muscle sections following BaCl2-induced injury |
| Other | Protein blocking solution serum-free | Dako | Cat# X0909 | Reagent used for blocking unspecific binding sites of the samples before application of primary antibodies in fluorescent immunolabeling procedure |
| Other | TRITC-phalloidin | Sigma | Cat# P1951 | Fluorescently labeled actin-specific labeling IF (1:1000) |
| Other | FITC-phalloidin | Sigma | Cat# P5282 | Fluorescently labeled actin-specific labeling IF (1:1000) |
| Other | Mowiol 4-88 | Sigma | Cat# 81381 | Mounting medium used to cover fluorescently labeled samples until the microscopic analysis |
| Other | FACSAria flow cytometer | BD Biosciences | https://www.bdbiosciences.com/en-eu/instruments/research-instruments/research-cell-sorters/facsaria-iii | Device used for single cell sorting based on the expression of fluorescent proteins (GFP and RFP) |
| Other | nanoScan SPECT/CT | Medisol Ltd | http://scanomedtranslational.com/ | Device used for whole body CT scans of mice |
| Other | Mouse running wheel | Campden Instruments Ltd Bodnár et al., 2014 | Device used to measure the voluntary activity of mice | |
| Other | Capacitive mechano-electric force transducer | Experimetria Bodnár et al., 2016 | Device used to measure in vitro muscle force | |
| Other | Leica Ultracut UCT | Leica Microsystems | https://www.leica-microsystems.com | Device used to cut ultrathin sections from muscle samples for EM analysis |
| Other | JEM1010 transmission electron microscope | JEOL | https://www.jeolusa.com/PRODUCTS/Transmission-Electron-Microscopes-TEM | Device used to examine ultrathin muscle sections at high magnification |
| Other | HT Mini homogenizer | OPS Diagnostics | Cat# BM-D1030E | Device used to homogenize muscle samples for protein analysis. |
| Other | Labnet MultiGene 96-well Gradient Thermal Cycler | Labnet International | Cat# TC9610-230 | Device used for RT-PCR reactions |
| Other | LightCycler 480 | Roche | Cat# 05015243001 | Device used for quantitative PCR measurements |
| Other | FlexStation 3 multimode microplate reader | Molecular Devices | Cat# Flex3 | Device used to measure fluorescent signal of CyQUANT cell proliferation assay |
| Other | AiryScan Confocal microscope | Zeiss | https://www.zeiss.com/microscopy/int/dynamic-content/news/2014/news-lsm-880.html | Device used to examine fluorescent immunolabeling of muscle fibers and cultured cells at high spatial resolution |
Author response table 1
Genetic modification of Septin7 gene following Tamoxifen treatment in mice mentioned below.
| mouse ID(genotype) | age at beginning of treatment | duration of treatment | type of treatment | sacrifice |
|---|---|---|---|---|
| 43 (Cre+) | 3-month-old | 5 consecutive days 24h interval | 20mg/ml Tamoxifen injection (100µl) | 10 days after injection |
| 59 (Cre+) | 3-month-old | 5 consecutive days 24h interval | 20mg/ml Tamoxifen injection (100µl) | 17 days after injection |
| 73 (Cre+) | 3-month-old | 5 consecutive days 24h interval | 40mg/ml Tamoxifen injection (100µl) | 10 days after injection |
| 79 (Cre+) | 3-month-old | 2X5 consecutive days 24h interval | 20mg/ml Tamoxifen injection (100µl) | 10 days after injection |
| 108 (Cre+) | 3-month-old | 4 weeks | 80mg/kg body weight Tamoxifen diet | after diet termination |
| 116 Cre+ | 3-month-old | 4 weeks | 80mg/kg body weight Tamoxifen diet | 5 weeks after diet termination |
| 120 Cre+ | 3-month-old | 4 weeks | 80mg/kg body weight Tamoxifen diet | 6 weeks after diet termination |
| 10 Cre+ | 1-month-old | 6 weeks | 80mg/kg body weight Tamoxifen diet | after diet termination |
| 16 Cre+ | 1-month-old | 6 weeks | 80mg/kg body weight Tamoxifen diet | after diet termination |
| 18 Cre+ | 1-month-old | 6 weeks | 80mg/kg body weight Tamoxifen diet | after diet termination |
| 19 Cre- | 1-month-old | 6 weeks | 80mg/kg body weight Tamoxifen diet | after diet termination |
Additional files
-
Supplementary file 1
Informations related to PCR reactions, voluntary running, and in vitro force measurements.
(a) Nucleotide sequences, amplification sites, GenBank accession numbers, amplimer sizes, and PCR reaction conditions for each primer pair are shown. Related to Figure 1, Figure 2, and Figure 1—figure supplement 1. (b) Parameters of voluntary running. Related to Figure 2 and Figure 2—figure supplement 2. 3 months of tamoxifen treatment started 4 weeks after birth (4-month-old). 10-day-long running experiment during tamoxifen treatment. *** shows significant difference from Cre- at p<0.001 from t-test. (c) Parameters of in vitro force measurement. Related to Figure 2 and Figure 2—figure supplement 2. 3-month tamoxifen treatment started 4 weeks after birth (4-month-old). *, **, and *** show significant difference from Cre- at p<0.05, 0.01, and 0.001 from t-test, respectively. #, ##, and ### show significant difference from BL6 at p<0.05, 0.01, and 0.001 from t-test, respectively. Fatigue was calculated as the relative amplitude of the 50th tetanus compared to the amplitude of the first tetanus.
- https://cdn.elifesciences.org/articles/75863/elife-75863-supp1-v1.docx
-
Transparent reporting form
- https://cdn.elifesciences.org/articles/75863/elife-75863-transrepform1-v1.pdf
Download links
A two-part list of links to download the article, or parts of the article, in various formats.
Downloads (link to download the article as PDF)
Open citations (links to open the citations from this article in various online reference manager services)
Cite this article (links to download the citations from this article in formats compatible with various reference manager tools)
Septin7 is indispensable for proper skeletal muscle architecture and function
eLife 11:e75863.
https://doi.org/10.7554/eLife.75863


