Mars, a molecule archive suite for reproducible analysis and reporting of single-molecule properties from bioimages
- Structure and Dynamics of Molecular Machines, Max Planck Institute of Biochemistry, Germany
- Physik Department, Technische Universität München, Germany
Figures
Figure 1
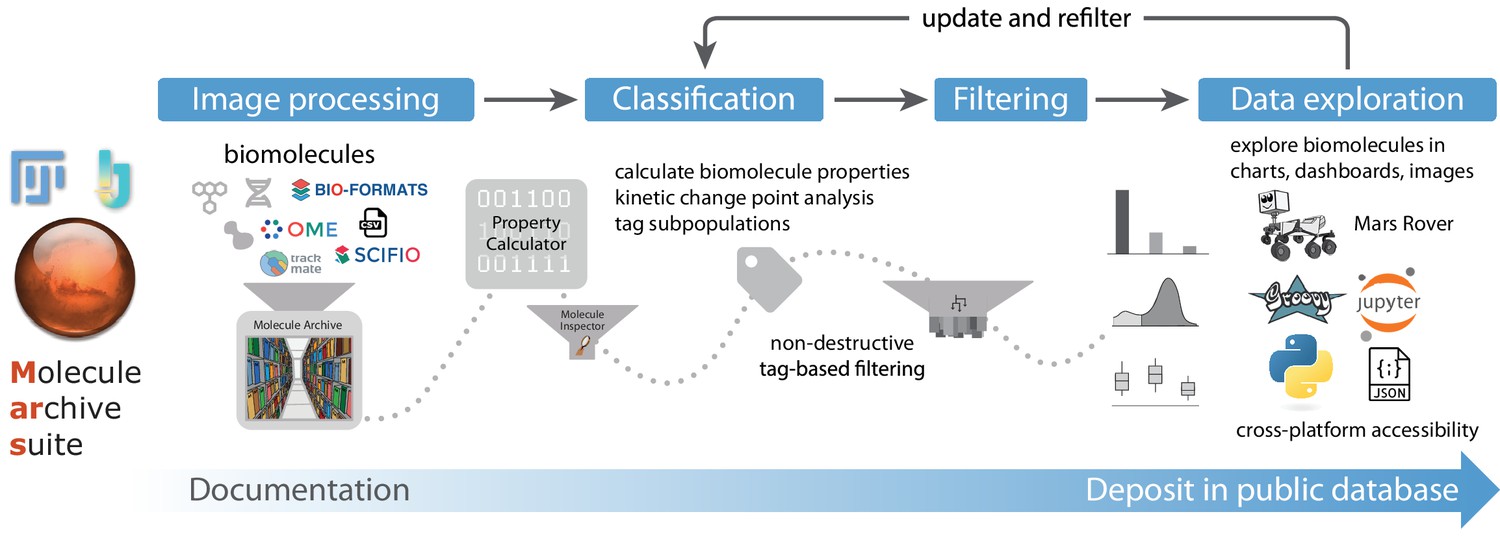
Overview of Mars workflows.
The process of reproducible data analysis with Mars starting from image processing to iterative rounds of classification and filtering to the final stage of data exploration and deposition into a public database.
Figure 2 with 1 supplement

Molecule Archive structure.
Schematic representation of the structure of Molecule Archives consisting of three types of records: Properties, Metadata, and Molecule. The single Properties record contains global information about the Molecule Archive contents, the Metadata records store information about the images used for biomolecule analysis (e.g. image dimensions, the analysis log), and the Molecule records store molecule-specific information (e.g. position over time, intensity).
Figure 2—figure supplement 1
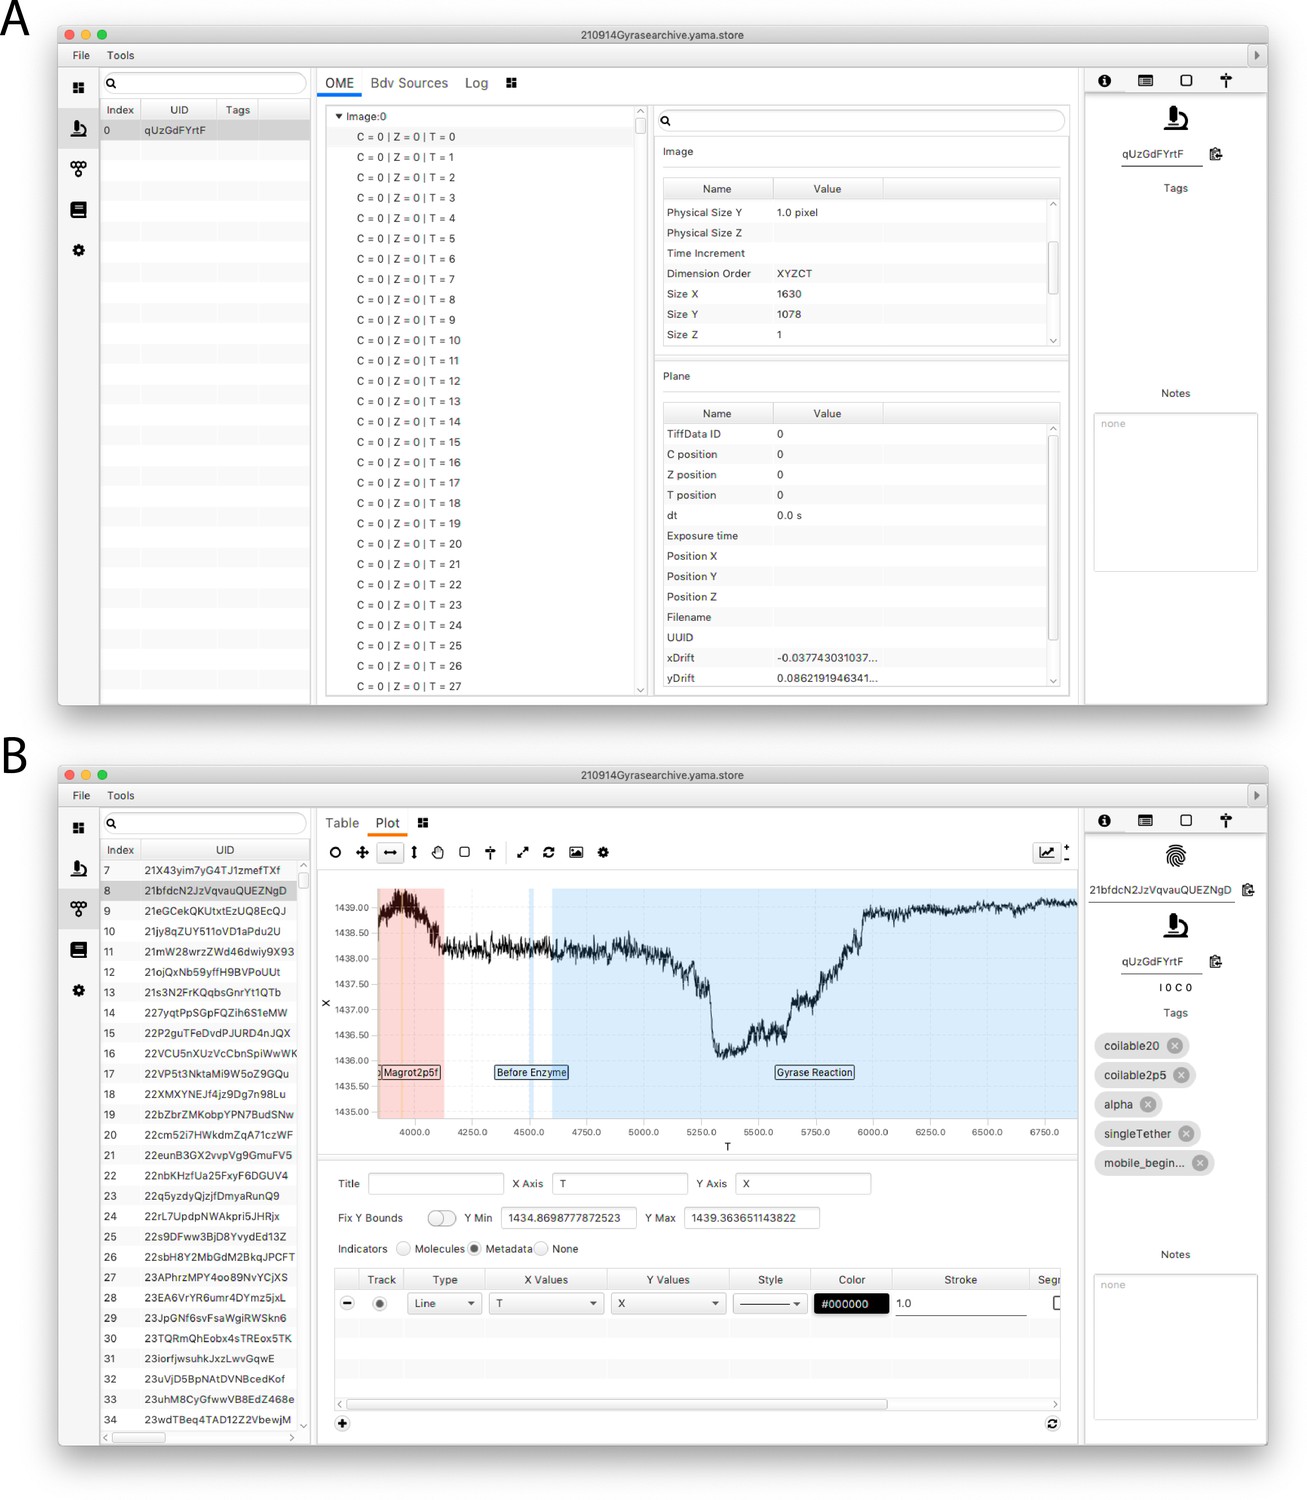
Screenshots of the Mars rover window.
(A) Mars Rover metadata tab showing open microscopy environment (OME) image metadata information for each analyzed image as well as the metadata-specific tags and other record options. (B) Mars Rover molecules tab highlighting the user-friendly data exploration features such as the trace plotter displaying region highlighting as well as molecule-specific tags, notes, uids, and metadata uids.
Figure 3

Workflow for tracking RNA polymerase position during transcription.
(A) Schematic of the RNA polymerase assay. Promoter-containing surface-immobilized 21 kb DNA was incubated with fluorescently-labeled RNA polymerase after which transcription was tracked over time. (B) Representation of the analysis pathway showing the analysis steps starting from the raw image stack on the left to a final plot on the right. First, the Peak Tracker extracted position vs time information from each fluorescent RNA polymerase creating a single Molecule Archive. In parallel, the DNA finder located the long, line-shaped, DNA molecules and generates a list of start and end positions. The information yielded from both tools was merged into a final DNA Molecule Archive. A classification and sorting process was applied resulting in a final plot showing the abundance of tracked molecules at various transcription rates (nt/s). A Gaussian fit to the population with rates > 40 nt/s revealed a population average transcription rate of 53±3.6 nt/s. Here n is the number of molecules.
Figure 4
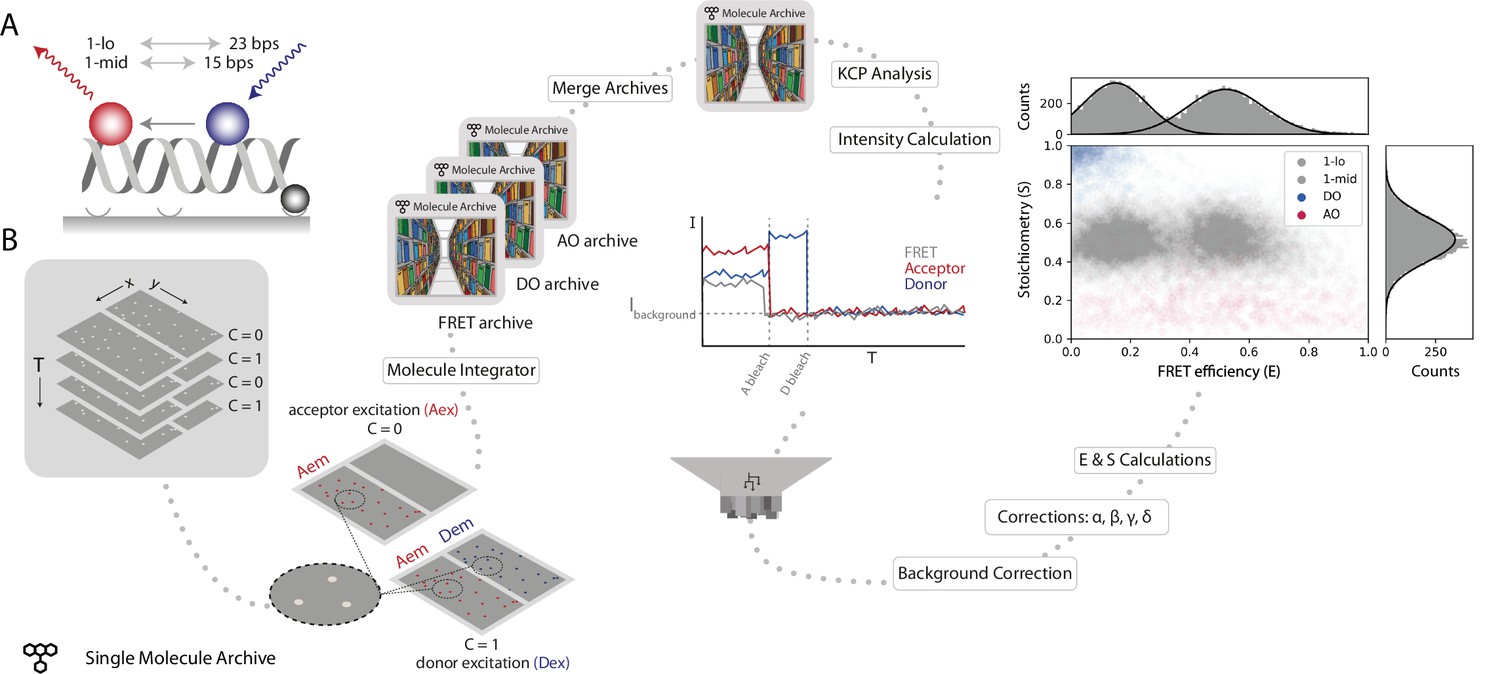
Workflow for a static smFRET experiment.
(A) Schematic of the FRET assay. The FRET efficiency between two coupled dyes (donor, shown in blue, and acceptor, shown in red) on a short, immobilized, dsDNA oligo was measured. The inter-fluorophore distance was probed for two constructs: 23 bps (1-lo) or 15 bps (1-mid). (B) Representation of the analysis pathway starting from the raw image stack on the left to a stoichiometry vs FRET efficiency plot on the far right. First, the molecule integrator is used to integrate intensity vs time traces for each molecule (Aex: acceptor excitation, Aem: acceptor emission, Dem: donor emission, Dex: donor excitation) resulting in three Single Molecule Archives (FRET archive, donor only [DO] archive, and acceptor only [AO] archive). After merging, the data are corrected for background and other photo-physical effectsre classified according to the observed molecular features. Finally, the single-molecule data is displayed in a scatterplot with the stoichiometry (S) and FRET efficiency (E) information for both FRET samples (1-lo and 1-mid) as well as the AO and DO populations. The accompanying histograms plot the data from the 1-lo and 1-mid populations in gray bars and corresponding population-specific Gaussian fits as a solid black line. A detailed step-by-step guide to this workflow is available on the Mars documentation website.
Figure 5 with 1 supplement
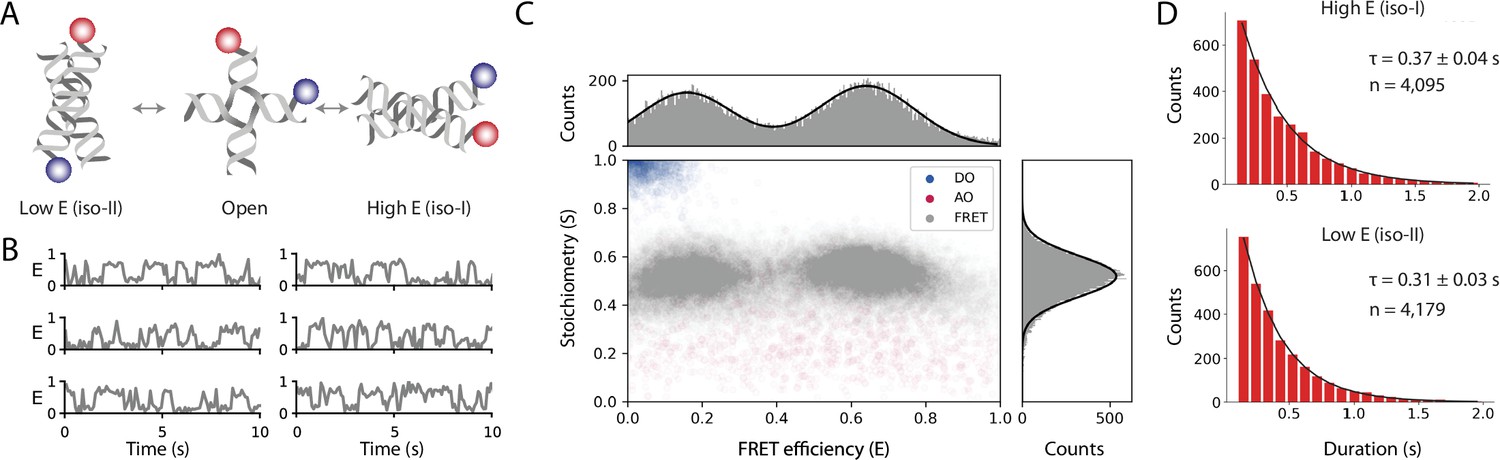
Workflow results for dynamic smFRET.
(A) Schematic of the dynamic FRET substrate. The FRET efficiency between two dyes (donor, shown in blue, and acceptor, shown in red) attached to the arms of a Holliday junction exhibiting rapid interconversion between low and high FRET states was measured. Biotin attachment to the surface used during the experiment was omitted from the cartoon for clarity. (B) FRET efficiency as a function of time for representative molecules. (C) Scatterplot showing the stoichiometry vs FRET efficiency for all timepoints of accepted molecules for FRET, AO, and DO populations. One-dimensional histograms displayed along each axis are fitted with single or double Gaussian models for stoichiometry and FRET efficiency, respectively. (D) Dwell time distributions from a two-state model for the high and low FRET states. Time scales are from exponential fits with standard deviation and n is the number of dwells taken from 601 molecules. A detailed step-by-step guide to this workflow is available on the Mars documentation website.
Figure 5—figure supplement 1
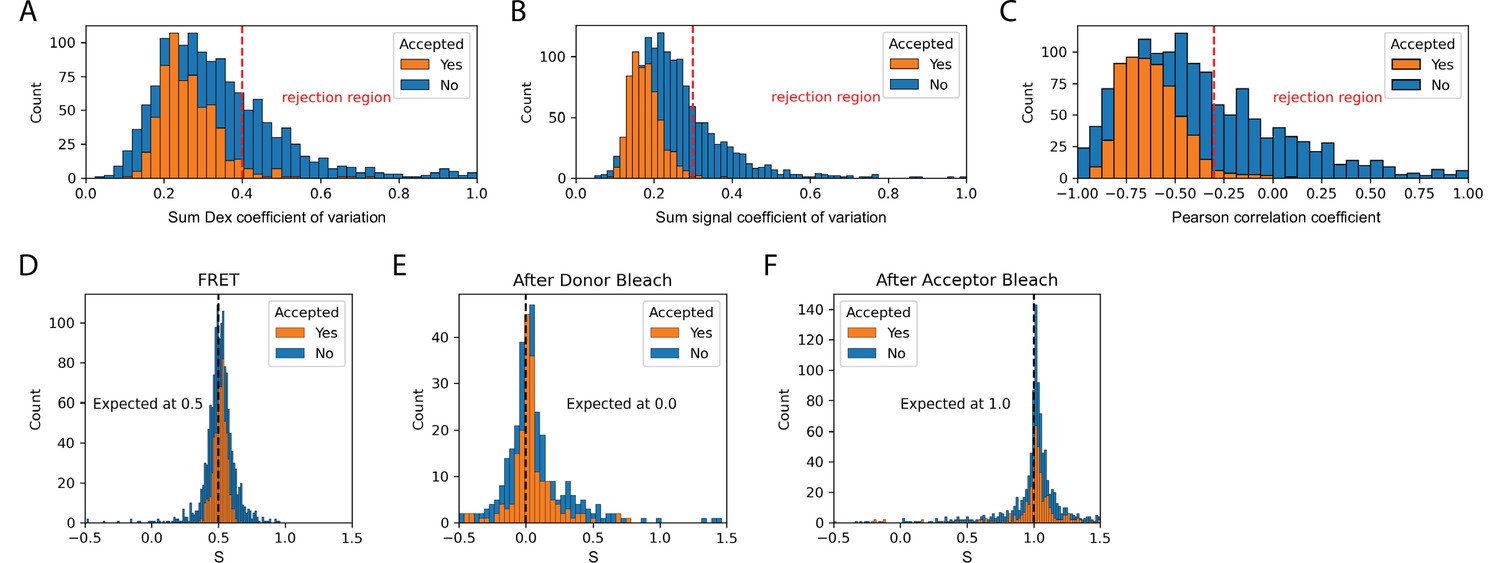
Validation of dynamic smFRET.
The set of accepted molecules in the dynamic FRET dataset collected with the Holliday junction substrate exhibit expected smFRET features. The coefficient of variation is the standard deviation divided by the mean and provides a measure of the stability of signals. For the sum of donor signals and all signals it is expected to be constant. The Pearson correlation coefficient provides a measure of the correlation between two signals. This provides a measure of anti-correlation between donor and acceptor signals that is expected during FRET. (A) The coefficient of variation of the sum of donor emission (FD|D) and acceptor emission (FA|D) upon donor excitation. (B) The coefficient of variation of the sum of all signals (FD|D, FA|D, and FA|A) should be constant. (C) The Pearson correlation coefficient for donor and acceptor emission upon donor excitation should be negative during FRET. (D) Stoichiometry during FRET. Expected to be 0.5 for one acceptor and one donor. (E) Stoichiometry after donor bleach but before acceptor bleach. Expected to be 0.0 for only acceptor. (F) Stoichiometry after acceptor bleach but before donor bleach. Expected to be 1.0 for only donor. Each histogram provides a comparison of accepted to rejected molecules. Suggested rejection thresholds and expected values are indicated on each plot. The set of accepted molecules exhibits the expected features for valid smFRET.
Figure 6

Workflow for gyrase characterization using flow magnetic tweezers.
(A) Schematic of flow magnetic tweezers (FMT). The projected length of the surface-immobilized DNA molecule attached to a magnetic bead was measured under different flow as well as magnet height and rotation conditions to study changes in DNA topology. (B) Representation of the analysis workflow starting from the raw image stack on the left to the fully analyzed plots on the right. First, positional information is extracted by the Peak Tracker to yield a Single Molecule Archive. Regions assigned to specific parts of the experiment are highlighted in the example trace (‘reversal’, ‘singly tethered’, ‘force’, ‘coiling’, and ‘gyrase reaction’) and are used to calculate different DNA-related properties and parameters. Subsequent classification and tagging allows for easy exploration of subpopulations. The top graph shows the rate distribution (enzymatic cycles/s) found for gyrase activity resolving positive supercoils (orange) and introducing negative supercoils (blue), respectively. The lower graph shows a box plot of the delay between the introduction of the enzyme to the system (T=0) and the observed enzymatic activity. Plots were calculated from 2,406 individual molecules.
Author response image 1
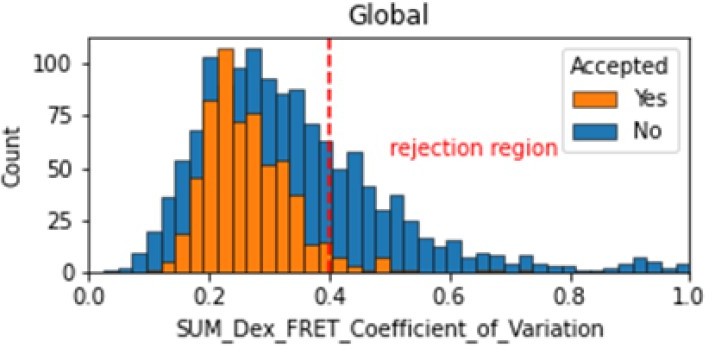
Histogram comparing the Coefficient of Variation of SUM_Dex for Accepted FRET molecules compared to all FRET molecules for the dynamic FRET example.
Lower values reflect valid constant signal. The SUM_Dex can also be plotted and directly inspected using the Mars Rover.
Author response image 2
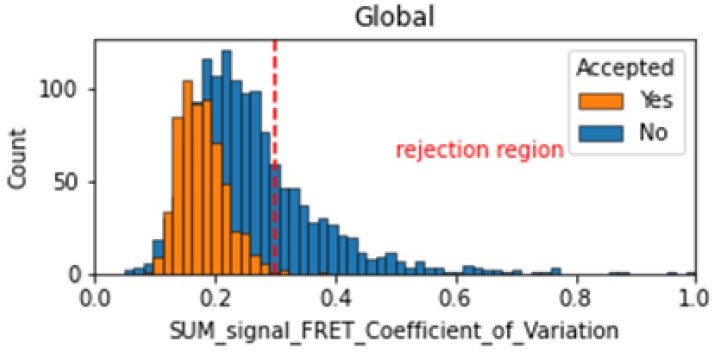
Histogram comparing the Coefficient of Variation of SUM_signal for Accepted FRET molecules compared to all FRET molecules for the dynamic FRET example.
Lower values reflect valid constant signal. The SUM_signal can also be plotted and directly inspected using the Mars Rover.
Author response image 3

Histogram comparing the Pearsons correlation coefficient for donor and acceptor emission during FRET for Accepted FRET molecules compared to all FRET molecules for the dynamic FRET example.
Valid molecules should have strong anti-correlation as seen for the accepted molecules.
Author response image 4
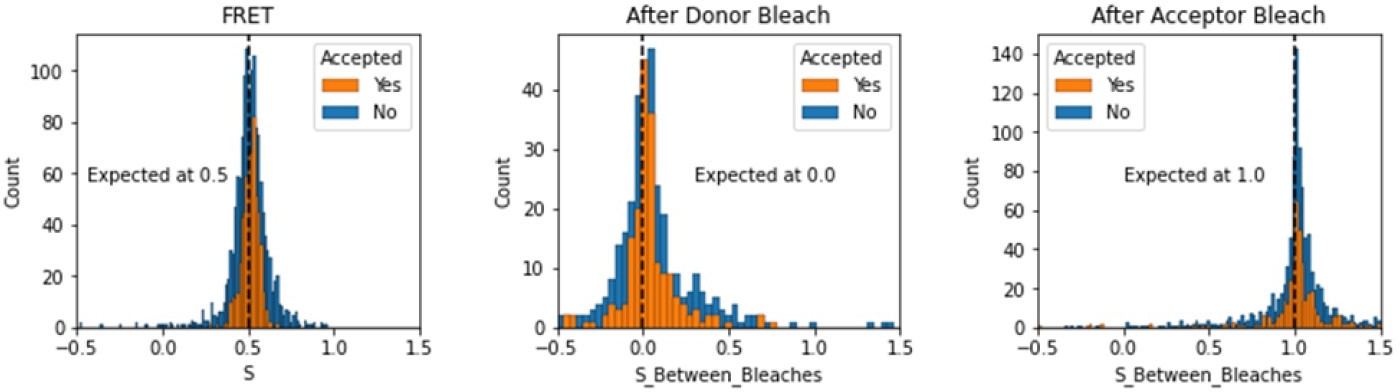
Histograms comparing stoichiometry values for FRET, donor bleaches first, or acceptor bleaches first for Accepted FRET molecules compared to all FRET molecules for the dynamic FRET example.
Regions in between dye bleach events are often very short leading to broader distributions.
Tables
Table 1
Mars commands.
Description of Fiji/ImageJ2 commands supporting the analysis of image-derived biomolecule data in Mars. Detailed documentation can be found on the Mars documentation website (https://duderstadt-lab.github.io/mars-docs/).
| Command | Description |
|---|---|
| Image | |
| Peak Finder | Finds high-intensity pixel clusters (peaks) in an image. Additionally, the sub-pixel position can be determined utilizing a 2D Gaussian fit. |
| DNA Finder | Finds vertically aligned DNA molecules in an image. Additionally, the sub-pixel position of both ends of the molecule can be determined utilizing a 2D Gaussian fit. |
| Peak Tracker | Finds, fits, and tracks peaks in images. |
| Object Tracker | Identifies unspecified objects in images utilizing classification by segmentation and tracks their center of mass. |
| Molecule Integrator | Integrates the intensity of a peak over all frames. |
| Molecule Integrator (multiview) | Integrates the intensity of a peak over all frames in an image stack with multiview images. |
| Beam Profile Corrector | Corrects for the beam profile-generated image intensity deviations. |
| Gradient Calculator | Calculates the gradient of consecutive pixels from top to bottom or from left to right to identify long linear objects such as DNA molecules. |
| Overlay channels | Combines several individual videos into one creating a single video with the information stored along the ‘Channel (C)’ dimension. |
| Molecule | |
| Open Archive | Opens a Molecule Archive. |
| Open Virtual Store | Opens a virtual Molecule Archive. |
| Build Archive from Table | Converts an opened table with a ‘molecule’ index column into a Molecule Archive. |
| Build DNA Archive | Builds a DNA Molecule Archive from a single Molecule Archive and a list of DNA ROIs in the ROI Manager. It uses the location of the DNA molecules to search for molecules in the single Molecule Archive that overlap with (parts of) this location. |
| Merge Archives | Merges multiple Molecule Archives (placed in a single folder) into one. |
| Merge Virtual Stores | Merges multiple virtual Molecule Archives (placed in a single folder) into one. |
| Add Time | Adds a column to the molecule tables to convert time points (T) to real time values as specified in the metadata or by a user-defined time increment. |
| Drift Corrector | Calculates and corrects for the sample drift given a Molecule Archive and a tag corresponding to all immobile molecules in the dataset. Generates new columns for each molecule table. |
| Region Difference Calculator | Calculates the difference between the regions specified for all molecules in the Molecule Archive and adds the outcome as a molecule parameter. |
| Variance Calculator | Calculates the variance on a specified molecule table column and adds the outcome as a molecule parameter. |
| Table | |
| Open Table | Imports a comma or tab-delimited table to the MarsTable format. |
| Sort | Sorts a MarsTable based on values in a specified column. |
| Filter | Filters the rows of a MarsTable based on the specified criteria. |
| Import IJ1 Table | Imports any ImageJ1 table to the MarsTable format. |
| Import TableDisplay | Imports any SciJava table to the MarsTable format. |
| KCP | |
| Change Point Finder | Detects linear regions or steps in single-molecule traces. This command generates molecule segments tables listing endpoints and fits for linear regions. |
| Single Change Point Finder | Detects a single change point in a single-molecule trace. The output is a segments table with the end points and fit or the position. |
| Sigma Calculator | Calculates the error value in a specific region of interest in all single-molecule traces that can be used as input for the change point calculation commands. |
| ROI | |
| Transform ROIs | Transforms peak ROIs from one region of a multiview image to another. |
| Import | |
| LUMICKS h5 | Opens optical tweezer data in HDF5 (h5 file extension) format collected using a LUMICKS instrument and converts the data to Molecule Archive format. |
| Single-molecule dataset (SMD) | Opens SMD files in plaintext json format and converts the data to Molecule Archive format. |
Additional files
Download links
A two-part list of links to download the article, or parts of the article, in various formats.
Downloads (link to download the article as PDF)
Open citations (links to open the citations from this article in various online reference manager services)
Cite this article (links to download the citations from this article in formats compatible with various reference manager tools)
Mars, a molecule archive suite for reproducible analysis and reporting of single-molecule properties from bioimages
eLife 11:e75899.
https://doi.org/10.7554/eLife.75899


