Meisosomes, folded membrane microdomains between the apical extracellular matrix and epidermis
- Aix Marseille Univ, INSERM, CNRS, CIML, Turing Centre for Living Systems, France
- Aix Marseille Université, CNRS, IBDM, Turing Centre for Living Systems, France
- Department of Computer Science, University College London, United Kingdom
- Bio3/Bioinformatics and Molecular Genetics, Albert-Ludwigs-University, Germany
- Department of Biology, Queens College and the Graduate Center, CUNY, United States
- INM, Institut des Neurosciences de Montpellier, Plateau de microscopie électronique, INSERM, Université de Montpellier, France
- Department of Neuroscience, Albert Einstein College of Medicine, United States
Figures
Figure 1 with 3 supplements
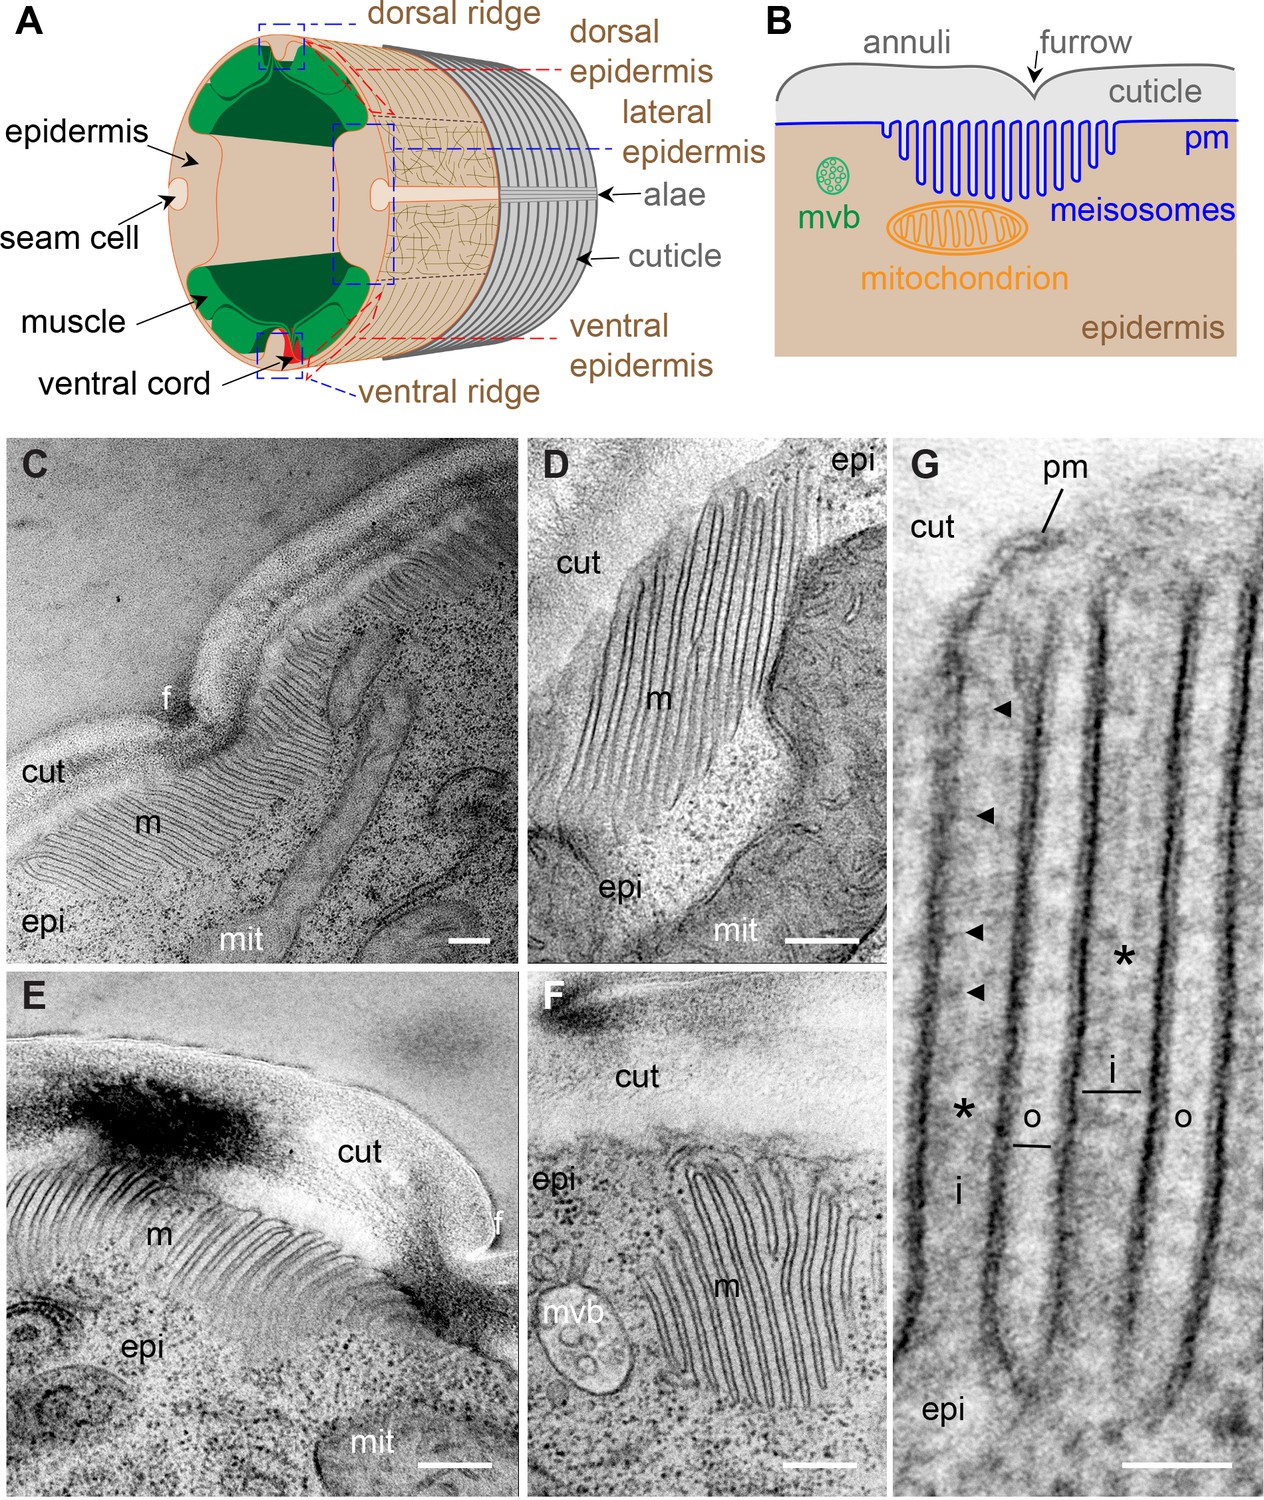
Meisosomes are membrane-folded structures on the apical side of the lateral epidermis.
(A) Schematic view of the outer tissues of an adult C. elegans worm near the mid-body. The different regions of the epidermis containing meisosomes are boxed in blue (lateral, and dorsal and ventral ridges), the regions above the muscles that are extremely thin are boxed in red. (B) Schematic view of the connection between the cuticle and the plasma membrane (pm) of the lateral epidermis highlighting the position of meisosomes relative to multivesicular bodies (mvb) and mitochondria. (C–G) TEM images of longitudinal sections of young adult wild-type hermaphrodite worms reveal epidermal structures, meisosomes (m), contacting the cuticle (cut), composed of parallel plasma membrane (pm) folds. (C–F) Meisosomes typically comprise less than ten folds, but can have more than 30, as shown in (C) where the meisosome is 4 µm wide, and extends on both sides of a furrow (f). Some folds are apposed to mitochondria (mit) (D), can vary in size and orientation (C–F) and can appear not to be in direct contact with the cuticle in some EM sections (F); scale bar, 200 nm. (G) High-magnification view of plasma membrane (pm) folds. The ‘internal’ folds (i) are 35 nm wide, contain a ribosome-free cytoplasm but ladder-like banding (indicated by the black arrowheads), and are less electron dense in their middle (*). The ‘outer’ folds (o) on the cuticle side are 20 nm wide. Epidermis (epi); scale bar, 50 nm.
Figure 1—figure supplement 1
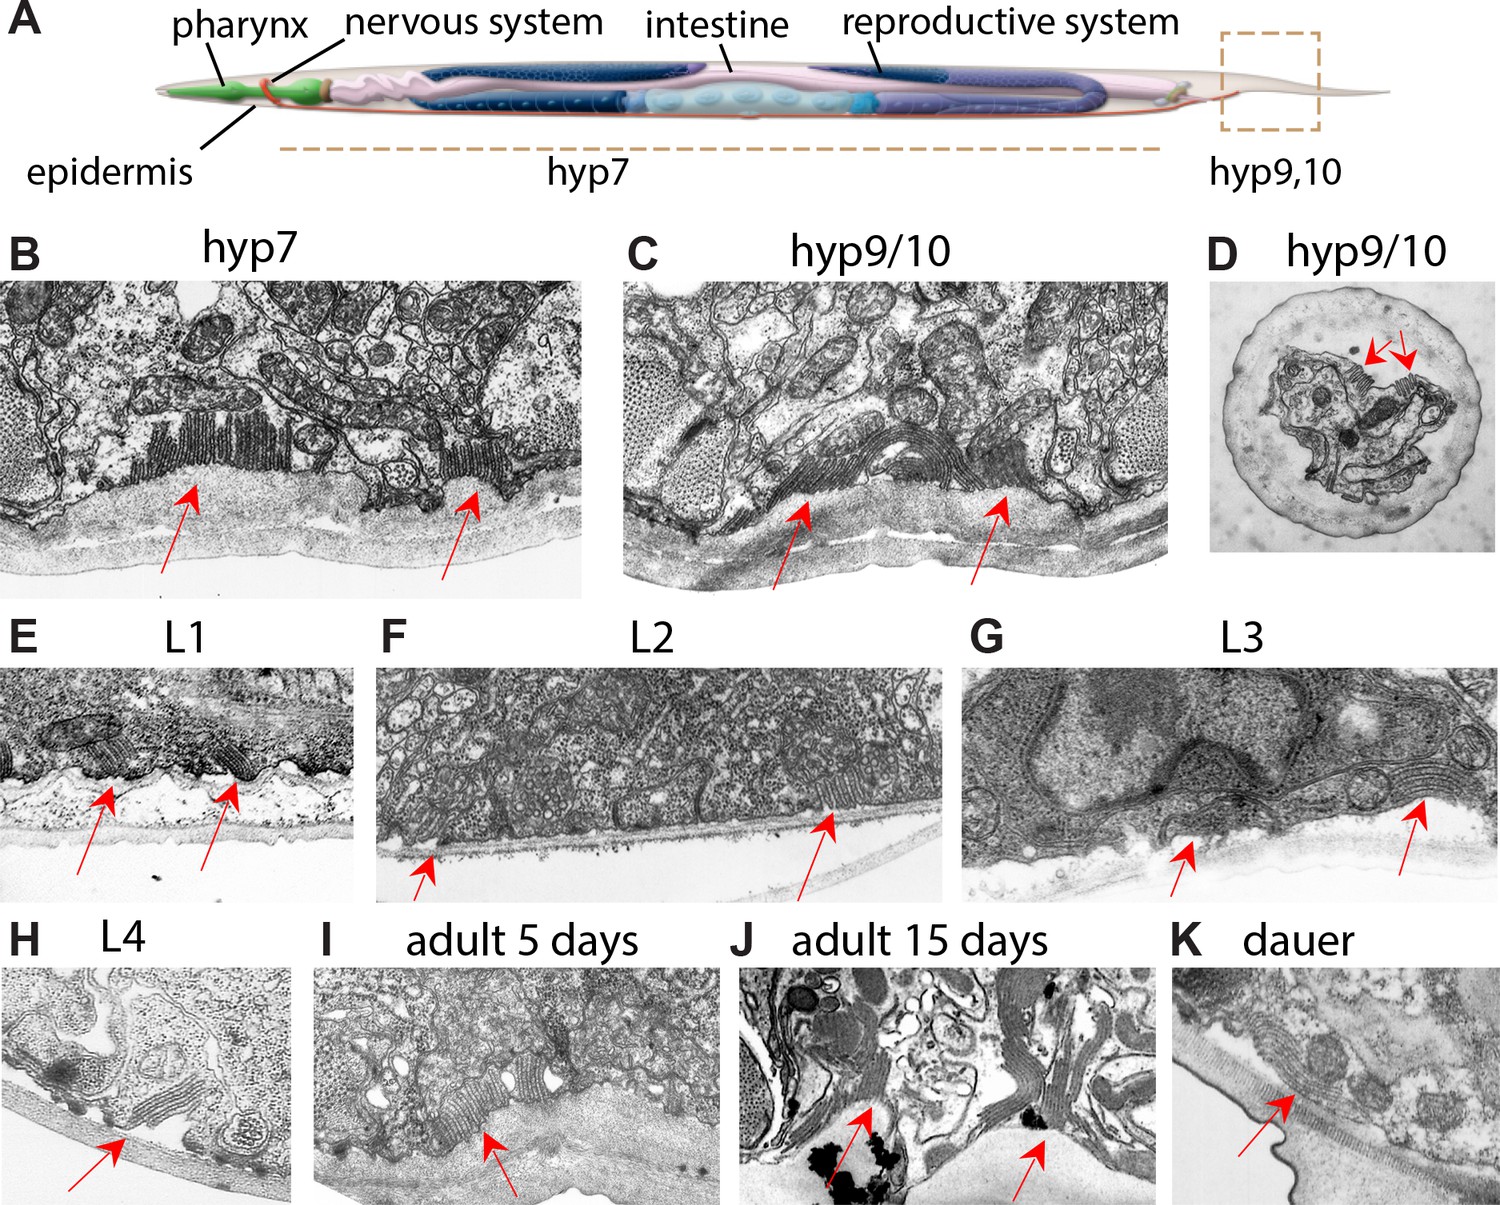
Meisosomes are present in epidermis at all development stages.
(A) Schematic view of the tissues of an adult C. elegans worm. MRC archival transversal TEM images showing that meisosomes (red arrow) are present in different body regions in the epidermis (hyp7, B) and in the tail (hyp9/10, C, D), as well as in different larval stages L1 (E), L2 (F), L3 (G), L4 (H), adult 5 days (I), adult 15 days (J), and dauer stage (K).
Figure 1—figure supplement 2
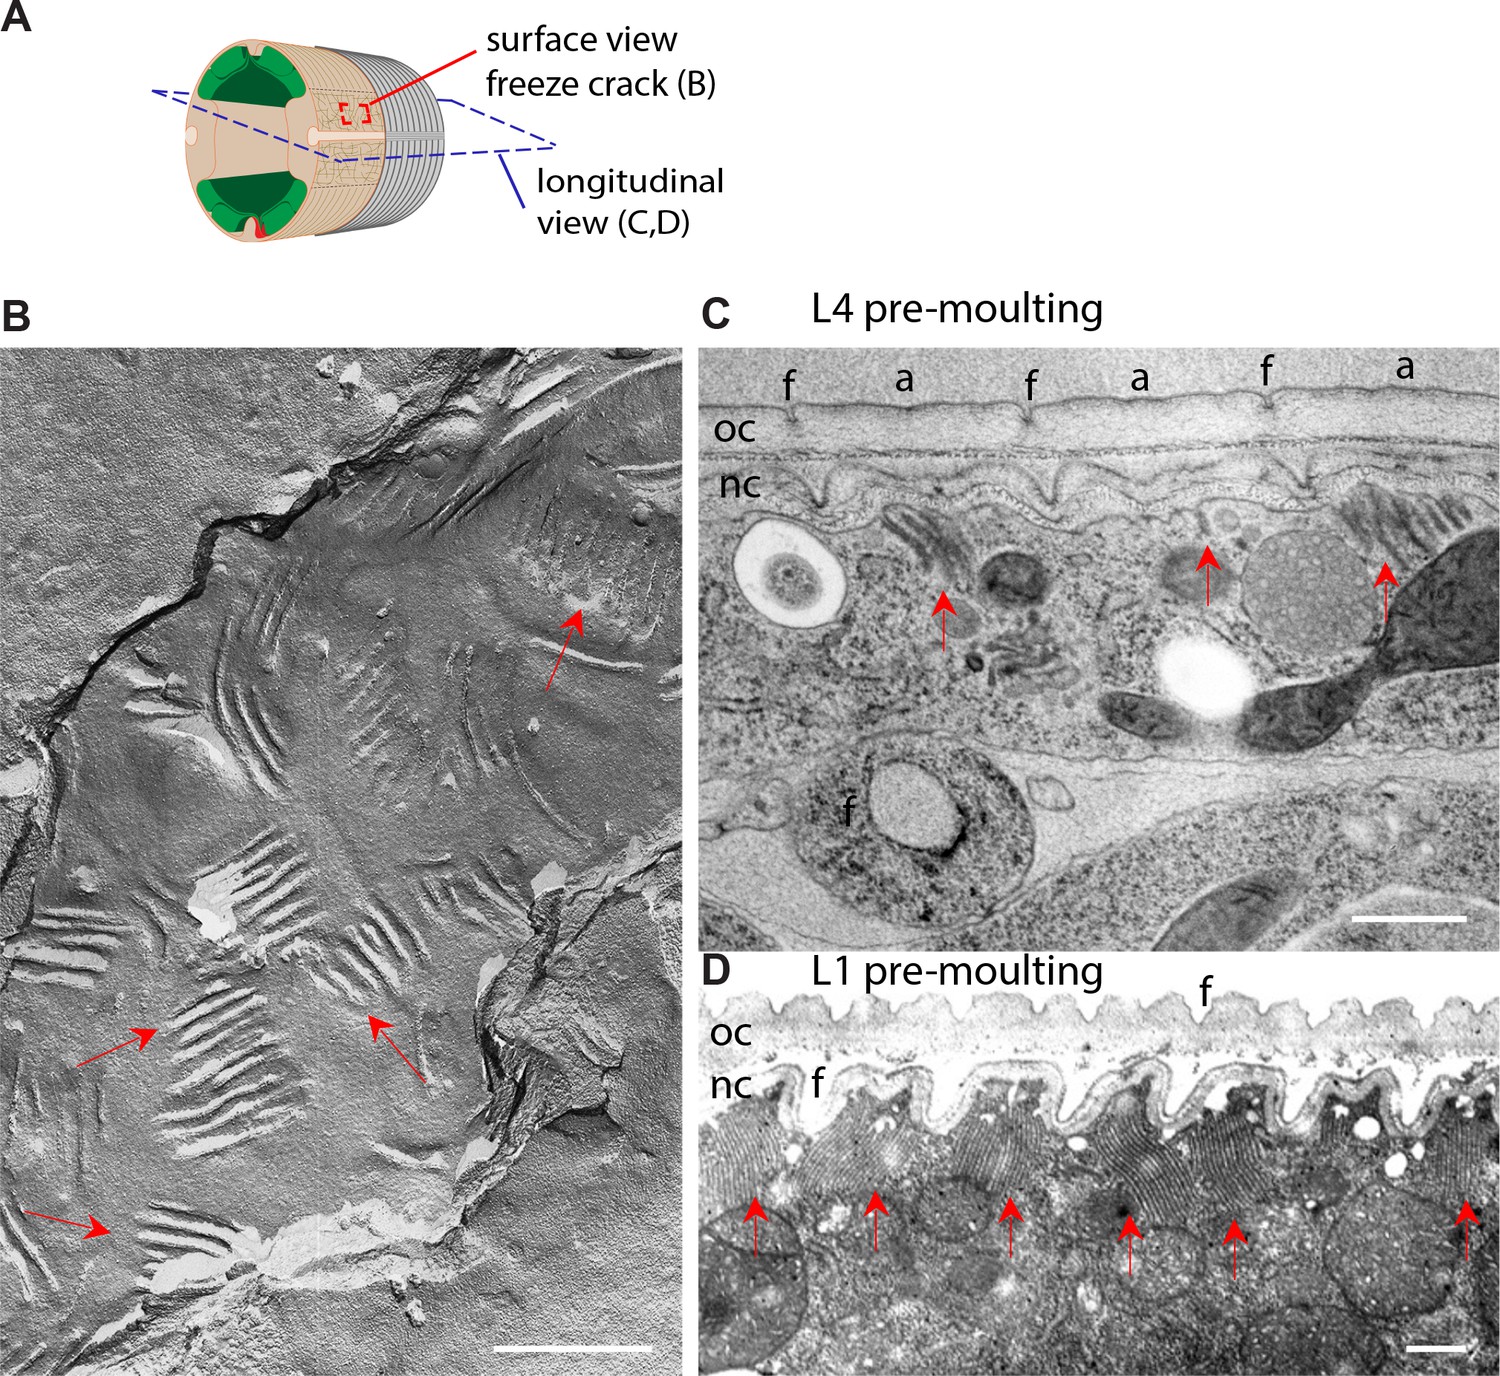
Meisosomes are randomly orientated except before moulting.
(A) Schematic view of the outer tissues of an adult C. elegans worm near the mid-body. The plane of longitudinal EM sections and the en face view obtained by freeze fracture are shown in blue and red dotted lines, respectively. (B) Freeze fracture view of adult epidermal plasma membrane (anterior to the top right) shows meisosome with random orientation vs the body axis, highlighted by red arrows. MRC archival image. (C, D) Lengthwise TEM view of the epidermis at pre-moult stages reveals an alignment of meisosomes in between the position of the furrows (f) facing the annuli (a) of the newly synthesised cuticle (nc), while the old cuticle (oc) lies to the outside, on its way to be shed. (C) Late L4 stage, scale bar, 500 nm. (D) Late L1 stage, MRC archival image, scale bar, 1 µm.
Figure 1—figure supplement 3
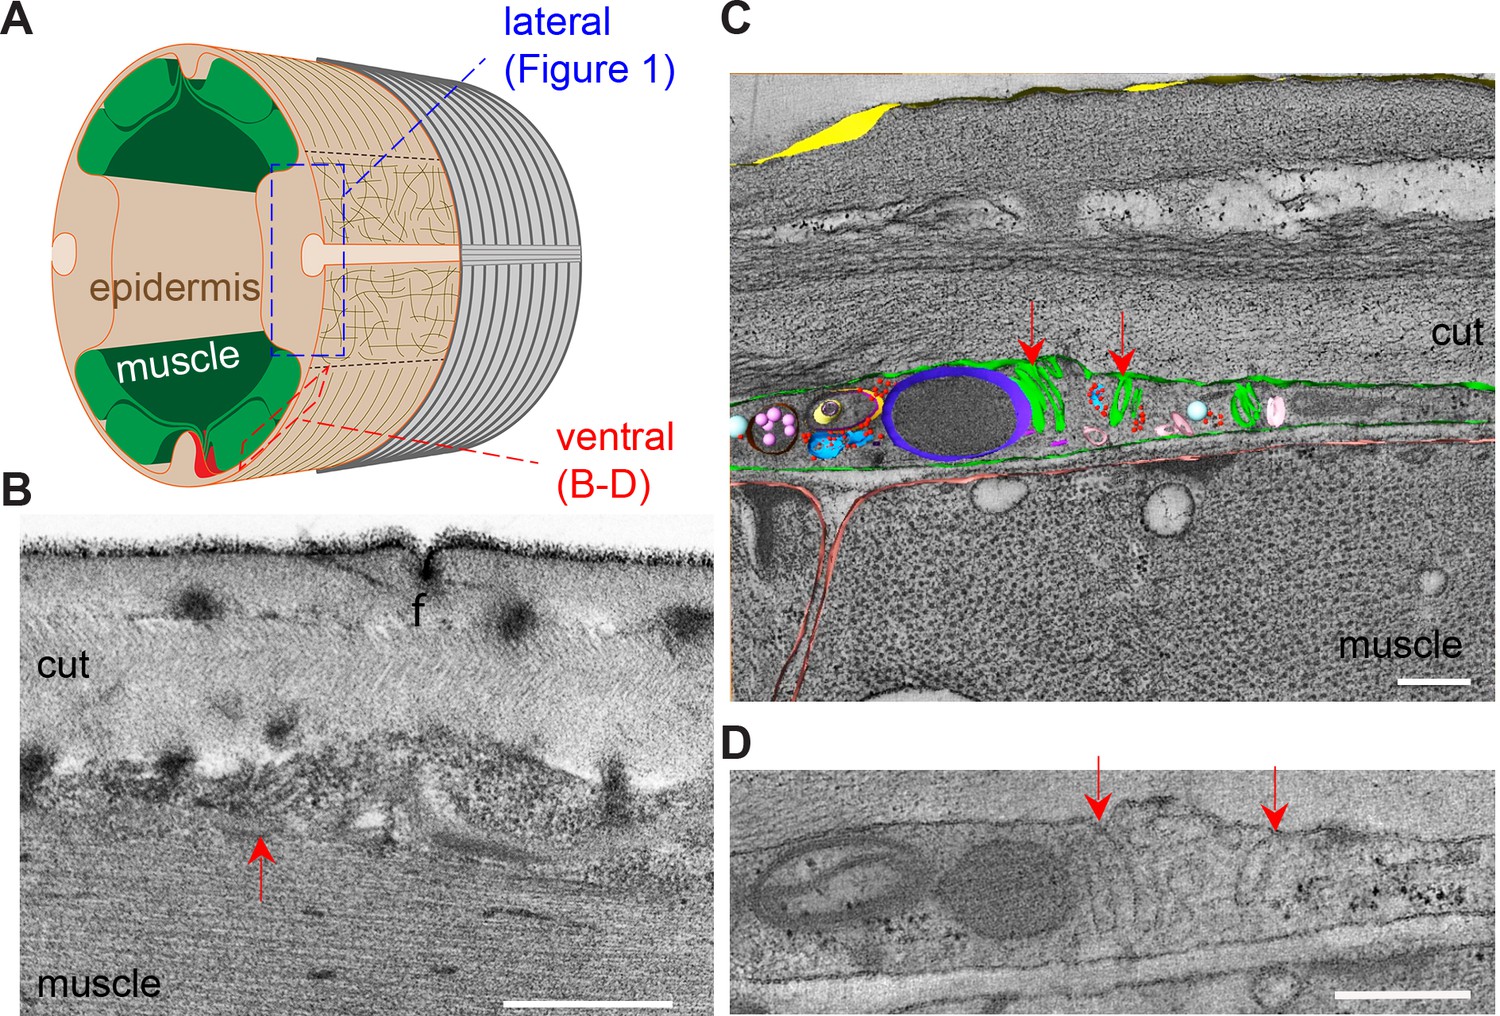
Smaller meisosomes can be found over the muscle quadrants.
(A) Schematic view of the outer tissues of an adult C. elegans worm near the mid-body. The different regions of the epidermis analysed are boxed: either the lateral side as in Figure 1 (blue), or the ventral (or dorsal) side overlaying the muscle quadrants (red). (B) TEM image of longitudinal section of young adult wild-type worm reveals small meisosomes in the epidermis above the body-wall muscle; the thickness of the epidermal cell is less than 500 nm at these positions. Scale bar, 500 nm. (C) A tomogram of a transversal section reveals several smaller meisosomes (green) with typically not more than fourfold; other small organelles lie in this region, including multivesicular bodies (pink), ribosomes (red), and a possible small mitochondrion (dark blue). (D) One selected TEM image of the same tomogram, red arrows point to small meisosomes. Scale bars in (C, D), 200 nm.
Figure 2 with 2 supplements
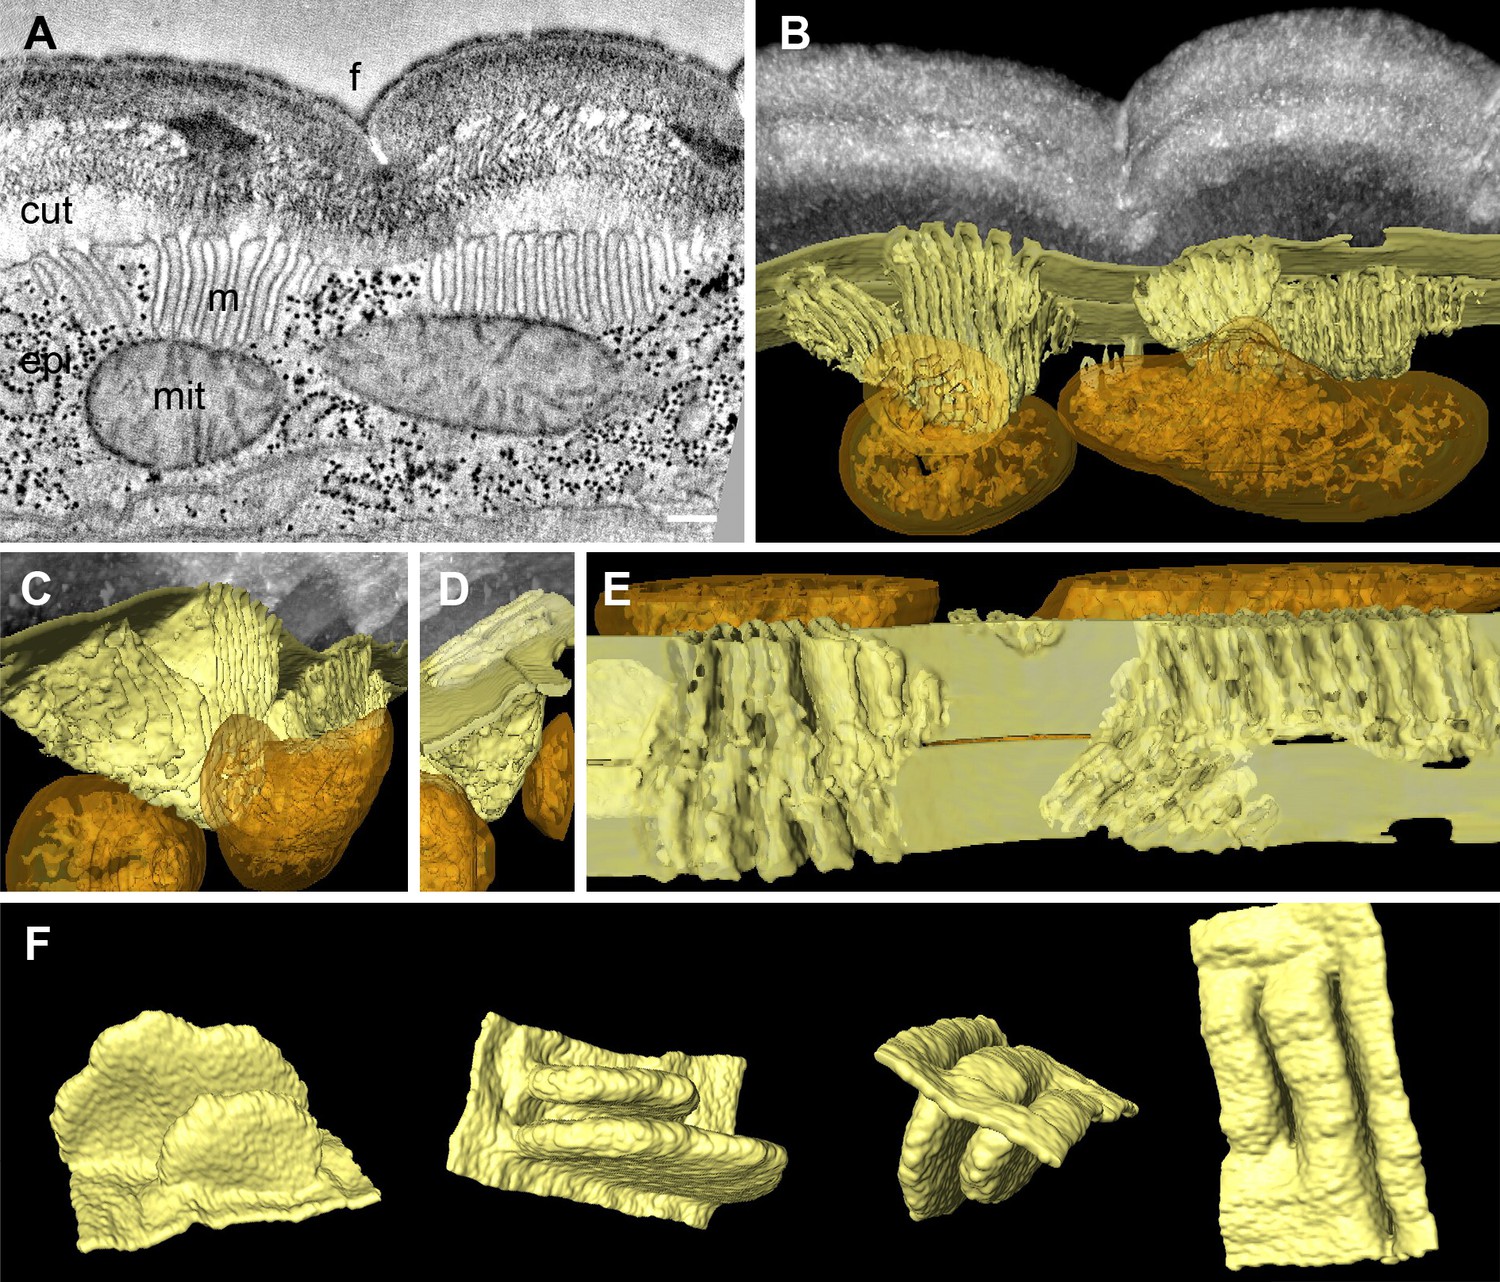
Meisosomes are formed by epidermal plasma membrane facing the apical extracellular matrix (ECM).
Adjacent meisosomes in two serial thick (300 nm) sections were analysed with by electron tomography. (A) Selected virtual image from the serial reconstruction. (B–E) Segmentation of membranes and mitochondria reveal their 3D topology. Meisosomes (in yellow) are in close apposition to, but not in continuity with, mitochondria (orange) and are formed by epidermal plasma membrane folds, as observed in an en face view after removing the cuticle in silico (E). (F) Two folds were extracted and manually filled for a schematic view. Cuticle (cut), epidermis (epi), furrow (f), mitochondria (mit), and meisosomes (m); scale bar, 200 nm.
Figure 2—figure supplement 1
Meisosome distribution by serial block-face scanning electron microscopy (SBF-SEM).
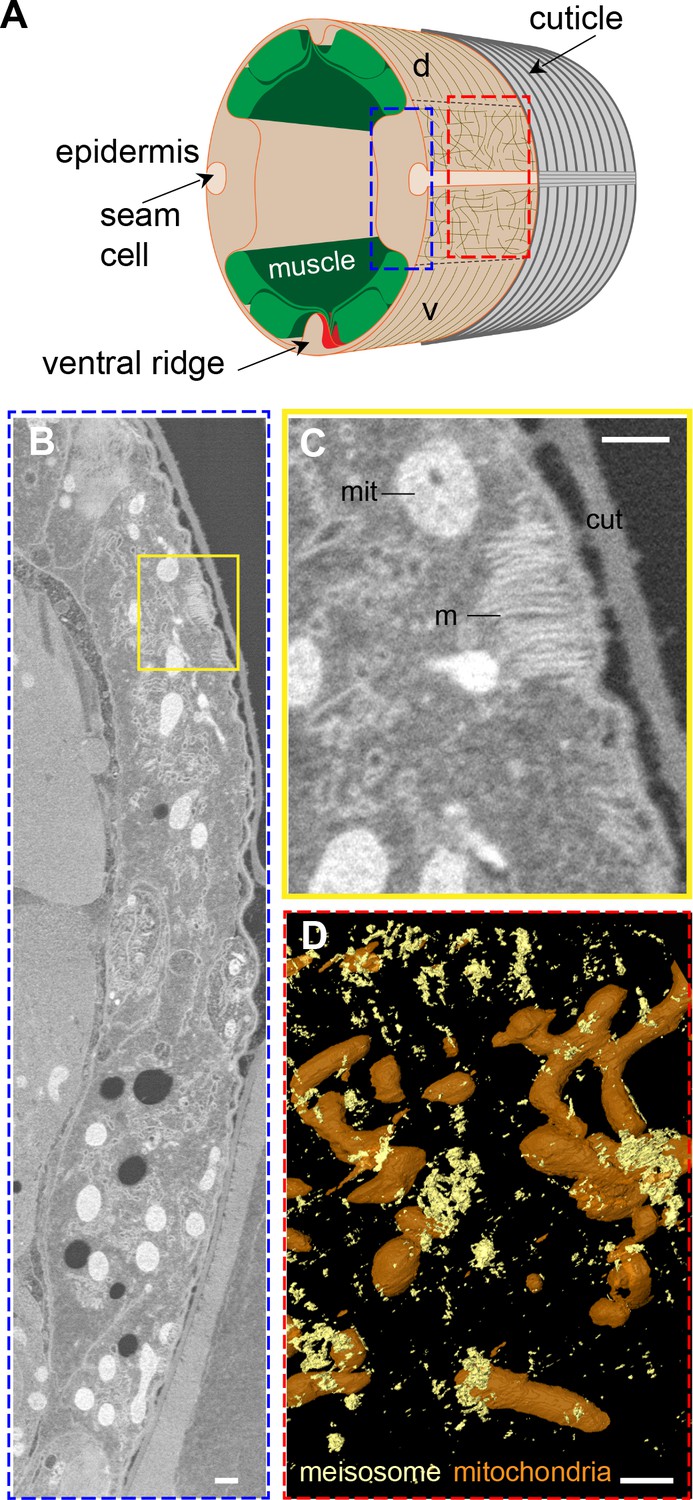
(A) Schematic view of the outer tissues of an adult C. elegans worm near the mid-body. The plane of transverse EM sections and the orthogonal en face view for EM and fluorescence microscopy are indicated with the blue and red dashed rectangles, respectively. (B, C) Representative image from a serial block-face scanning electron microscopy (SBF-SEM) acquisition, the boxed area in (B) is shown at a higher magnification in (C). Scale bar, 500 nm. (D) SBF segmentation and 3D reconstruction revealed the en face spatial distribution of meisosomes (yellow) compared to mitochondria (orange). Scale bar, 1 µm.
Figure 2—video 1
Visualisation of the electron tomography and the 3D segmentation of meisosomes.
Two serial tomograms were stitched and segmentations of the plasma membrane, mitochondria, and cuticle were made (see ‘Materials and methods’ for details). The continuity of the plasma membrane could be revealed by semi-automated segmentation, except under certain orientation due the high membrane curvature of the meisosomes and the missing wedge artefact, which is inherent to electron tomography. At the end of the video, the segmentation of two folds was completed manually to present a schematic view.
Figure 3 with 2 supplements
VHA-5 is a marker of plasma membrane containing meisosomes.
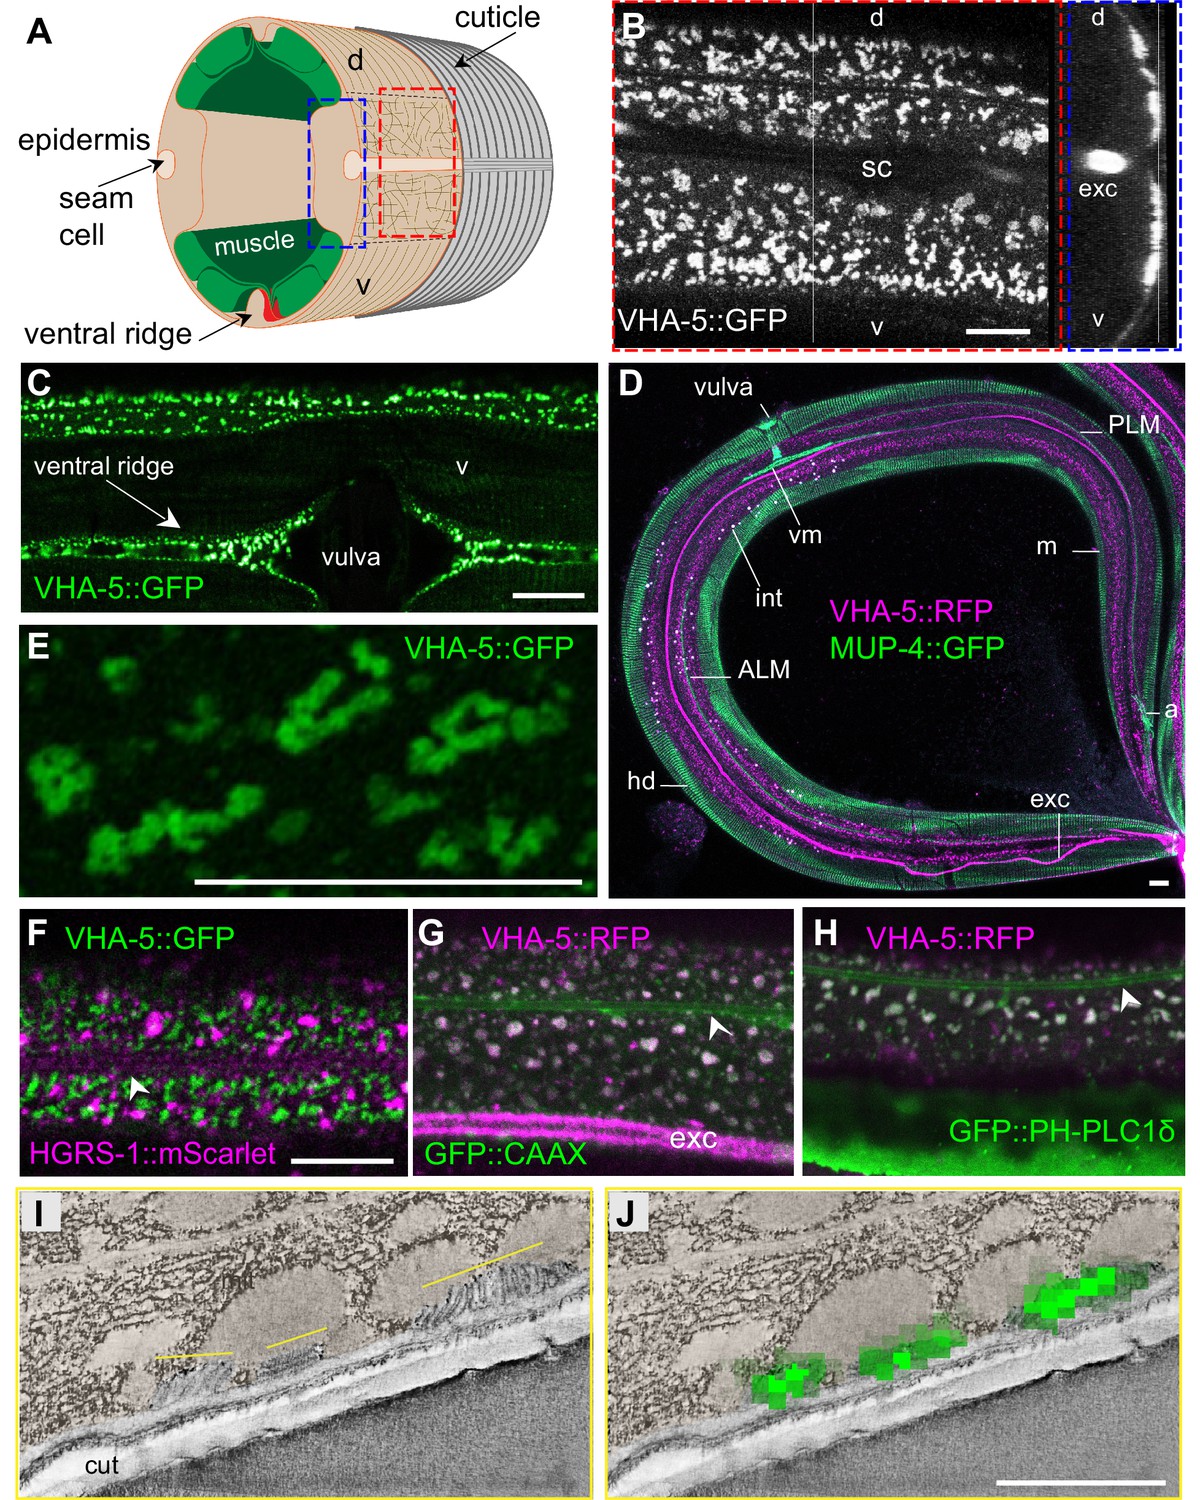
(A) Schematic view of the outer tissues of an adult C. elegans worm near the mid-body, with the boxed en face view (red) or z projection (blue) for fluorescence microscopy. (B–H) Confocal images of young adult worms using different strains expressing either a single copy insertion of VHA-5::GFP under an epidermis promoter [SI], or a classic multi-copy integrated VHA-5::RFP [Is] or extrachromosomal VHA-5::GFP [Ex] transgenic array. (B) In a young adult worm, VHA-5::GFP fluorescence from a multicopy transgene [Ex] is observed in the lateral epidermis, as well as in the excretory canal (exc), but largely excluded from the ventral (v) and dorsal (d) regions above the muscle quadrants, known to contain hemidesmosomes, as well as the region above the seam cell (sc), as observed in en face (left panel), and orthogonal (right) projections of reconstructed confocal stacks. (C) VHA-5::GFP is also expressed in the ventral ridge, as observed in a ventral view. (D) High-resolution imaging on Airyscan mode revealed VHA-5::GFP from a single copy insertion [Si] to be associated with long and convoluted apical membranous structures. (D) Meisosomes (m), visualised using a VHA-5::RFP integrated transgene [Is] (magenta), are complementary with hemidesmosomes (hd) visualised in a MUP-4::GFP KI (green), autofluorescence, in white, is from intestinal granules. Tiled image acquired with the spectral mode z projection of six sections of 1 µm; exc, excretory canal. Attachment of different structures to the epidermis with hd are highlighted: vulval muscles (vm), ALM and PLM neurones, anal muscles (a). (F–H) Confocal images of young adult worms expressing VHA-5::GFP [Ex] (green) together with an HGRS-1::mScarlet marker (magenta) (F), a VHA-5::RFP [Is] (magenta) together with a CAAX::GFP (G) or PH-PLC1δ::GFP marker (green) (H); see associated Figure 3—figure supplement 1 for the individual channel as well as the co-localisation quantifications. Scale bar, 10 µm. (I–J) Correlative light electron microscopy (CLEM) aligns the position of three meisosomes revealed by tomography (I) with three spots of VHA-5::GFP signal imaged by confocal imaging (J), see associated Figure 3—figure supplement 2 for the detailed procedure and another example. Epidermis is pseudo-coloured in beige. Scale bar, 1 µm.
Figure 3—figure supplement 1
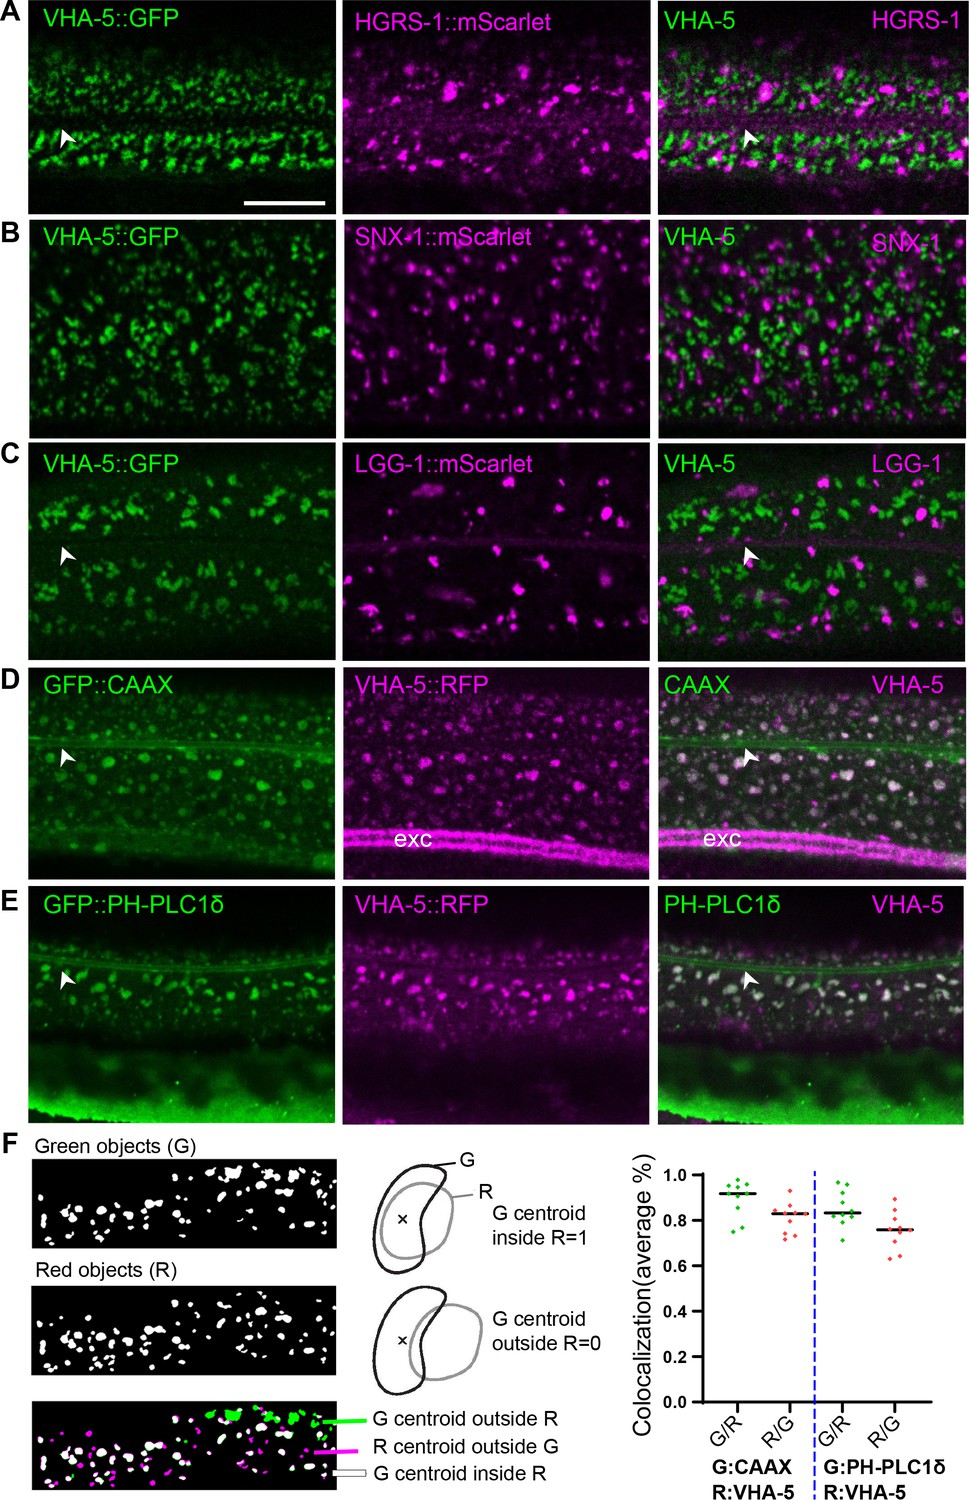
VHA-5::FP co-localise with membrane markers but not with vesicular markers in the epidermis.
(A–C) Confocal images of young adult worms expressing VHA-5::GFP [Ex] (green, left panel) together with an mScarlet marker (magenta, middle panel) in the epidermis; right panel overlay; in (A), HGRS-1, in (B), SNX-1, and in (C), LGG-1. (D, E) Confocal images of young adult worms expressing VHA-5::RFP [Is] (magenta, middle panel) together with a GFP marker (green, left panel) in the epidermis; right panel overlay; in (D), CAAX, and in (E), PH-PLC1δ. Scale bar, 10 µm. (F) Quantification of VHA-5::RFP co-localisation with either the CAAX::GFP or PH-PLC1δ::GFP marker. Segmentation of objects in each channel define green (G) and magenta/red (R) objects (left panels), the G objects whose centroid is located in a R object are represented in white and counted as 1, the G objects whose centroid is located outside a R object are represented in green and counted as 0, the R objects whose centroid is located outside a G object are represented in magenta and counted as 0. The average % of all objects is represented, for each reverse situation, with each dot being an analysed ROI in one worm, n = 10 for each strain.
Figure 3—figure supplement 2

Correlative light electron microscopy (CLEM).
Two different VHA-5::GFP [Si] worms (A–D and E–H) fixed and sliced for TEM were first analysed by confocal imaging where a bright-field view is overlaid with the green GFP signal (A and E). The same preparation was then analysed in TEM at low magnification and both the GFP confocal and the TEM images were aligned using AMIRA (B and F). Then a position with two or three GFP spots was chosen to do a high-magnification tomography TEM acquisition to reveal the meisosomes, two meisosomes (indicated by the thin yellow lines) in (C) correlate with two GFP spots in (D), three meisosomes in (G) correlate with three GFP spots in (H). Scale bar, 1 µm.
Figure 4
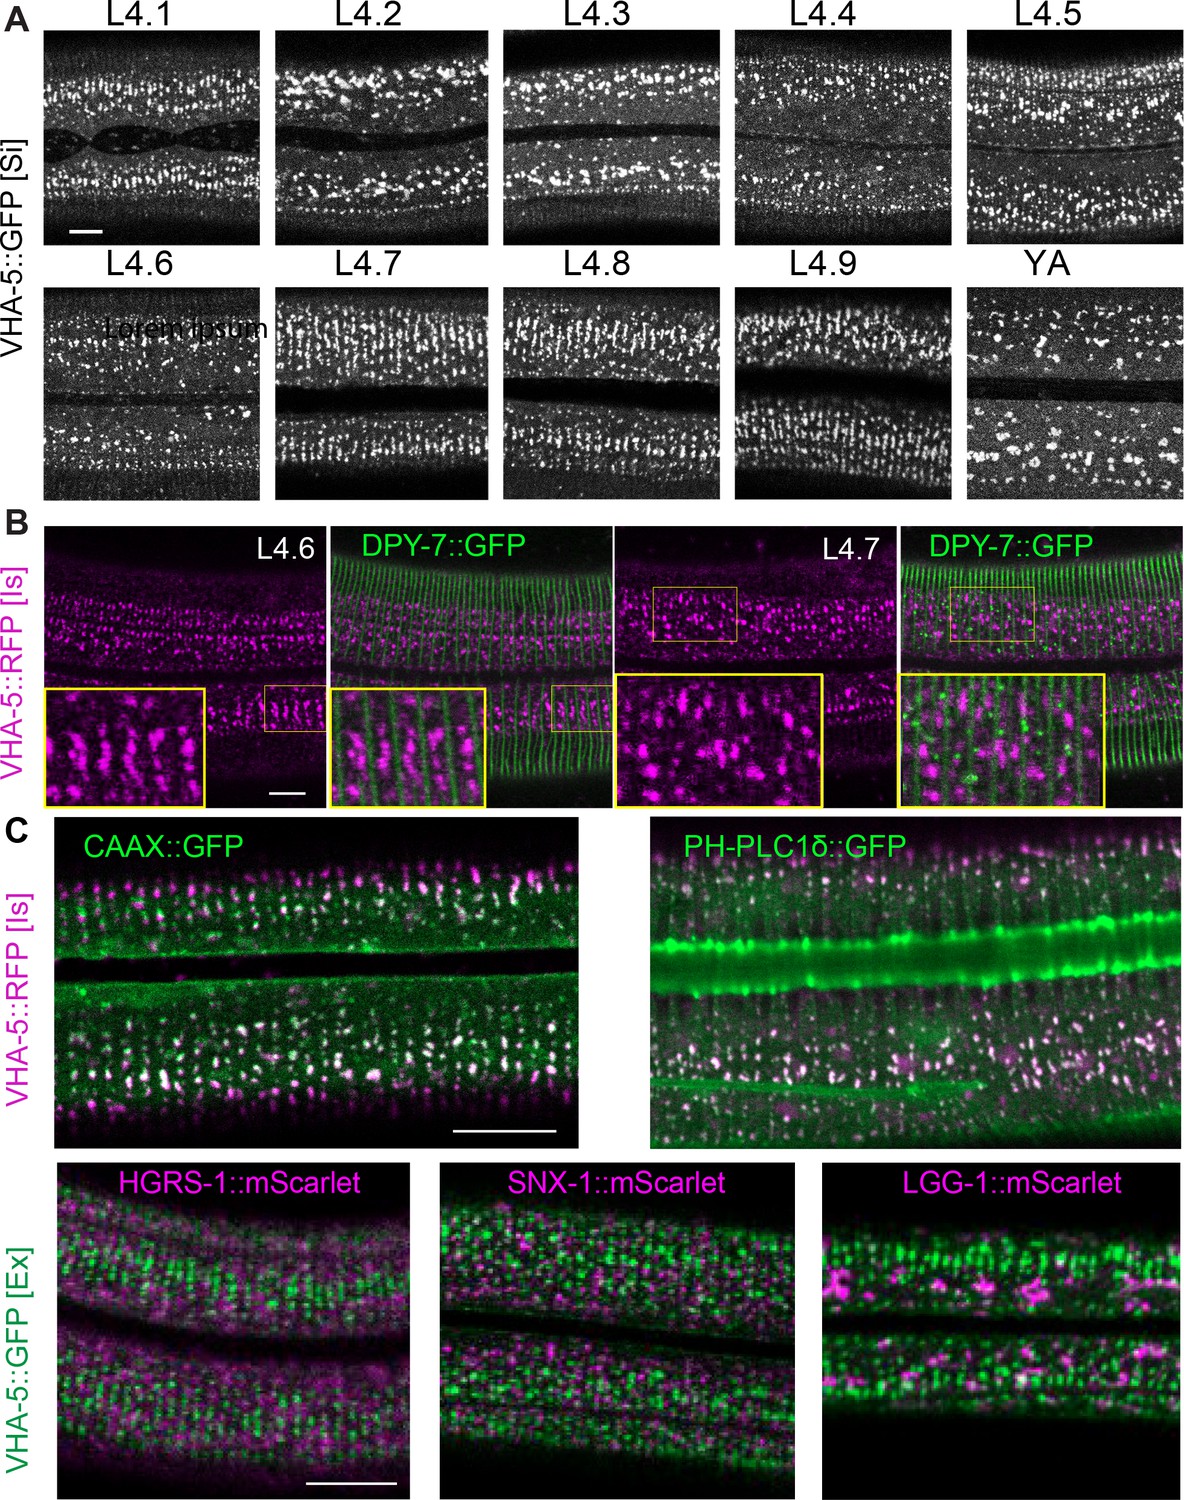
Meisosome aligned in between furrow before moulting.
(A) Confocal images of worms expressing VHA-5::GFP [Si] from early L4 to young adult (YA) stage. To define the precise L4 stage of all observed worms, the vulva was observed and worms classified according to Cohen et al., 2020; Mok et al., 2015. (B) Confocal images of worms expressing both DPY-7::GFP and VHA-5::RFP, RFP channel on the left, merge channel on the right. The inserts show selected regions at a ×1.6 higher magnification. (C) Merged RFP and GFP channel confocal images of lateral epidermis of late L4 worms expressing: upper panel, a VHA-5::RFP [Is] with a CAAX::GFP (left panel) or a PH-PLC1δ::GFP (right panel); lower panel, a HGRS-1::mScarlet (left panel), SNX-1::mScarlet (middle panel) or LGG-1::mScarlet (right panel) with VHA-5::GFP [Ex]. Scale bar, 10 µm.
Figure 5 with 1 supplement
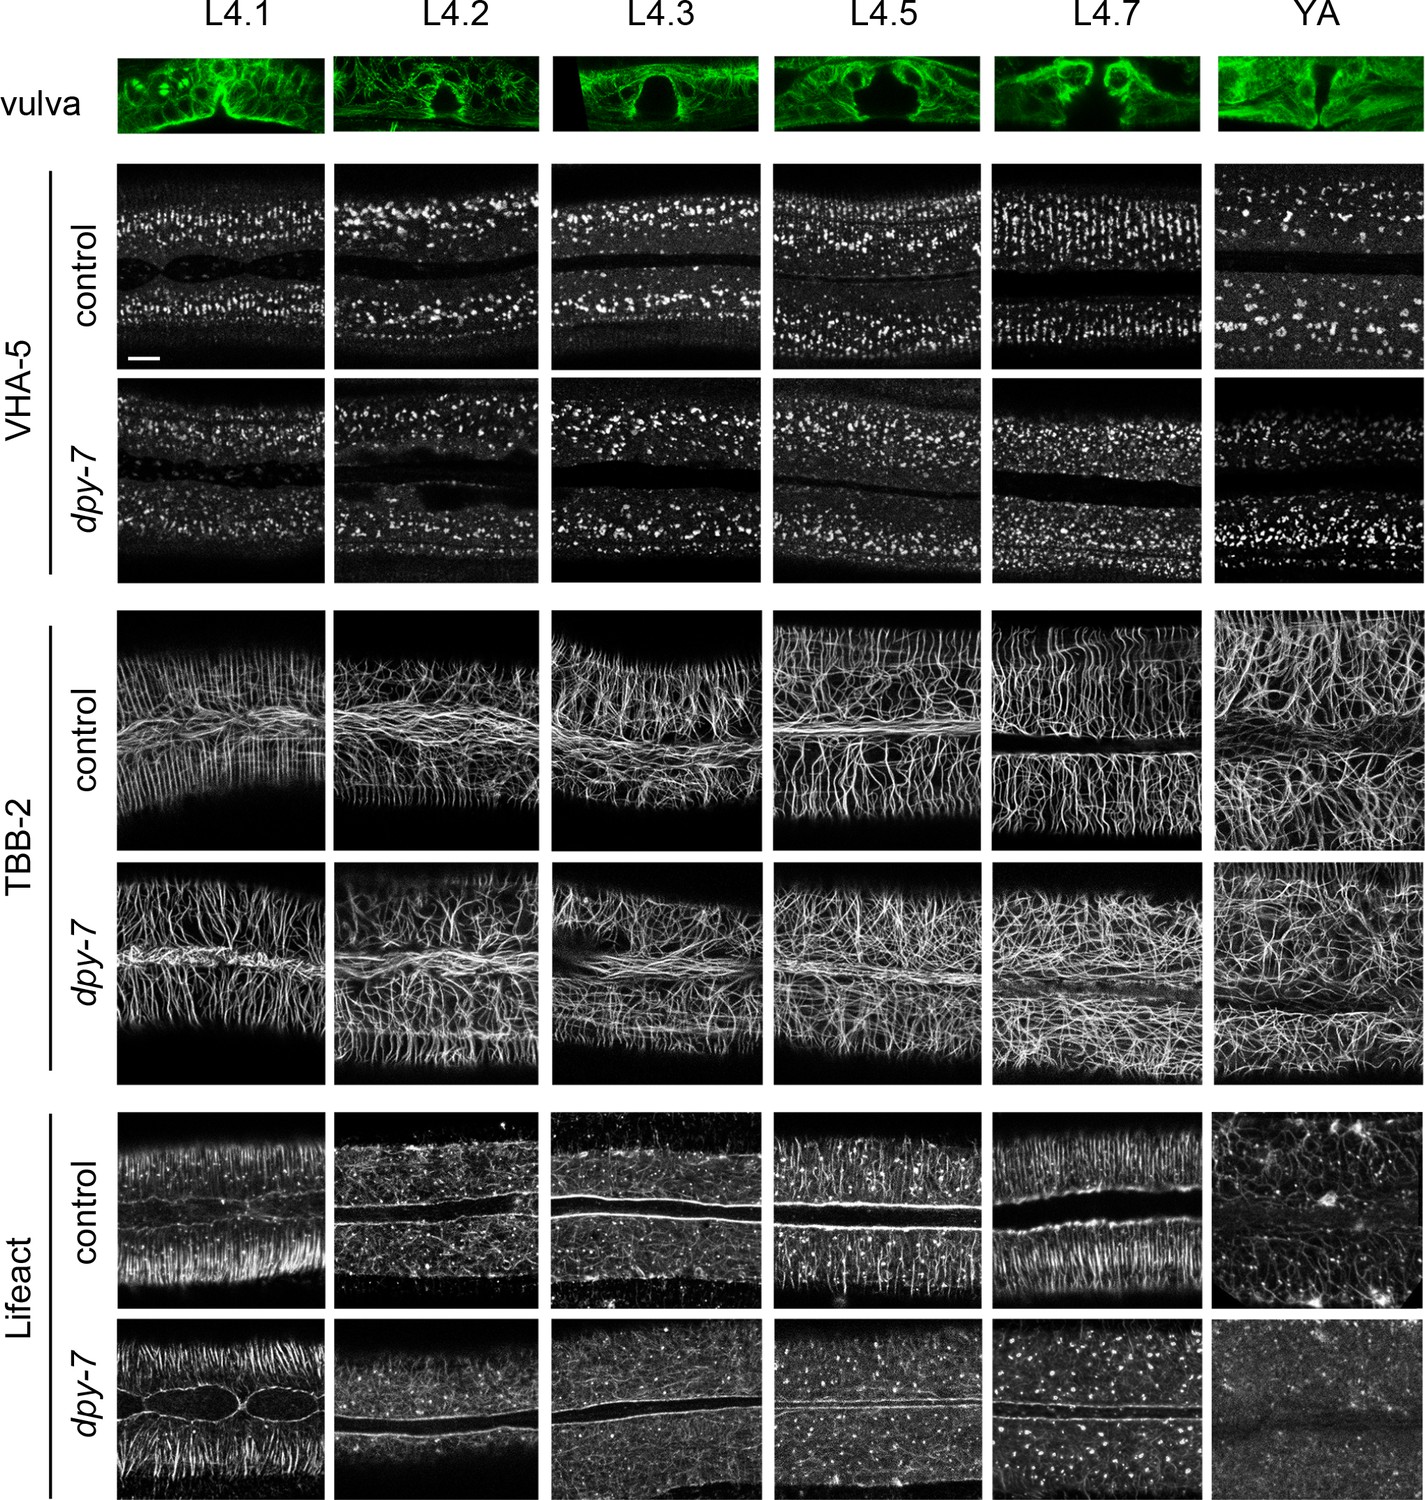
Furrow collagen inactivation provokes a loss of meisosome and cytoskeleton alignment during the L4 stage.
Confocal images of worms expressing VHA-5::GFP [Ex] (upper paired panels), TBB-2::GFP (middle paired panels), and LIFEACT::GFP (lower paired panels) from early L4 to young adult (YA) stage, treated with the control (sta-1) or furrow Dpy (dpy-7) RNAi clones, n > 4. Scale bar, 5 µm. To define the precise L4 stage, the vulva was observed and worms classified according to Cohen et al., 2020. A representative example of the vulva at each stage is shown on the top row in worms expressing the marker TBB-2::GFP.
Figure 5—figure supplement 1

Furrow collagen inactivation provokes a loss of meisosomes alignment during the L4 stage.
(A) Confocal images of worms expressing VHA-5::GFP [KI] at the L4.6 (upper panels) and L4.8 stages (lower panels) treated with a control (sta-1; left panels) or a dpy-7 RNAi (right panels), n > 5. (B) A selection of confocal images of selected regions on the lateral epidermis of late L4 wild-type worms expressing VHA-5::GFP [Ex] and treated with a control RNAi (sta-1; left panels), a dpy-7 RNAi (middle panels) or in a dpy-3(e27) mutant background (right panels). Scale bar, 5 µm.
Figure 6 with 2 supplements
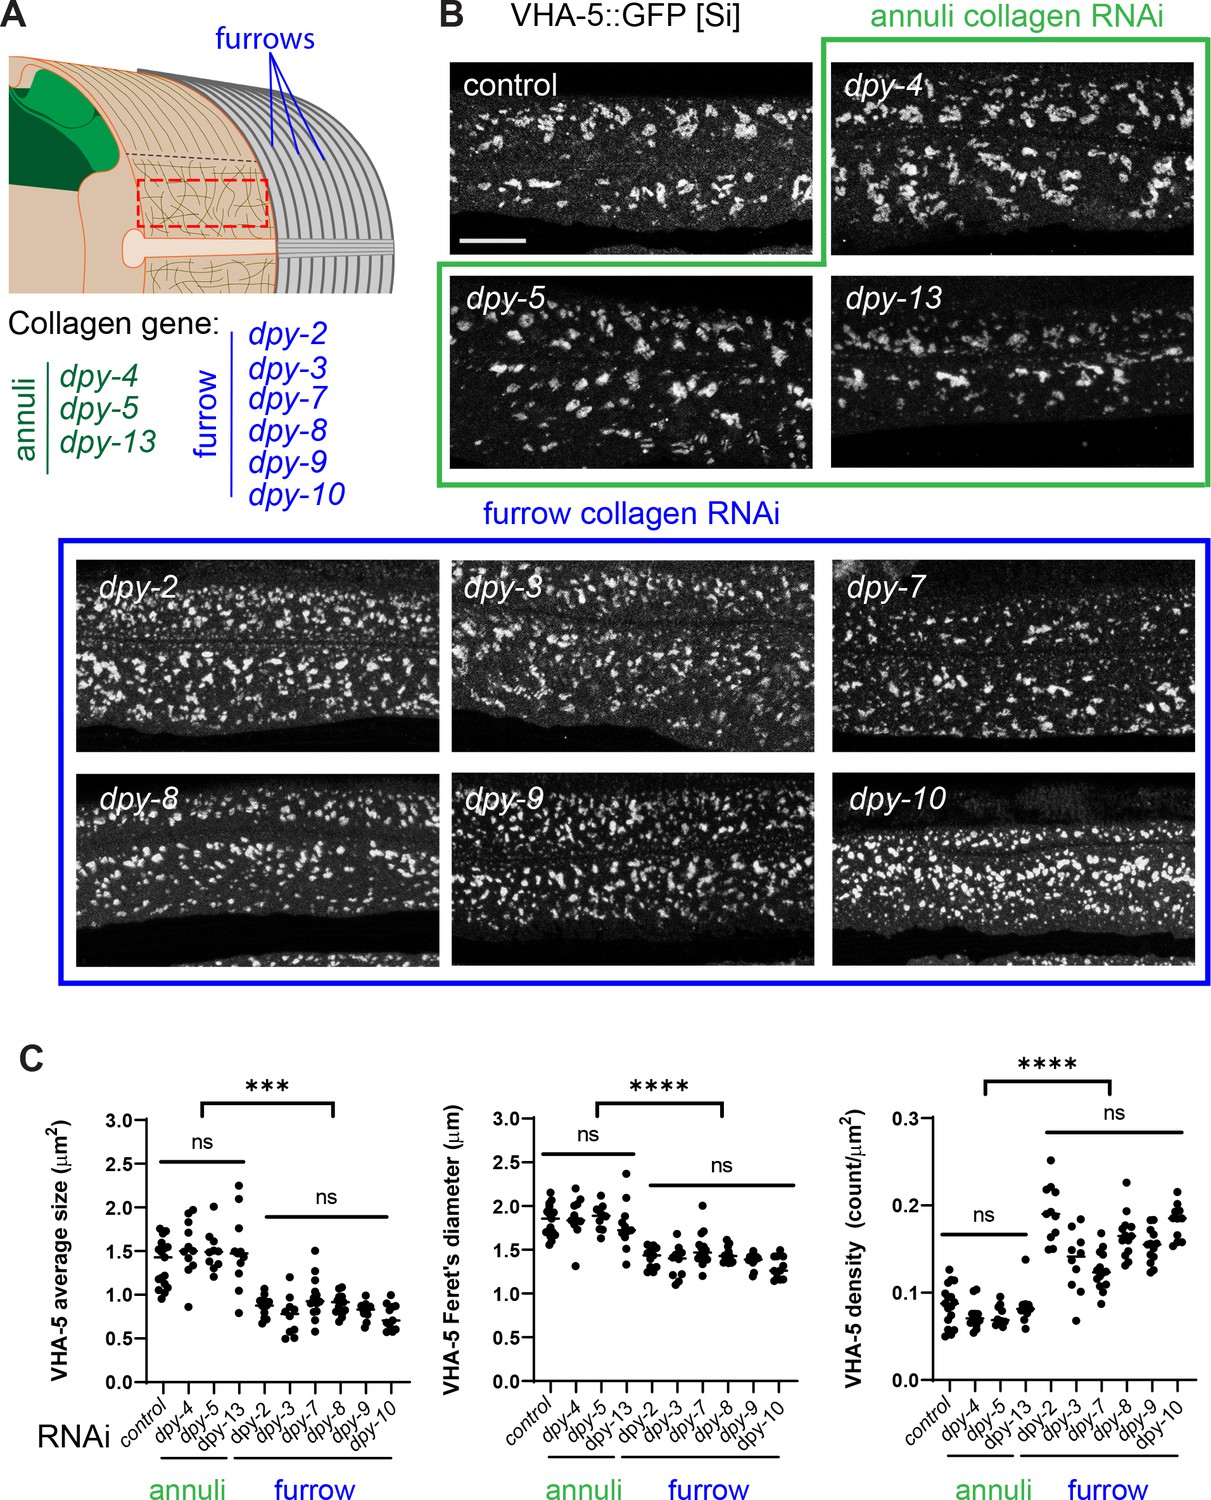
Furrow collagen inactivation provokes meisosome fragmentation.
(A) Schematic view of the outer tissues of an adult C. elegans worm near the mid-body, highlighting the furrows that separate the annuli, the different collagen genes in the annuli (green) or furrow (blue) and indicating the region analysed with the red dashed rectangle. (B, C) L1 larvae expressing VHA-5::GFP [Si] were treated with the indicated RNAi clones and analysed at the young adult stage: control (sta-1), annuli collagens dpy-4, dpy-5 and dpy-13 (green) and the furrow collagens: dpy-2, dpy-3, dpy-7, dpy-8, dpy-9, or dpy-10 (blue). (B) Confocal images of selected regions on the lateral epidermis, at a constant position relative to the vulva, scale bar, 5 µm. (C) Quantification of VHA-5 signal average size, Feret’s diameter and density. All statistics are in Figure 6—source data 1, ****p<0.0001 and ***p<0.001. Control: sta-1 (n = 17), dpy-4 (n = 11), dpy-5 (n = 10), dpy-13 (n = 11); furrow Dpy: dpy-2 (n = 11) dpy-3 (n = 10), dpy-7 (n = 14), dpy-8 (n = 13), dpy-9 (n = 13), or dpy-10 (n = 11).
-
Figure 6—source data 1
Quantification of the fragmentation of the meisosomes.
Using different VHA-5 reporter strains in wild-type and different collagen RNA inactivation or mutants, VHA-5-positive objects were segmented and three parameters were quantified, average size, Feret’s diameter and density; the number of worms, total surface analysed per condition are presented, together with statistical analysis (see ‘Materials and methods’ for details).
- https://cdn.elifesciences.org/articles/75906/elife-75906-fig6-data1-v1.xlsx
Figure 6—figure supplement 1
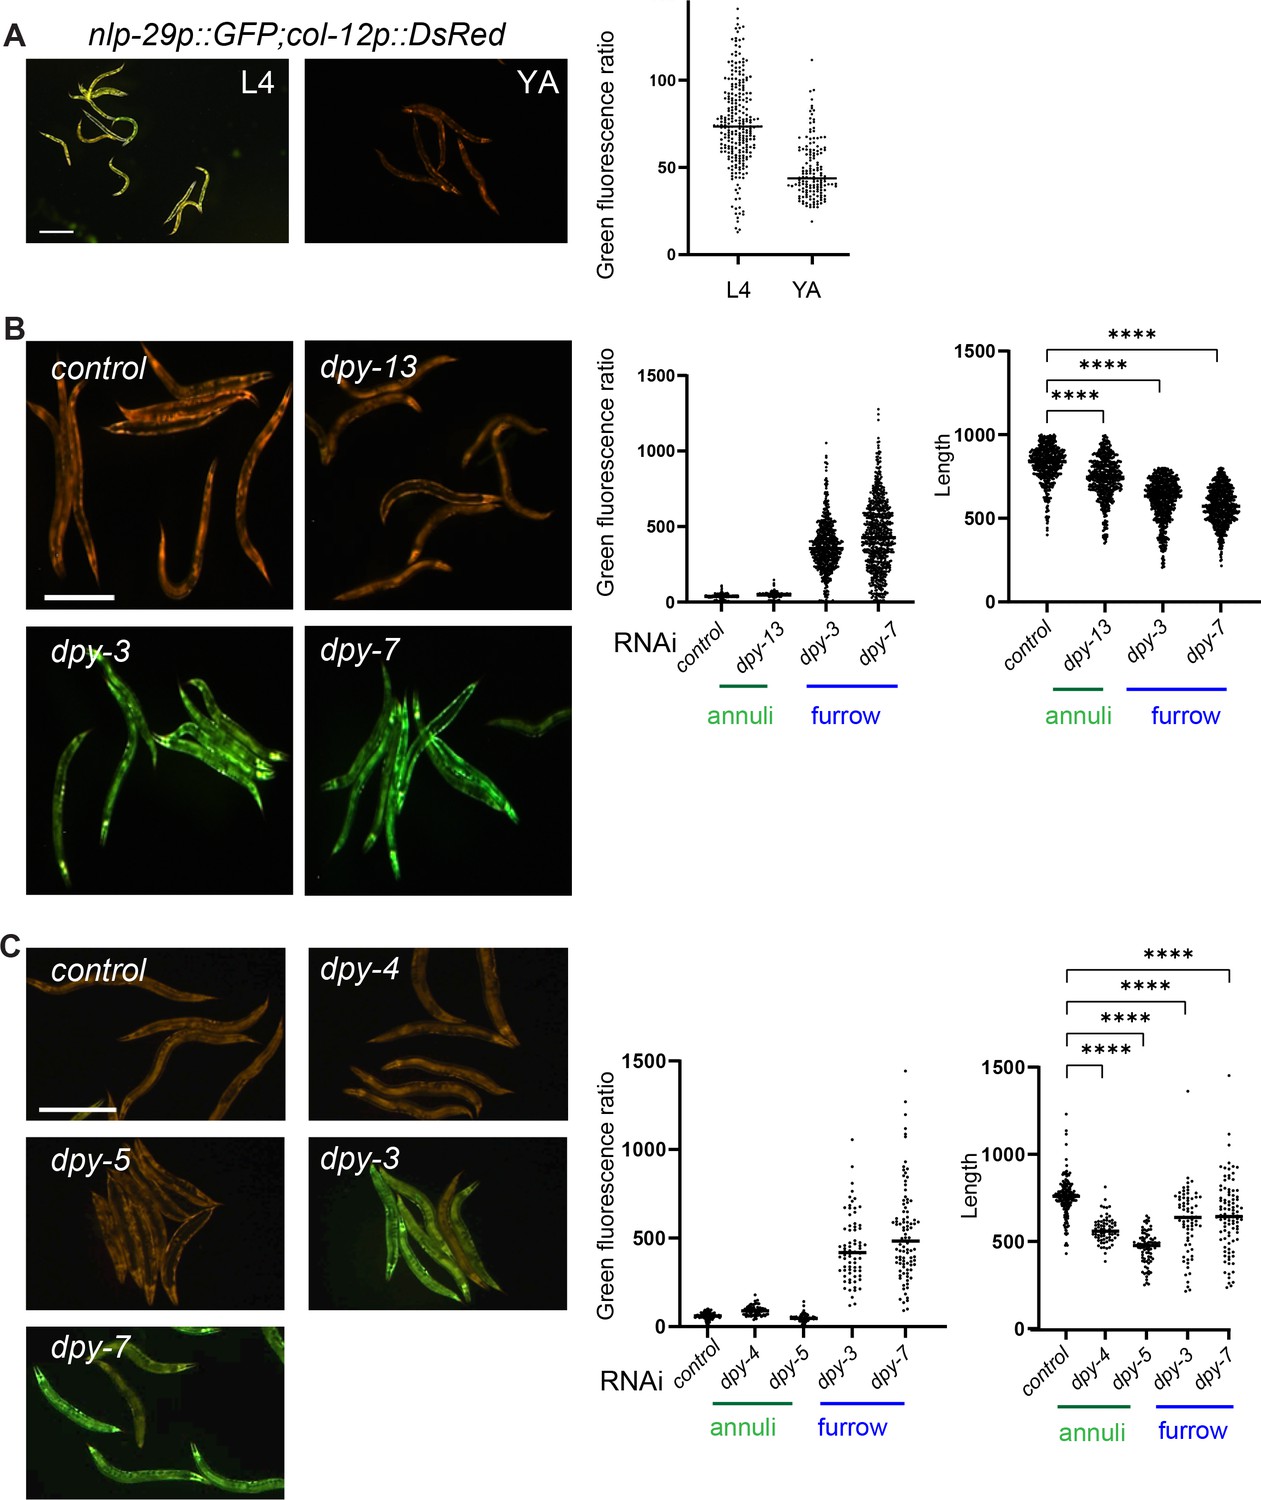
Worms increase AMP gene expression at the late L4 stage and in furrow collagen mutants.
IG274 worms carrying the frIs7 reporter transgene constitutively express the col-12p::DsRed reporter and express nlp-29p::GFP only under certain conditions, red and green fluorescence were visualised simultaneously in all images. (A) Compared to young adults, in late L4 animals entering the moult, the expression of the nlp-29p::GFP reporter is markedly increased. Scale bar, 200 µm (left). Quantification of relative green fluorescence, L4 stage (n = 260), young adult stage (n = 149) (right). (B, C) RNA inactivation of furrow collagen genes leads to the induction of nlp-29p::GFP in young adult worms. Compared to wild-type or annuli Dpy mutants, in furrow Dpy mutants, the expression of the nlp-29p::GFP reporter is markedly increased (left panels). Quantification of relative green fluorescence in worms carrying frIs7 (middle panel) and the length of the worm (right panel). Note that these two phenotypes (induction of the nlp-29p::GFP reporter and short size) serve as controls for the correct inactivation of the selected genes, and were always run in parallel to RNAi inactivation on other reporter strains, as the one used in all Figures 5, 6 and 8. (B) Control: sta-1 (n = 539), dpy-13 (n = 492); furrow Dpy: dpy-3 (n = 680), dpy-7 (n = 688). (C) Control: sta-1 (n = 195), dpy-4 (n = 68), dpy-5 (n = 81); furrow Dpy: dpy-3 (n = 72), or dpy-7 (n = 95).
Figure 6—figure supplement 2
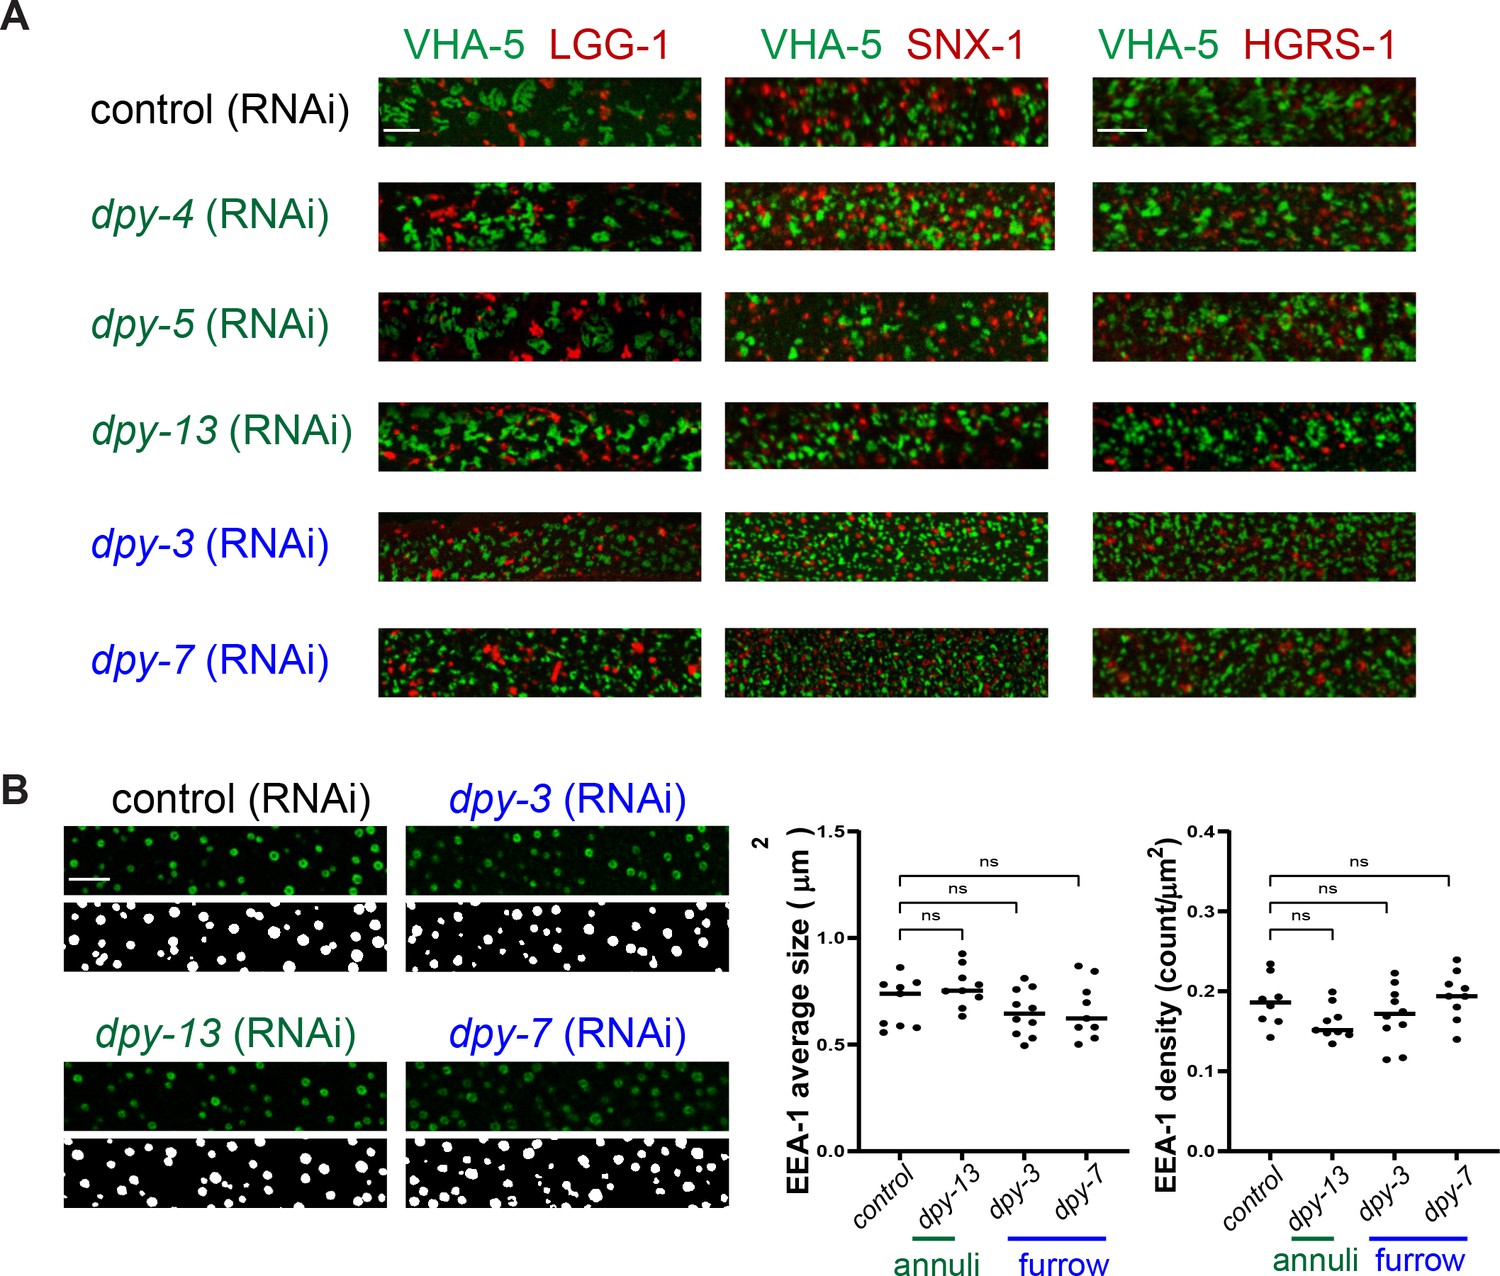
Inactivation of furrow Dpy do not change the VHA-5 relationship to endosomes and MVB, nor affect early endosomes.
(A) Confocal images of selected regions on the lateral epidermis of young adult epidermis expressing LGG-1::mScarlet (left panel), SNX-1::mScarlet (middle panel) or HGRS-1::mScarlet (right panel) with VHA-5::GFP [Ex] and treated with the indicated RNAi clones. Control: sta-1, dpy-4, and dpy-5; furrow Dpy: dpy-3 or dpy-7, n > 7. Scale bar, 5 µm. (B) Confocal images and segmentation views (left panels), with the corresponding quantification (right panels) of selected regions on the lateral epidermis of young adults expressing EEA-1::GFP and treated with the indicated RNAi clones. Scale bar, 5 µm. Control: sta-1 (n = 9), dpy-13 (n = 10); furrow Dpy: dpy-3 (n = 10) or dpy-7 (n = 9).
Figure 7 with 1 supplement
Furrow collagen inactivation leads to smaller and abnormal meisosomes and detachment of the cuticle.
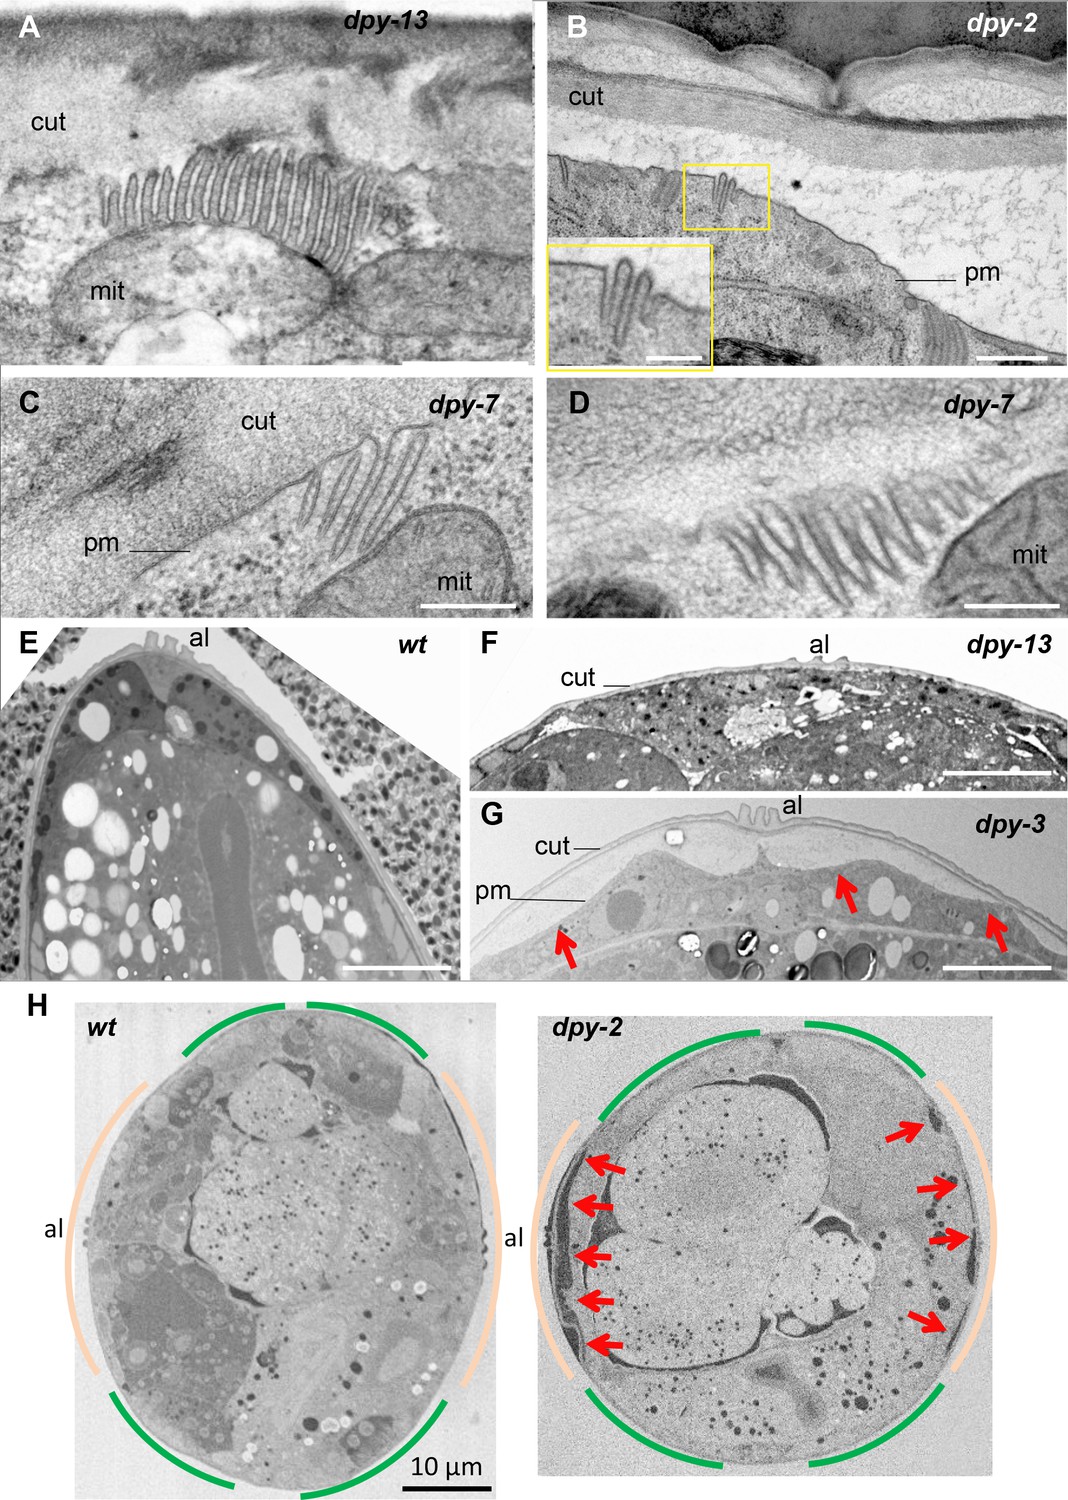
TEM images of young adult worms. Compared to wild-type (Figure 1) or dpy-13 (A), dpy-2 (B) dpy-7 (C–, D) have abnormally small meisosomes with irregular spacing between the membrane folds (D); number of worms analysed are given in Table 1. Compared to wild-type (E) or dpy-13 (F), lower magnification reveals detachment of the cuticle (cut) from the plasma membrane (pm) in dpy-3 mutant worms over the whole lateral surface of the epidermal cell, on both sides of the alae (al) (G). (H) Compared to wild-type (left), serial block-face scanning electron microscopy (SBF-SEM) analysis of the entire transversal worm also reveals the detachment (red arrow) in a dpy-2 mutant of the cuticle from the lateral epidermis, contrary to the regions above the muscles, delineated in beige and green, respectively (one representative slice per animal, entire transversal sections were acquired over a length of 21.5 and 34.4 µm, for a wild-type and a dpy-2 mutant worm, respectively). Scale bar 500 nm in (A, B), 250 nm in inset in (B), 200 nm in (C, D), 5 µm in (E–G), and 10 µm in (H).
Figure 7—figure supplement 1
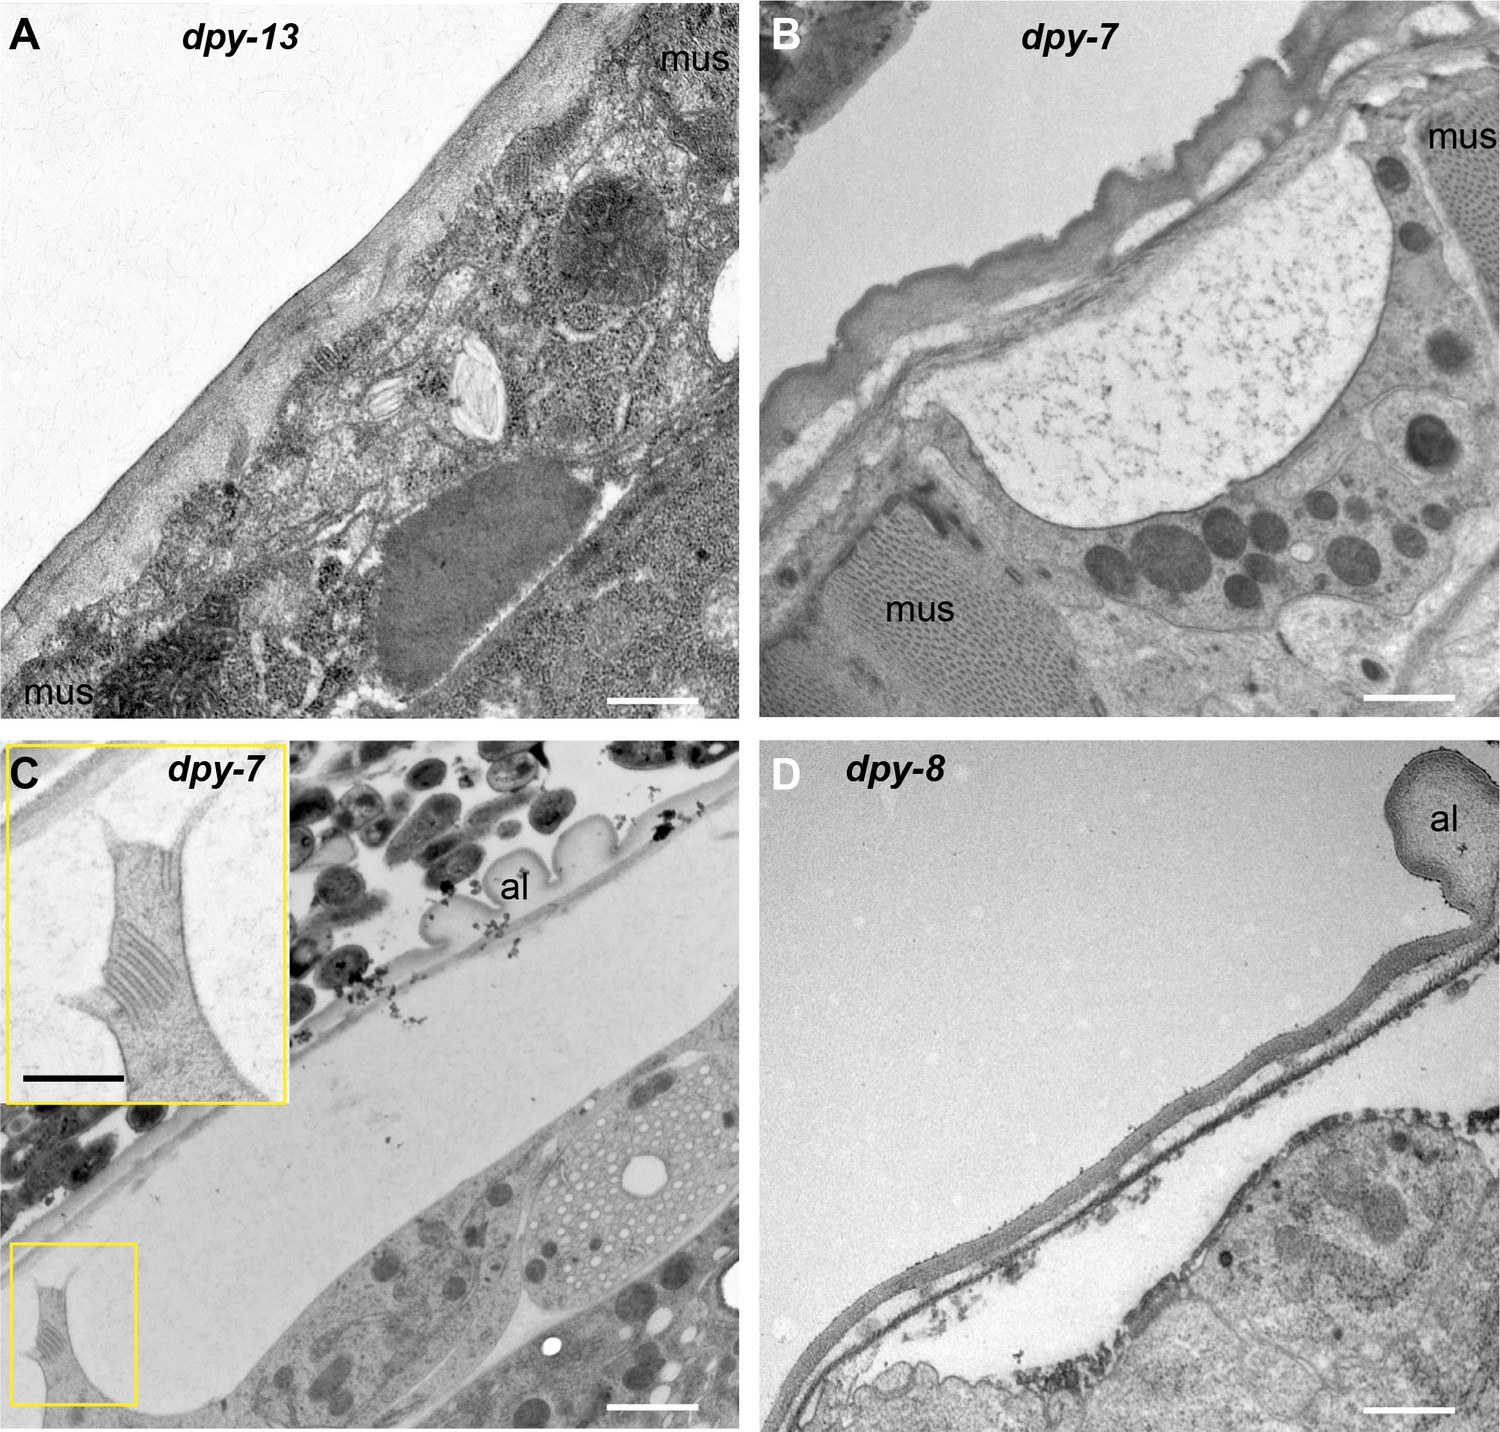
Furrow collagen inactivation leads to detachment of the cuticle in lateral and ventral/dorsal ridges.
TEM images of sagittal sections of young adult worms. Compared to dpy-13 (A), dpy-7 (B, C) and dpy-8 (D) present detachment of the cuticle (cut) from the plasma membrane, and have abnormally small meisosomes (C, and inset), in the lateral epidermis (C, D) or the dorsal cord in between muscles (mus) (B). Scale bar, 500 nm in all including (C) inset, except in (C), 1 µm.
Figure 8
Furrow collagen inactivation provokes extrusion of membrane and cytoplasmic contents into the cuticle.
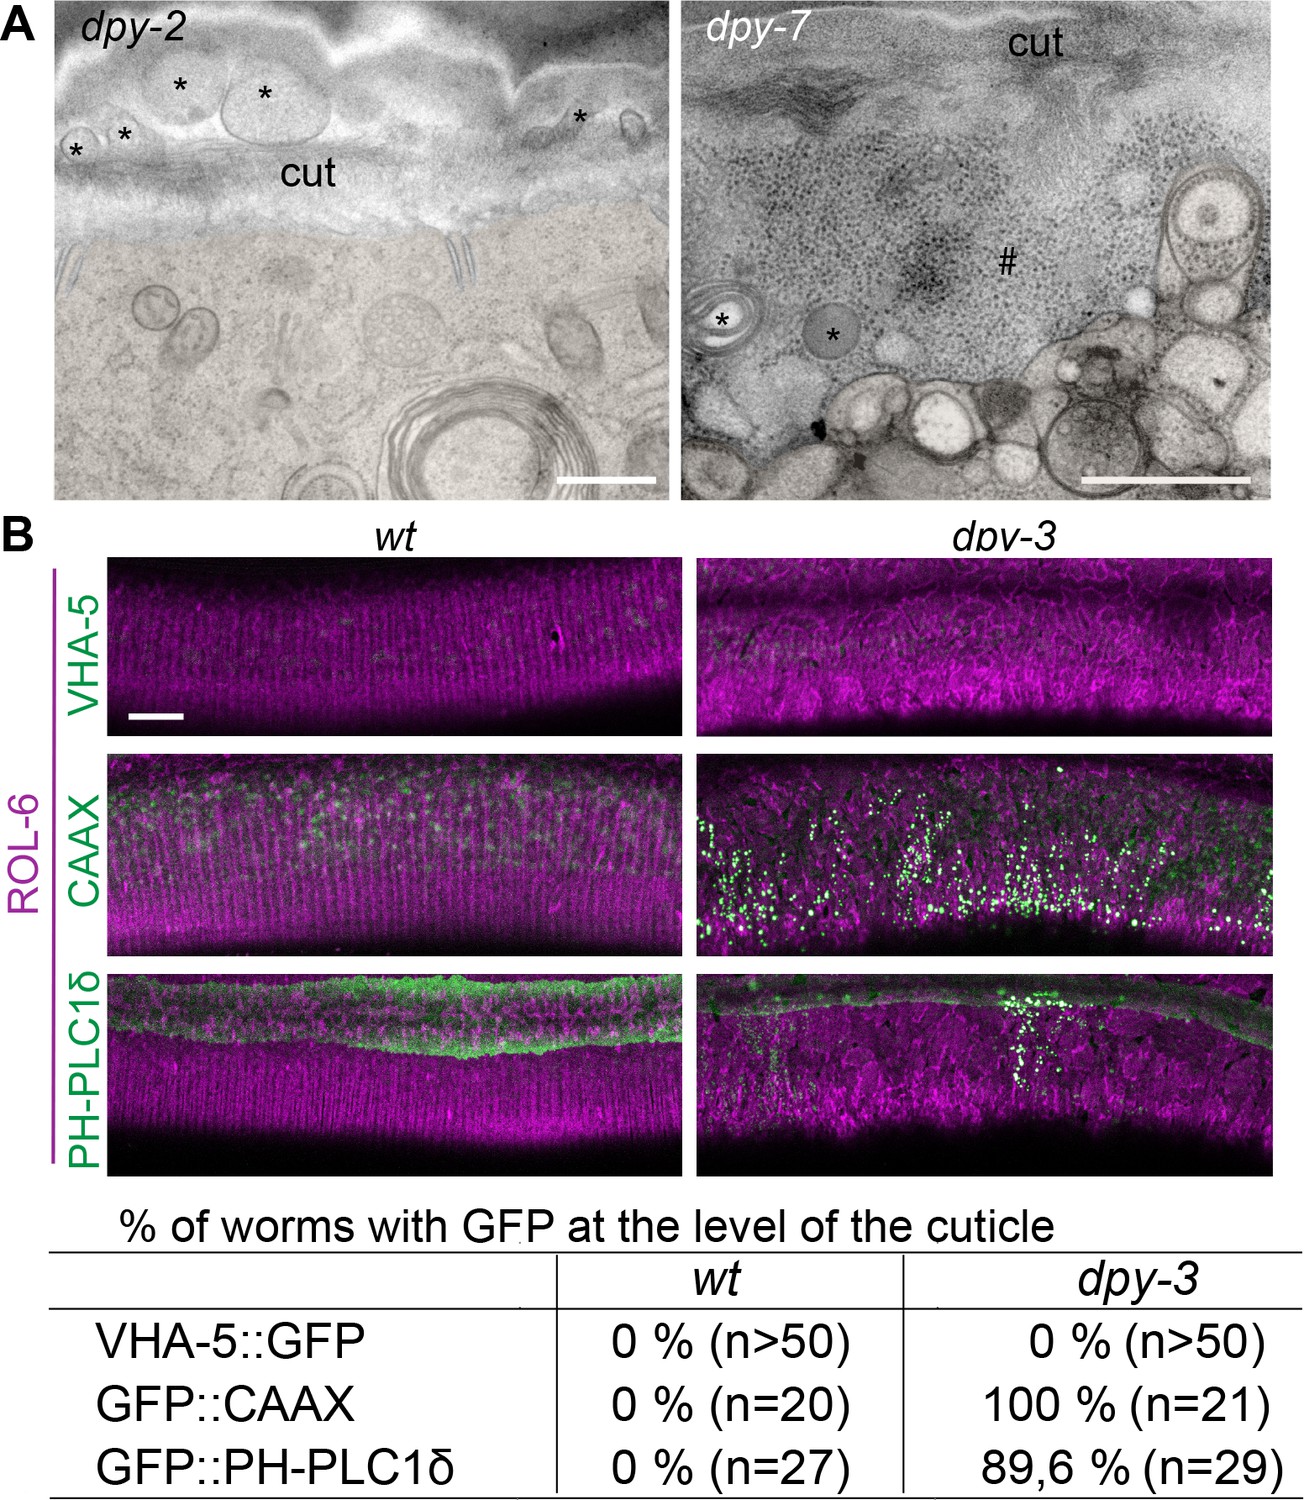
(A) TEM images of dpy-2 (left) and dpy-7 (right) young adult mutant worms reveal the presence of membranous organelles (*) and cytoplasmic content, including ribosome-like particles (#), between the cuticle and the plasma membrane; epidermis is pseudo-coloured in beige. Scale bar, 500 nm. (B) Confocal images of wild-type (left) and dpy-3 mutant (right) young adult worms expressing ROL-6::mScarlet and VHA-5::GFP, CAAX::GFP or PH-PLC1δ::GFP, one confocal plane was selected at the level of the cuticle using the ROL-6::mScarlet. Scale bar, 10 µm. (C) Quantification of the percentage of worm presenting the abnormal presence of GFP extrusion at the level of the cuticle for the different markers; number of worms observed is noted in parenthesis.
Figure 9

Furrow collagen inactivation provokes a reduction in stiffness of the cuticle.
(A) AFM topography of the cuticle in wild-type, dpy-13, dpy-2, dpy-3, dpy-7, and dpy-8 mutant adult worms. Scale bar, 1 µm. (B) Mean force-indentation curves of wild-type and collagen mutants acquired by AFM. (C) Young’s modulus estimation from force curves by applying the Hertz model for contact mechanics. Data are from three independent experiments with a total of n = 30, 25, 16, 40, 34, and 32, for wild-type, dpy-13(e184), dpy-2(e8), dpy-3(e27), dpy-7(e88), and dpy-8(e130) mutant worms, respectively.
Tables
Table 1
Quantification of the length of the meisosomes on TEM images in young adult wild-type and different collagen mutants.
| Genotype | Cut | n(worms) | n (meisosome) | Mean length(µm) | Smallest length(µm) | Longest length(µm) |
|---|---|---|---|---|---|---|
| Wild-type | Transv. | 5 | 22 | 0.71 | 0.2 | 2.6 |
| Wild-type | Longit. | 4 | 41 | 0.77 | 0.1 | 4 |
| dpy-13(e184) | Transv. | 3 | 31 | 0.77 | 0.3 | 4 |
| dpy-13(e184) | Longit. | 1 | 11 | 1.07 | 0.2 | 4 |
| dpy-2(e8) | Transv. | 1 | 45 | 0.39 | 0.05 | 1 |
| dpy-2(e8) | Longit. | 4 | 6 | 0.28 | 0.1 | 0.6 |
| dpy-3(e8) | Longit. | 1 | 16 | 0.49 | 0.1 | 1 |
| dpy-7(e88) | Transv. | 2 | 24 | 0.28 | 0.05 | 0.7 |
| dpy-7(e88) | Longit. | 4 | 37 | 0.37 | 0.1 | 1.5 |
-
Table 1—source data 1
Measurements of meisosome length on TEM images in young adult wild type and different collagen mutants.
- https://cdn.elifesciences.org/articles/75906/elife-75906-table1-data1-v1.xlsx
Additional files
-
Supplementary file 1
C. elegans strains used in this study.
- https://cdn.elifesciences.org/articles/75906/elife-75906-supp1-v1.docx
-
Transparent reporting form
- https://cdn.elifesciences.org/articles/75906/elife-75906-transrepform1-v1.pdf
Download links
A two-part list of links to download the article, or parts of the article, in various formats.
Downloads (link to download the article as PDF)
Open citations (links to open the citations from this article in various online reference manager services)
Cite this article (links to download the citations from this article in formats compatible with various reference manager tools)
Meisosomes, folded membrane microdomains between the apical extracellular matrix and epidermis
eLife 12:e75906.
https://doi.org/10.7554/eLife.75906


