Modeling the consequences of the dikaryotic life cycle of mushroom-forming fungi on genomic conflict
- Laboratory of Genetics, Wageningen University, Netherlands
- ELKH Centre for Ecological Research, Institue of Evolution, Hungary
- MTA-ELTE Theoretical Biology and Evolutionary Ecology Research Group, Hungary
Figures
Figure 1 with 2 supplements
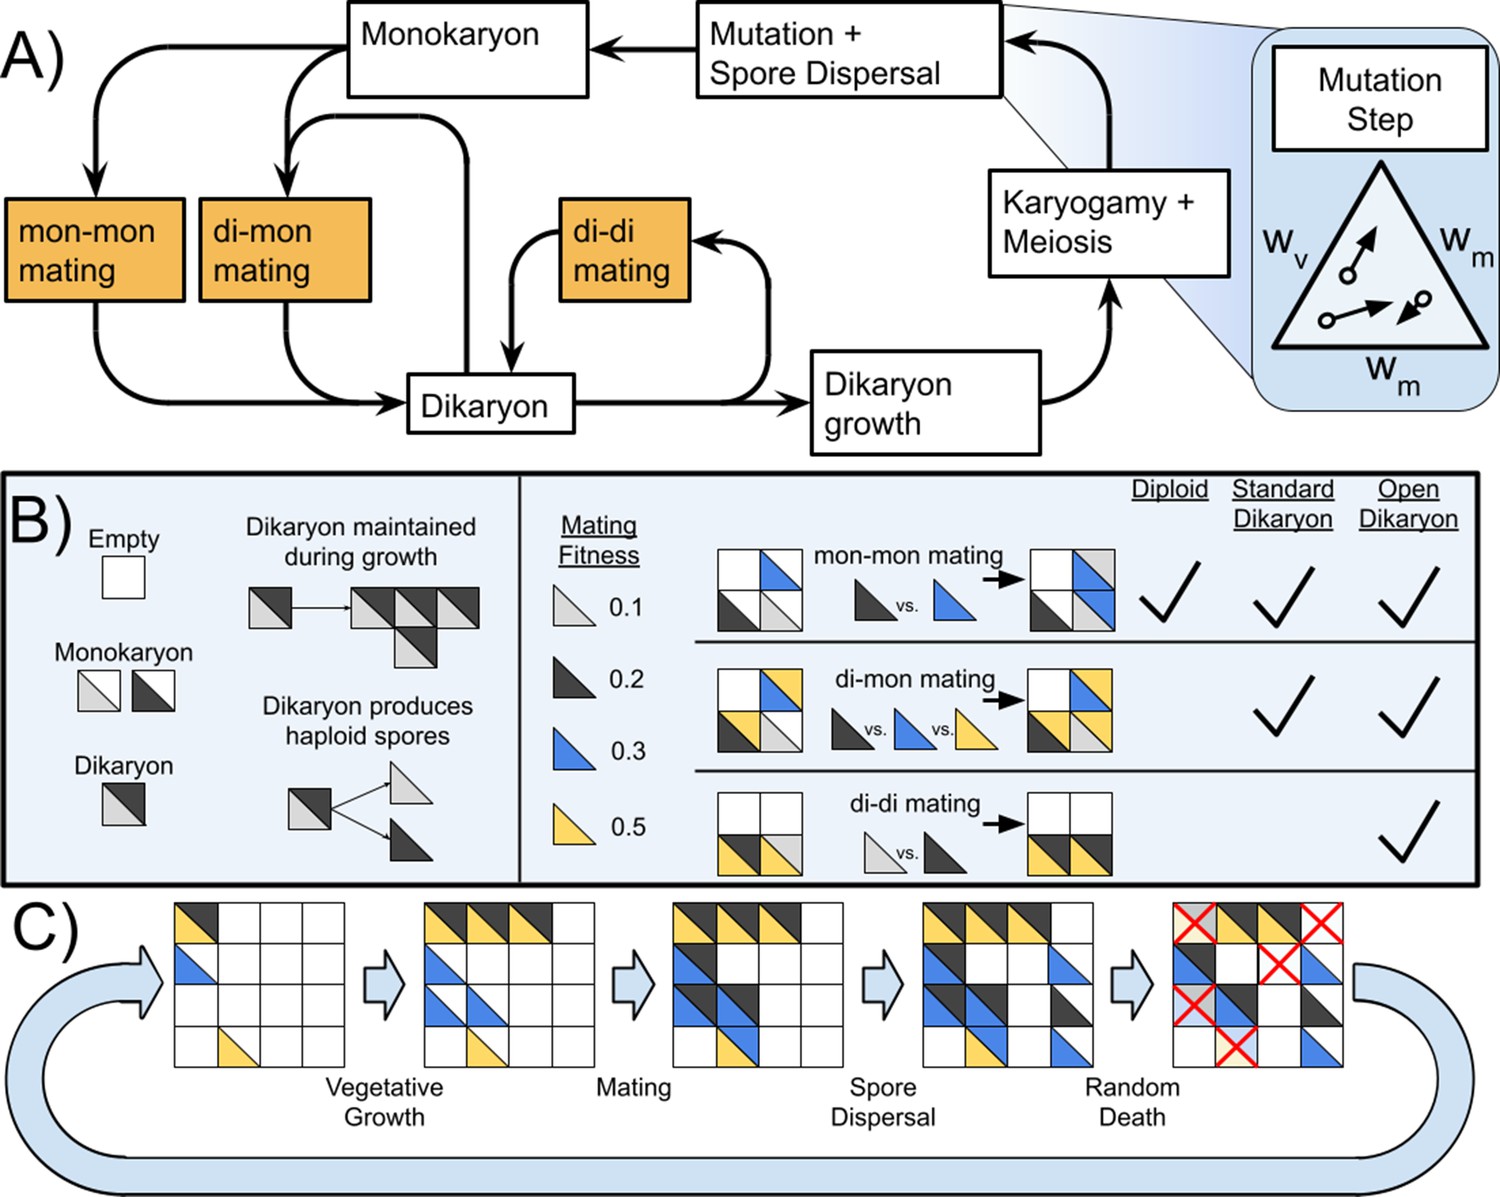
Life cycle of Basidiomycetes and schematic of model.
(A) Life cycle of dikaryon showing the three different mating possibilities (mon-mon, di-mon, and di-di), as well as the separation between mating and karyogamy. (B) Shows some rules of the algorithm and three types of mating, and which matings are found with each of the three life cycles. (C) Example of the actions taken during one generation of the simulation. Note that in this diagram matings are shown as deterministic based on mating fitness, but in the simulations the outcome of competition is probabilistic.
Figure 1—figure supplement 1
Overview of simulation outcomes using higher mutation width of 0.05 instead of 0.01 used in other simulations.
Note that in the polygenic diploid scenario, the nuclei do not cluster near the middle but instead optimize spore production similar to the monogenic scenario.
Figure 1—figure supplement 2

Overview of simulation outcomes displayed as in Figure 2 but using higher basal growth rate of 0.5 instead of 0.1 used in other simulations.
Note that this increased growth rate allows the open dikaryon to survive and increases the vegetative growth fitness of both diploid and standard dikaryon scenarios.
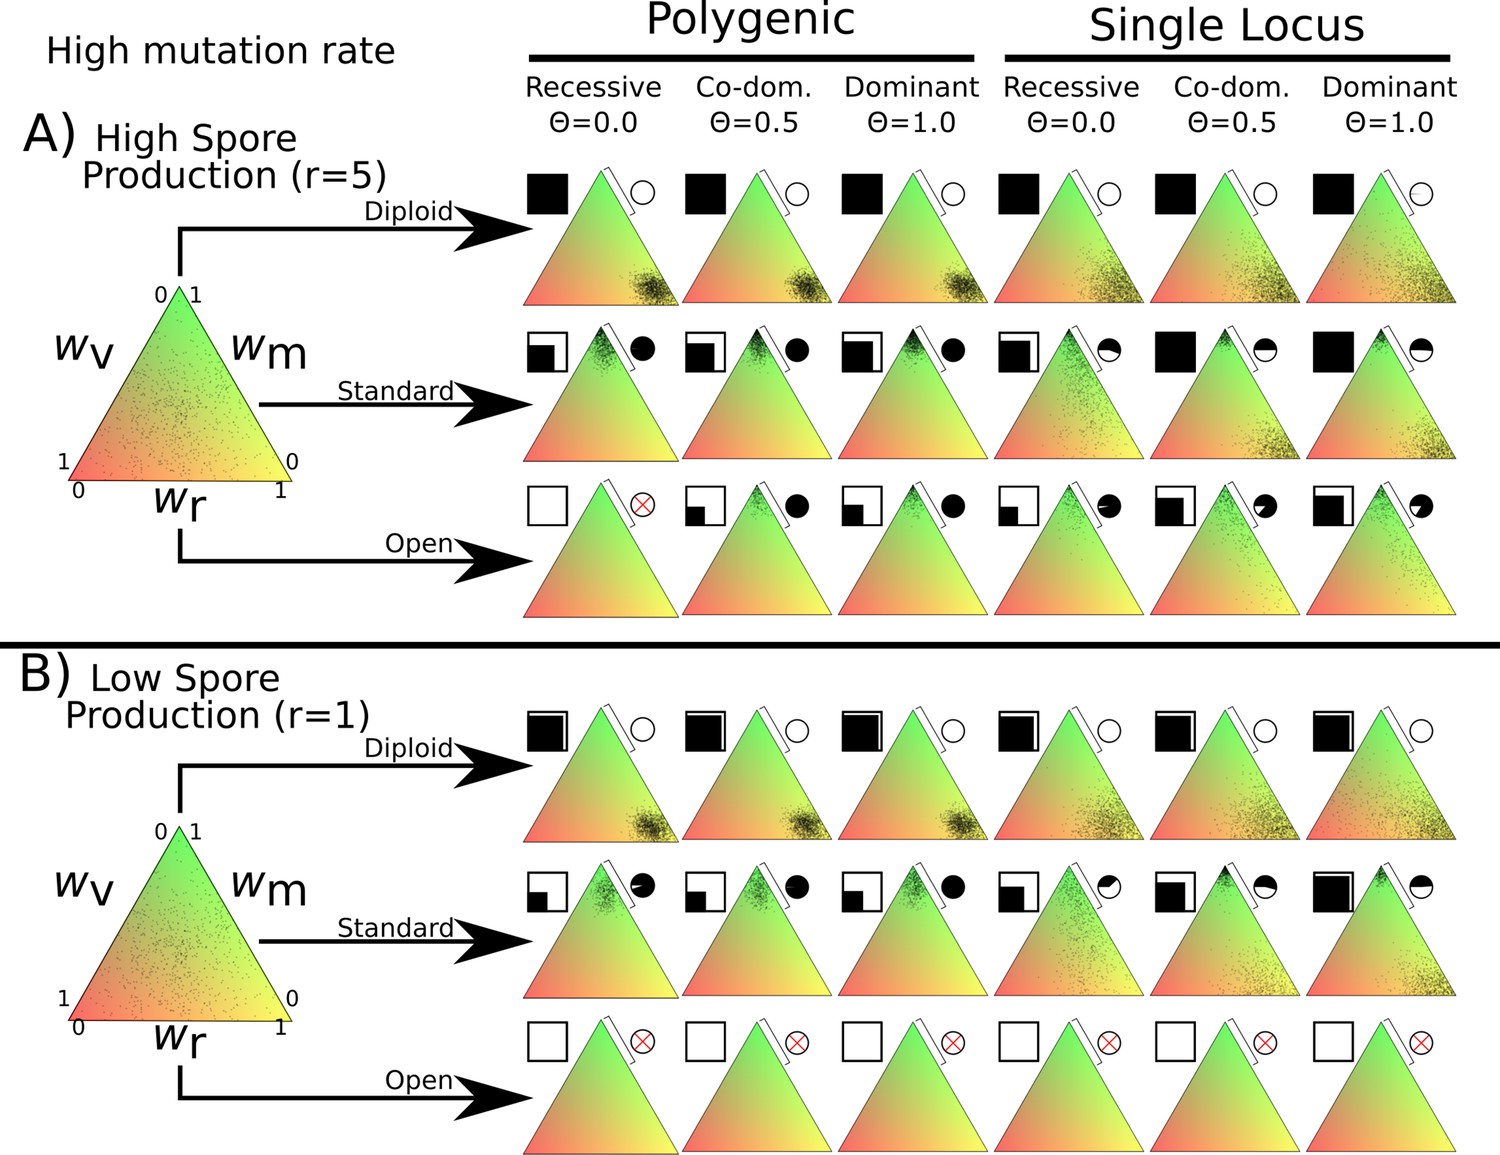
Figure 2
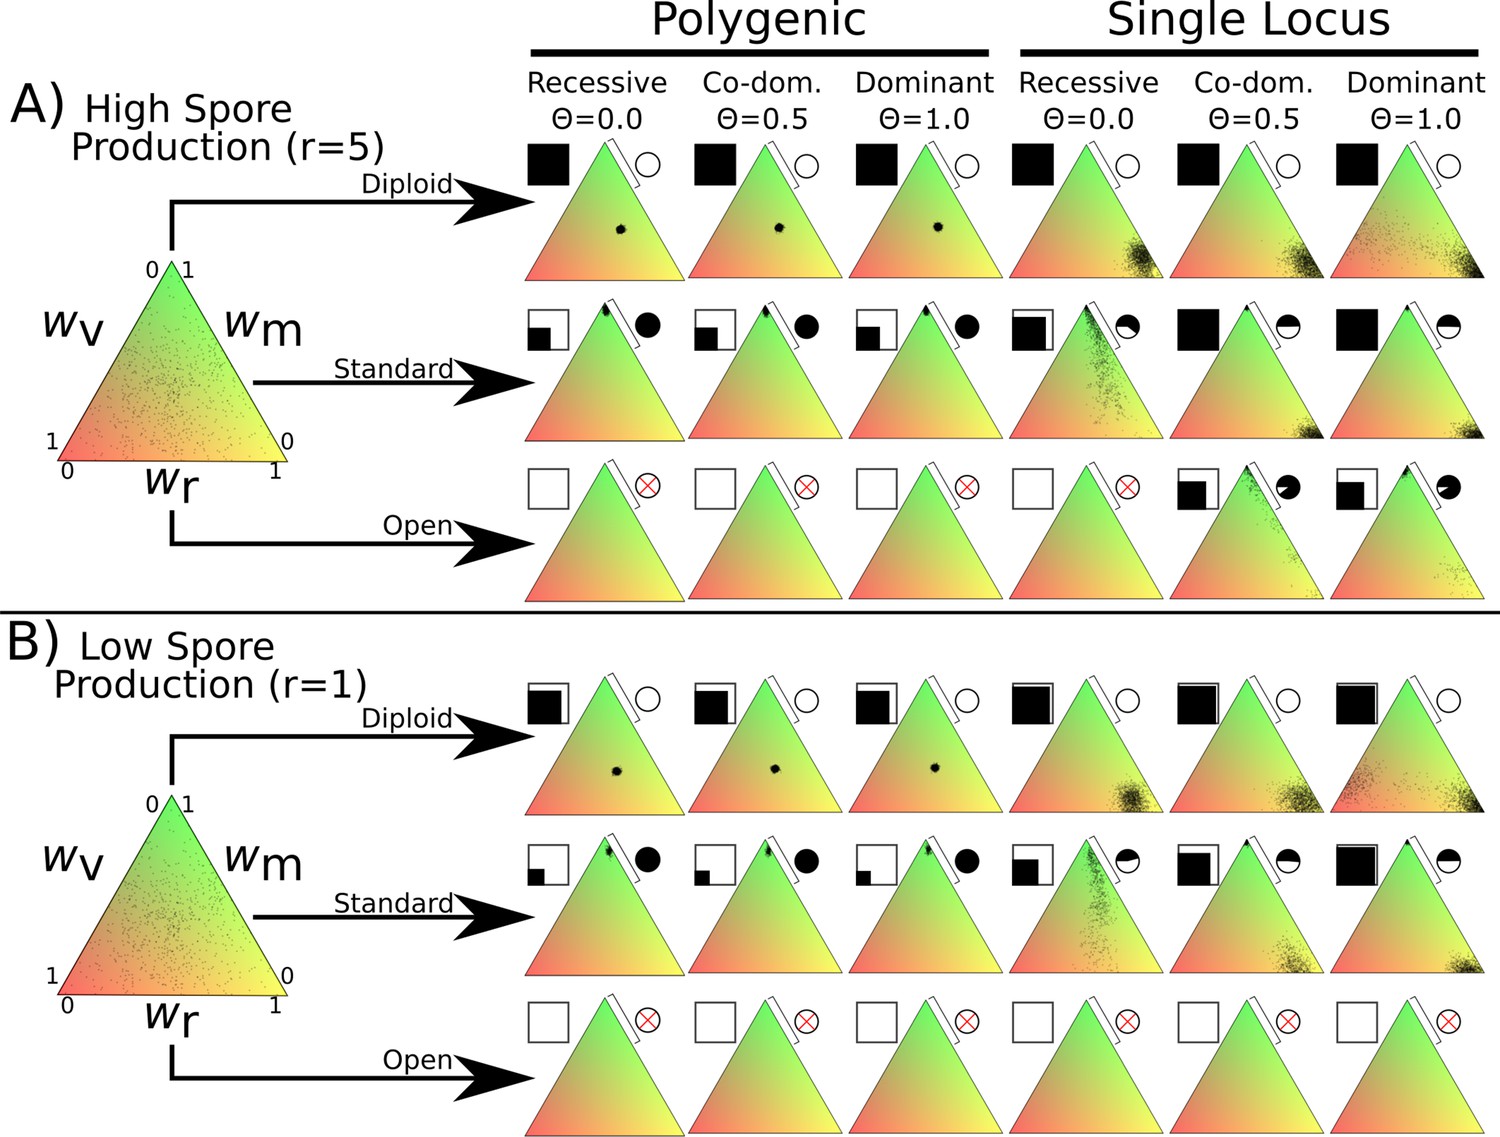
Fitness distributions after 1000 generations under different values of λ and dominance coefficients for the three dikaryon scenarios with (A) high spore production (r = 5) or (B) low spore production (r = 1).
Simulations were initialized with 60,000 homokaryotic individuals with initial fitness values drawn from a normal distribution, as shown in the leftmost triangle. Points in resulting triangles represent individual nuclei remaining on the 300 × 300 grid at end of simulation. Note that there is significant overlap of points, thus the amount of black is not proportional to population size. Shading of pie charts shows percentage of nuclei with >66% mating fitness (wm; region covered by bar). Shaded square indicates proportion of cells occupied at end of simulation. Simulations with no surviving population have no dots, and associated pie charts have a red cross.
Figure 3
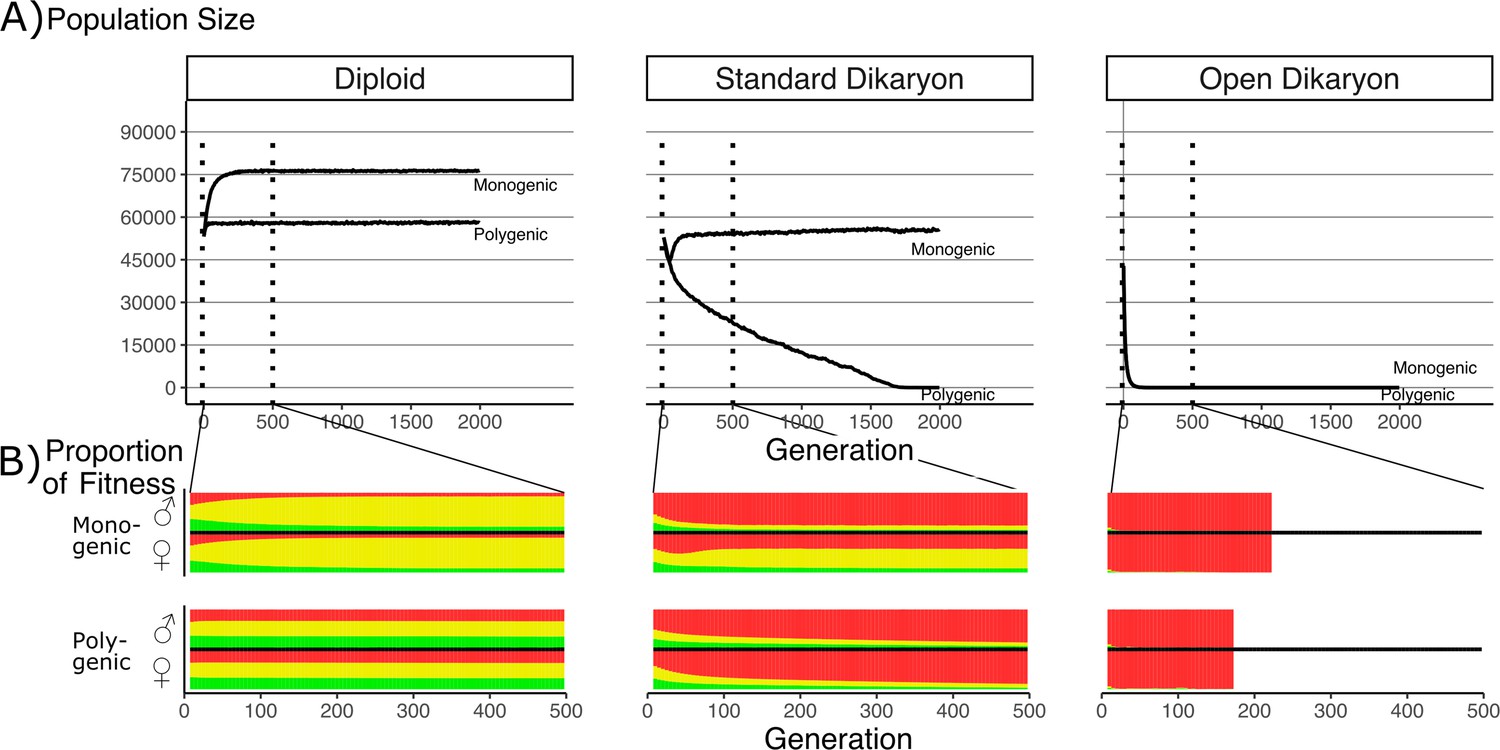
Effect of number of fitness loci on the impact of the fitness trade-off.
(A) Population size with λ varying from monogenic (λ = 0) to polygenic (λ = 1) across the three life strategies, initialized with 60,000 squares occupied. Dotted vertical lines indicate region shown in B. (B) Average proportion of fitness in nuclei per generation for the first 500 generations. Decreasing λ values are shown on separate rows. The different fitness components are indicated by color: Red (top) is mating fitness, wm, yellow (middle) is spore production, wr; and green (bottom) is vegetative growth, wv. White areas in open dikaryon are from dead populations. For every value of λ, the average fitness is calculated separately for nucleus 1 (the nucleus of the original monokaryon) and nucleus 2 (the fertilizing nucleus). Note that increased nonmating fitness in the open dikaryon with λ = 0.99 is due to extremely small population sizes.
Figure 4 with 1 supplement

Results of direct competition between nuclei with and without dikaryotic male function (DMF) function.
Different initial proportions of DMF and non-DMF nuclei are shown with different line styles. Initial DMF and non-DMF nuclei fitness parameters were drawn from the same distribution, with the same trade-off imposed. Proportion of DMF nuclei and proportion of parasitic nuclei (those with >66% mating fitness) are shown for the female nucleus (nucleus 1) in the top two rows, while the male nucleus (nucleus 2) is shown below. Note that since the population begins as completely homokaryotic, the nucleus 2 position is empty for generations 0. The bottom row shows the total population size.
Figure 4—figure supplement 1
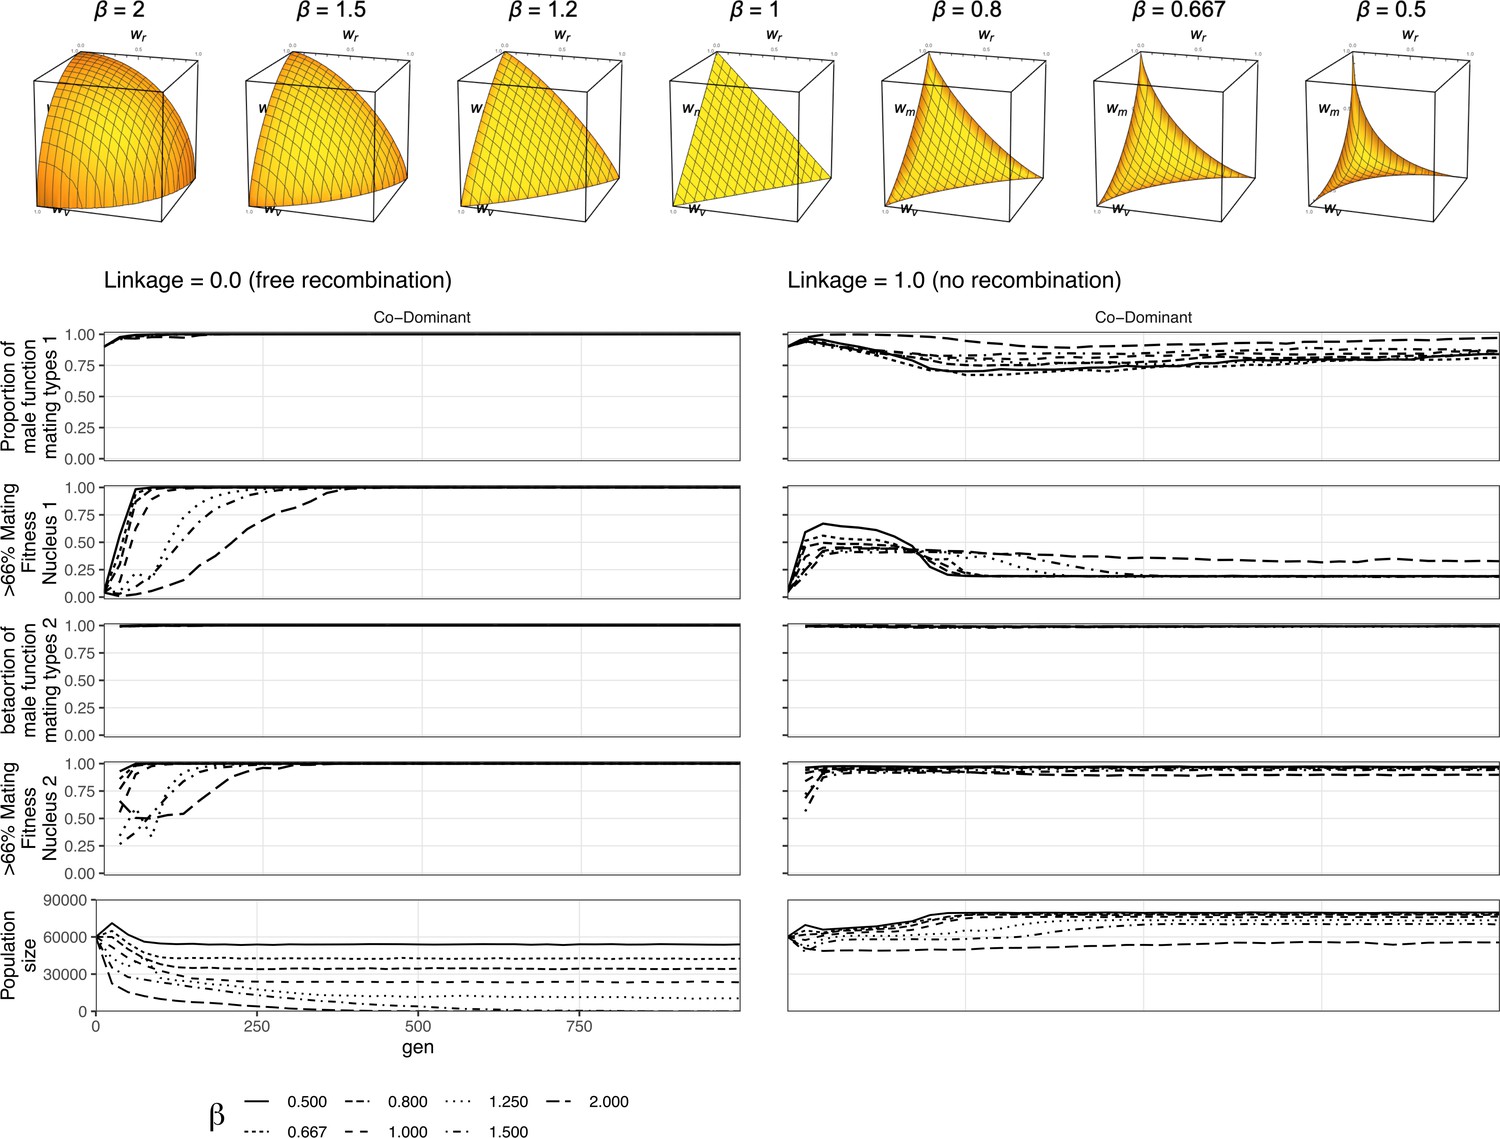
Linearity of the fitness trade-off has limited effect on mating selection.
Here is the figure for the nonlinear fitness. It shows that in the co-dominant state, where dikaryotic male function (DMF) spreads fastest, the DMF allele spreads through the population regardless of trade-off shape. The beta value has some effect on the strength of selection, so with beta of 2 (the long dash line) in the polygenic scenario the population size is smallest since fitness costs are highest. So, when polygenic selection against the allele slows the spread of nuclei maximizing mating fitness, but not of the DMF allele itself, and it takes longest for the nuclei maximizing the mating fitness to spread in the female role (nucleus 1).
Figure 5

Population size and mating success with differing environmental influences.
(A) Population size after 500 generations across a range of death and growth rates. Intensity of black is proportional to population size. (B) Mating success of simulations from panel (A), but intensity of black refers to proportion of occupied cells that are dikaryotic. Orange values indicate simulations had no surviving cells. (C) Grand mean of values used in (A) and (B), grouped by scenario to highlight the relative differences in mating success and population size between the three scenarios.
Figure 6
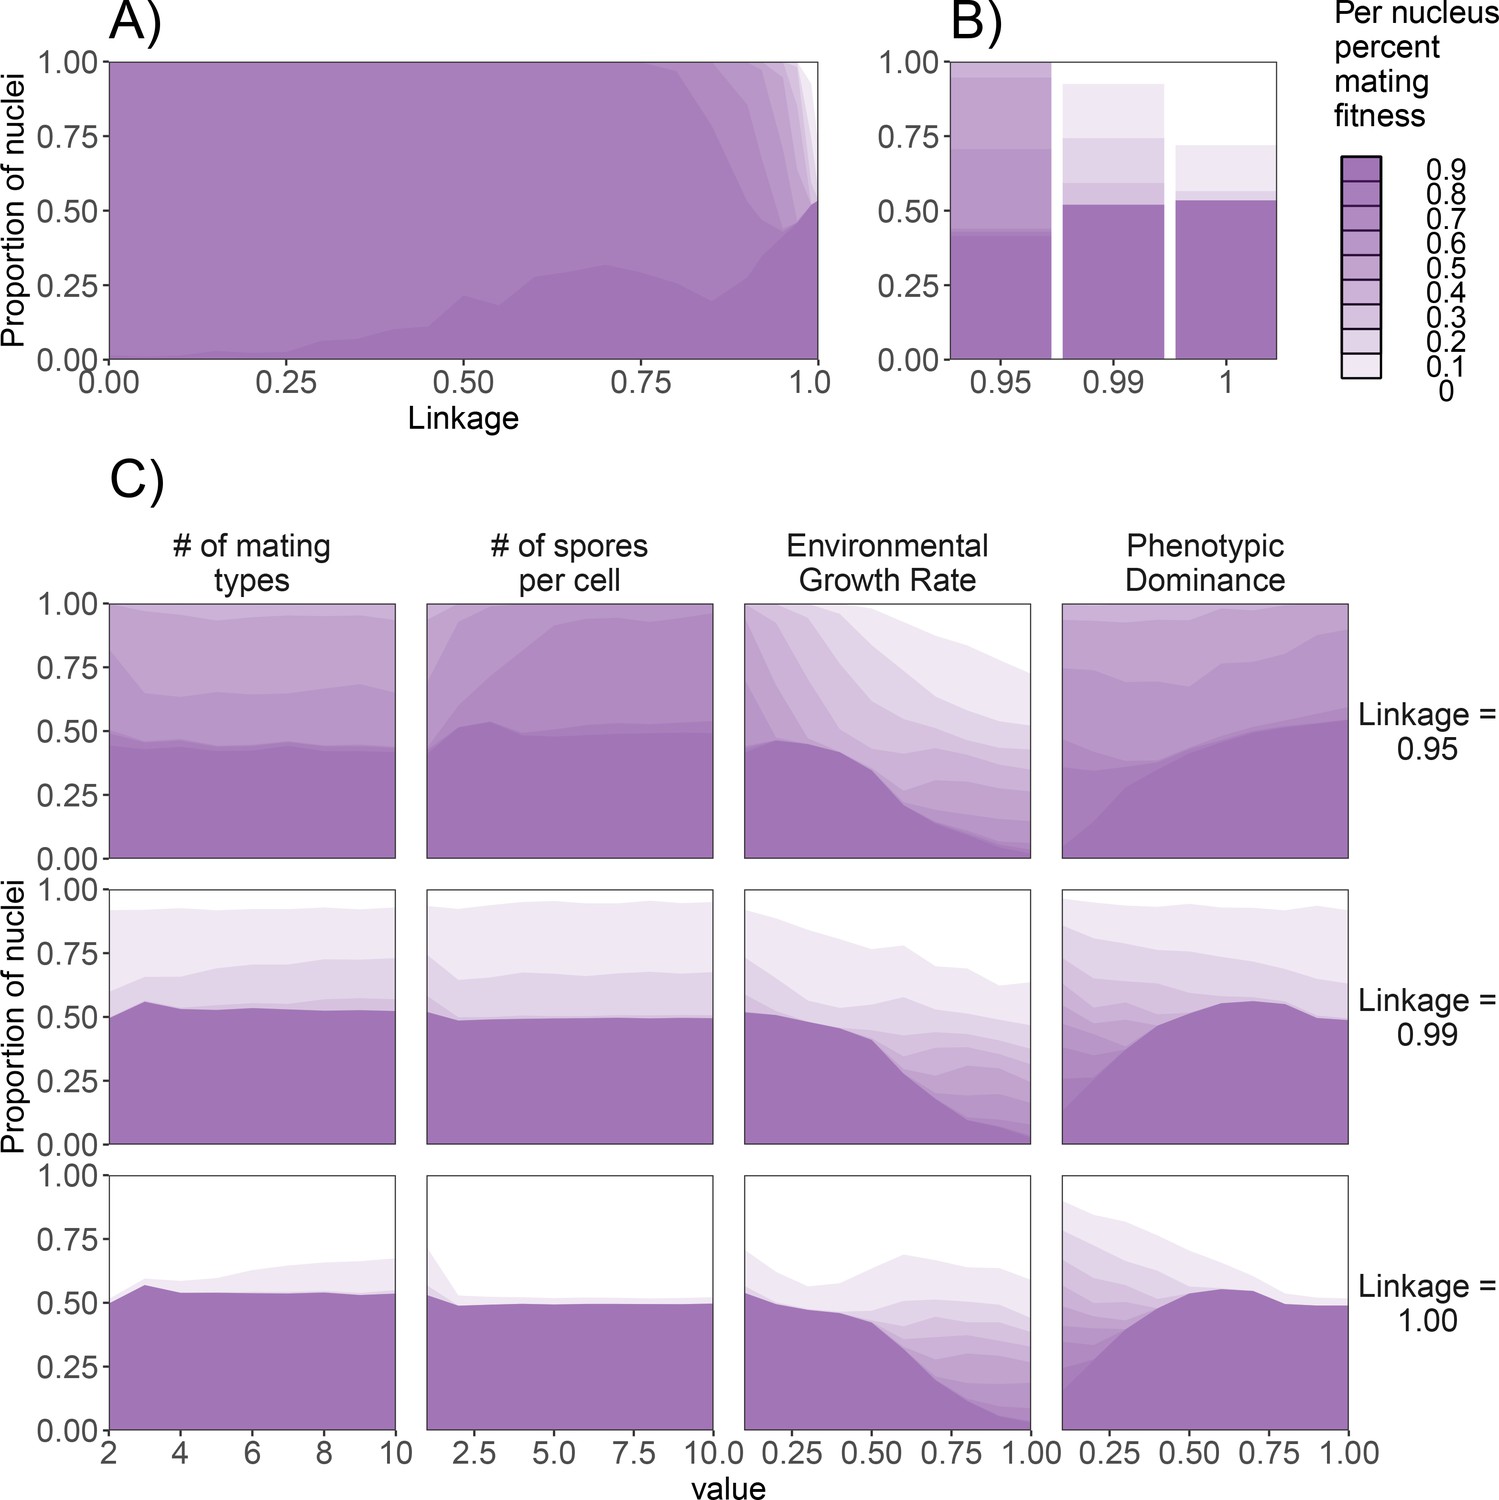
Effect of genetic factors on the prevalence of nuclei with detrimental levels of mating fitness.
For all subpanels, mating fitness is binned from all nuclei remaining at the end of 1000 generations. (A) Effect of λ on mating fitness in the standard dikaryon. (B) Mating fitness distributions for λ values of 0.95, 0.99, and 1.00 which are selected to highlight differences in outcomes. (C) Effect of parameters on the resulting mating fitness in the population in the standard dikaryon scenario. Rows show results under linkage values of 0.95, 0.99, and 1.00. Columns from left to right show results of modifying the number of mating types, spore production, growth rate, and dominance. Shading is proportional to mating fitness, calculated in steps of 10% across four replicates. White area represents nuclei with <10% mating fitness.
Videos
Animation 1
Animation of the first 100 generations of the diploid life cycle under standard conditions.
Dots indicate individual nuclei. Bars indicate population size, and ‘% maters’ which is the proportion of nuclei with >66% of fitness allocated to mating fitness, as in Figure 2.
Animation 2
Animation as found in Animation File 2, except of the standard dikaryon life cycle.
Animation 3
Animation as found in Animation File 2, except this time with open dikaryon life cycle.
Additional files
-
MDAR checklist
- https://cdn.elifesciences.org/articles/75917/elife-75917-mdarchecklist1-v2.docx
-
Source code 1
Pseudocode for the simulation algorithm.
- https://cdn.elifesciences.org/articles/75917/elife-75917-code1-v2.zip
Download links
A two-part list of links to download the article, or parts of the article, in various formats.
Downloads (link to download the article as PDF)
Open citations (links to open the citations from this article in various online reference manager services)
Cite this article (links to download the citations from this article in formats compatible with various reference manager tools)
Modeling the consequences of the dikaryotic life cycle of mushroom-forming fungi on genomic conflict
eLife 11:e75917.
https://doi.org/10.7554/eLife.75917


