Endocytic trafficking promotes vacuolar enlargements for fast cell expansion rates in plants
- Molecular Plant Physiology (MoPP), Faculty of Biology, University of Freiburg, Germany
- Department of Applied Genetics and Cell Biology, University of Natural Resources and Life Sciences, Austria
- Center for Integrative Biological Signalling Studies (CIBSS), University of Freiburg, Germany
- Laboratory of Growth Regulators, Institute of Experimental Botany of the Czech Academy of Sciences and Faculty of Science of Palacký University, Czech Republic
- Cell Biology, Faculty of Biology, University of Freiburg, Germany
Figures
Figure 1
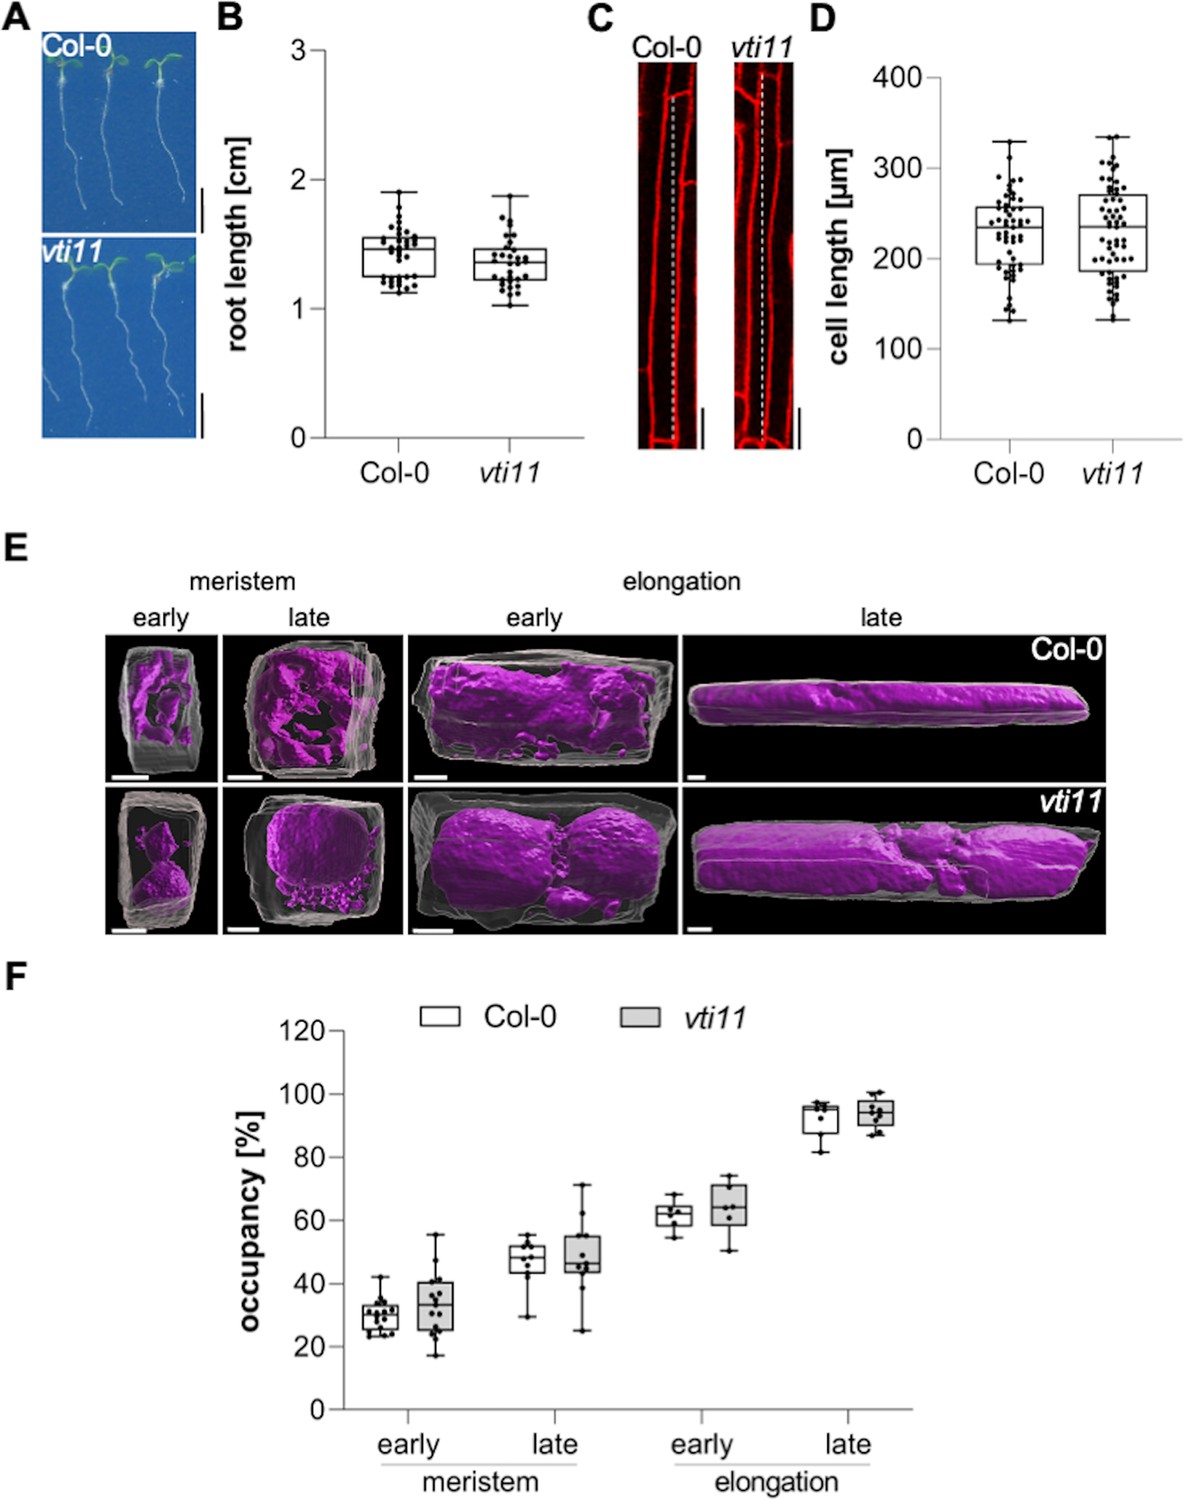
Vacuolar occupancy of the cell defines cell expansion.
(A) Representative images (scale bars: 0.5 cm) and (B) quantification of the main root length of 6-day-old Col-0 (n=36) and vti11 seedlings (n=32). Student’s t-test (ns). (C) Representative images (scale bars: 25 µm) of differentiated atrichoblast cells. Seedlings were stained with propidium iodide (PI) (red) for 30 min in liquid medium prior image acquisition. (D) Boxplots show cell length quantification of 6-day-old Col-0 (n=53) and vti11 (n=59) seedlings. Student’s t-test (ns). (E) 3D reconstructions of PI-stained cell walls (gray) and BCECF-stained vacuoles (magenta) in the early and late meristem and in the early and late elongation zone. Scale bars: 5 µm. (F) Boxplots show vacuolar occupancy of cells in the defined zones (n=7–16). Student’s t-test (ns). Boxplots: Box limits represent 25th percentile and 75th percentile; horizontal line represents median. Whiskers display min. to max. values. Data points are individual measured values. Representative experiments are shown.
-
Figure 1—source data 1
Figure 1B source data.
- https://cdn.elifesciences.org/articles/75945/elife-75945-fig1-data1-v1.xlsx
-
Figure 1—source data 2
Figure 1D source data.
- https://cdn.elifesciences.org/articles/75945/elife-75945-fig1-data2-v1.xlsx
-
Figure 1—source data 3
Figure 1F source data.
- https://cdn.elifesciences.org/articles/75945/elife-75945-fig1-data3-v1.xlsx
Figure 2 with 5 supplements
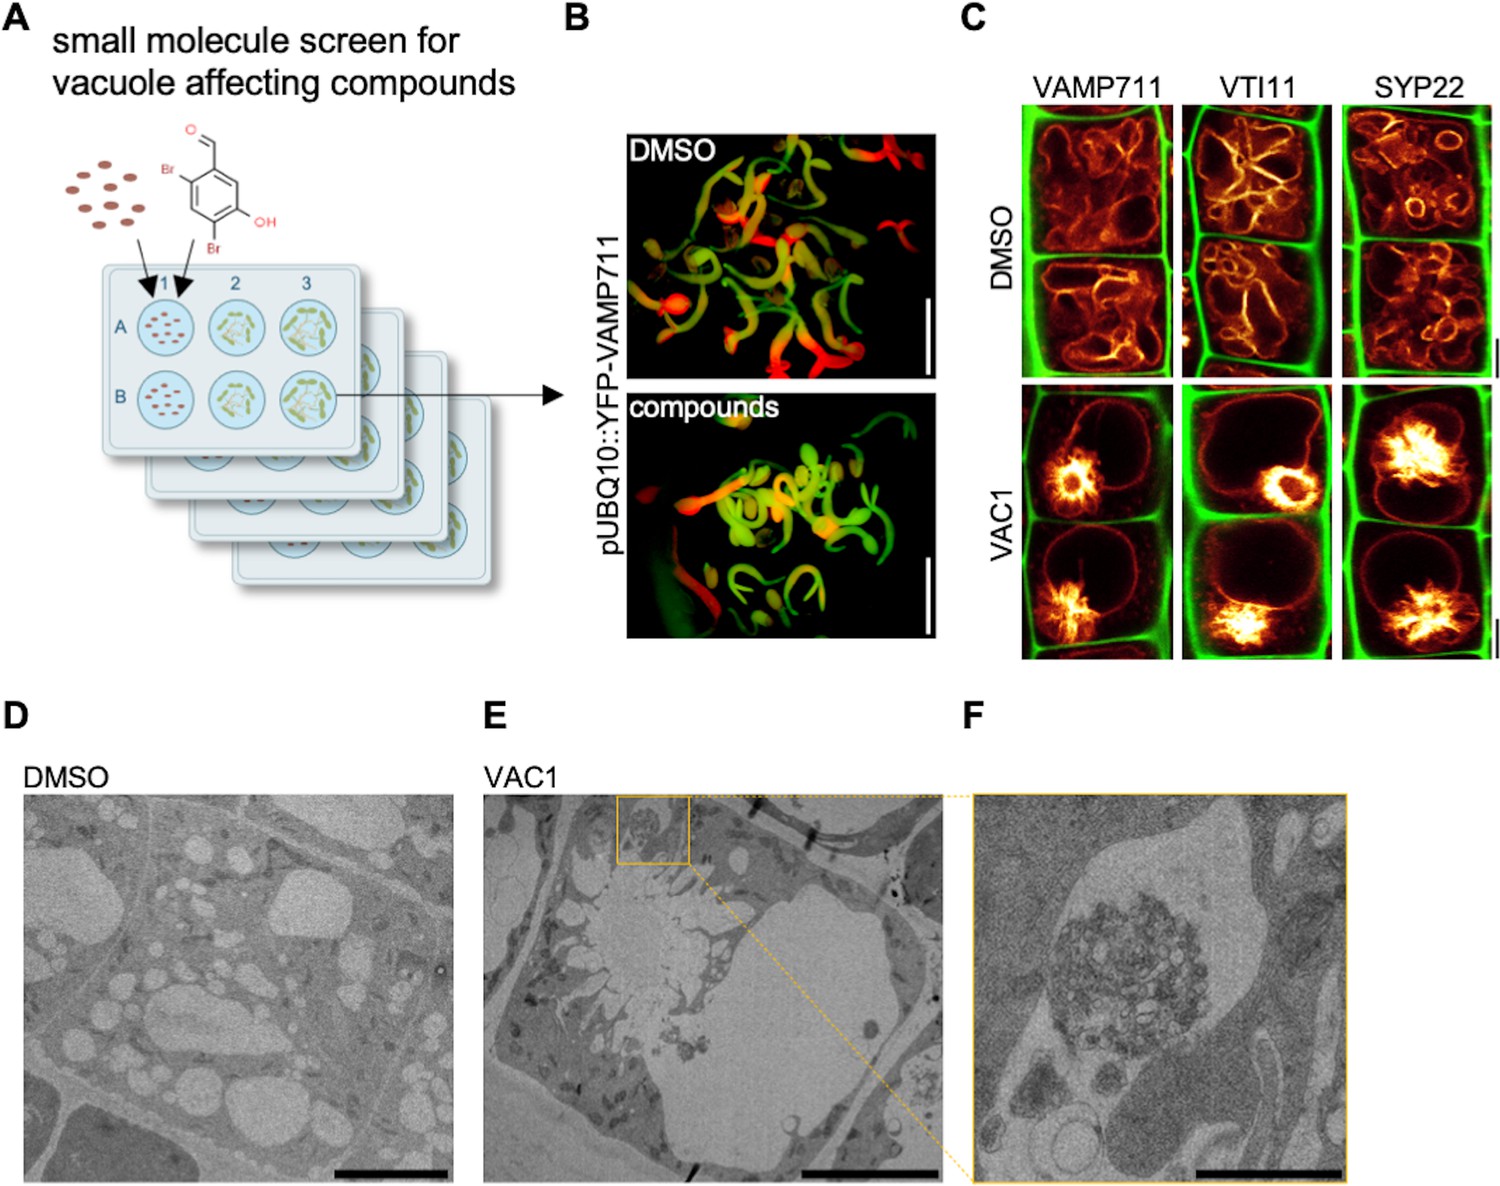
Bioactive small molecule screen identifies VAC1 as a vacuole affecting compound.
(A) Schematic depiction of the small molecule screen workflow. pUBQ10::YFP-VAMP711 seeds were germinated in liquid medium containing solvent control dimethyl sulfoxide (DMSO) or 360 small molecules from a library of bioactive compounds. (B) Four-day-old seedlings were then screened for intensified YFP-VAMP711 signal using a fluorescence binocular. Scale bars: 0.5 cm. (C) Representative images of the confocal laser scanning microscopy (CLSM)-based confirmation screen. Cell wall and vacuolar membrane in late meristematic atrichoblast cells were visualized with propidium iodide (PI) (green) and pUBQ10::YFP-VAMP711 (yellow), pSYP22::SYP22-GFP (yellow), or pUBQ10::pHGFP-VTI11 (yellow), respectively. Scale bars: 5 µm. (D–F) Representative transmission electron microscopy (TEM) images of solvent control (DMSO)- (D) and VAC1-treated (E) epidermal root cells. (F) shows a magnified detail of (E). Scale bars: 5 µm (D,E) and 1 µm (F).
Figure 2—figure supplement 1
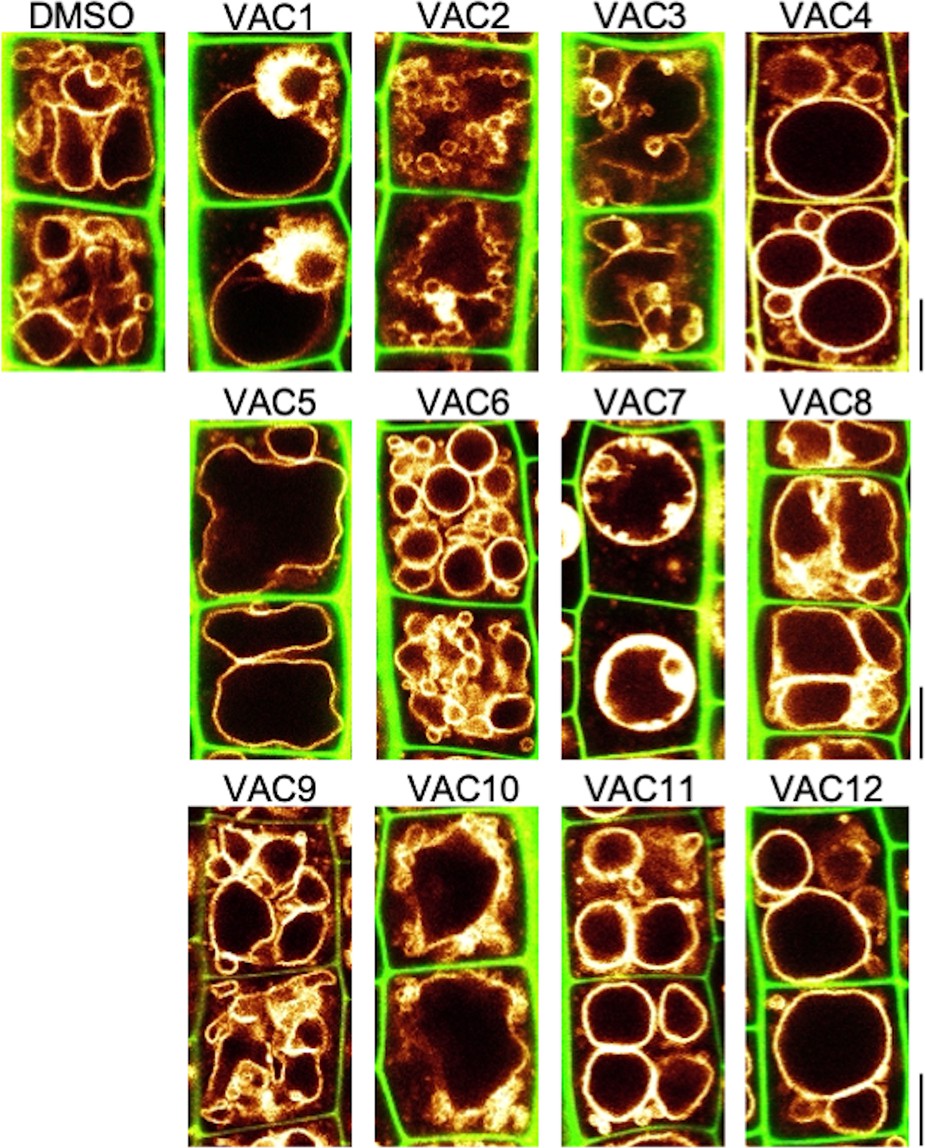
Bioactive small molecules impact vacuolar morphology.
Cell wall and vacuolar membrane in late meristematic atrichoblast cells were visualized with cell wall stain propidium iodide (PI) (green) and pUBQ10::YFP-VAMP711 (yellow). Six-day-old seedlings were treated with solvent control (dimethyl sulfoxide [DMSO]) or VAC1 (7.5 µM, 1 hr), VAC2 (7.5 µM, 5 hr), VAC3 (5 µM, 5 hr), VAC4 (23.3 µM, 5 hr), VAC5 (10 µM, 5 hr), VAC6 (50 µM, 5 hr), VAC7 (7.5 µM, 1 hr), VAC8 (7.5 µM, 2.5 hr), VAC9 (100 µM, 5 hr), VAC10 (100 µM, 2.5 hr), VAC11 (25 µM, 5 hr), VAC12 (100 µM, 6 hr) in liquid medium. Scale bars: 5 µm.
Figure 2—figure supplement 2
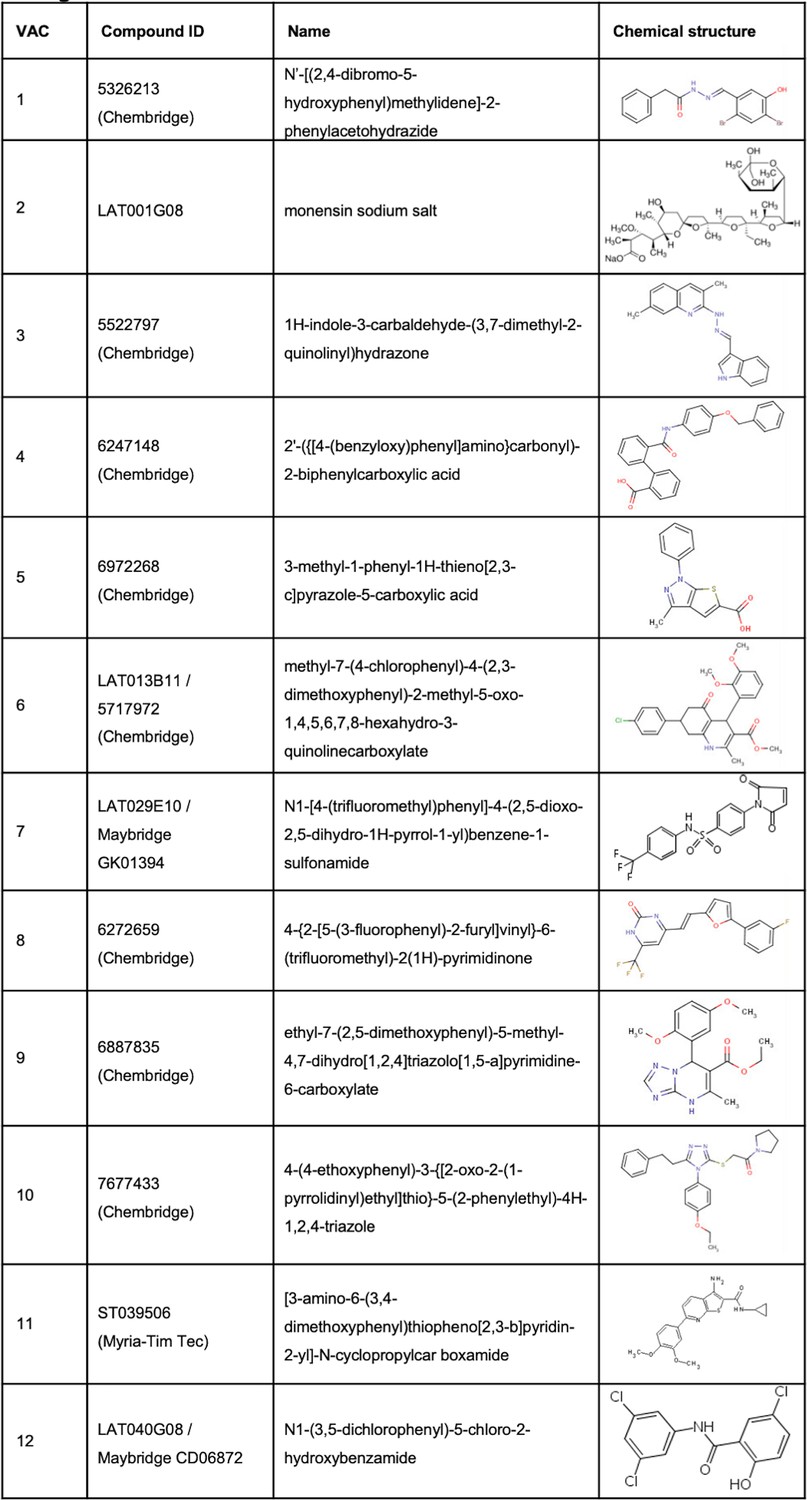
Bioactive small molecules from the screen.
Table shows compound IDs, full name, and chemical structure.
Figure 2—figure supplement 3
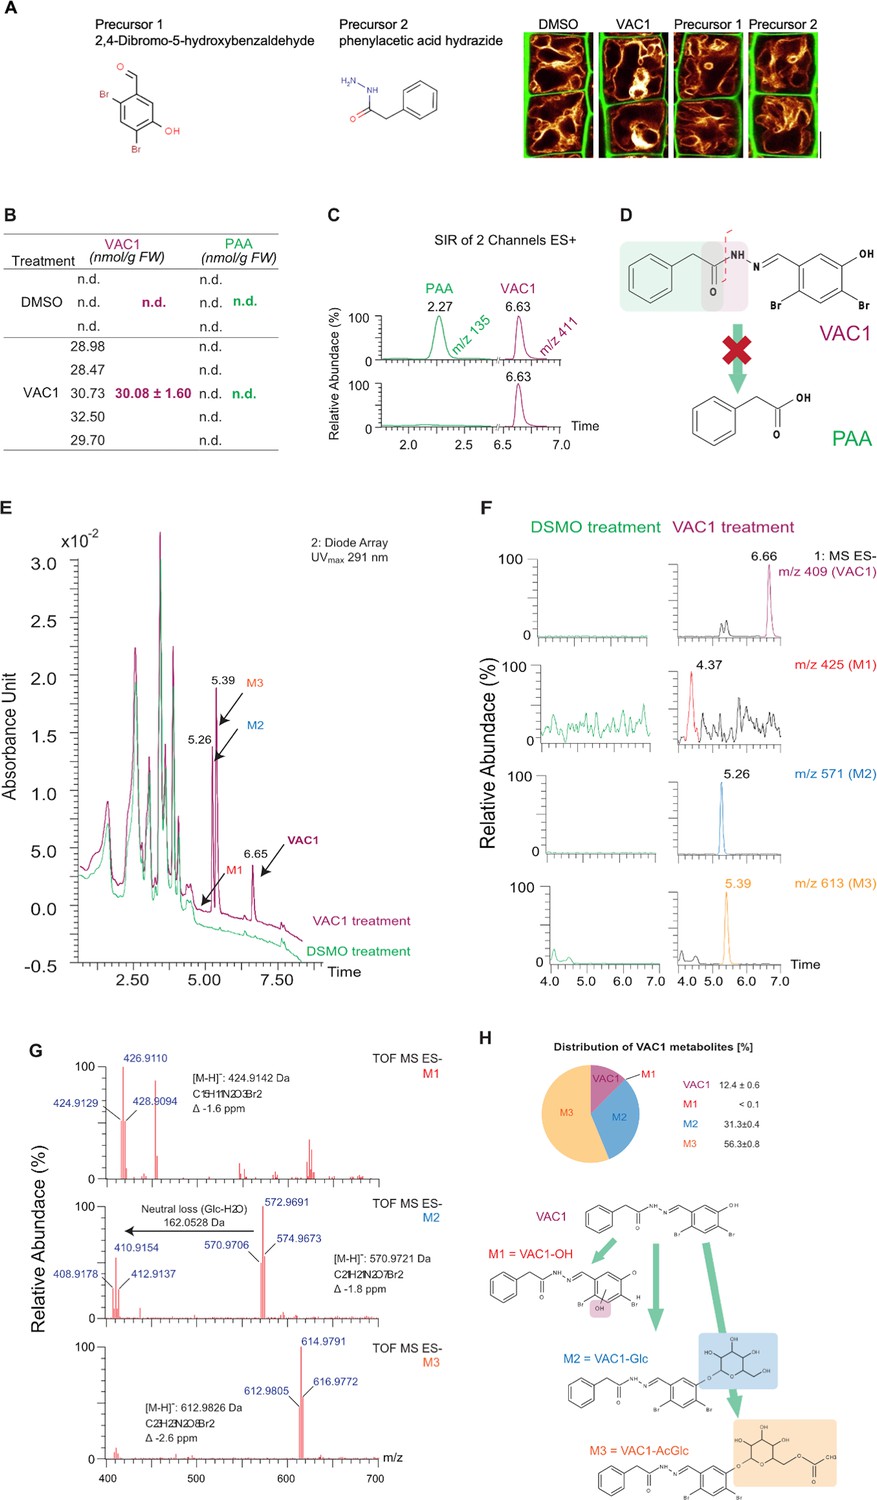
Characterization of VAC1 stability in planta.
(A) Cell wall and vacuolar membrane in late meristematic atrichoblast cells were visualized with propidium iodide (PI) (green) and pUBQ10::YFP-VAMP711 (yellow). Six-day-old seedlings were treated with solvent control (dimethyl sulfoxide [DMSO]) or 10 µM VAC1, 10 µM Precursor 1, or 10 µM Precursor 2, respectively, in liquid medium. Scale bar: 5 µm. (B) Six-day-old seedlings were treated with DMSO or 10 µM VAC1 for 2.5 hr in liquid medium, flash-frozen in liquid nitrogen, and subsequently extracted by liquid-liquid extraction (Pařízková et al., 2021). Quantification of VAC1 and PAA levels was performed by UHPLC-UV-MS system operating in selected ion recording (SIR) mode and calculated from an external calibration using a recovery factor. No PAA was detected in DMSO- and VAC1-treated seedlings. Values are means ± SD, n=3 for DMSO and n=5 for VAC1 treatment. (C) Representative SIR chromatograms of PAA and VAC1 comparing retention times obtained by measuring a standard mixture (top ion chromatogram) with analysis of plant extract (bottom ion chromatogram). (D) The potential of VAC1 to be metabolized into free auxin PAA (green rectangle) by cleavage of the peptide bond (red rectangle) was not confirmed. (E) UV chromatograms (λmax = 291 nm) of DMSO- and VAC1-treated plant extracts obtained in (B) revealed peaks, additional to VAC1 (retention time: 6.65 min), corresponding to three unidentified metabolites M1, M2, and M3 eluting from the LC column at 4.37, 5.26, and 5.39 min, respectively. (F) Representative extracted-ion chromatograms of VAC1 and M1-M3 metabolites with their respective retention times and precursor masses were obtained by UHPLC-UV-MS analysis in negative full-scan mode from DMSO- and VAC1-treated plant extracts. (G) High-resolution mass spectrometry (HRMS) spectra of three VAC1 metabolites M1-M3. All metabolites were identified using an UHPLC-HRMS method based on correlation of the theoretical monoisotopic weights of deprotonated forms [M-H]- and detected exact masses of each precursor of M1-M3 as well as based on the presence of two bromine stable isotopes (79Br and 81Br) in VAC1 structure showing the characteristic isotope pattern of dibromo derivatives. (H) Predicted chemical structures of VAC1 metabolites and their distribution (%) in extracts of 6-day-old seedlings treated with 10 µM VAC1 for 2.5 hr in liquid medium. The percentage representation of metabolites was determined by the integration of respective peaks in the UHPLC-UV chromatograms (λmax = 291 nm). Values are means ± SD (n=5). The VAC1 metabolites were identified as VAC1-OH (M1), VAC1-Glc (M2), and VAC1-AcGlc (M3). The color rectangles display the metabolite changes in VAC1 structure (hydroxylation/glycosylation) in the presumable positions.
Figure 2—figure supplement 4
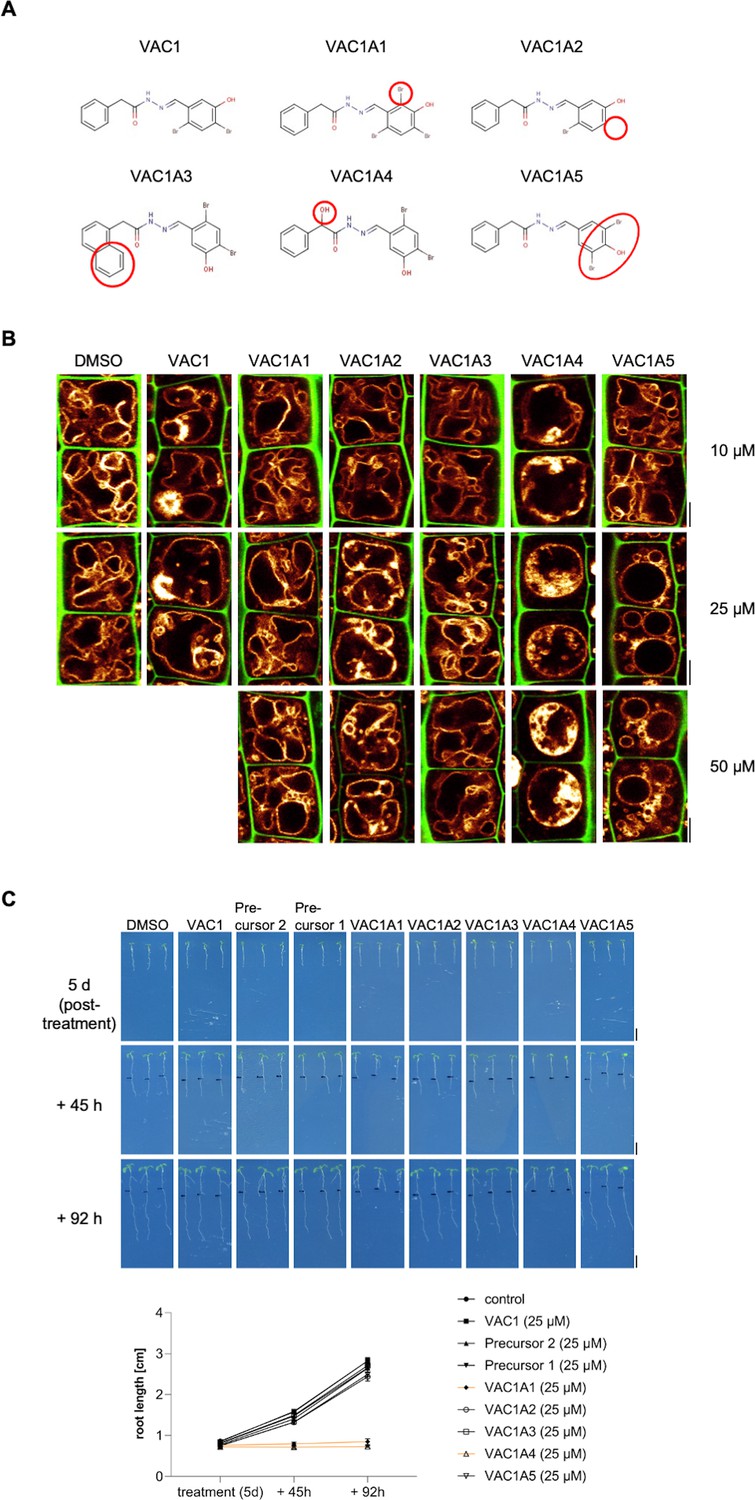
Characterization of VAC1 derivatives (VAC1As).
(A) Structural formulas of the examined VAC1 derivatives. (B) Cell wall and vacuolar membrane in late meristematic atrichoblast cells were visualized with propidium iodide (PI) (green) and pUBQ10::YFP-VAMP711 (yellow). Six-day-old seedlings were treated with solvent control (dimethyl sulfoxide [DMSO]) or indicated concentrations of VAC1 and VAC1As, respectively, for 2.5 hr in liquid medium. Scale bar: 5 µm. (C) Representative images and quantification of main root length after compound treatment. Five-day-old seedlings were treated with 25 µM DMSO, VAC1, precursors, and VAC1As, respectively, for 2.5 hr in liquid medium. The seedlings were then transferred to agar plates and scanned at the timepoints indicated. Scale bars: 0.5 cm. Graph shows average root length values with s.e.m. at indicated timepoints.
-
Figure 2—figure supplement 4—source data 1
Figure 2—figure supplement 4C source data.
- https://cdn.elifesciences.org/articles/75945/elife-75945-fig2-figsupp4-data1-v1.xlsx
Figure 2—figure supplement 5
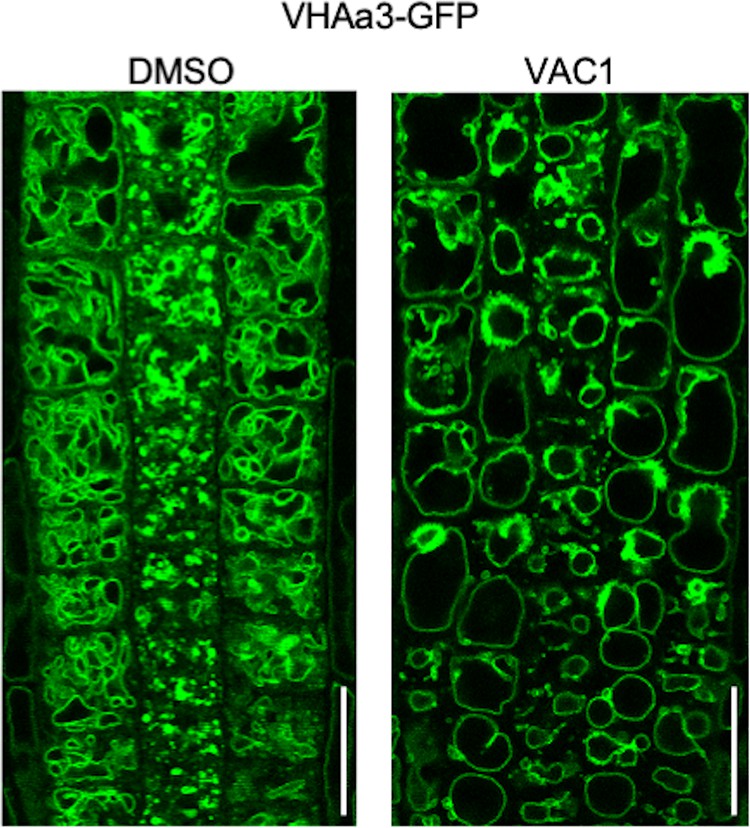
VAC1 induces ectopic accumulation of VHAa3-GFP.
Representative images (scale bars: 25 µm) of VHAa3-GFP-expressing roots. Six-days-old seedlings (n=12–14) were treated with solvent control dimethyl sulfoxide (DMSO) or 10 µM VAC1 for 2 hr in liquid medium prior image acquisition.
Figure 3
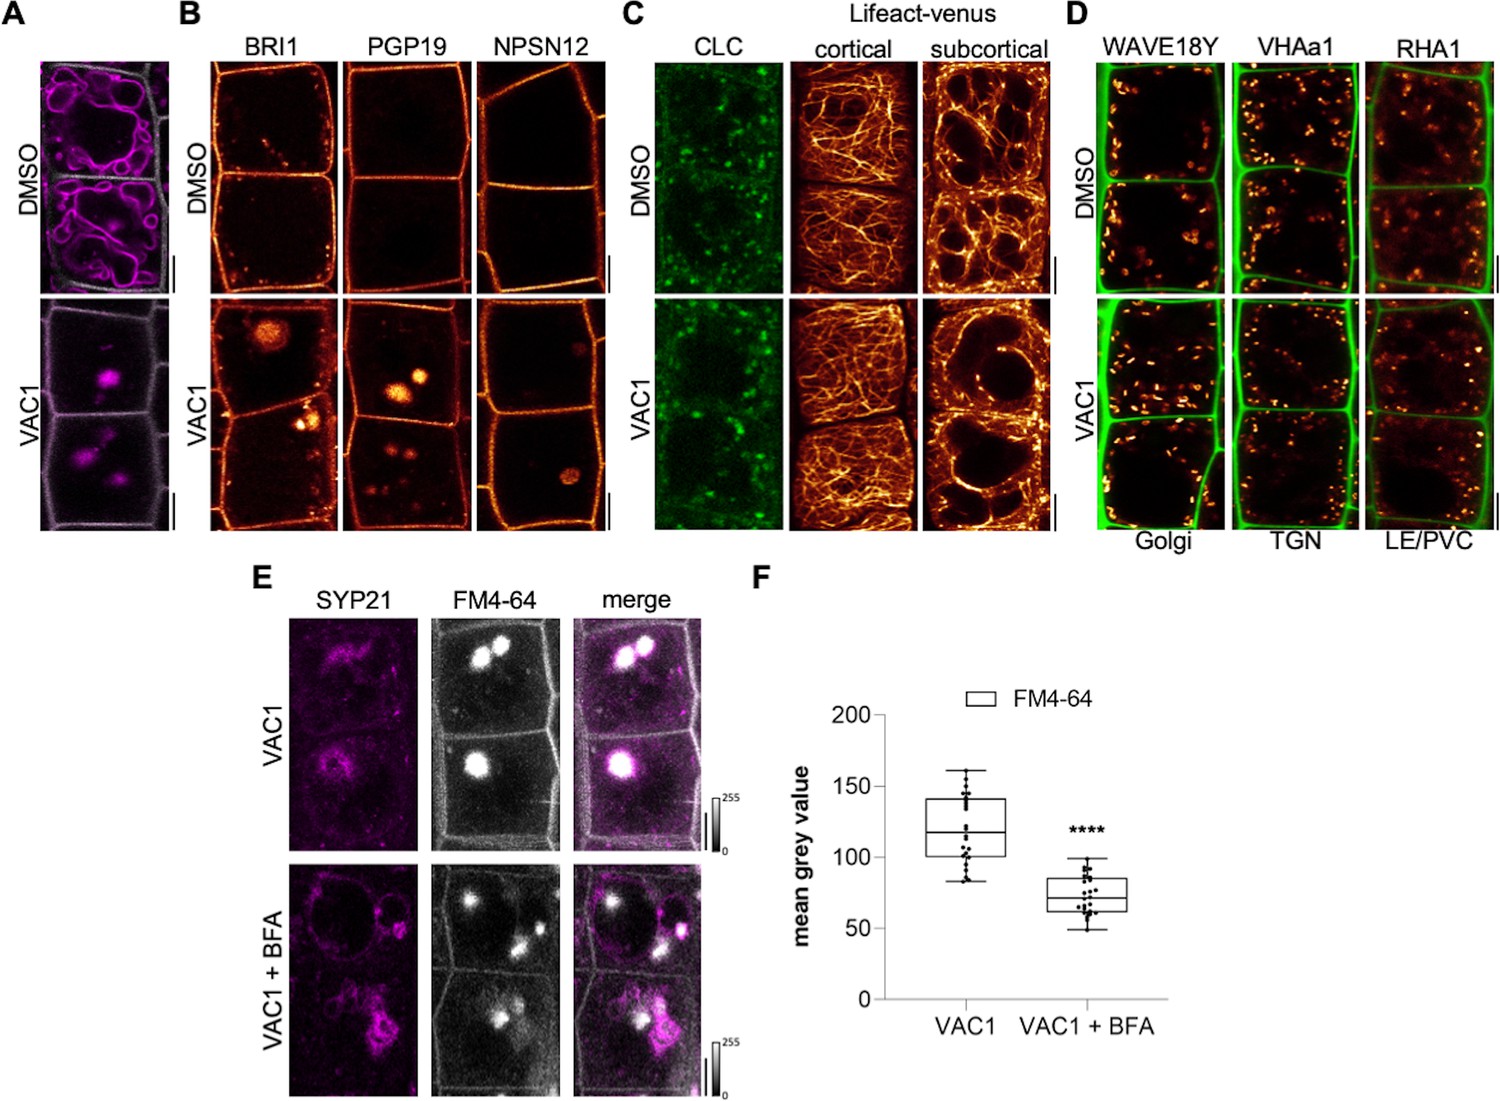
VAC1 interferes with vesicle trafficking to the vacuole.
(A) Tonoplast and plasma membrane of late meristematic atrichoblast cells were visualized with FM4-64 (magenta) and pUBQ10::NPSN12-YFP (gray), respectively. Six-day-old seedlings were pre-treated with dimethyl sulfoxide (DMSO) or 10 µM VAC1 for 30 min., then pulse-stained with 4 µM FM4-64 for 5 min and subsequently transferred to liquid medium containing DMSO or 10 µM VAC1 for 3 hr. Scale bars: 5 µm. (B) Representative images of 6-day-old seedlings of plasma membrane marker lines pBRI1::BRI1-GFP (yellow), pPGP19::PGP-19-GFP (yellow), and pUBQ10::NPSN12-YFP (yellow). Seedlings were treated with DMSO or 10 µM VAC1 for 2.5 hr in liquid medium. Scale bars: 5 µm. (C) Representative images of 6-day-old seedlings of CLC-GFP (green) and Lifeact-venus (yellow) marker lines. Seedlings were treated with DMSO or 10 µM VAC1 for 2.5 hr in liquid medium. Scale bars: 5 µm. (D) Representative images of 6-day-old WAVE18Y (pUBQ10::GOT1-YFP) (yellow), pVHAa1::VHAa1-GFP (yellow), and WAVE7Y (pUBQ10::RABF2a-YFP) (yellow) treated with DMSO or 10 µM VAC1 for 2.5 hr in liquid medium. Cell walls were counterstained with propidium iodide (PI). Scale bars: 5 µm. (E) Six-day-old p35S::SYP21-GFP (magenta) seedlings were pulse-stained with 4 µM FM4-64 (gray) for 5 min and subsequently pre-treated with 25 µM BFA for 30 min before adding 10 µM VAC1 or solvent control for another 60 min. The treatments were conducted in liquid medium. Scale bars: 5 µm. (F) Boxplots show mean gray values of FM4-64 fluorescence signal in VAC1 bodies in VAC1 (n=24) or VAC1 + BFA (n=24) treatments. Student’s t-test (****p<0.0001). Boxplots: Box limits represent 25th percentile and 75th percentile; horizontal line represents median. Whiskers display min. to max. values. Data points are individual measured values. Boxplots: Box limits represent 25th percentile and 75th percentile; horizontal line represents median. Whiskers display min. to max. values. Data points are individual measured values.
-
Figure 3—source data 1
Figure 3F source data.
- https://cdn.elifesciences.org/articles/75945/elife-75945-fig3-data1-v1.xlsx
Figure 4 with 1 supplement

VAC1 specifically interferes with vacuolar soluble N-ethylmaleimide-sensitive-factor attachment receptor (SNARE)-dependent vesicle fusion to the tonoplast.
(A) Representative images (scale bars: 0.5 cm) and (B) quantification of main root length of 7-day-old amiR Vps3 seedlings germinated on solvent control medium (dimethyl sulfoxide [DMSO], n=27), 10 µM VAC1 (n=25), 30 µM dexamethasone (DEX, n=19) or 10 µM VAC1 and 30 µM DEX (n=17). Two-way ANOVA with Sidaks’s multiple comparisons test (DMSO to VAC1: ****p<0.0001, DEX to DEX + VAC1: p=0.3247). (C) Boxplots show relative growth of VAC1 samples and DEX + VAC1 samples. Statistics is based on two-way ANOVA and multiple comparison analysis (DMSO to VAC1: ****p<0.0001, DEX to DEX + VAC1: p=0.0660). (D) Representative images of late meristematic atrichoblast cells in amiR Vps3 x pUBQ10::YFP-VAMP711 seedlings. Seedlings were grown for 4 days, then transferred to plates containing solvent control (DMSO) or 30 µM DEX for another 3 days and subsequently treated for 2.5 hr with DMSO, 30 µM DEX, 10 µM VAC1 or VAC1 + DEX, respectively, in liquid medium. Scale bars: 5 µm. (E) Representative images of late meristematic atrichoblast cells of pUBQ10::YFP-VAMP711 in wild-type and vti11 background. Propidium iodide (PI) (green) and pUBQ10::YFP-VAMP711 (yellow) depict cell wall and vacuolar membrane, respectively. Six-day-old seedlings were treated with solvent control (DMSO) or 10 µM VAC1 for 2.5 hr in liquid medium. Scale bars: 5 µm. (F) Representative images (scale bars: 0.5 cm) and (G) boxplots showing main root length of 6-day-old Col-0 and vti11 seedlings grown on solvent control (DMSO) (n=23 for Col-0, n=17 for vti11) or 20 µM VAC1 (n=17 for Col-0, n=15 for vti11) plates. Statistical significance was determined by two-way ANOVA with Sidaks’s multiple comparisons test (Col-0: ****p<0.0001, vti11: ***p=0.0006). (H) Boxplots show relative growth of Col-0 and vti11 on 20 µM VAC1. Statistics is based on two-way ANOVA and multiple comparison analysis (Col-0: ****p<0.0001, vti11: ***p=0.0001). Boxplots: Box limits represent 25th percentile and 75th percentile; horizontal line represents median. Whiskers display min. to max. values. Data points are individual measured values. Boxplots: Box limits represent 25th percentile and 75th percentile; horizontal line represents median. Whiskers display min. to max. values. Data points are individual measured values.
-
Figure 4—source data 1
Figure 4B, C source data.
- https://cdn.elifesciences.org/articles/75945/elife-75945-fig4-data1-v1.xlsx
-
Figure 4—source data 2
Figure 4G,H source data.
- https://cdn.elifesciences.org/articles/75945/elife-75945-fig4-data2-v1.xlsx
Figure 4—figure supplement 1

VPS39-deprived roots are sensitive to VAC1.
(A) Representative images (scale bars: 0.5 cm) and (B) quantification of main root length of 7-day-old amiR vps3 seedlings germinated on solvent control medium (dimethyl sulfoxide [DMSO], n=22), 10 µM VAC1 (n=17), 30 µM DEX (n=16), or 10 µM VAC1 and 30 µM DEX (n=19), respectively. Two-way ANOVA with Sidaks’s multiple comparisons test (****p<0.0001). (C) Boxplots show relative growth of VAC1 samples and DEX + VAC1 samples. Statistics is based on two-way ANOVA and multiple comparison analysis (****p<0.0001). Boxplots: Box limits represent 25th percentile and 75th percentile; horizontal line represents median. Whiskers display min. to max. values. Data points are individual measured values. Representative experiments are shown.
-
Figure 4—figure supplement 1—source data 1
Figure 4—figure supplement 1B, C source data.
- https://cdn.elifesciences.org/articles/75945/elife-75945-fig4-figsupp1-data1-v1.xlsx
Figure 5 with 1 supplement
Endocytic trafficking is enhanced at the onset of cellular elongation.
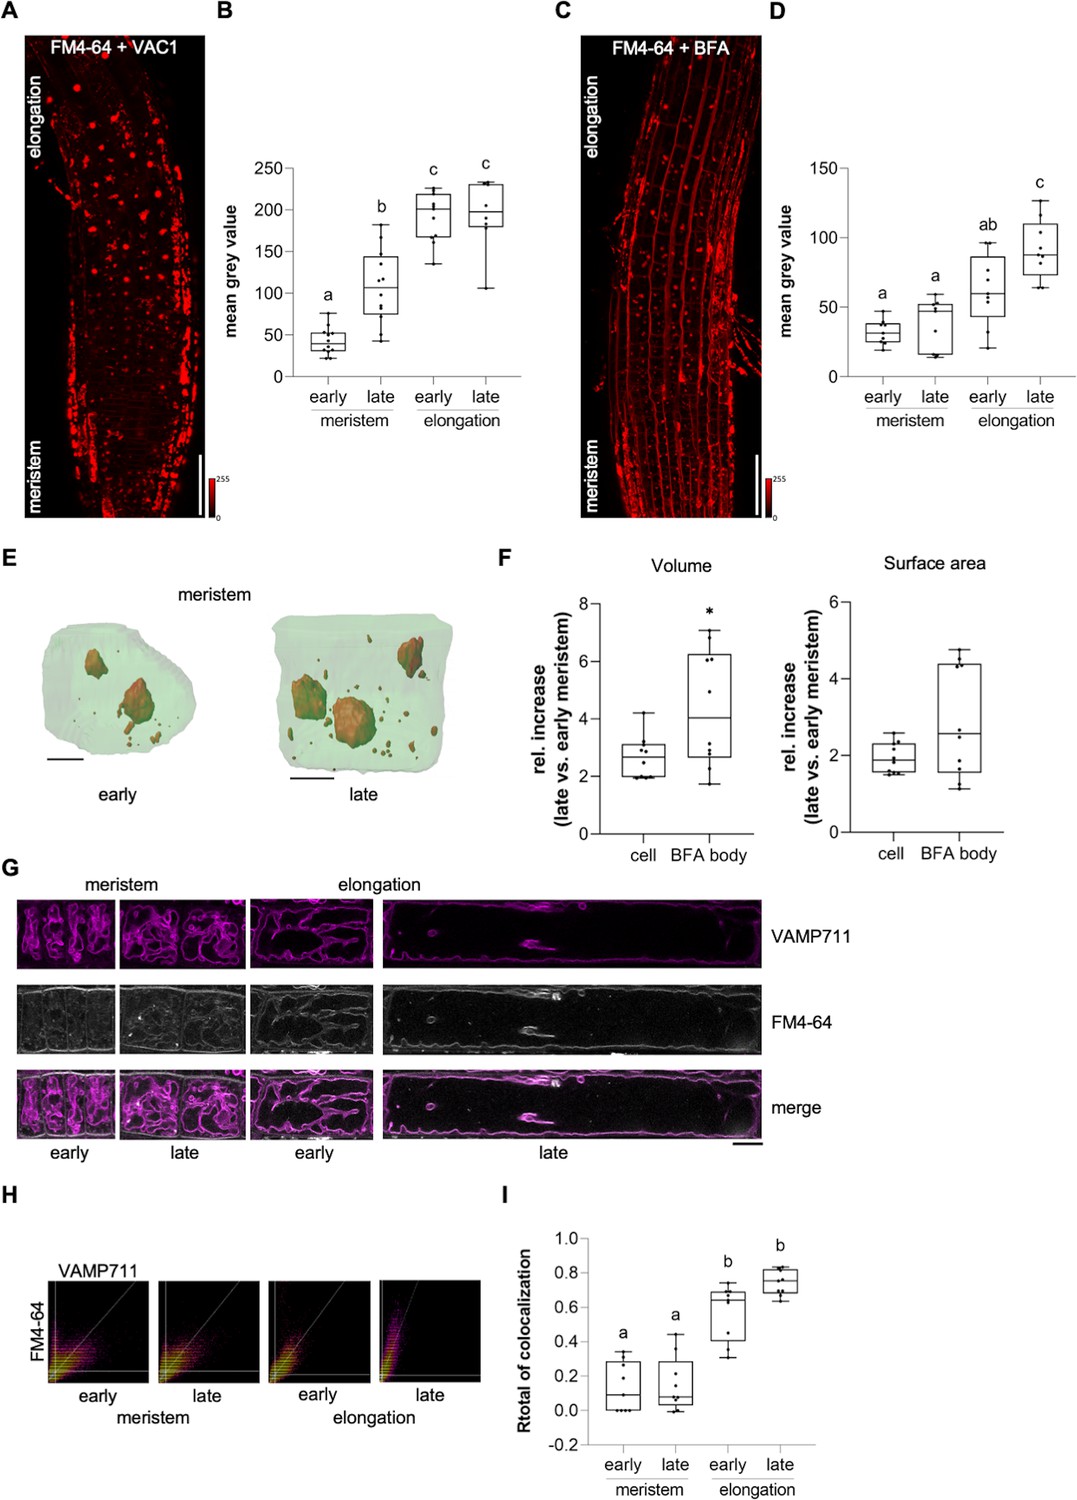
(A) Representative maximum z-projection (scale bar: 50 µm) of 6-day-old Col-0 roots. Seedlings were pre-treated with 10 µM VAC1 for 30 min before staining in 4 µM FM4-64 (red) for 30 min. Seedlings were then de-stained for 1.5 hr and subsequently treated with 10 µM VAC1 for 3 hr before image acquisition. The treatments and the staining were conducted in liquid medium. (B) Boxplots showing mean gray values of FM4-64 fluorescence signal in VAC1 bodies in early (n=12) and late (n=12) meristematic cells as well as in the early (n=11) and late (n=8) elongation zone. One-way ANOVA with Tukey’s multiple comparisons test (b: p=0.0002, c: p<0.0001). (C) Representative maximum z-projection (scale bar: 50 µm) of 6-day-old Col-0 roots. Seedlings were pulse-stained in 4 µM FM4-64 (red) for 5 min and subsequently transferred to 25 µM BFA for 30 min prior to image acquisition. Staining and treatment was done in liquid medium. (D) Boxplots showing mean gray values of FM4-64 fluorescence signal in BFA bodies in early (n=9) and late (n=9) meristematic cells as well as in the early (n=9) and late (n=9) elongation zone. One-way ANOVA with Tukey’s multiple comparisons test (b to a [early meristem]: p=0.0123, c to a: p<0.0001, c to b: p=0.0178). (E) 3D reconstructions of plasma membrane (pUBQ10::NPSN12-YFP, green) and BFA bodies (red) in early (left) and late (right) meristematic cells. Six-day-old pUBQ10::NPSN12-YFP seedlings were pulse-stained with 4 µM FM4-64 for 5 min and subsequently transferred to 50 µM BFA for 2 hr prior image acquisition. Staining and treatment was done in liquid medium. Scale bars: 5 µm. (F) Boxplots depict relative increase of cell and BFA body volume (n=10, respectively) and relative increase of cell and BFA body surface area (n=10, respectively) in late meristematic cells when compared to early meristematic cells. Student’s t-test (*p=0.0217). (G) Representative images of early and late meristematic cells and cells of the early and late elongation zone. Six-day-old pUBQ10::YFP-VAMP711 seedlings were pulse-stained with 4 µM FM4-64 for 5 min and subsequently de-stained in liquid medium for 3 hr before image acquisition. Overlay of YFP-VAMP711 (magenta, upper panel) and FM4-64 (gray, middle panel) fluorescence signals is shown in the lower panel. Scale bar: 10 µm. Note: Images are assembled on white background. (H) Representative scatter plots depict co-localization of YFP-VAMP711 and FM4-64 in cells of the early and late meristem and in the early and late elongation zone. (I) Boxplots show Rtotal of co-localization between YFP-VAMP711 and FM4-64 in early (n=9) and late (n=9) meristematic cells and in the early (n=9) and late (n=9) elongation zone. One-way ANOVA with Tukey’s multiple comparisons test (b: p<0.0001). Boxplots: Box limits represent 25th percentile and 75th percentile; horizontal line represents median. Whiskers display min. to max. values. Data points are individual measured values. Boxplots: Box limits represent 25th percentile and 75th percentile; horizontal line represents median. Whiskers display min. to max. values. Data points are individual measured values.
-
Figure 5—source data 1
Figure 5B source data.
- https://cdn.elifesciences.org/articles/75945/elife-75945-fig5-data1-v1.xlsx
-
Figure 5—source data 2
Figure 5D source data.
- https://cdn.elifesciences.org/articles/75945/elife-75945-fig5-data2-v1.xlsx
-
Figure 5—source data 3
Figure 5F source data.
- https://cdn.elifesciences.org/articles/75945/elife-75945-fig5-data3-v1.xlsx
-
Figure 5—source data 4
Figure 5I source data.
- https://cdn.elifesciences.org/articles/75945/elife-75945-fig5-data4-v1.xlsx
Figure 5—figure supplement 1
FM4-64 evenly stains transversal plasma membranes in the meristem and elongation zone.
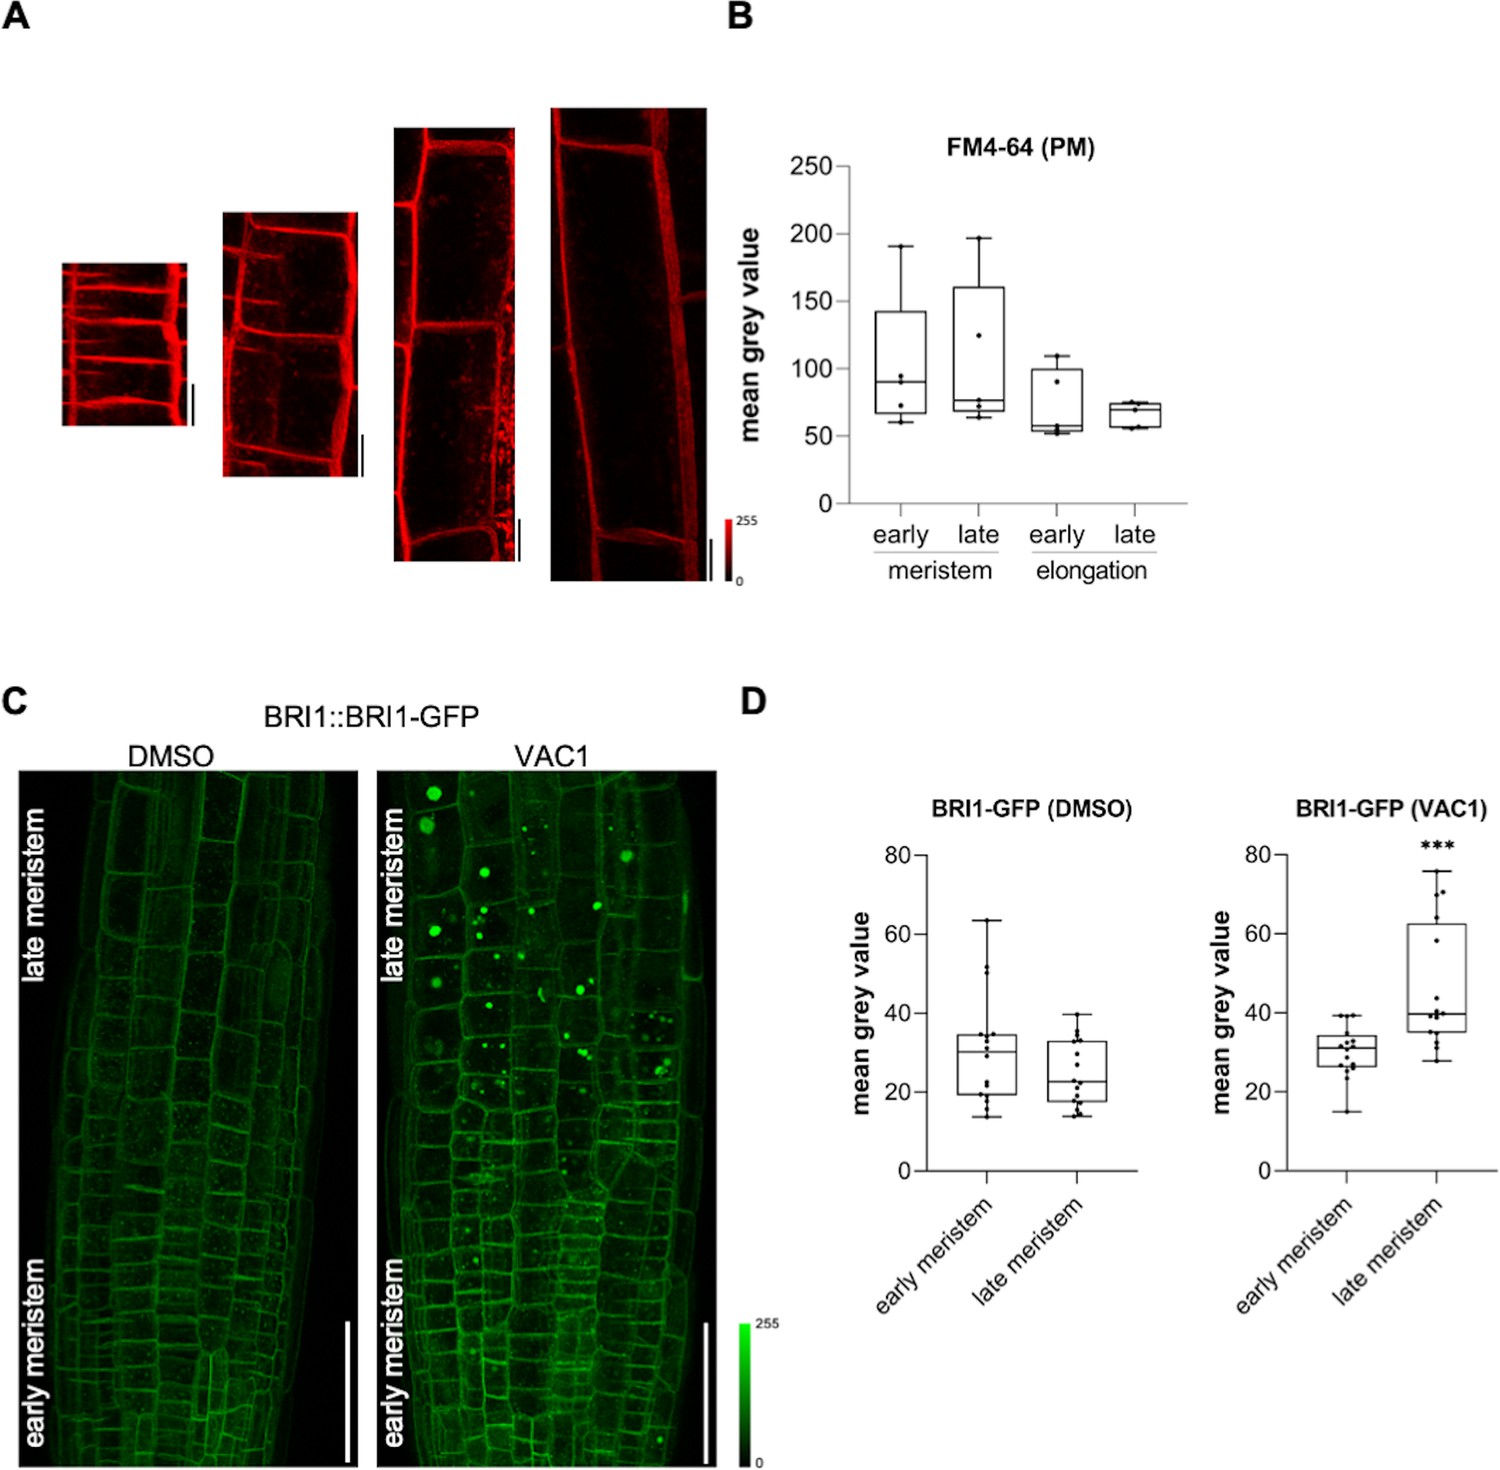
(A) Representative images (scale bars: 10 µm) of 6-day-old Col-0 seedlings that were pulse-stained with 4 µM FM4-54 (red) for 5 min in liquid medium before image acquisition. (B) Quantification of FM4-64 fluorescence signal of transversal plasma membranes in the early (n=5) and late (n=5) meristem and in the early (n=5) and late (n=5) elongation zone. One-way ANOVA with Tukey’s multiple comparisons test (ns). (C) Representative maximum z-projection (scale bars: 50 µm) of 6-day-old BRI1-GFP (green) expressing roots. Seedlings were treated with solvent control (dimethyl sulfoxide [DMSO]) or 10 µM VAC1 for 2 hr in liquid medium before image acquisition. (D) Boxplots show mean gray values of intracellular BRI1-GFP fluorescence signal in early (n=16) and late (n=16) meristematic cells. Student’s t-test (p=0.0007). Boxplots: Box limits represent 25th percentile and 75th percentile; horizontal line represents median. Whiskers display min. to max. values. Data points are individual measured values. Boxplots: Box limits represent 25th percentile and 75th percentile; horizontal line represents median. Whiskers display min. to max. values. Data points are individual measured values.
-
Figure 5—figure supplement 1—source data 1
Figure 5—figure supplement 1B source data.
- https://cdn.elifesciences.org/articles/75945/elife-75945-fig5-figsupp1-data1-v1.xlsx
-
Figure 5—figure supplement 1—source data 2
Figure 5—figure supplement 1D source data.
- https://cdn.elifesciences.org/articles/75945/elife-75945-fig5-figsupp1-data2-v1.xlsx
Figure 6
Coordinated surface increase at plasma membrane and tonoplast during cell elongation.
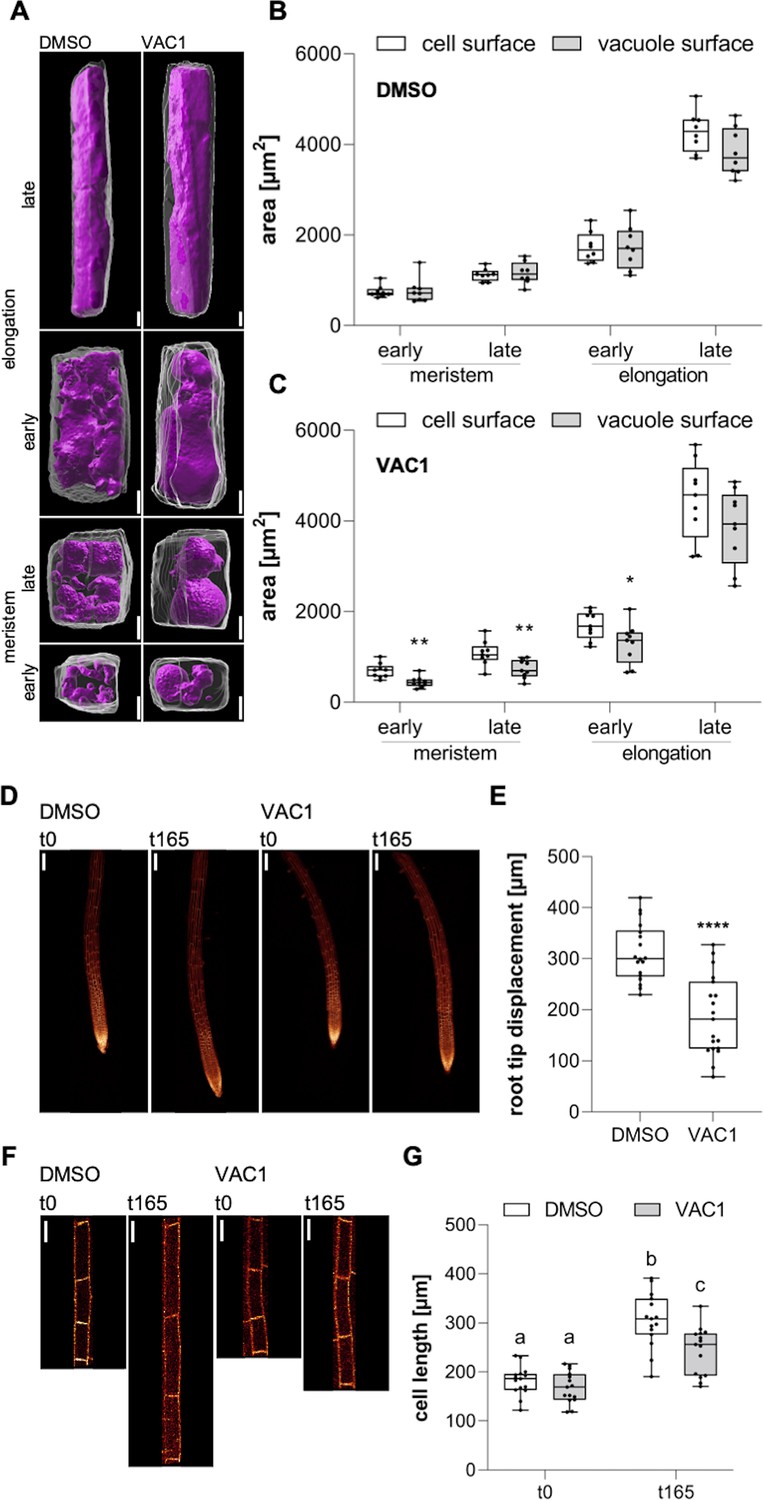
(A) 3D reconstructions of propidium iodide (PI)-stained cell walls (gray) and BCECF-stained vacuoles (magenta) in the early and late meristem and in the early and late elongation zone. Scale bars: 5 µm. (B) and (C) Boxplots show cell and vacuole surface areas in the defined zones and indicated treatments. Six-day-old Col-0 seedlings were treated with solvent control (dimethyl sulfoxide [DMSO], n=8) or 10 µM VAC1 (n=9) for 2.5 hr in liquid medium. Student’s t-test (early meristem: **p=0.0018, late meristem: **p=0.0073, early elongation: *p=0.0423). (D) Representative images (scale bars: 100 µm) of maximum z-projections of 6-day-old pUBQ10::NPSN12-YFP (yellow) seedlings. Seedlings were mounted on agar blocks containing solvent control (DMSO) or 20 µM VAC1 in chamber slides. t0 represents the first and t165 the last image acquisition timepoint, given in minutes after mounting. Note: Images are assembled on black background. (E) Boxplots show root tip displacement of DMSO (n=18) and VAC1 (n=19) treated samples at the end of the 165 min time frame. Student’s t-test (****p<0.0001). (F) Representative images (scale bars: 25 µm) of maximum z-projections of 6-day-old pUBQ10::NPSN12-YFP (yellow) seedlings. Seedlings were mounted on agar blocks containing solvent control (DMSO) or 20 µM VAC1 in chamber slides. t0 represents the first and t165 the last image acquisition timepoint, given in minutes after mounting. Note: Images are assembled on black background. (G) Boxplots show cell lengths of DMSO (n=15) and VAC1 (n=15) treated samples at the beginning and the end of the 165 min time frame. One-way ANOVA with Tukey’s multiple comparisons test (b to a: p<0.0001, b to c: p=0.0013, c to a: p≤0.0012).
-
Figure 6—source data 1
Figure 6B, C source data.
- https://cdn.elifesciences.org/articles/75945/elife-75945-fig6-data1-v1.xlsx
-
Figure 6—source data 2
Figure 6E source data.
- https://cdn.elifesciences.org/articles/75945/elife-75945-fig6-data2-v1.xlsx
-
Figure 6—source data 3
Figure 6G source data.
- https://cdn.elifesciences.org/articles/75945/elife-75945-fig6-data3-v1.xlsx
Scheme 1

Preparative route to VAC1.
Reaction conditions: (a) EtOH, cat. Fe2(SO4)3/H2SO4, reflux, 3.5 hr, 87%; (b) N2H4·nH2O (50–60% N2H4), MeOH, rt, 24–72 hr, 68%; (c) Br2 (2.12 eq.), DCM, rt, 22 hr, 64%; (d) EtOH, reflux, 3 hr, 76%.
Additional files
Download links
A two-part list of links to download the article, or parts of the article, in various formats.
Downloads (link to download the article as PDF)
Open citations (links to open the citations from this article in various online reference manager services)
Cite this article (links to download the citations from this article in formats compatible with various reference manager tools)
Endocytic trafficking promotes vacuolar enlargements for fast cell expansion rates in plants
eLife 11:e75945.
https://doi.org/10.7554/eLife.75945


