The enteric nervous system of the C. elegans pharynx is specified by the Sine oculis-like homeobox gene ceh-34
- Department of Biological Sciences, Columbia University, Howard Hughes Medical Institute, United States
Figures
Figure 1

The pharyngeal nervous system of Caenorhabditis elegans.
(A) Overview of the C. elegans alimentary system from Wormbook (Hall and Altun, 2007), with neuronal cell bodies in the pharynx added in red. (B) Projection patterns of pharyngeal neurons within the pharynx displayed in the format of a subway map (kindly provided by SJ Cook). (C) Full connectome of pharyngeal nervous system, adapted from Cook et al., 2020. Square nodes are end organs, including muscle (green), marginal cells (fuchsia), gland cells (blue), epithelial cells (gray), and basement membrane (orange). Neurons are red ellipses. Neurons with outlines have either apical (purple), unexposed (brown), or embedded (blue) sensory endings. Directed chemical edges and undirected gap junction edges are represented by black arrows and red lines, respectively. The line width is proportional to the anatomical strength of that connection (# serial sections). The pharyngeal nervous system is connected to the rest of the nervous system through a single neuron pair (RIP). (D) Single cell transcriptome similarity between neuron types classes with widths of edges indicating strengths of similarity (Pearson correlation coefficients > 0.7), showing that pharyngeal neurons are more similar to each other than to other neurons in the C. elegans nervous system. Reproduced from Taylor et al., 2021. (E) Molecular markers used in this study for cell fate analysis. See Supplementary file 1 for information on reporter constructs.
© 2020, John Wily and Sons. Panel C is adapted from Cook et al., 2020 with permission from John Wily and Sons. It is not covered by the CC-BY 4.0 licence and further reproduction of this panel would need permission from the copyright holder.
© 2021, Elsevier. Panel D is reproduced from Figure 2i in Taylor et al., 2021 with permission from Elsevier. It is not covered by the CC-BY 4.0 licence and further reproduction of this panel would need permission from the copyright holder.
Figure 2 with 2 supplements
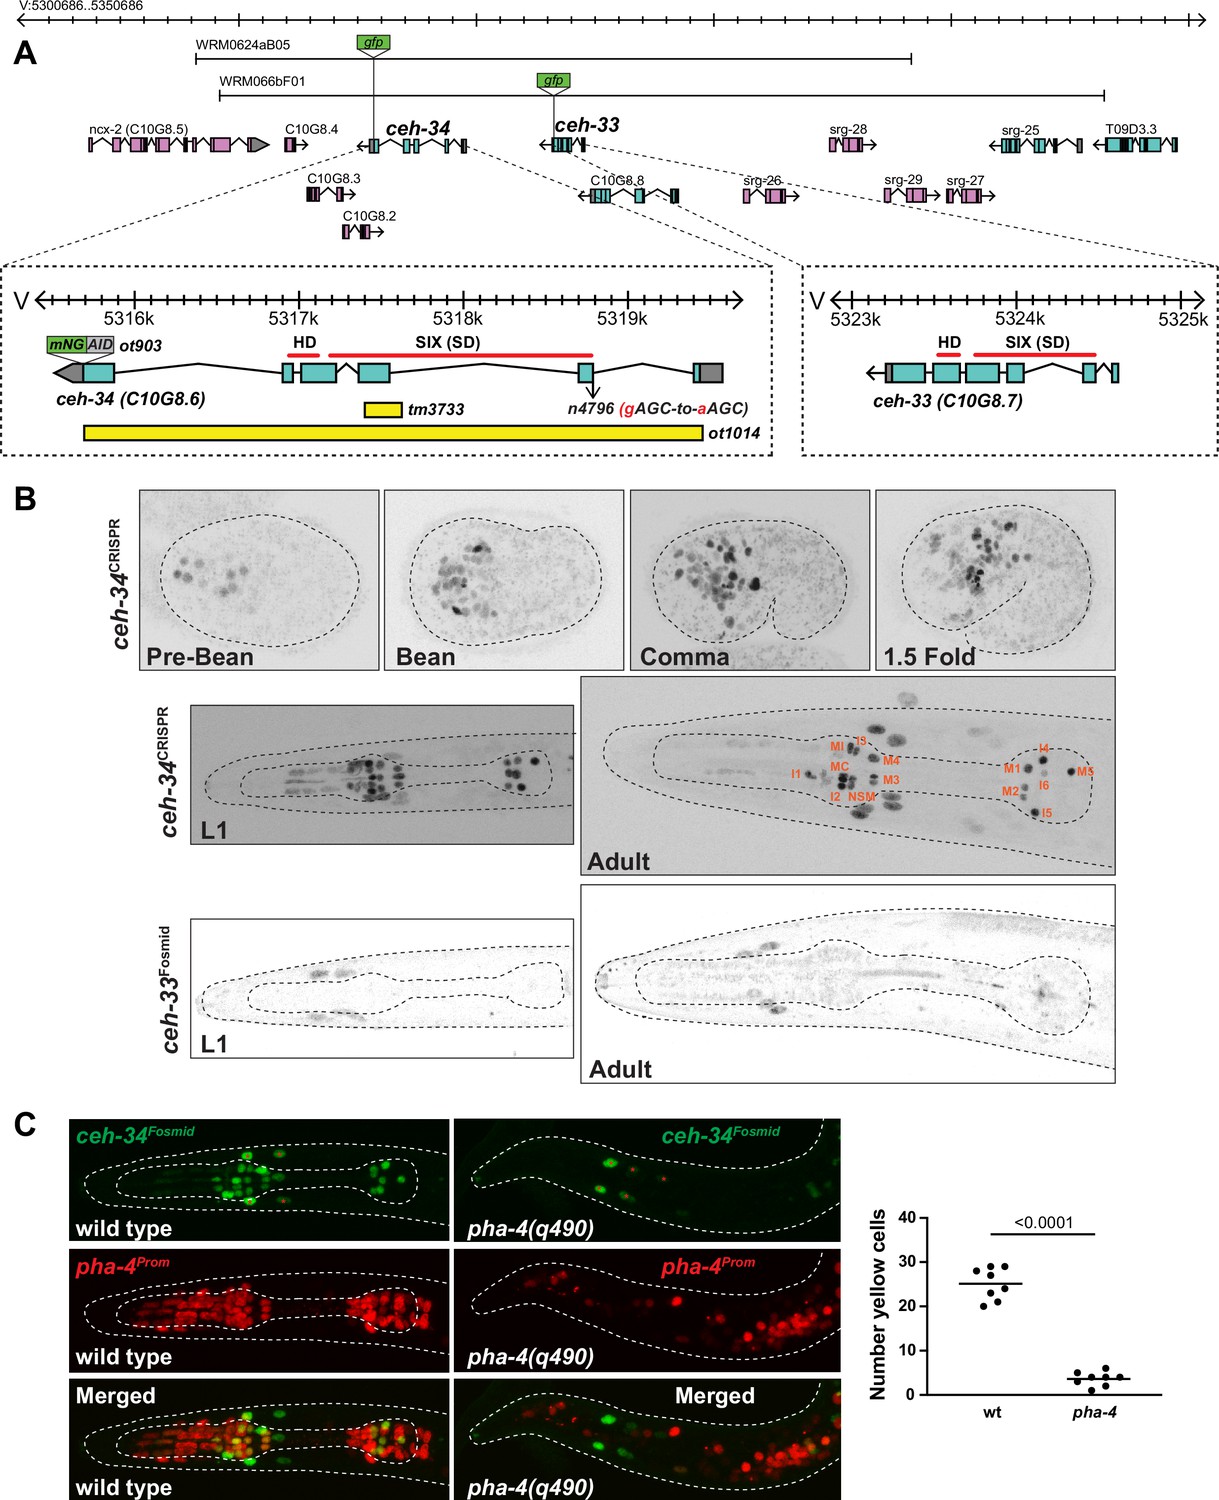
ceh-34 is expressed in all pharyngeal neurons.
(A) ceh-33 and ceh-34 loci showing different alleles and fosmid reporters used in this study. (B) Expression of the ceh-34 CRISPR/Cas-9-engineered reporter allele ot903 over the course of development. ceh-33 fosmid reporter (wgIs575) shows expression in a subset of head muscle cells. (C) Pharynx organ selector pha-4 controls ceh-34 expression (as analyzed with the wgIs524 transgene). Animals were scored at the L1 stage. Presumptive ‘pharyngeal cells’ in pha-4 mutant are marked with a red pha-4 promoter fusion (stIs10077). Cells co-expressing ceh-34 and pha-4 were counted (yellow cells). ceh-34 expression in head muscle cells, marked with red asterisk, is not affected since they do not express pha-4.
Figure 2—figure supplement 1
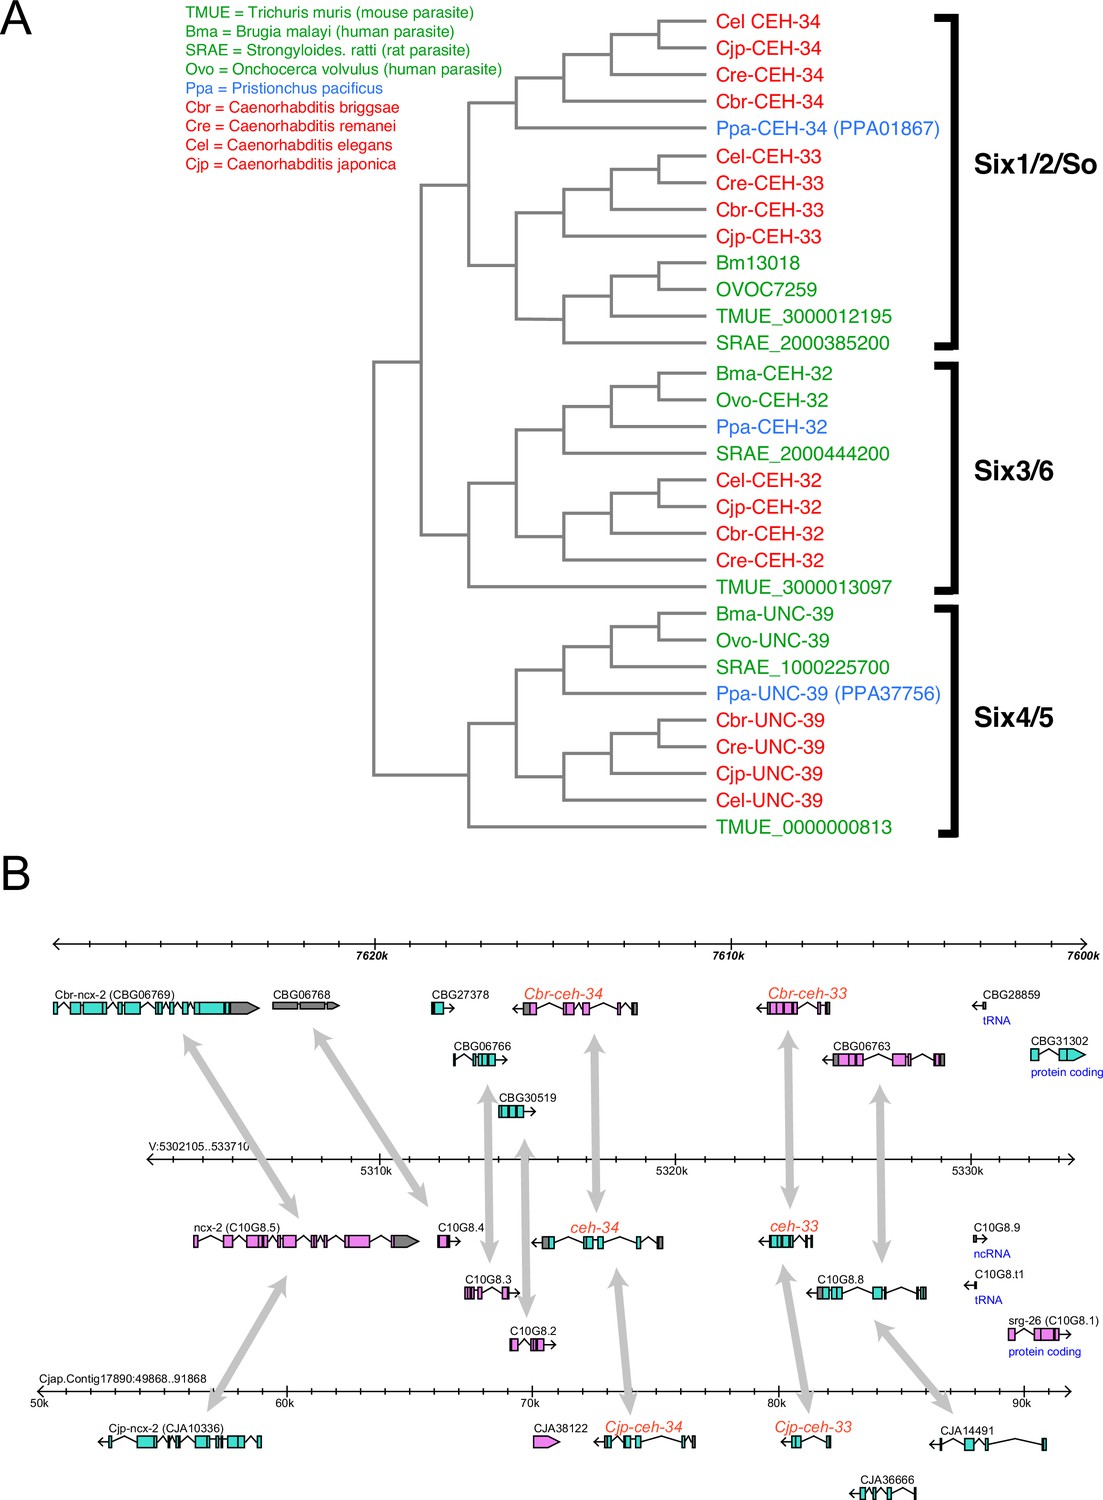
Evolution of Sine oculis orthologs in nematodes.
(A) Phylogeny of ceh-33/34 gene duplication in nematodes. Phylogeny based on homeodomains. (B) Synteny of the ceh-33/ceh-34 locus across several Caenorhabditis species.
Figure 2—figure supplement 2

Expression of the organ selector pha-4.
(A) pha-4 expression (stIs10077) is not affected in ceh-34(tm3733) mutants. Animals were scored at the L1 stage. Statistical analysis was performed using unpaired t-test. (B) pha-4 is continuously expressed in pharyngeal neurons. Expression of a CRISPR/Cas9-engineered pha-4 reporter allele (ot946) in green and a rab-3prom reporter (otIs355) in red in L1 (left), L3 (middle), and adult (right) animals. High magnifications of the anterior bulb provided in the insets at the bottom-left corner of the merged images. Arrows point to pharyngeal neurons expressing both pha-4 and rab-3.
Figure 3

Pharyngeal neurons are generated in ceh-34 mutants but lose their neurotransmitter identity.
(A) Pictures at the L1 stage showing expression of pan-neuronal reporter transgenes that monitor ric-4 (otIs350), ric-19 (otIs380), unc-11 (otIs620), and rab-3 (otIs291) expression. A single focal plane with a subset of pharyngeal neurons marked with red arrows is shown for clarity. (B) ceh-34 affects the expression of neurotransmitter identity genes. Glutamatergic, cholinergic, and serotonergic identity is lost. Reporter transgenes used are eat-4 (otIs487, otIs558), unc-17 (otIs661), tph-1 (otIs517), cat-1 (otIs221), cat-4 (otIs225), and bas-1 (otIs226). Animals were scored at the L1 stage. Statistical analysis was performed using Fisher’s exact test or chi-square test. N is indicated within each bar and represents number of neurons scored. (C) Circuit diagram summarizing the effect of ceh-34 on neurotransmitter identity. Nodes are colored to illustrate neurotransmitter identity gene expression. Nodes lose coloring when expression is affected in ceh-34 mutants (gray indicates partial effect). Edges are colored if the source neuron expresses either eat-4 (glutamatergic), unc-17 (cholinergic), or tph-1 (serotonergic). Edges lose coloring when expression of these genes is affected in the source neuron in ceh-34 mutants (irrespective of whether the effect is partial or total). Note that in this and ensuing circuit diagrams, the existence of gray edges does not indicate whether those edges are generated properly in ceh-34 mutants. Directed edges (arrows) represent chemical synapses. Undirected edges (dashed lines) represent electrical synapses. The width of the edge is proportional to the weight of the connection (the number of serial section electron micrographs where a synaptic specialization is observed).
Figure 4
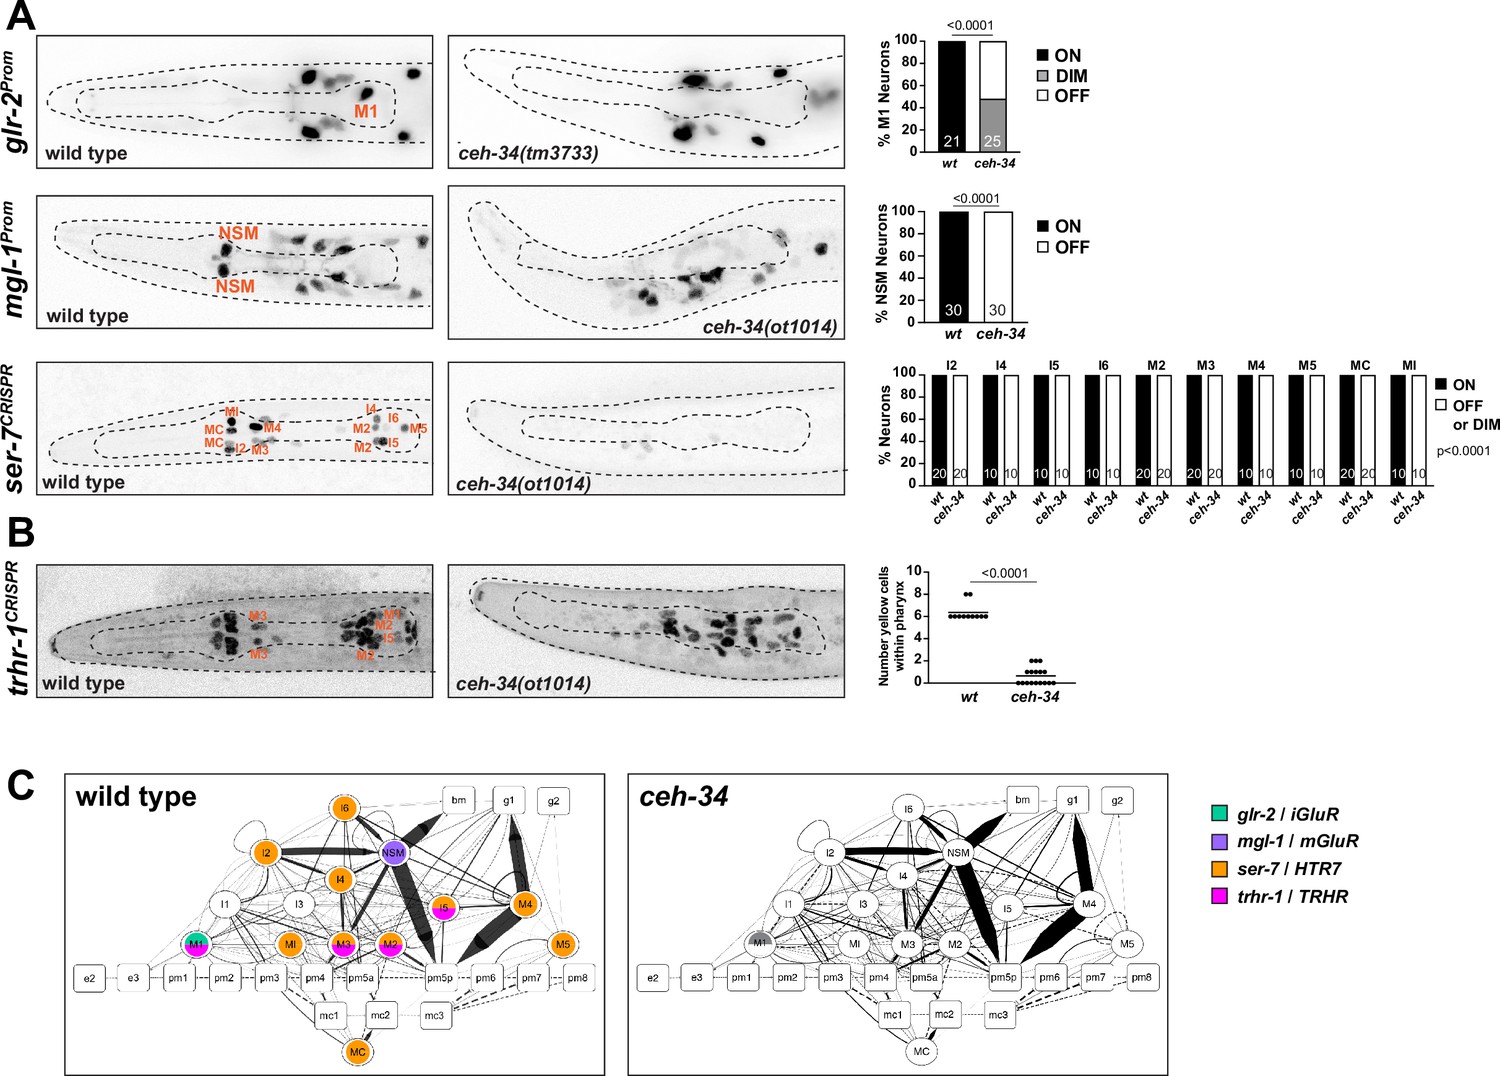
ceh-34 affects the expression of receptors for neurotransmitters and neuropeptides.
(A) Representative pictures and quantification showing neurotransmitter receptor expression loss in ceh-34 mutants. Reporter genes used are transgenes glr-2 (ivIs26), mgl-1 (otIs341), and a CRISPR/Cas9-engineered reporter allele for ser-7 (syb4502). Animals were scored at the L1 stage. Statistical analysis was performed using Fisher’s exact test or chi-square test. N is indicated within each bar and represents number of neurons scored. (B) Representative pictures and quantification showing neuropeptide receptor expression loss in ceh-34 mutants. Reporter gene used is the CRISPR/Cas9-engineered reporter allele trhr-1 (syb4453). Animals were scored at the L1 stage, with a red pan-neuronal marker (otIs355) in the background to facilitate scoring. Number of “yellow“ cells (overlap of red pan-neuronal marker and green reporter) within the pharynx were counted. Statistical analysis was performed using unpaired t-test. (C) Circuit diagram summarizing the effect of ceh-34 on neurotransmitter and neuropeptide receptor expression. Nodes lose coloring when expression is affected in ceh-34 mutants (gray indicates partial effect; ser-7 and trhr-1 are colored white in all neurons since identity of neurons with partial effect is not known). See legend to Figure 3 for more information on circuit diagram features.
Figure 5
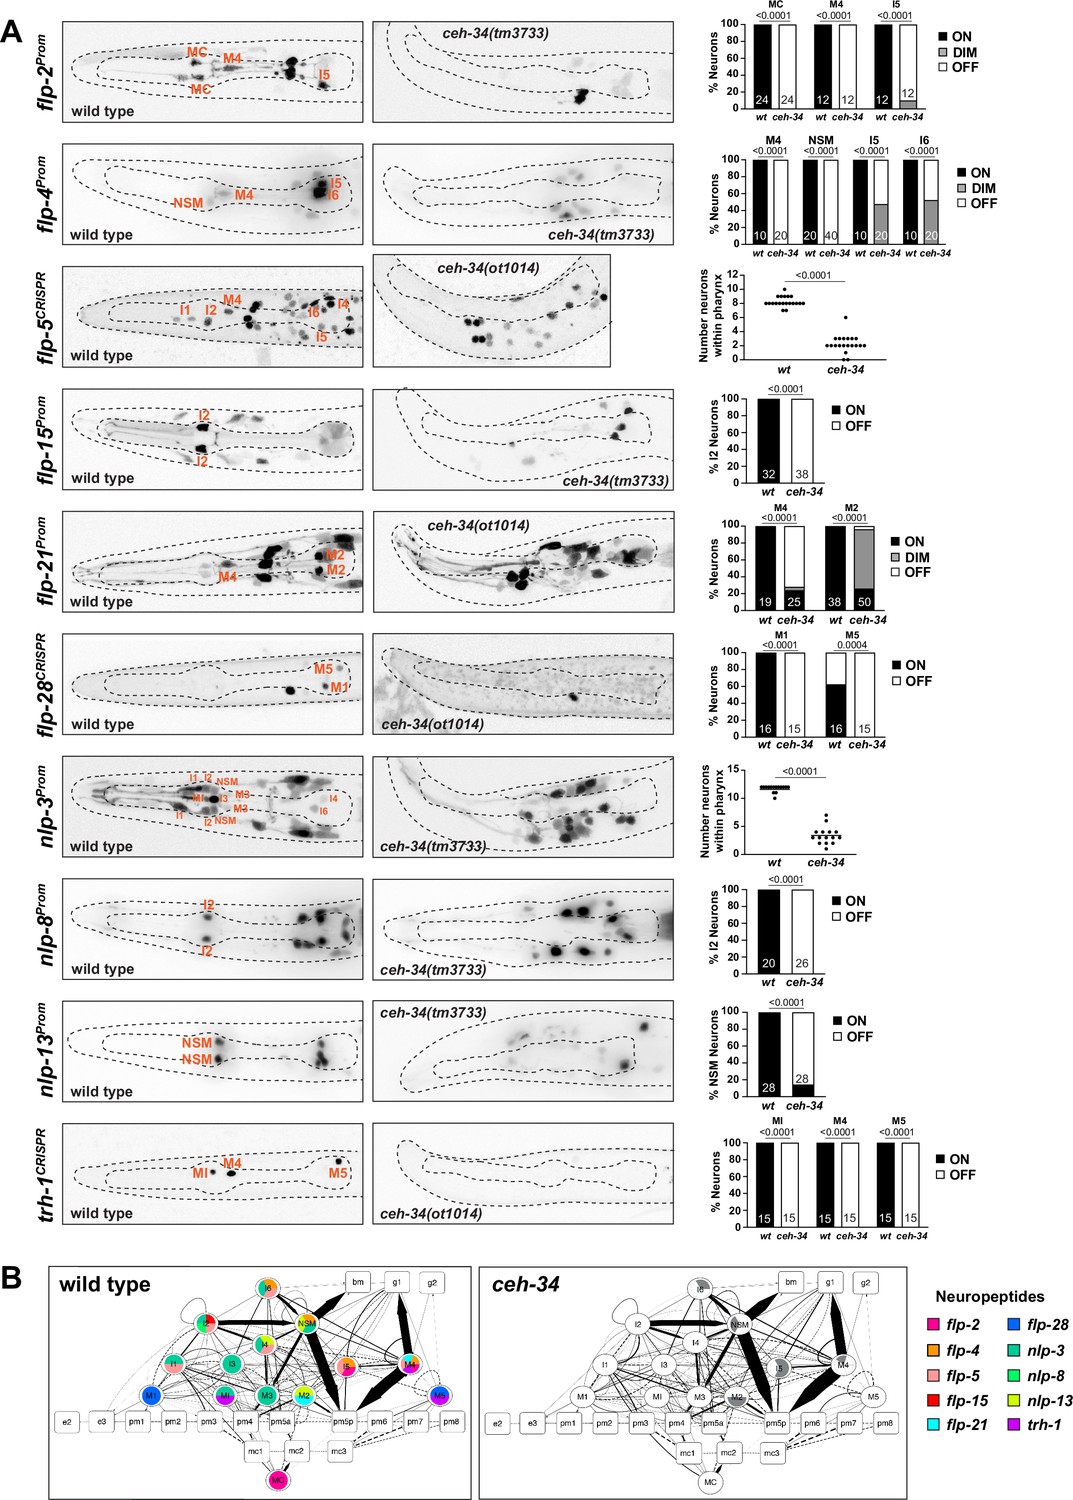
ceh-34 affects neuropeptidergic identity of pharyngeal neurons.
(A) Representative pictures and quantification showing expression of 10 different neuropeptides is affected in ceh-34 mutants. Reporter genes used are transgenic reporters for flp-2 (ynIs57), flp-4 (ynIs30), flp-15 (ynIs45), flp-21 (ynIs80), nlp-3 (otIs695), nlp-8 (otIs711), and nlp-13 (otIs742) and CRISPR/Cas9-engineered reporter alleles for flp-5 (syb4513), flp-28 (syb3207), and trh-1 (syb4421). Animals were scored at the L1 stage. Statistical analysis was performed using Fisher’s exact test, chi-square test, or unpaired t-test. N is indicated within each bar and represents number of neurons scored. (B) Circuit diagram summarizing the effect of ceh-34 on neuropeptide expression. Nodes lose coloring when neuropeptide expression is affected in ceh-34 mutants (gray indicates partial effect; flp-5 and nlp-3 are colored white in all neurons since identity of neurons with partial effect is not known). See legend to Figure 3 for more information on circuit diagram features.
Figure 6 with 2 supplements
ceh-34 affects other identity features of pharyngeal neurons.
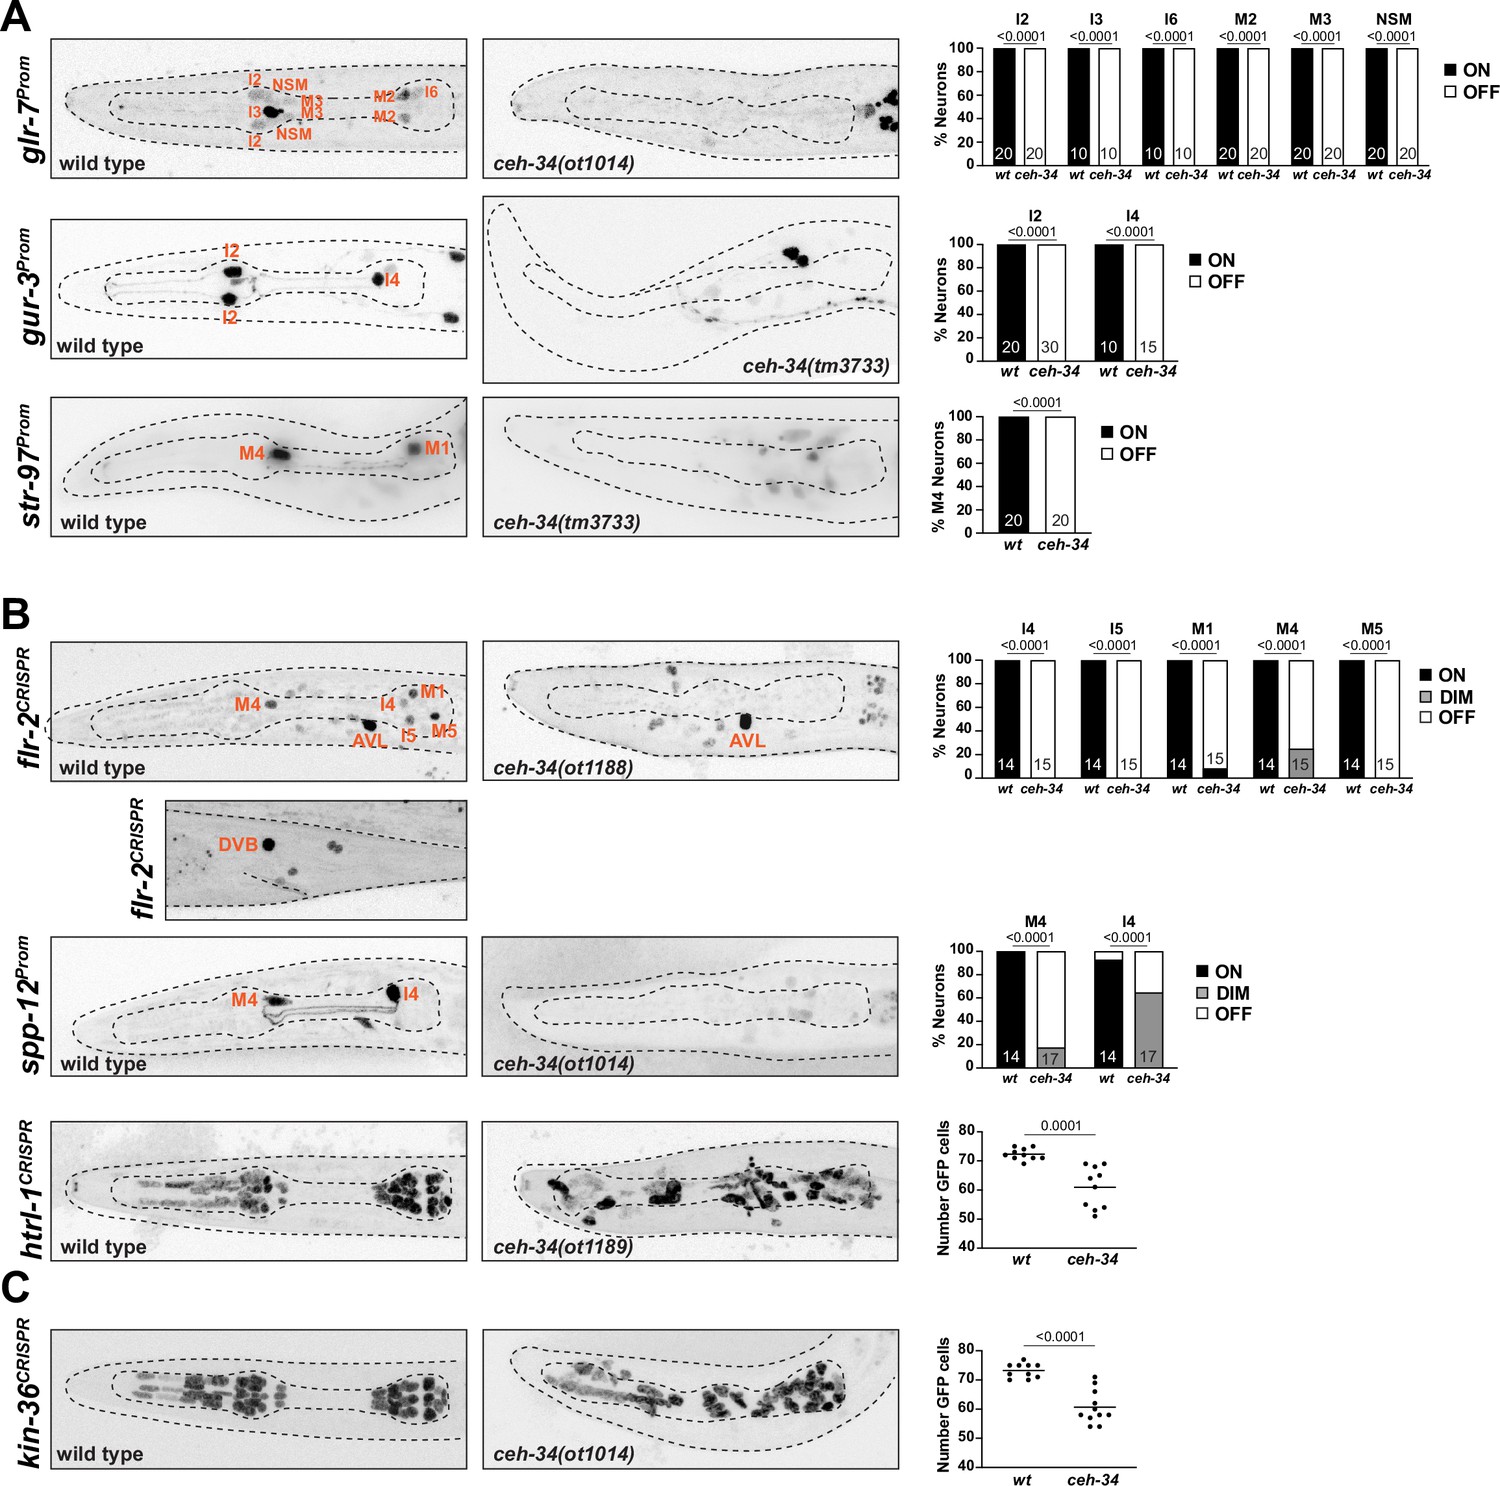
(A) Representative pictures and quantification showing sensory receptor expression loss in ceh-34 mutants. Reporter transgenes used are glr-7 (otIs809), gur-3 (nIs780), and str-97 (otIs716). str-97 (otIs716) is expressed in M1 in adult animals, but also in M4 in first larval stage animals. Expression in M4 is lost in ceh-34 mutant, but expression in M1 could not be reliably scored. Animals were scored at the L1 stage. Statistical analysis was performed using Fisher’s exact test. N is indicated within each bar and represents number of neurons scored. (B) Representative pictures and quantification showing effect of ceh-34 on antimicrobial defense genes. Reporter genes used are spp-12 (otIs868) and CRISPR/Cas9-engineered reporter alleles for flr-2 (syb4861) and htrl-1 (syb4895). Animals were scored at the L1 stage. Statistical analysis was performed using Fisher’s exact test, chi-square test, or unpaired t-test. N is indicated within each bar and represents number of neurons scored. (C) Representative pictures and quantification showing effect of ceh-34 on pan-pharyngeal genes. Reporter gene is the CRISPR/Cas9-engineered reporter allele kin-36 (syb4677). Animals were scored at the L1 stage. Statistical analysis was performed using unpaired t-test.
Figure 6—figure supplement 1
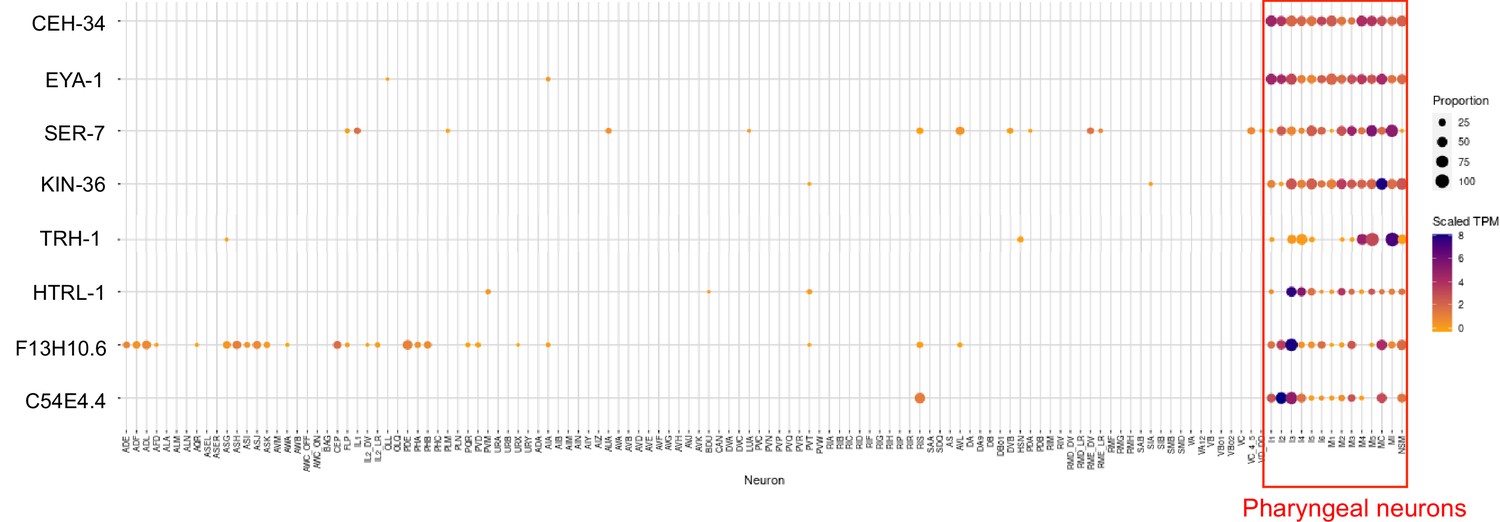
Summary of previous single cell transcriptomic analysis of genes broadly expressed in pharyngeal neurons.
scRNA data was extracted from the Cengen App and displayed in a heatmap format, as previously described (Taylor et al., 2021). The F13H10.6 gene was included here as well because of its striking expression outside the pharyngeal nervous system, in what appear to be exclusively sensory neurons, in line with most if not all pharyngeal neurons also having sensory function. Conversely, previously identified pan-sensory genes (e.g. cilium-related genes) do not show expression in pharyngeal neurons.
Figure 6—figure supplement 2

ceh-34 affects ceh-28 expression.
Representative pictures and quantification are shown. Reporter gene used is ceh-28 (nIs175). Twenty percent of worms show a cell outside the pharynx ectopically expressing ceh-28. Animals were scored at the L1 stage. Statistical analysis was performed using Fisher’s exact test. N is indicated within each bar and represents number of neurons scored.
Figure 7
ceh-34 is continuously required to maintain gene expression and function of pharyngeal neurons.
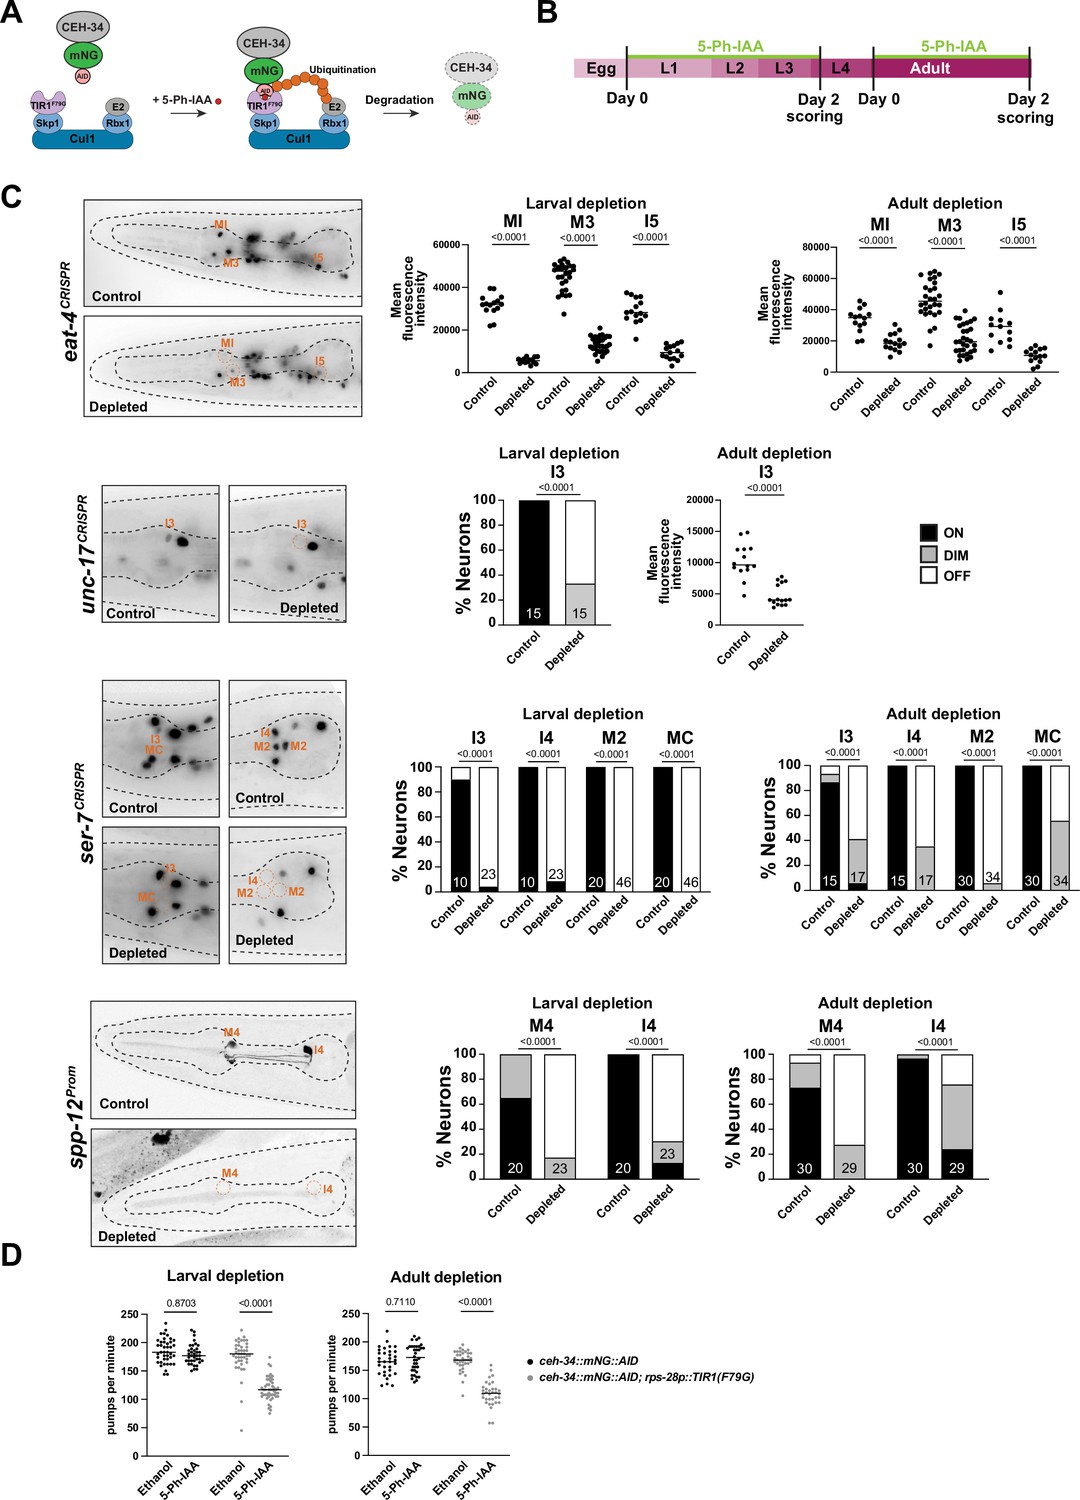
(A) Schematic of the AIDv2 system (Hills-Muckey et al., 2022). Skp1, Cul1, Rbx1, and E2 are phylogenetically conserved components of the E3 ligase complex. TIR1F79G is a modified plant-specific substrate-recognizing subunit of the E3 ligase complex. In the presence of the auxin analog (5-Ph-IAA), the enzyme TIR1F79G binds to the AID fused to a protein of interest, leading to ubiquitination and proteasomal degradation of the targeted protein. (B) Schematic depicting the 5-Ph-IAA treatment. Synchronized populations of worms at the L1 and young adult stage were transferred onto 5-Ph-IAA-coated plates and scored 48 hr later. Worms were expressing TIR1F79G ubiquitously under the rps-28 promoter (cshIs140). The ceh-34 locus was tagged with mNG::AID (ot903). (C) ceh-34 is required for maintained expression of identity genes. Reporter genes used are spp-12 (otIs868) and CRISPR/Cas-9-engineered reporter alleles for eat-4 (syb4257), unc-17 (syb4491), and ser-7 (syb4502). Since ceh-34::mNG::AID (ot903) and reporter genes scored are all fluorescent green, and this was obscuring the scoring on ethanol conditions, the control conditions are reporter genes on their own treated with 5-Ph-IAA. Representative pictures of larval depletion are shown on the left and quantification for larval and adult depletion is shown on the right. Quantification is only shown for neurons that were affected. Neurons unaffected by temporally controlled 5-Ph-IAA addition are also unaffected by constitute 5-Ph-IAA addition, indicating an inability to completely deplete CEH-34 protein. Statistical analysis was performed using unpaired t-test, Fisher’s exact test, or chi-square test. N is indicated within each bar and represents number of neurons scored. (D) ceh-34 is required for maintained pharyngeal function. Larval and adult ceh-34 depletion results in decreased pharyngeal pumping. Statistical analysis was performed using two-way ANOVA.
Figure 8 with 2 supplements
ceh-34 affects the assembly of pharyngeal circuitry.
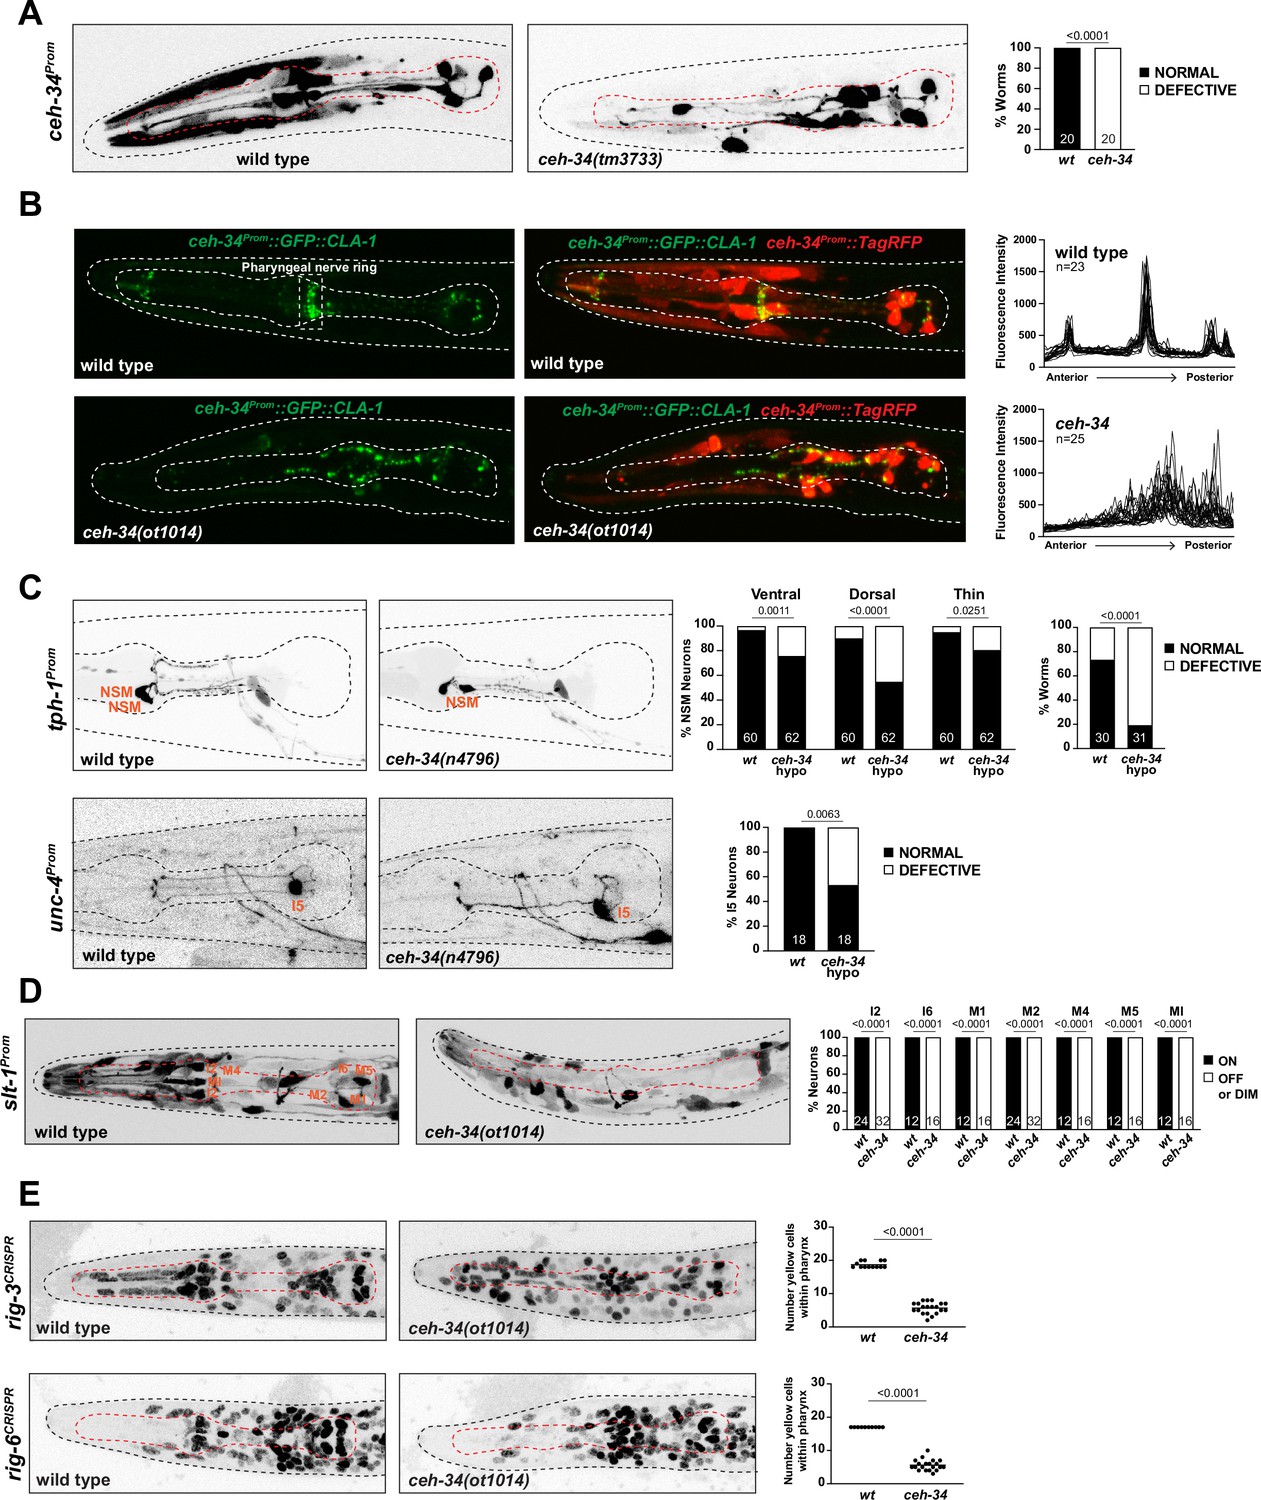
(A) ceh-34 null mutants display disorganized axodendritic projections. Axodendritic projections were scored as a whole rather than by individual neuron because with all the pharyngeal neurons being labeled it was difficult to assign specific projections to individual neurons. Projections were classified as defective only when obviously deviating from the wild-type path. Representative pictures and quantification are shown. Reporter gene is ceh-34 (otIs762). Animals were scored at the L1 stage. Statistical analysis was performed using Fisher’s exact test. N is indicated within each bar and represents number of worms. (B) ceh-34 null mutants show disorganized pharyngeal nerve ring presynaptic specializations as visualized with CLA-1 puncta. Representative pictures are shown. Quantification (right panels) shows GFP fluorescent intensity profiles along the anterior posterior axis. Reporter gene is otIs785. Animals were scored at the L1 stage. (C) ceh-34(n4796) hypomorph mutants show axonal defects in NSM (top panel) and I5 (bottom panel). Representative pictures and quantification are shown. For NSM, the ventral, dorsal, and thin projection (not visible in picture) were scored separately (graph on the left) and then data was pulled together to indicate the percentage of worms showing any defect (graph on the right). Reporter genes used are tph-1 (zdIs13) and unc-4 (otEx7503). Animals were scored at the L4 stage. Statistical analysis was performed using Fisher’s exact test. N is indicated within each bar and represents number of neurons or number of worms. (D) ceh-34 affects expression of the axon guidance cue slt-1 (kyIs174). Representative pictures and quantification are shown. Animals were scored at the L1 stage. Statistical analysis was performed using Fisher’s exact test. N is indicated within each bar and represents number of neurons scored. (E) ceh-34 affects expression of CRISPR/Cas9-engineered gfp reporter alleles of rig-3 (syb4763) and rig-6 (syb4729), two Ig superfamily members. rig-3 and rig-6 are expressed in almost all pharyngeal neurons plus many other cells within and outside the pharynx. Worms were scored with a red pan-neuronal marker (otIs355) or a red ceh-34promoter fusion (stIs10447) in the background to facilitate scoring. Number of yellow cells were counted within the pharynx. Animals were scored at the L1 stage. Statistical analysis was performed using unpaired t-test.
Figure 8—figure supplement 1
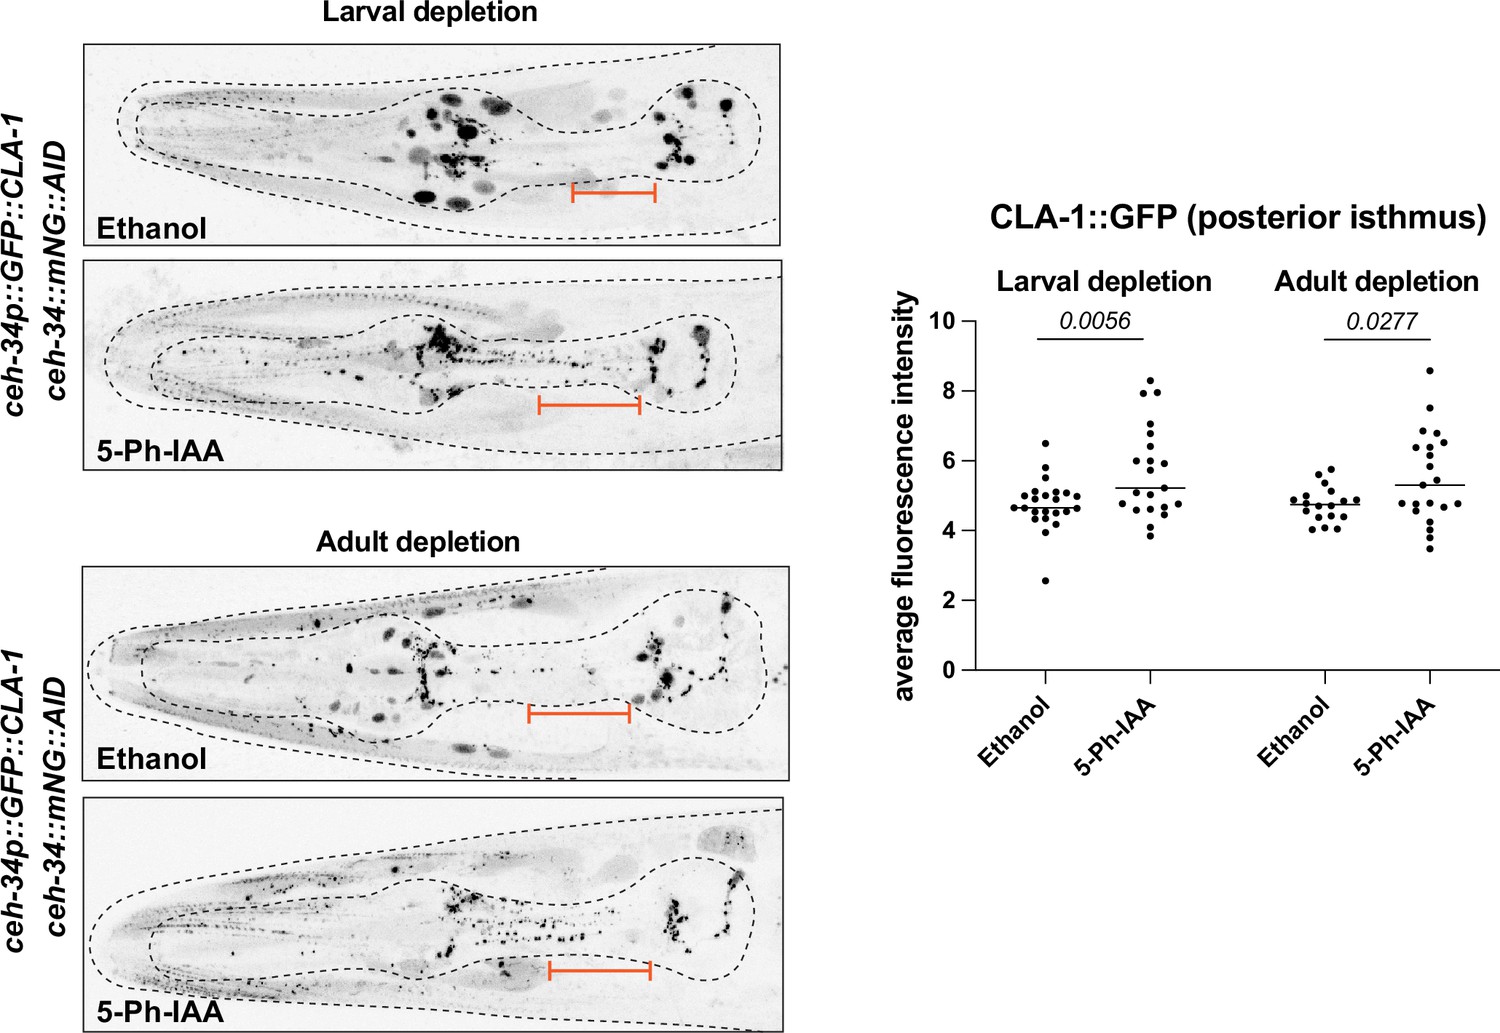
ceh-34 is required to maintain synapse organization in the pharyngeal nervous system.
Synchronized population of worms at the L1 or young adult stage were transferred onto ethanol or 5-Ph-IAA-coated plates and scored 48 hr later. Worms were expressing TIR1F79G ubiquitously under the rps-28 promoter (cshIs140). The cla-1 reporter gene is cla-1 otIs785. Representative pictures and quantification are shown. Orange bar indicates the region that was quantified. Statistical analysis was performed using unpaired t-test.
Figure 8—figure supplement 2
Axonal defects in slt-1 mutants.
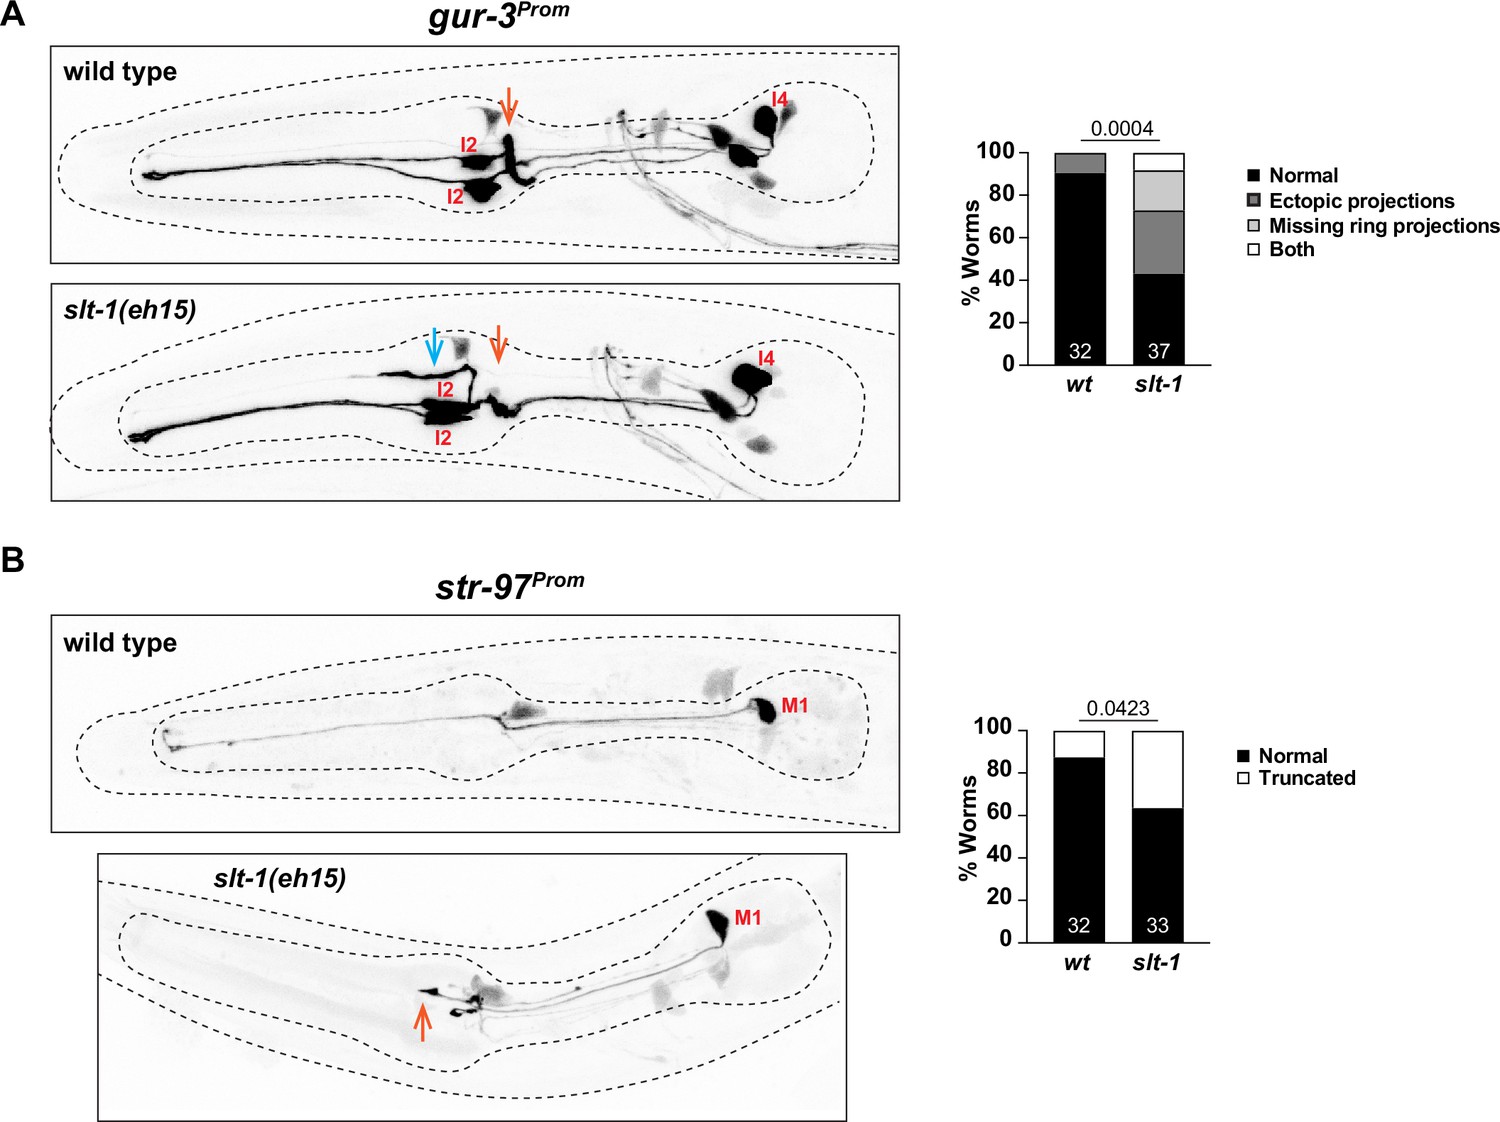
(A) Effects of slt-1 on the I2/I4 neurons. Orange arrows indicate position of pharyngeal nerve ring. Blue arrow indicates ectopic projection. The gur-3 reporter array is nIs780. (B) Effects of slt-1 on the M1 neuron. Orange arrow indicate shortened M1 process, which normally extends to the anterior end of the pharynx. The str-97 reporter array is otIs716. Representative images and quantification are shown. Animals were scored at the L4 stage. Statistical analysis was performed using chi-square test. N is indicated within each bar and represents number of neurons scored.
Figure 9
Limited involvement of eya-1 in pharyngeal neuron identity specification.
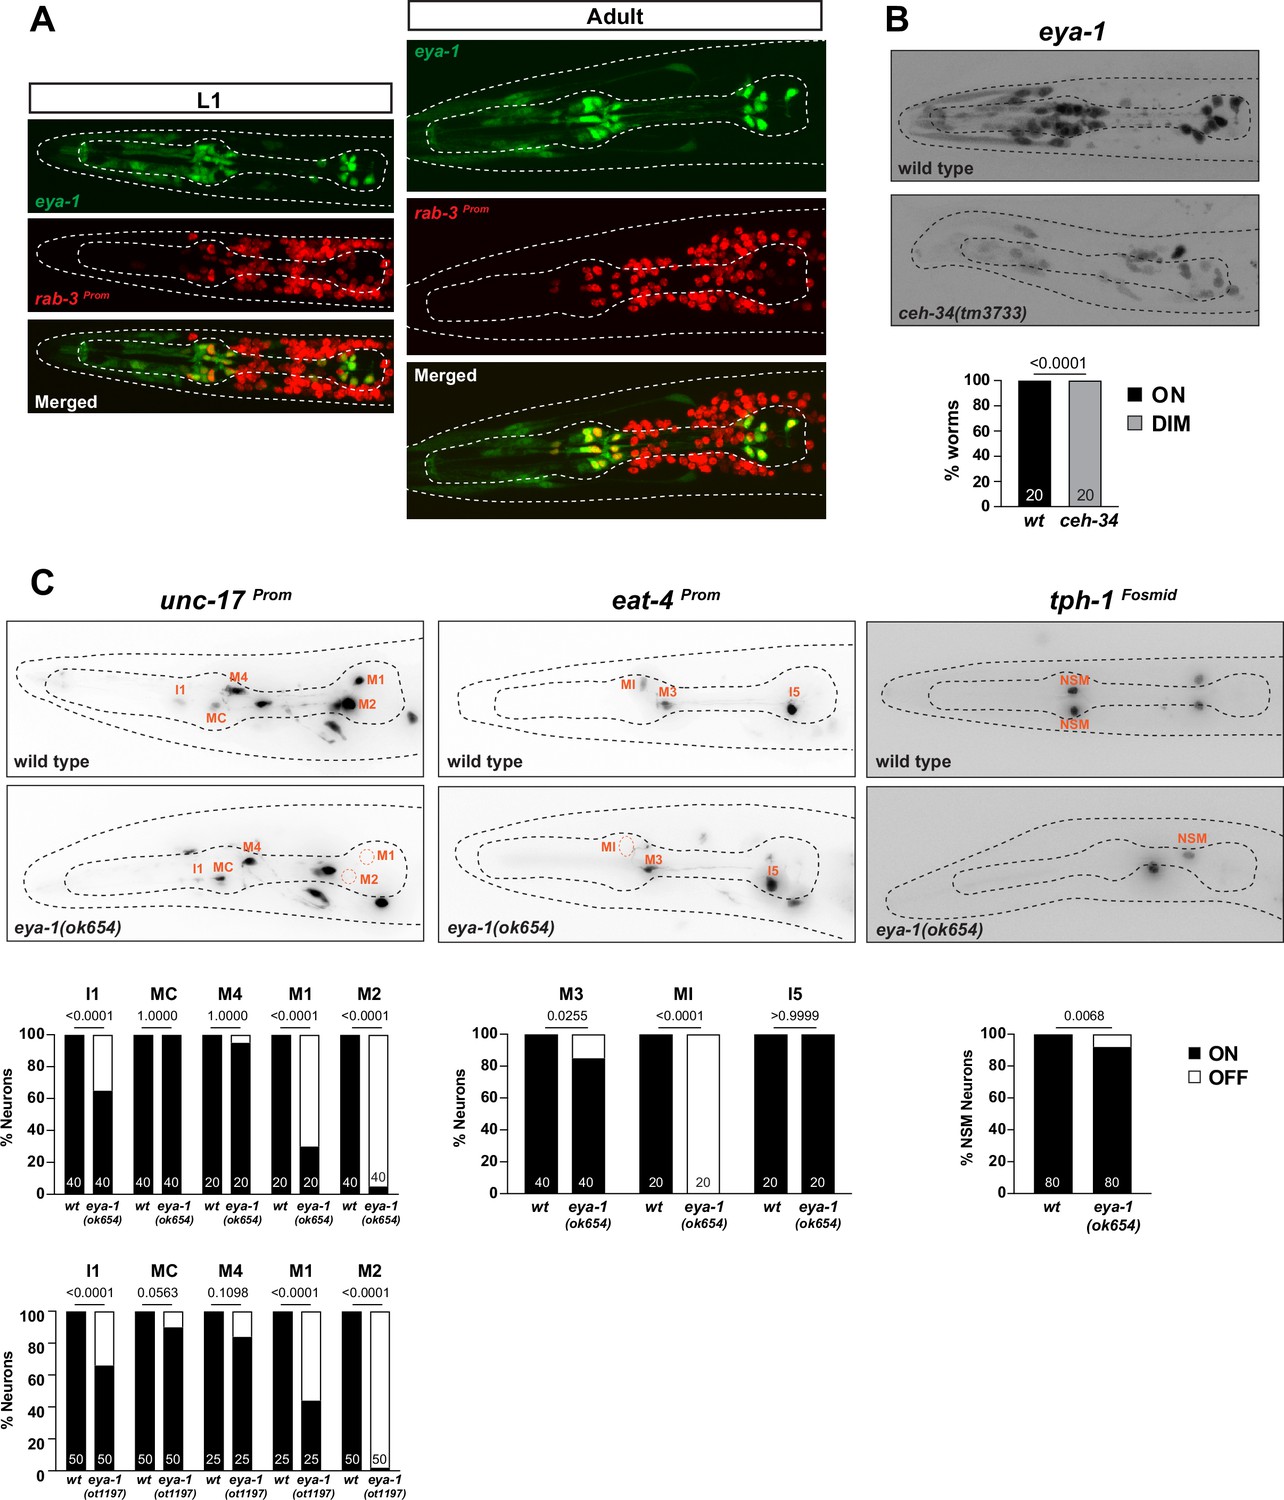
(A) eya-1 is expressed in all pharyngeal neurons throughout the life of the worm. Images of L1 and adult worms showing co-localization of eya-1 expression (nIs352) with the pan-neuronal gene rab-3 (otIs355) in pharyngeal neurons. (B) eya-1 expression is regulated by ceh-34. Representative pictures and quantification are shown. Reporter gene is eya-1 (nIs352). Animals were scored at the L1 stage. Statistical analysis was performed using Fisher’s exact test. N is indicated within each bar and represents number of worms scored. (C) eya-1 mutant animals show defects in neurotransmitter identity specification. Representative images and quantification are shown for unc-17 (otIs661), eat-4 (otIs487), and tph-1 (otIs517). Animals were scored at the L4 stage. Statistical analysis was performed using Fisher’s exact test. N is indicated within each bar and represents number of neurons scored.
Figure 10
ceh-34 cooperates with homeobox genes to specify distinct pharyngeal neuron types.
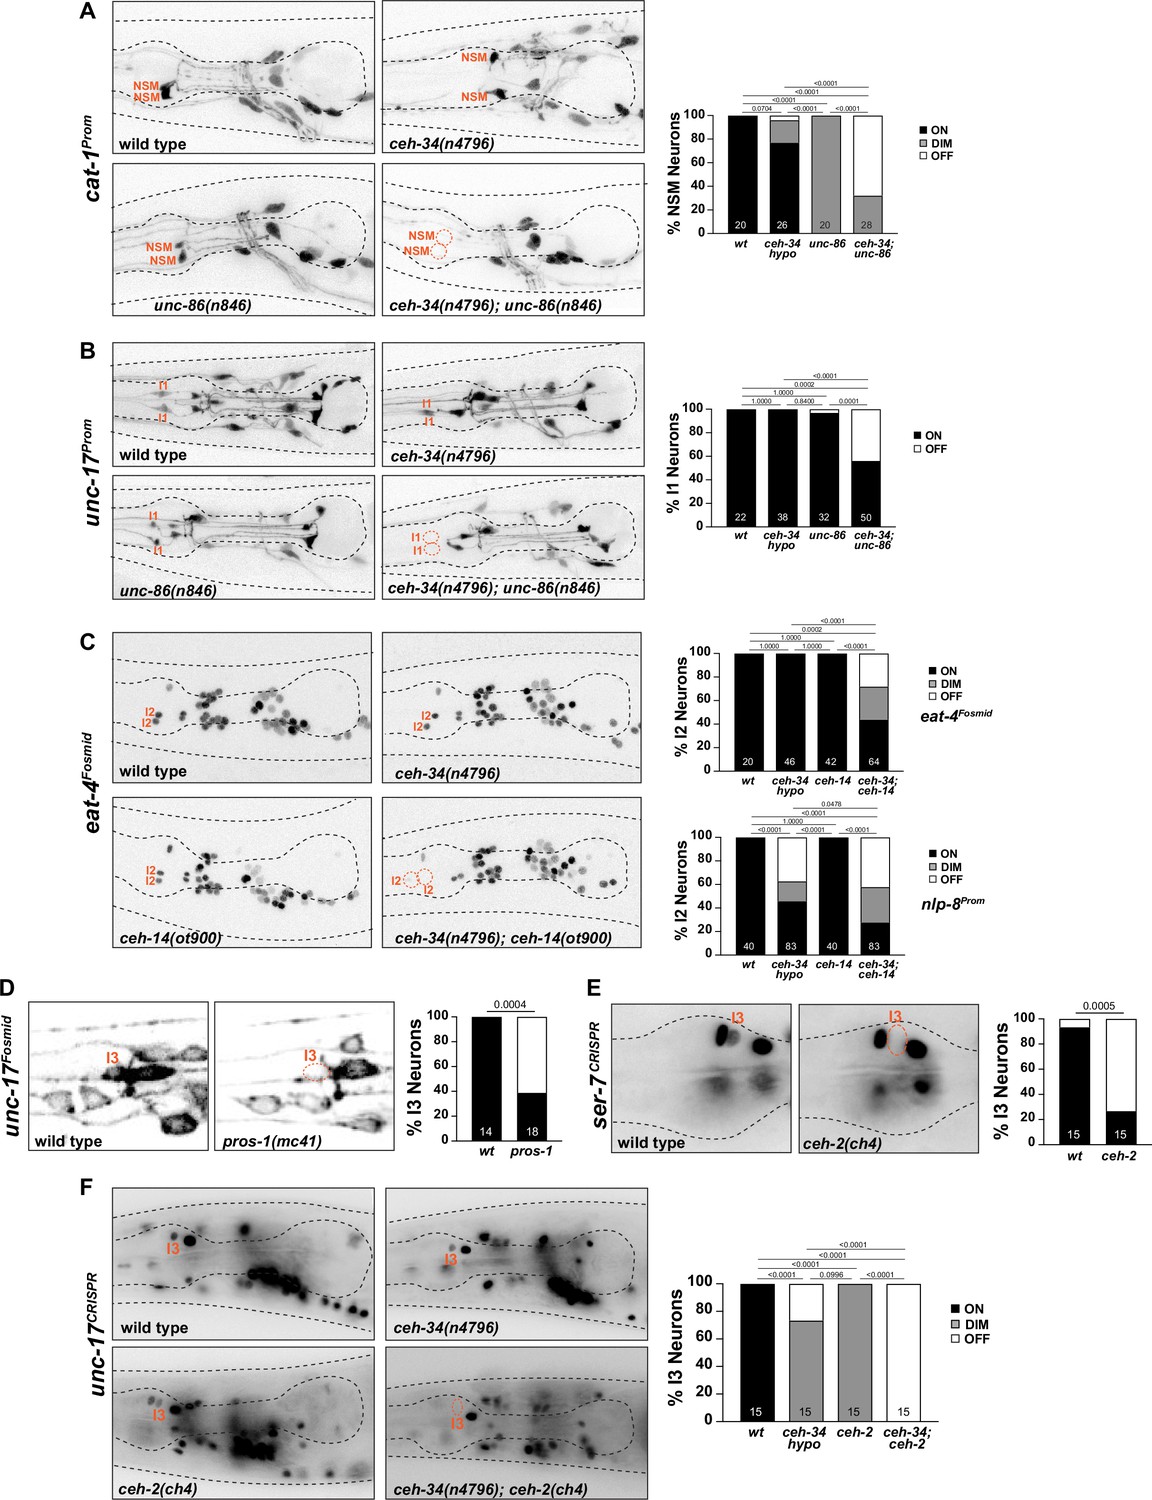
(A) unc-86 and ceh-34 synergistically affect NSM differentiation. Representative images and quantification are shown. Reporter gene used is cat-1 (otIs224). Animals were scored at the L4 stage. Statistical analysis was performed using Fisher’s exact test. p-values were adjusted with the Holm-Sidak correction for multiple comparisons. N is indicated within each bar and represents number of neurons scored. (B) unc-86 and ceh-34 show synergistic defects in I1 neuron differentiation. Representative images and quantification are shown. Reporter gene used is unc-17 (otIs661). Animals were scored at the L4 stage. Statistical analysis was performed using Fisher’s exact test. p-values were adjusted with the Holm-Sidak correction for multiple comparisons. N is indicated within each bar and represents number of neurons scored. (C) ceh-14 and ceh-34 show synergistic effects on I2 neuron differentiation. Representative images and quantification are shown for eat-4 (otIs518). Bottom graph shows quantification for nlp-8 (otIs711). Animals were scored at the L4 stage. Statistical analysis was performed using Fisher’s exact test or chi-square test. p-values were adjusted with the Holm-Sidak correction for multiple comparisons. N is indicated within each bar and represents number of neurons scored. (D) pros-1 affects I3 neuron differentiation. Representative images and quantification are shown. Reporter gene is unc-17 (otIs576). Animals were scored at the L1 stage. Statistical analysis was performed using Fisher’s exact test. N is indicated within each bar and represents number of neurons scored. (E) ceh-2 affects I3 neuron differentiation. Representative images and quantification are shown. Reporter gene used is a CRISPR/Cas9-enginereed allele for ser-7 (syb4502). Animals were scored at the L4 stage. Statistical analysis was performed using Fisher’s exact test. N is indicated within each bar and represents number of neurons scored. (F) ceh-2 and ceh-34 show synergistic defects in I3 neuron differentiation. Representative images and quantification are shown. Reporter gene used is CRISPR/Cas9-engineered allele for unc-17 (syb4491). Animals were scored at the L4 stage. Statistical analysis was performed using Fisher’s exact test. p-values were adjusted with the Holm-Sidak correction for multiple comparisons. N is indicated within each bar and represents number of neurons scored.
Figure 11 with 2 supplements

Other homeobox genes involved in specifying distinct pharyngeal neuron types.
(A) ceh-2 affects M3 neuron differentiation. Representative images and quantification are shown. Reporter gene is eat-4 (otIs388). Animals scored at the L4 stage. Statistical analysis was performed using chi-square test. N is indicated within each bar and represents number of neurons scored. (B) vab-15 affects M5 neuron differentiation. Representative images and quantification are shown. Reporter genes used are ceh-34 (stIs10447) and CRISPR/Cas9-engineered alleles for unc-17 (ot907) and trh-1 (syb4421). Animals were scored at the L4 stage. Statistical analysis was performed using Fisher’s exact test. N is indicated within each bar and represents number of neurons scored. (C) ceh-45 affects MI neuron differentiation. Representative images and quantification are shown. Reporter genes used are eat-4 (otIs388) and CRISPR/Cas9-engineered allele for trh-1 (syb4421). Animals were scored at the L4 stage. Statistical analysis was performed using Fisher’s exact test. N is indicated within each bar and represents number of neurons scored.
Figure 11—figure supplement 1
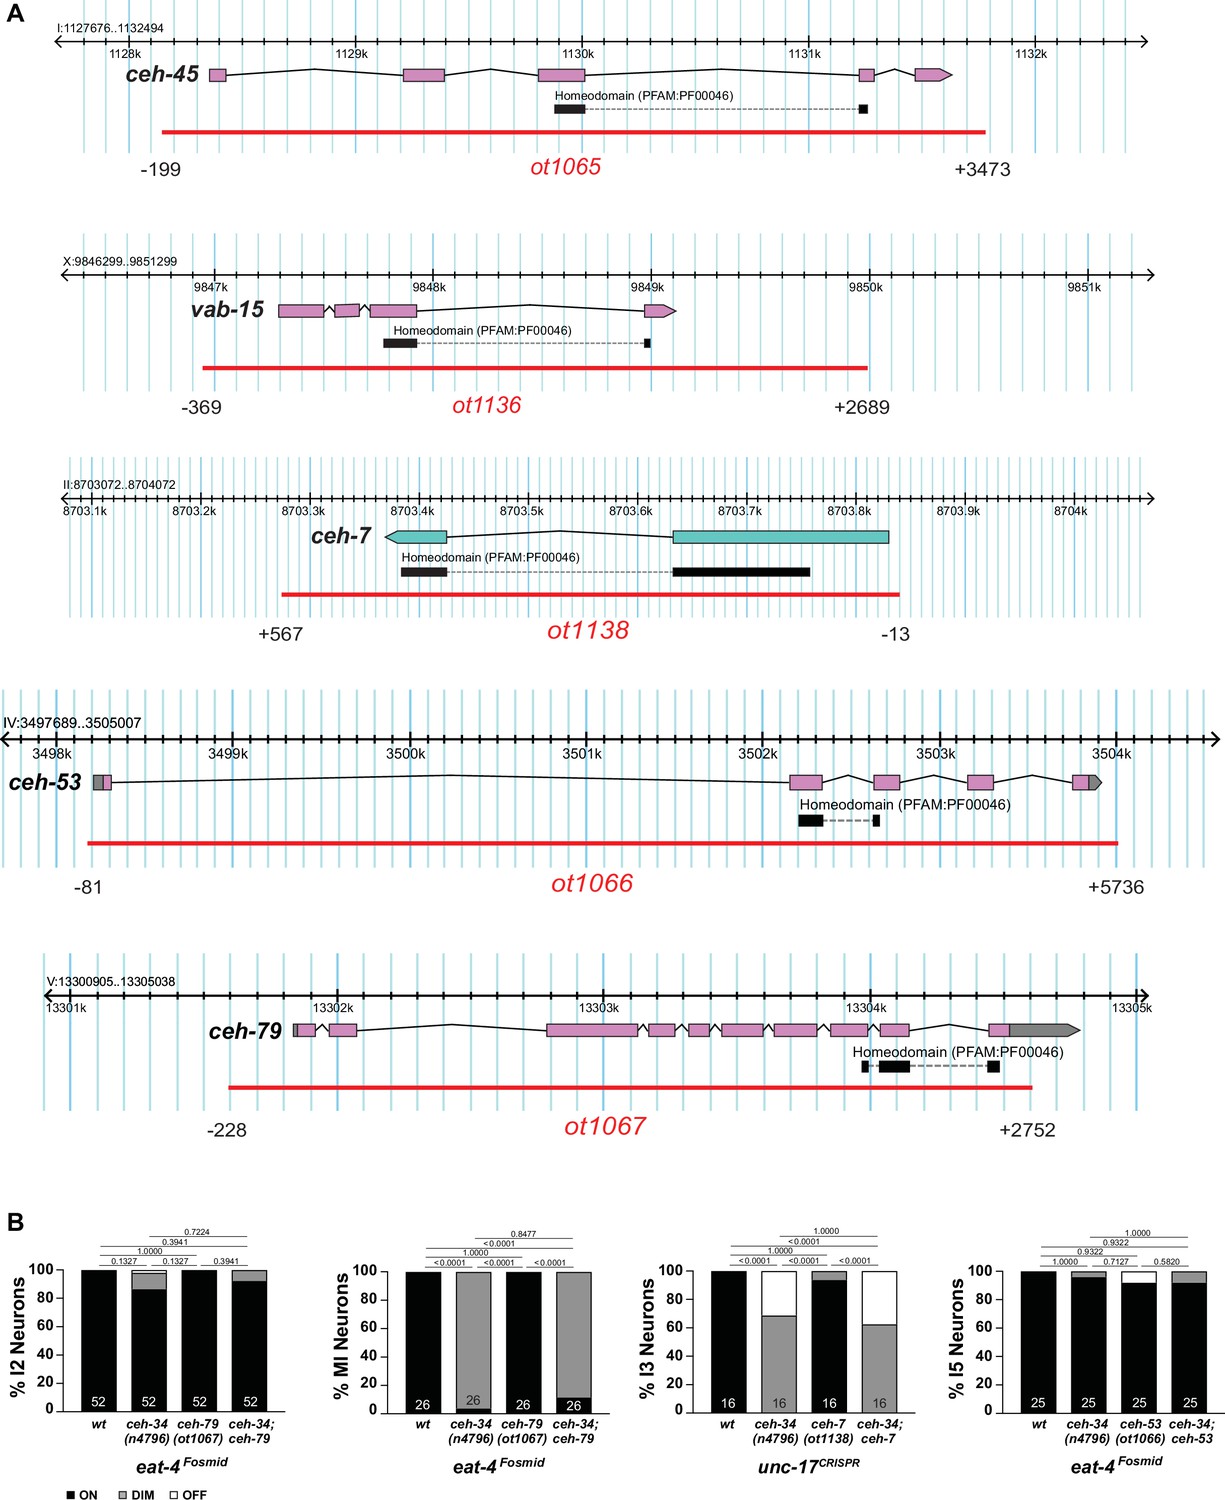
Homeobox mutant alleles.
(A) Homeobox mutant alleles generated in this study. Numbers indicating beginning and end of deletion are relative to the start codon of the gene of interest. See Materials and methods for detail. (B) ceh-79, ceh-7, and ceh-53 do not show defects in pharyngeal neuron differentiation or synergistic effects with ceh-34. Reporter used are otIs388 and otIs518 to monitor eat-4 expression and a CRISPR/Cas9-engineered gfp allele for unc-17 (syb4491). Animals were scored at the L4 stage. Statistical analysis was performed using Fisher’s exact test or chi-square test. p-values were adjusted with the Holm-Sidak correction for multiple comparisons. N is indicated within each bar and represents number of neurons scored.
Figure 11—figure supplement 2
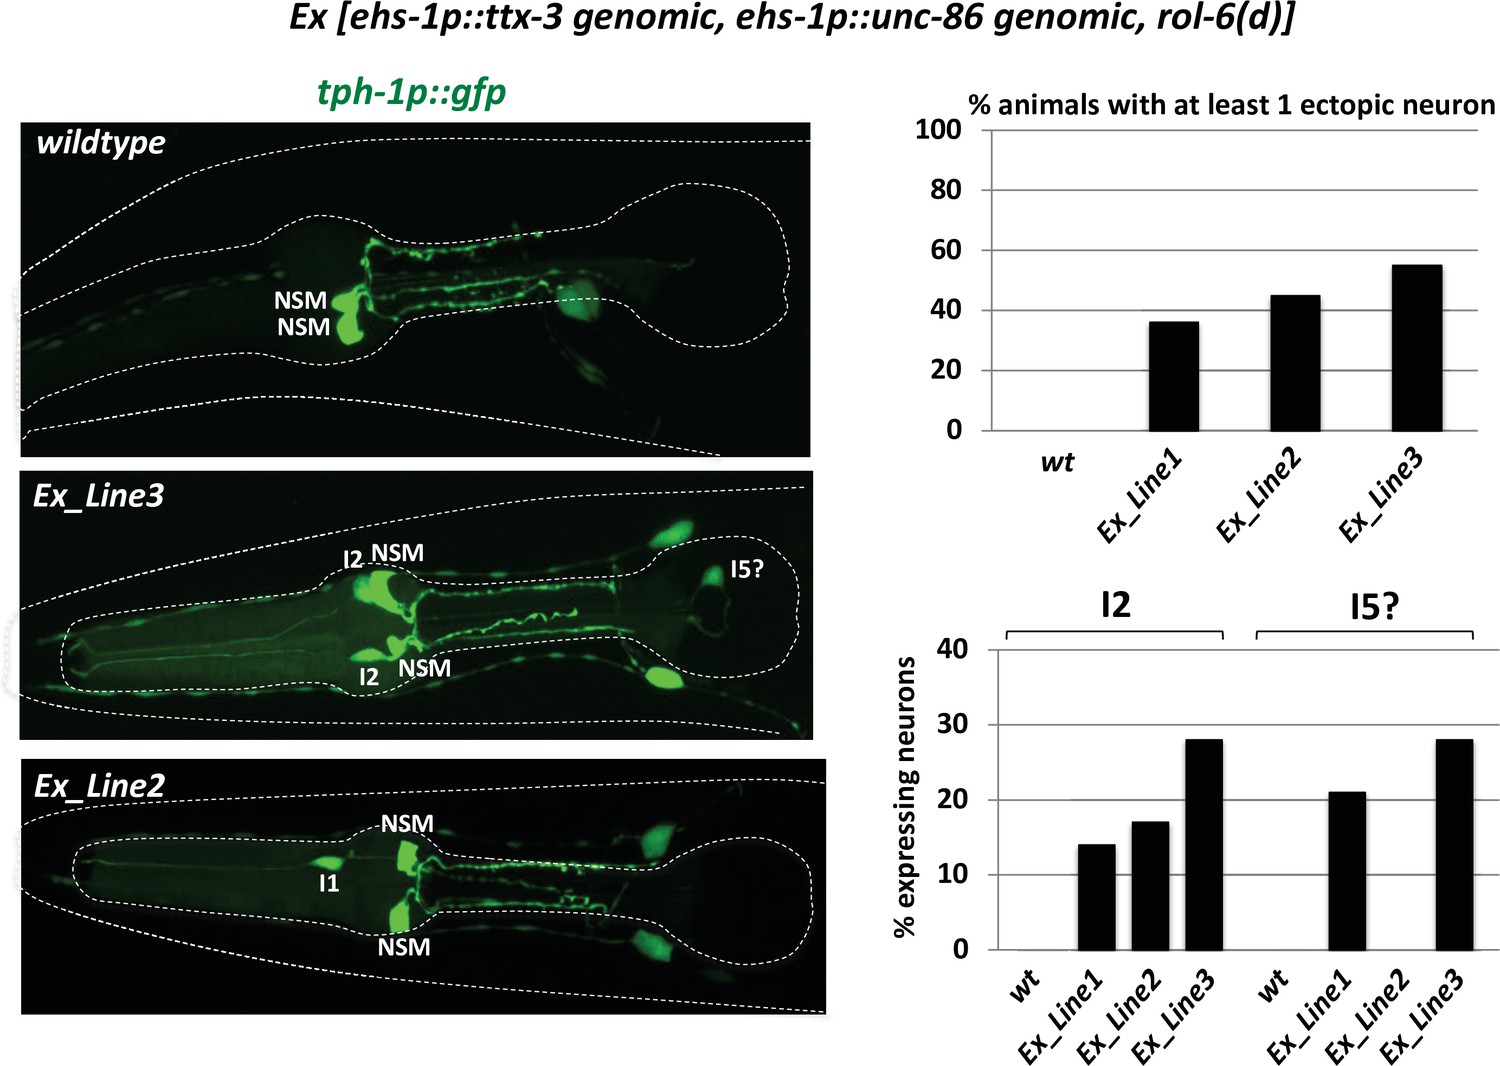
Homeobox misexpression experiments.
We misexpressed genomic copies of the unc-86 and ttx-3 locus, driven by the pan-pharyngeal neuron promoter ehs-1 in several independent transgenic lines to generate the normally NSM-specific CEH-34/UNC-86/TTX-3 combination in all pharyngeal neurons to then ask whether the NSM marker tph-1 becomes expressed in other pharyngeal neurons. Ectopic expression of tph-1 was indeed observed, albeit at limited penetrance and in only some select neuron classes.
Figure 12
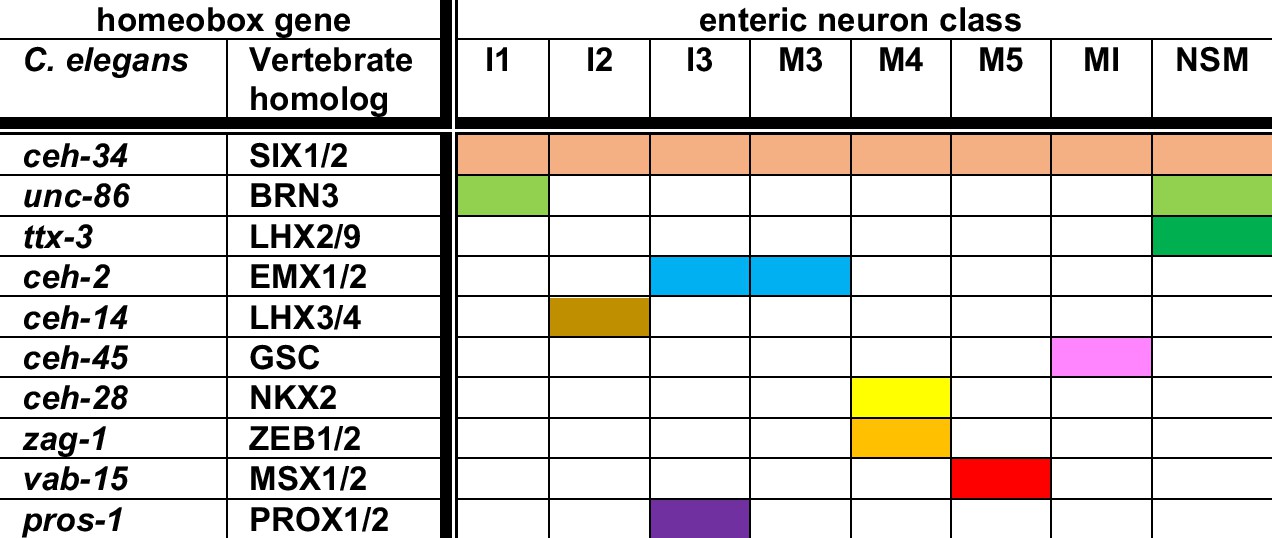
Summary of homeobox gene codes involved in pharyngeal neuron identity specification.
Shown here are homeobox genes for which an involvement in pharyngeal neuron differentiation has been shown, as well as the 8 (of a total of 14) pharyngeal neuron classes for which a homeobox regulator besides ceh-34 has been identified to date. Each neuron expresses additional homeobox genes (resulting in neuron type-specific combination of homeobox genes; Reilly et al., 2020), but the function of these additional genes remains to be characterized.
Additional files
-
Supplementary file 1
Strain list.
This file provides a list of all Caenorhabditis elegans strains used in this study.
- https://cdn.elifesciences.org/articles/76003/elife-76003-supp1-v2.docx
-
Transparent reporting form
- https://cdn.elifesciences.org/articles/76003/elife-76003-transrepform1-v2.docx
-
Source data 1
This file provides all the primary animal scoring data.
- https://cdn.elifesciences.org/articles/76003/elife-76003-data1-v2.xlsx
Download links
A two-part list of links to download the article, or parts of the article, in various formats.
Downloads (link to download the article as PDF)
Open citations (links to open the citations from this article in various online reference manager services)
Cite this article (links to download the citations from this article in formats compatible with various reference manager tools)
The enteric nervous system of the C. elegans pharynx is specified by the Sine oculis-like homeobox gene ceh-34
eLife 11:e76003.
https://doi.org/10.7554/eLife.76003


