Probing the segregation of evoked and spontaneous neurotransmission via photobleaching and recovery of a fluorescent glutamate sensor
- Vanderbilt Brain Institute, Vanderbilt University, United States
- Department of Pharmacology, Vanderbilt University, United States
Figures
Figure 1 with 2 supplements
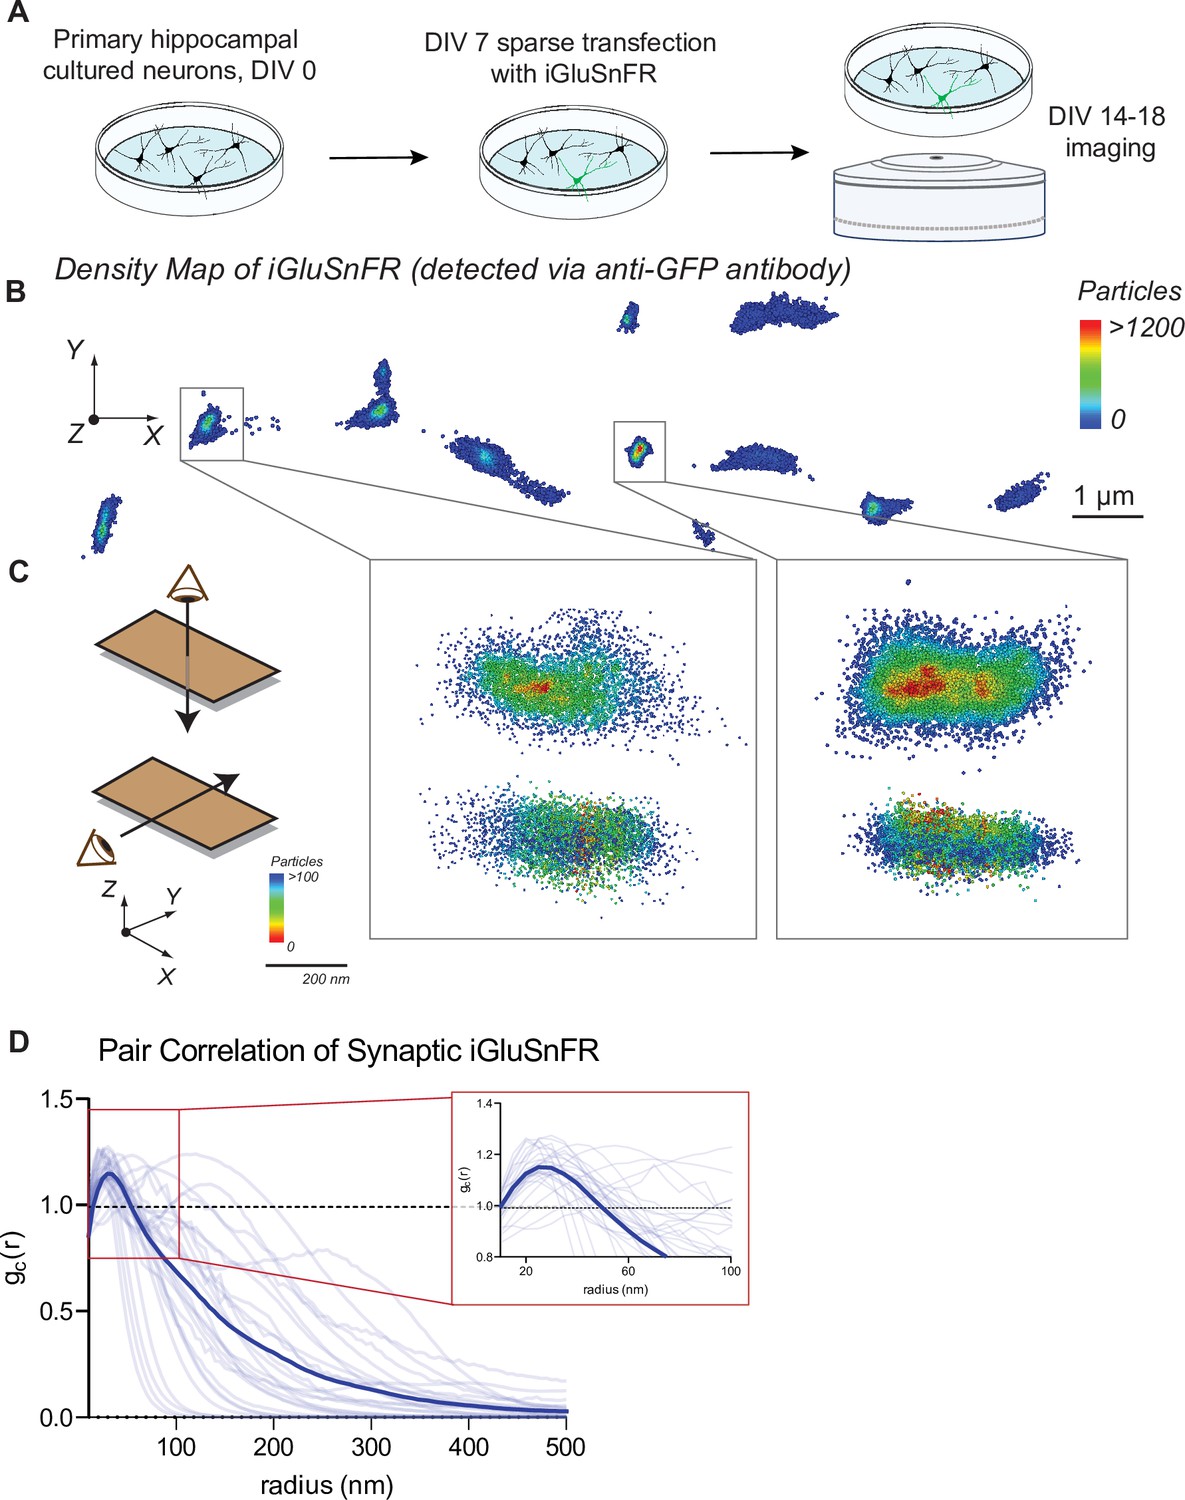
Distribution of iGluSnFR at the neuronal membrane.
(A) Experimental paradigm and timeline for sparse transfection and subsequent imaging of iGluSnFR. (B) Representative image showing the density distribution of a density analysis of iGluSnFR probes at the postsynaptic membrane of an iGluSnFR transfected neuron, where areas in the red gradient have a denser distribution of probes and blue colored regions represents less dense regions. (C) Representative image of two synaptic boutons that colocalize to PSD95, showing that there is increased density of iGluSnFR probes closer to the center of the cluster. (D) Pair correlation of iGluSnFR clusters that colocalize to PSD95, demonstrating increasing clustering near the center of the synapse (n = 30 synapses).
-
Figure 1—source data 1
Source data for Figure 1.
- https://cdn.elifesciences.org/articles/76008/elife-76008-fig1-data1-v2.xlsx
Figure 1—figure supplement 1
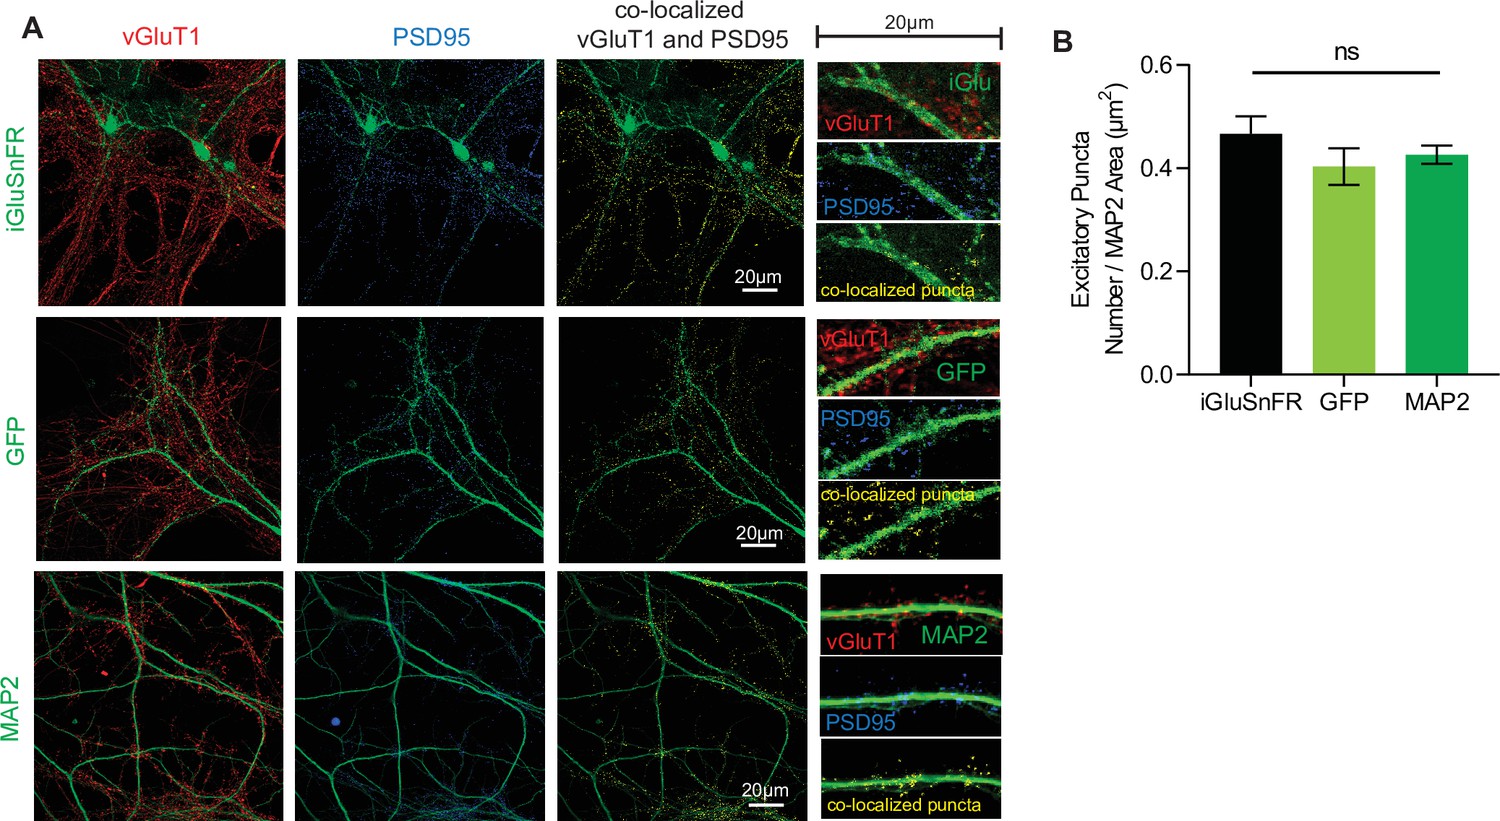
Synapse density is unchanged as a result of iGluSnFR transfection.
(A) Representative immunohistochemistry of vGlut1 and PSD95 and colocalized puncta in iGluSnFR transfected neurons, GFP transfected neurons, and neurons stained with MAP2 (B) Colocalized puncta across iGluSnFR transfected neurons, GFP transfected neurons, and neurons stained with MAP2 (n = 8 for all groups). Bar graphs are mean ± standard error of the mean (SEM).
-
Figure 1—figure supplement 1—source data 1
Source data for Figure 1—figure supplement 1.
- https://cdn.elifesciences.org/articles/76008/elife-76008-fig1-figsupp1-data1-v2.xlsx
Figure 1—figure supplement 2

iGluSnFR co-localizes with a synapse marker and demonstrates clustering.
(A) Stochastic optical reconstruction microscopy (STORM) imaging of iGluSnFR as tagged by GFP, along with synapses tagged with PSD95. (B) STORM imaging of iGluSNFR and PSD95 as demonstrated by clustering analysis completed on Vutara software.
Figure 2
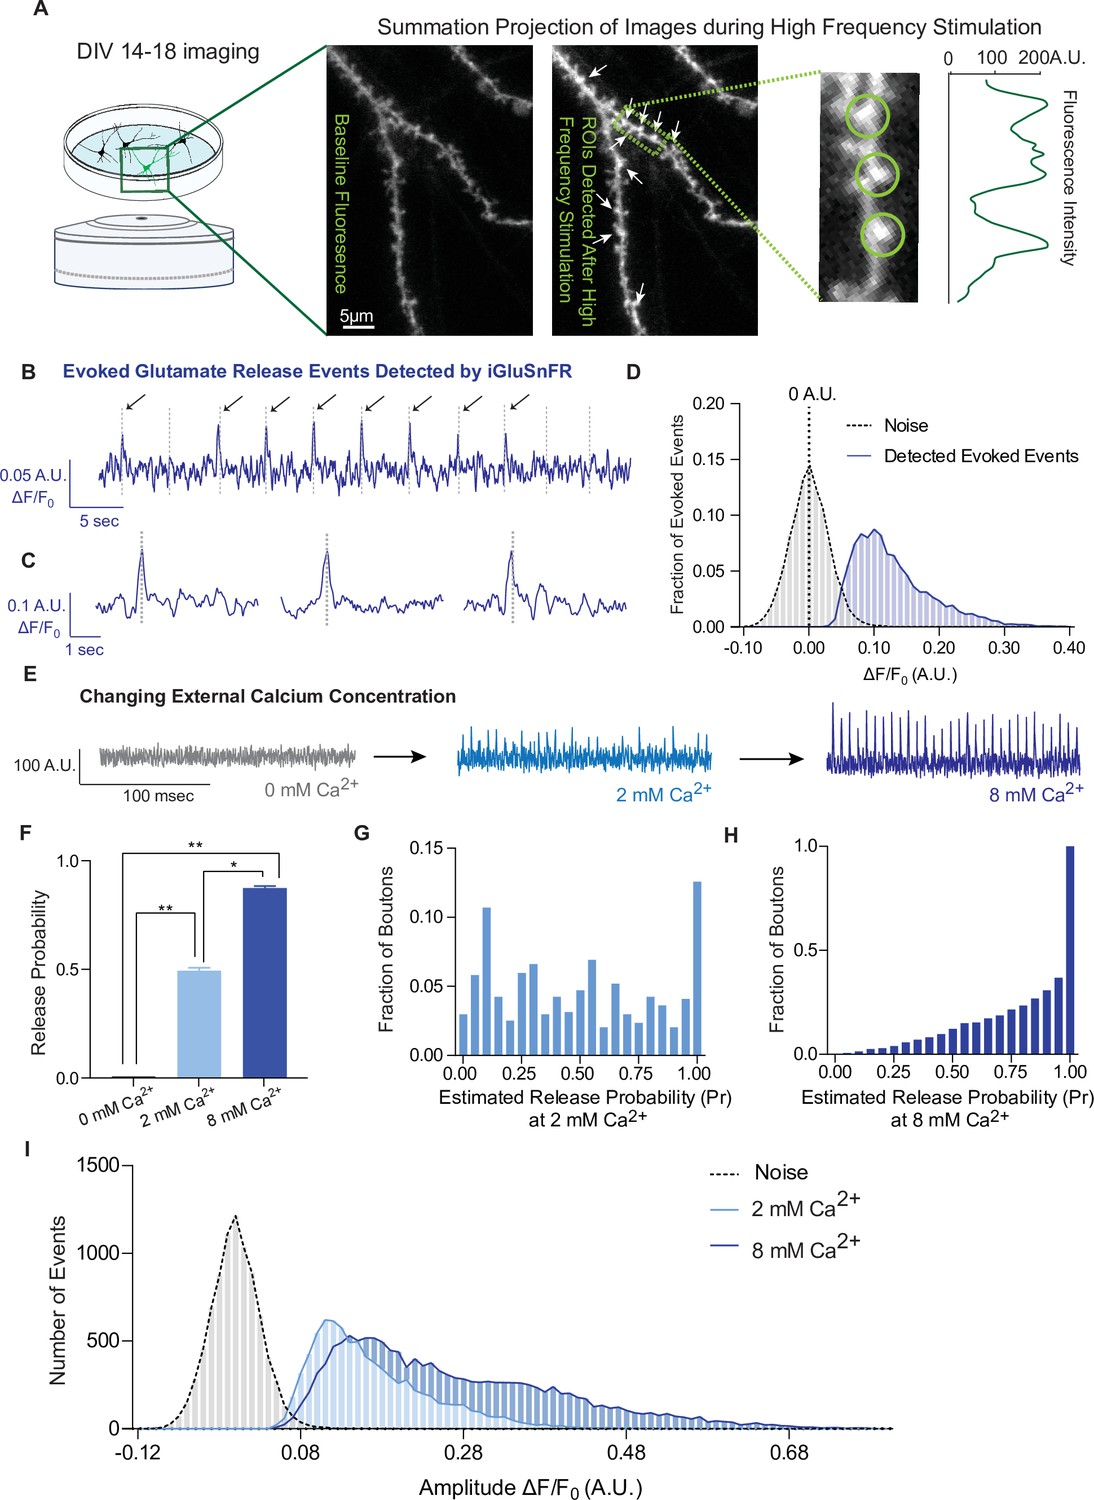
iGluSnFR detects excitatory evoked events with single synapse level resolution.
(A) Summation projection of acquired images during high-frequency stimulation to locate active synaptic boutons, as detected as local fluorescence maxima. (B) Representative evoked traces of iGluSnFR, demonstrating the presence of failures and successes in response to stimulation (time of stimulation is marked by dashed lines). (C) Individual evoked traces to represent the kinetics of detected glutamatergic events. (D) Amplitudes of detected evoked events are readily distinguishable from noise of traces from single synapse recordings (n = 10 coverslips). (E) Representative single synapse recordings in the presence of changing external Ca2+ concentrations, as both the number and size of events increase with increasing Ca2+. (F) Release probability increases with increasing Ca2+ (n = 9 coverslips). (G) Distribution of estimated release probability across single synapses in 2 mM Ca2+ (n = 9 coverslips with a total of 636 synapses). (H) Distribution of estimated release probability across single synapses in 8 mM Ca2+ (n = 9 coverslips with a total of 636 synapses). (I) Histogram of event sizes in the presence of increasing Ca2+, as well as the noise of the traces (n = 9 coverslips) Bar graphs are mean ± standard error of the mean (SEM). Significance levels were stated as follows: *p < 0.05, **p < 0.01. ns denotes nonsignificance.
-
Figure 2—source data 1
Source data for Figure 1.
- https://cdn.elifesciences.org/articles/76008/elife-76008-fig2-data1-v2.xlsx
Figure 3
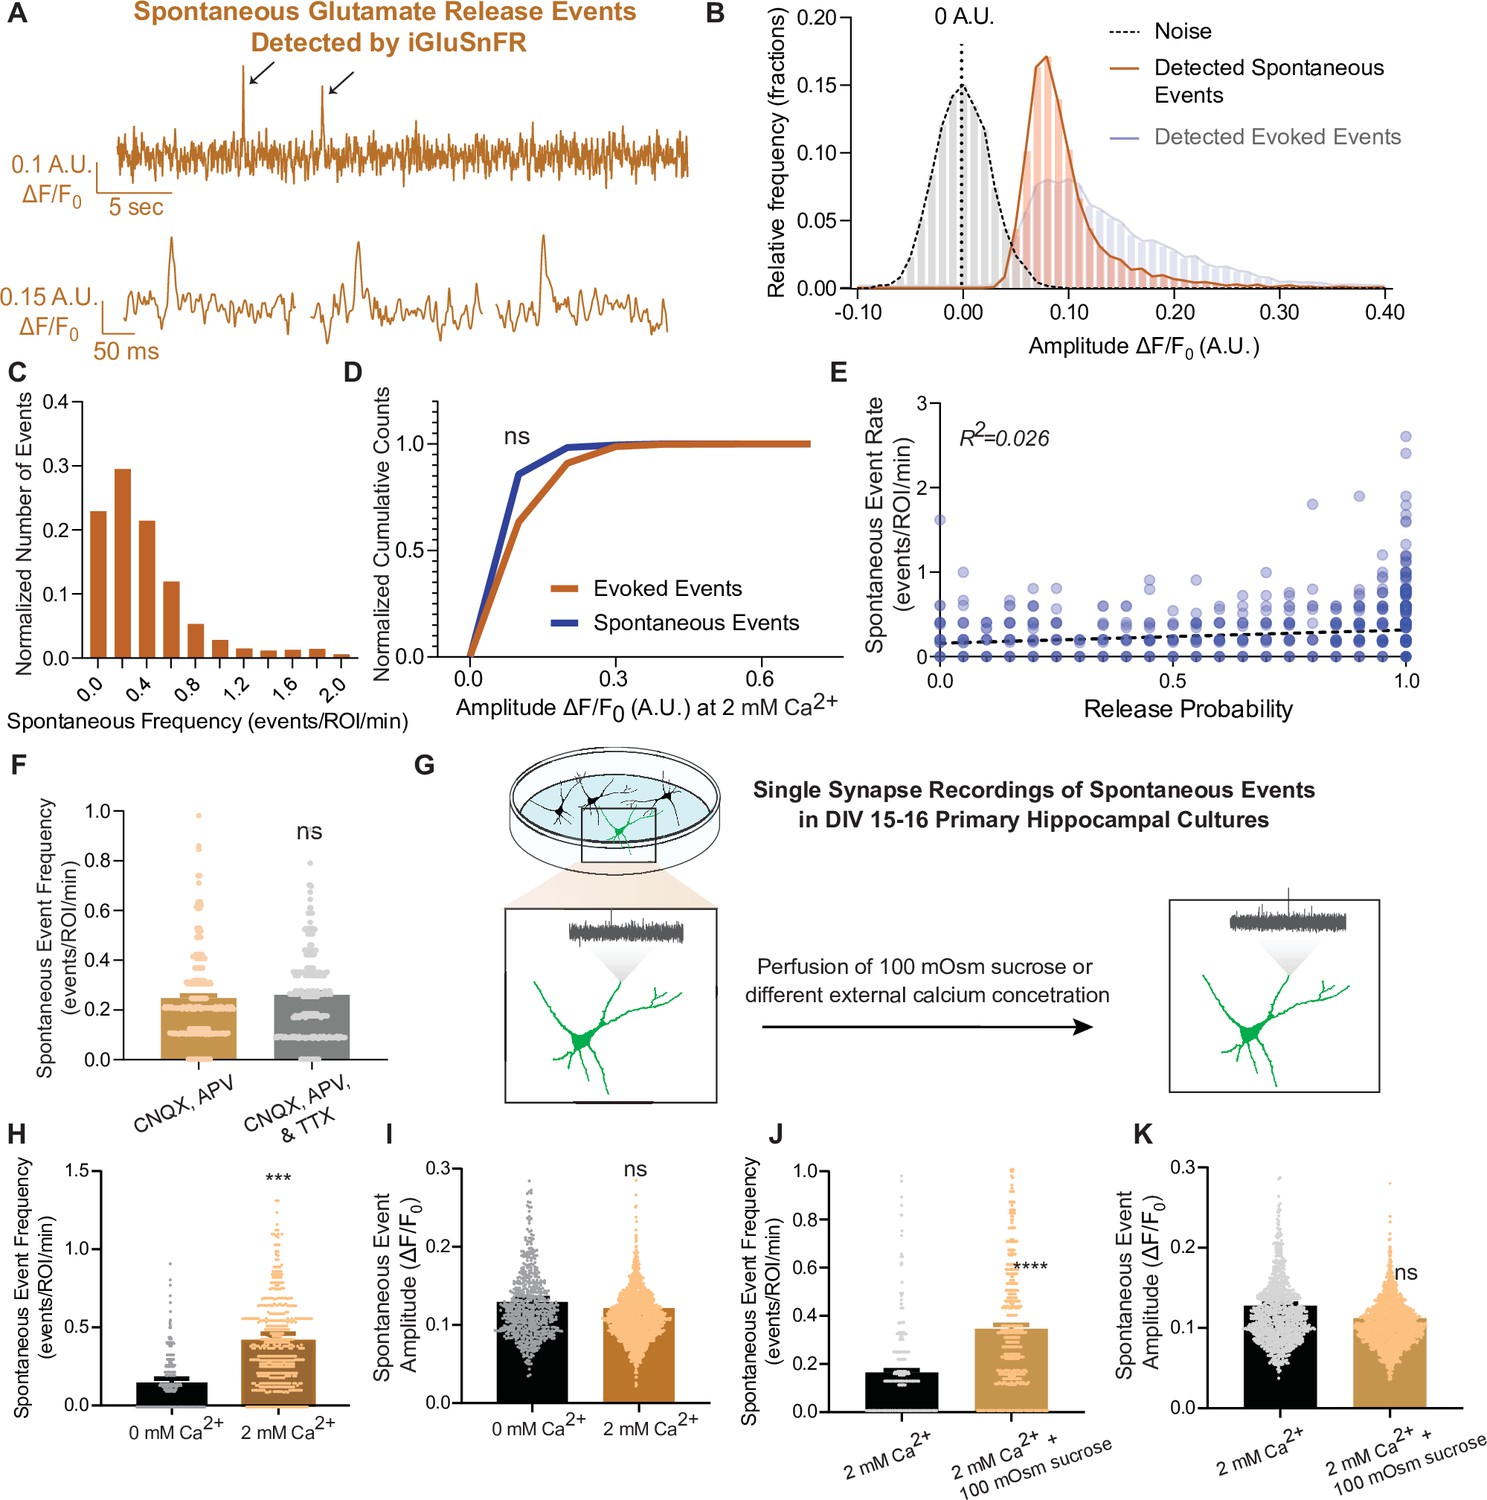
iGluSnFR can resolve spontaneous events at single synapses.
(A) Representative spontaneous trace, and representative individual spontaneous events. (B) Amplitudes of detected spontaneous events are readily distinguishable from the noise of the trace (n = 10 coverslips). (C) Distribution of spontaneous rate at single synapses across multiple recordings. (D) Cumulative histogram of spontaneous and evoked event size compared to each other (n = 19 coverslips per group, KS of coverslip averages: p = 0.9). (E) Within synapses, the spontaneous event rate and estimated release probability demonstrate no linear correlation. (F) Comparison of spontaneous frequency between cultures in CNQX and APV, to the spontaneous frequency of those same cultures after perfusion of CNQX, APV, and TTX (n = 4 coverslips, Welch’s t-test of coverslip averages: p = 0.4). (G) Experimental paradigm of validating spontaneous events with high sucrose and changing Ca2+ concentrations. (H) The spontaneous rate can be decreased with a lower Ca2+ concentration, compared to physiological concentrations at the same synapse over time. Individual points represent measurements from individual synapses (n = 6 coverslips, p = 0.009). (I) The spontaneous event size at changing Ca2+ concentrations remain the same (n = 6 coverslips, p = 0.17). (J) Spontaneous event frequency after perfusing Tyrode’s with 100 mOsm sucrose is increased (n = 8, p = 0.005). (K) Spontaneous amplitude after perfusing Tyrode’s with 100 mOsm is not significantly different (n = 8, p = 0.18). Bar graphs are mean ± standard error of the mean (SEM). Significance levels were stated as follows: ***p < 0.001, and ****p < 0.0001. ns denotes nonsignificance.
-
Figure 3—source data 1
Source data for Figure 1.
- https://cdn.elifesciences.org/articles/76008/elife-76008-fig3-data1-v2.xlsx
Figure 4
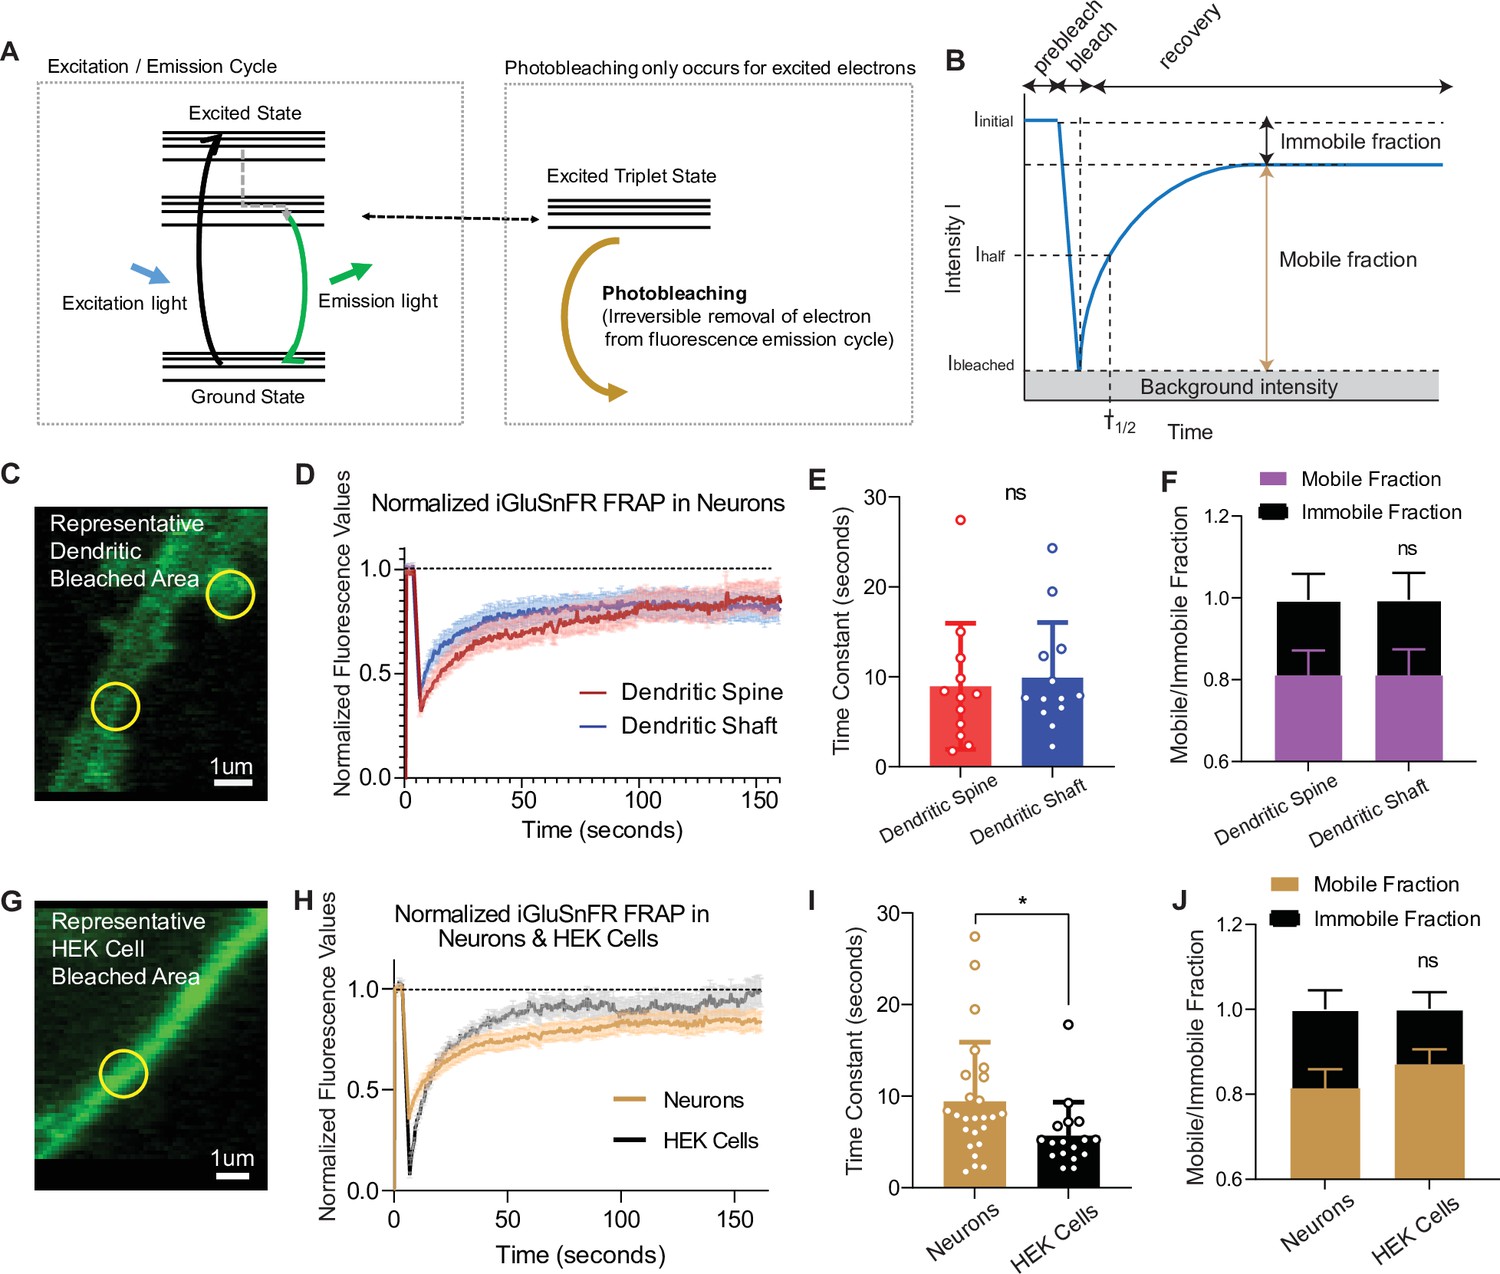
Fluorescence recovery after photobleaching (FRAP) experiments reveal iGluSnFR to be a highly mobile probe, and that there is an immobile fraction of this probe at neuronal synapses.
(A) Photobleaching mechanism diagram. (B) Diagram illustrating analysis of the prebleaching and recovery curve of FRAP experiments, including how measurements of immobile/mobile fractions as well as the time constants are taken. (C) Representative bleached areas of neuron dendritic areas, both spinous and nonspinous regions. (D) Recovery curve of measured regions after photobleaching of iGluSnFR in neurons via FRAP, both spinous and nonspinous (shaft) regions. (E) Time constants of FRAP recovery in neurons transfected with iGluSnFR (mean ± standard deviation [SD], spinous regions n = 12: 8.9 ± 7.0, nonspinous regions n = 13: 9.9 ± 6.1; Welch’s t-test p = 0.7). (F) Immobile fractions of bleached regions in neurons (mean ± SD, spinous regions n = 12: 0.19 ± 0.23, nonspinous regions n = 13: 0.19 ± 0.25; Welch’s t-test p = 0.9). (G) Representative bleached region of HEK cells. (H) Recovery curve of bleached iGluSnFR in neurons compared to HEK cells. (I) Time constants of FRAP recovery in neurons and HEK cells transfected with iGluSnFR (mean ± SD; neuronal regions n = 25: 9.4 ± 6.4 s, HEK cell regions n = 17: 5.7 ± 3.6 s; Welch’s t-test p = 0.02). (J) Immobile fractions between neurons and HEK cells (mean ± SD; neuronal regions n = 17: 0.19 ± 0.23, HEK cell regions regions n = 25: 0.13 ± 0.15; Welch’s t-test p = 0.36). Significance levels were stated as follows: *p < 0.05. ns denotes nonsignificance.
-
Figure 4—source data 1
Source data for Figure 4.
- https://cdn.elifesciences.org/articles/76008/elife-76008-fig4-data1-v2.xlsx
Figure 5 with 1 supplement
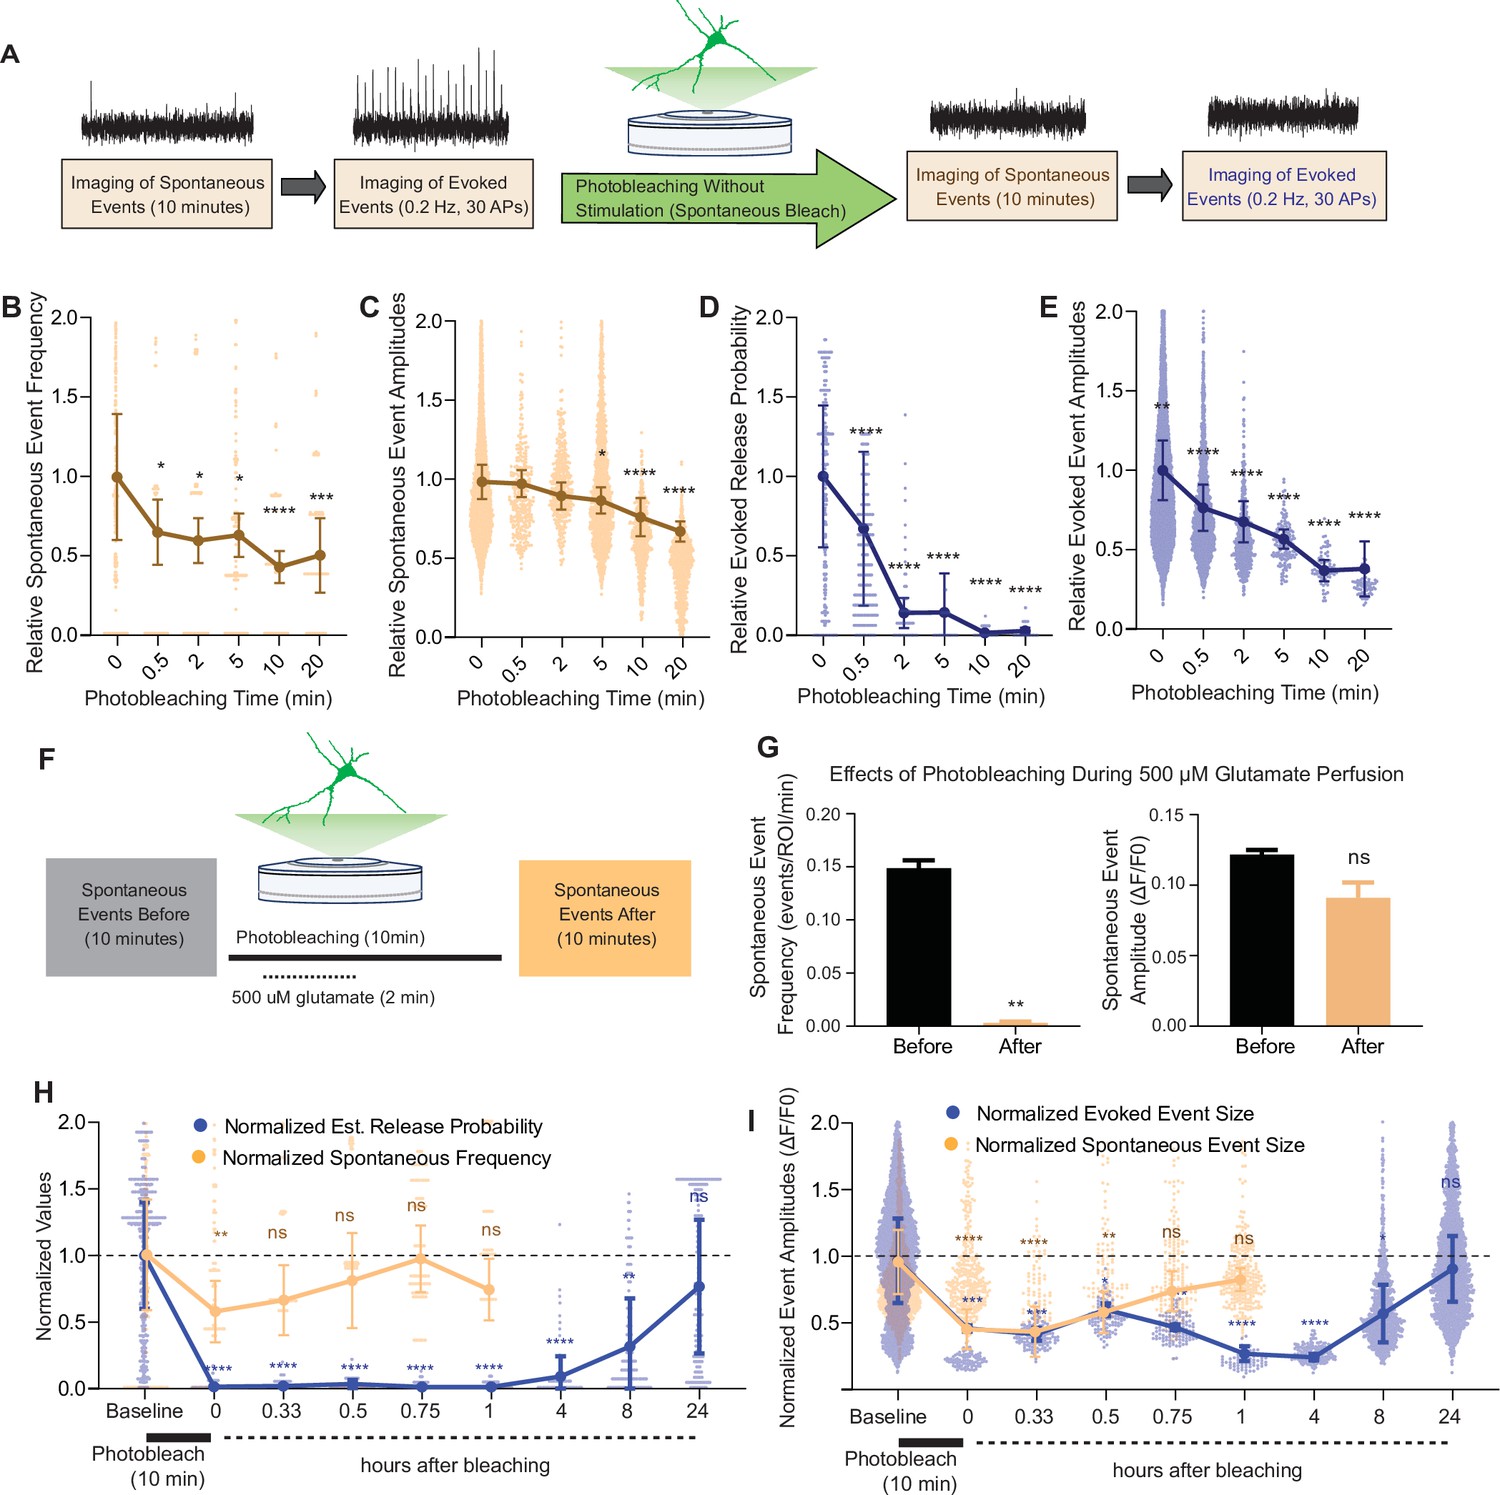
Spontaneous and evoked events are differentially bleached over time.
(A) Experimental paradigm of photobleaching experiments. Spontaneous and evoked events were measured, followed by photobleaching, and then once again spontaneous and evoked events were measured. (B) Relative spontaneous event frequency after photobleaching of 0.5–20 min without stimulation. For Figure 4B–I, individual points represent measurements from individual synapses and statistics were done on averages of synapses in each coverslip. At least four coverslips were included for every group. (C) Relative spontaneous event sizes after photobleaching of 0.5–20 min without stimulation. (D) Relative release probability after photobleaching of 0.5–20 min without stimulation. (E) Relative event size amplitude after photobleaching of 0.5–20 min without stimulation. (F) Experimental paradigm of photobleaching while perfusing glutamate. (G) Spontaneous event frequency and event size while perfusing glutamate during photobleaching. (H) Recovery of release probability and spontaneous frequency, both normalized to values prior to photobleaching at the same synapse to account for differences in release across synapses. Spontaneous release recovers within minutes, while evoked release recovers within hours. (I) Recovery of evoked and spontaneous event sizes correlate with their release rates, with spontaneous frequency recovering within minutes and evoked release recovering within hours Bar graphs are mean ± standard error of the mean (SEM). Significance levels were stated as follows: **p < 0.05, **p < 0.01, ***p < 0.001, and ****p < 0.0001. ns denotes nonsignificance.
-
Figure 5—source data 1
Source data for Figure 5.
- https://cdn.elifesciences.org/articles/76008/elife-76008-fig5-data1-v2.xlsx
Figure 5—figure supplement 1
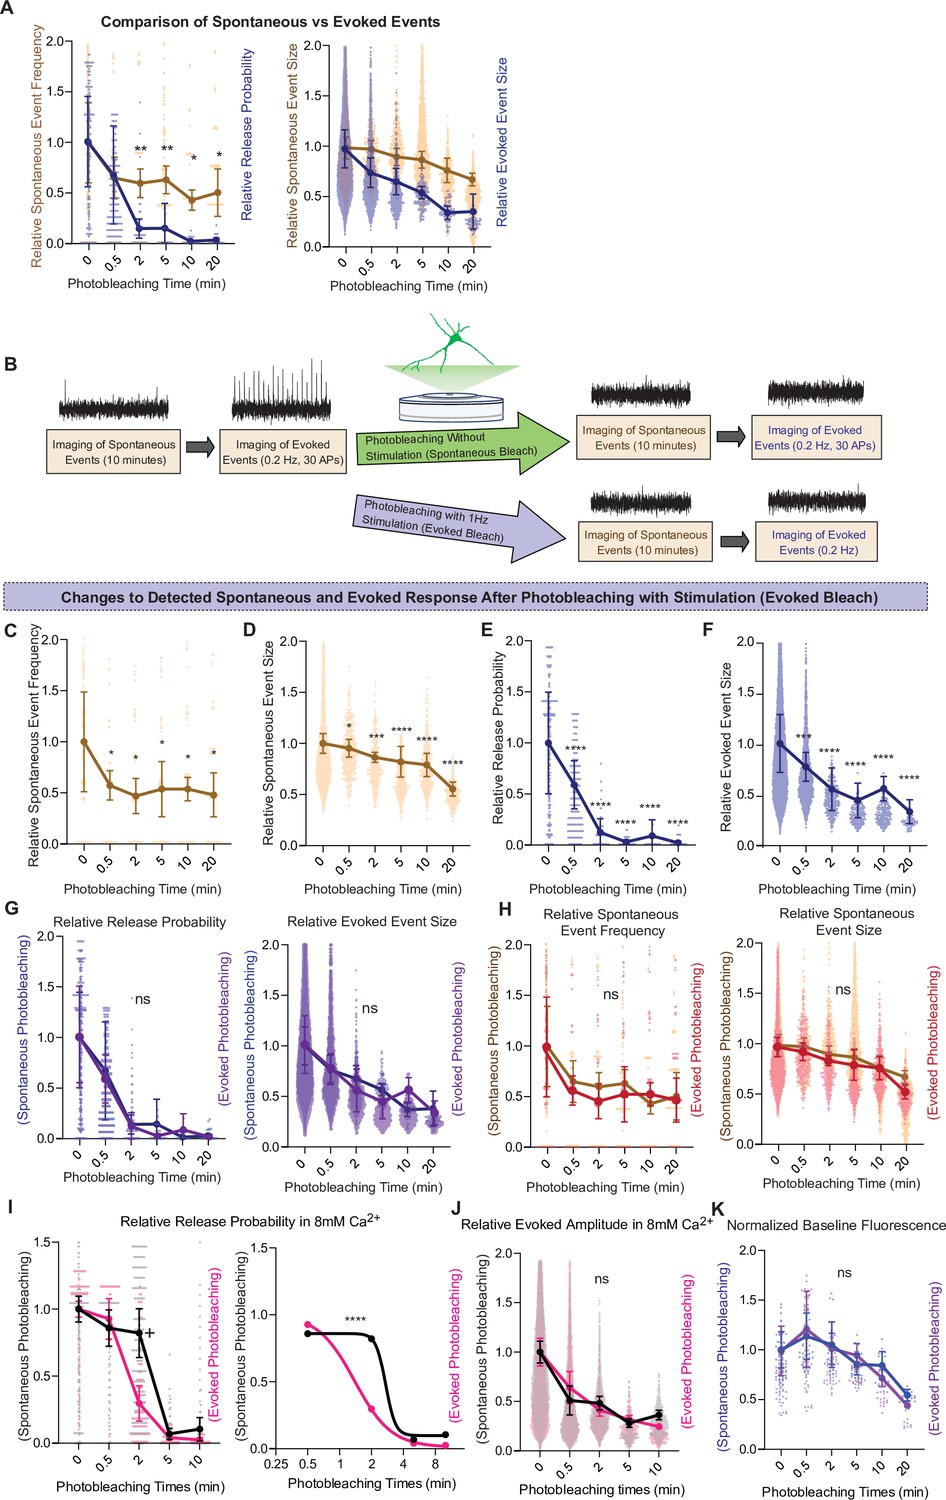
Comparison of spontaneous and evoked photobleaching on detected glutamate release.
(A) Comparison of relative spontaneous event rate and estimate release probability after different intervals of photobleaching periods. (B) Experimental paradigm of photobleaching experiments. Spontaneous and evoked events were measured, followed by photobleaching with or without stimulation, and then once again spontaneous and evoked events were measured. (C) Relative spontaneous event frequency after photobleaching of 0.5–20 min with stimulation. (D) Relative spontaneous event sizes after photobleaching of 0.5–20 min with stimulation. (E) Relative release probability after photobleaching of 0.5–20 min with stimulation. (F) Relative event size amplitude after photobleaching of 0.5–20 min with stimulation. (G) Relative release probability and evoked event sizes compared between spontaneous and evoked photobleaching conditions. (H) Relative spontaneous event frequency and event size between spontaneous and evoked photobleaching conditions. (I) Relative release probability, analyzed via two-way analysis of variance (ANOVA; left) and an F-test after curve fitting in GraphPad Prism (right). (J) Evoked event amplitudes compared between spontaneous and evoked photobleaching conditions in high calcium conditions. (K) Relative baseline fluorescence compared between spontaneous and evoked photobleaching All groups have an n of at least four coverslips. Graphs are mean ± standard error of the mean (SEM). Significance levels were stated as follows: +p = 0.07, *p < 0.05, ***p < 0.001, and ****p < 0.0001. ns denotes nonsignificance.
-
Figure 5—figure supplement 1—source data 1
Source data for Figure 5—figure supplement 1.
- https://cdn.elifesciences.org/articles/76008/elife-76008-fig5-figsupp1-data1-v2.xlsx
Figure 6
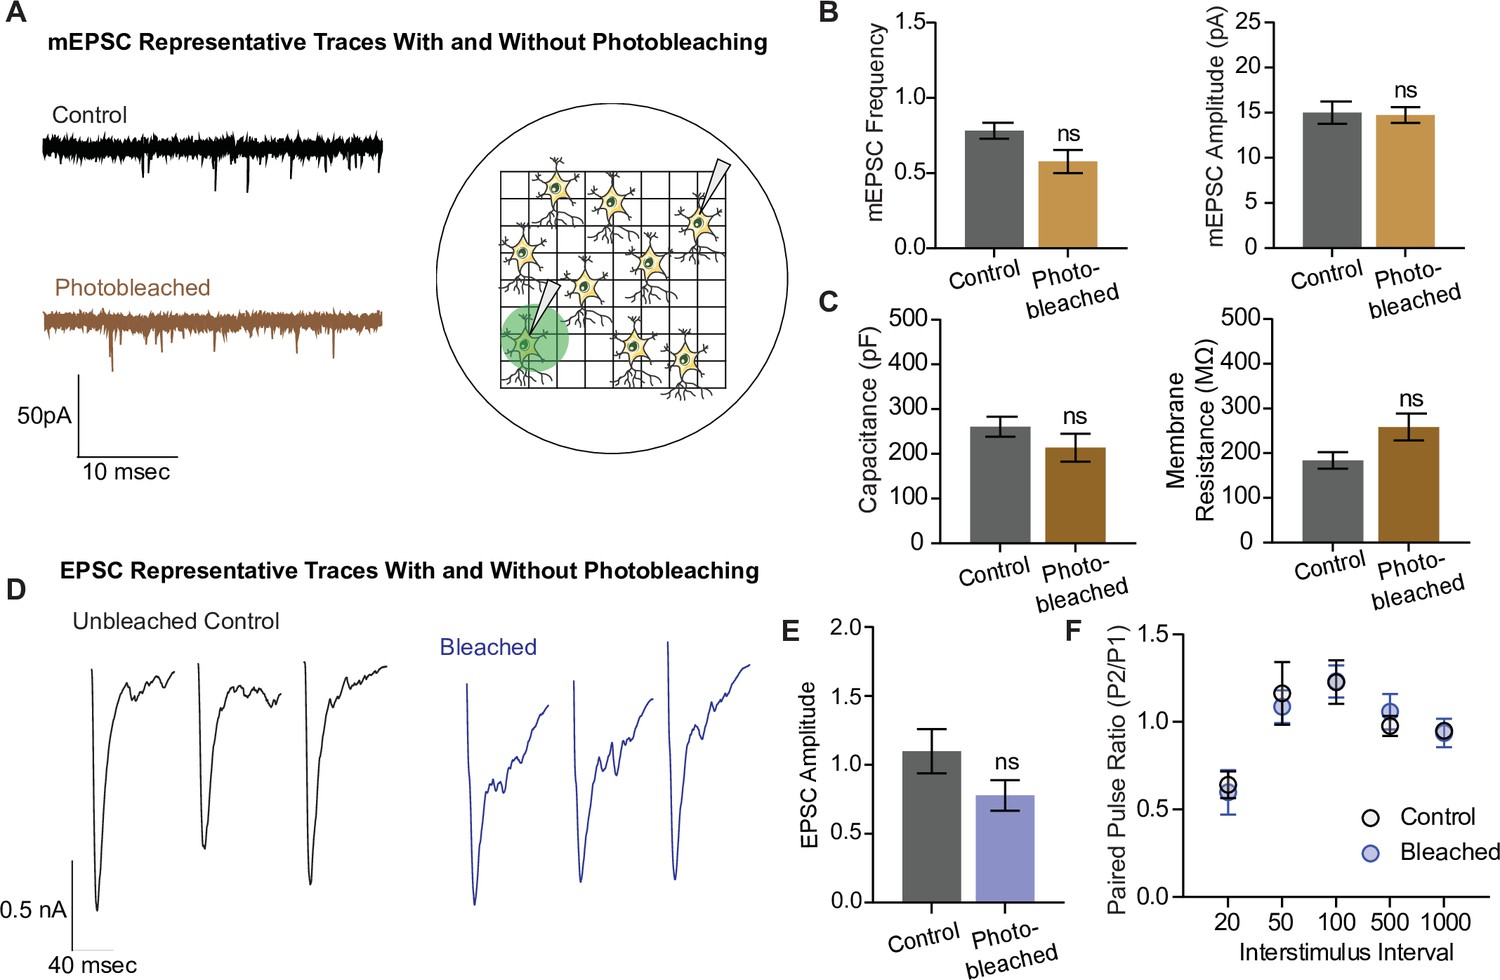
Electrophysiological and structural properties of neurons remain intact after photobleaching.
(A) Representative miniature excitatory postsynaptic current (mEPSC) traces with and without photobleaching, and the experimental paradigm of recording electrophysiological measurements in photobleached versus nonphotobleached neurons. (B) mEPSC frequency and amplitude between unbleached and bleached neurons are not significantly different (control n = 8, photobleached n = 12; p = 0.066). (C) Capacitance and membrane resistance, markers of cell health, are not significantly different between unbleached and bleached neurons (capacitance n = 11 for both groups, membrane resistance control n = 10, photobleached n = 11). (D) Representative EPSC traces with and without photobleaching. (E) EPSC amplitudes with and without photobleaching (n = 9 for both groups). (F) Paired pulse ratios across different interstimulus intervals between neurons that have and have not been photobleached (control n = 8, bleached n = 9). Bar graphs are mean ± standard error of the mean (SEM). ns denotes nonsignificance.
-
Figure 6—source data 1
Source data for Figure 6.
- https://cdn.elifesciences.org/articles/76008/elife-76008-fig6-data1-v2.xlsx
Figure 7
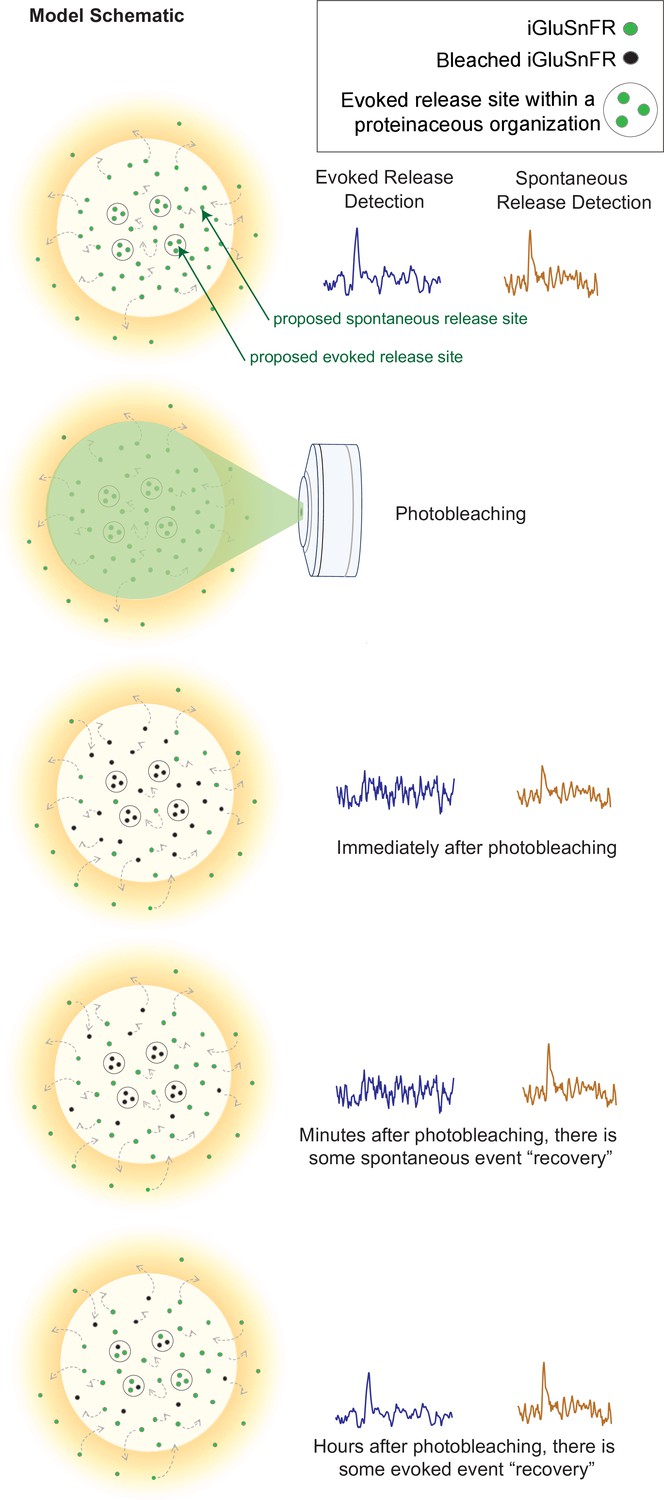
Model schematic demonstrating the clustered and diffusion restricted organization of evoked events, compared to the more diffusely located and freely moving structure of spontaneous event sites.
Evoked events are more readily photobleached, likely due to its clustered location and less diffusible surface. Spontaneous events are still detectable after photobleaching, likely due to the more freely diffusible nature of its structure and their dispersed location. Recovery for spontaneous release occurs on the order of minutes, likely due to synaptic and extrasynaptic diffusion of unbleached probes into the bleached regions. Recovery for evoked release occurs on the order of hours.
Tables
Key resources table
| Reagent type (species) or resource | Designation | Source or reference | Identifiers | Additional information |
|---|---|---|---|---|
| Antibody | Anti-GFP (rabbit polyclonal) | Synaptic Systems | Catalog 132 002 | ICC (1:300) |
| Antibody | Anti-PSD95 (mouse monoclonal) | Synaptic Systems | Catalog 124 011 | ICC/IHC (1:100) |
| Antibody | MAP2 (guinea pig polyclonal) | Synaptic Systems | Catalog 188 004 | IHC (1:500) |
| Antibody | vGluT1 (rabbit polyclonal) | Synaptic Systems | Catalog 135 302 | IHC (1:500) |
| Antibody | AlexaFluor 647 donkey anti-rabbit IgG (H + L) (polyclonal, secondary antibody) | Invitrogen | REF A31573 | IHC/ICC (1:500) |
| Antibody | AlexaFluor 568 goat anti-mouse IgG (H + L) (polyclonal, secondary antibody) | Invitrogen | REF A11004 | IHC/ICC (1:500) |
| Antibody | AlexaFluor 488 goat anti-guinea pig IgG (H + L) (polyclonal, secondary antibody) | Invitrogen | REF A11073 | IHC/ICC (1:500) |
| Chemical compound, drug | 6-Cyano-7-nitroquinoxaline-2,3-dione disodium salt hydrate (CNQX) | Sigma-Aldrich | Catalog # C239 | (10 μM) |
| Chemical compound, drug | D(−)-2-Amino-5-phosphonopentanoic acid (AP-5) | Sigma-Aldrich | Catalog # A8054 | (50 μM) |
| Chemical compound, drug | Tetrodotoxin (TTX) | Enzo Life Sciences | Catalog # BML-NA120-0001 | (1 μM) |
| Chemical compound, drug | DNase I | Sigma-Aldrich | Catalog # D5025 | (0.5 mg/ml) |
| Chemical compound, drug | Transferrin | Calbiochem | Catalog # 616,420 | (50 mg/500 ml) |
| Chemical compound, drug | Cytosine Arabinoside (Ara-C) | Sigma | Catalog # C6645 | |
| Chemical compound, drug | B-27 supplement | GIBCO | Catalog # 17504-010 | |
| Commercial assay, kit | ProFection Mammalian Transfection System | Promega | E1200 | |
| Chemical compound, drug | Matrigel | Corning | Catalog # 354,230 | (1:50) |
| Cell line (human kidney) | Human embryonic kidney-293 (HEK293) cells | ATCC | Catalog # CRL-1573; RRID: CVCL_0045 | |
| Strain, strain background | Sprague-Dawley rats, CD1 (Sprague-Dawley postnatal pups P2-3, M and F) | Charles River | Strain code: 400 | |
| Recombinant DNA reagent | Plasmid: pCI syn iGluSnFR | Helassa et al., 2018 PNAS | Addgene_106,123 | Plasmid to transfect and express iGluSnFR |
| Software, Algorithm | Prism 8 | GraphPad | https://www.graphpad.com/ | |
| Software, Algorithm | Intellicount | Fantuzzo et al., 2017 | N/A | |
| Software, Algorithm | Fiji | Schindelin et al., 2012 | N/A | |
| Software, Algorithm | MATLAB. (2018). 9.7.0.1190202 (R2019b). | Natick, Massachusetts: The MathWorks Inc. | https://www.mathworks.com/products/matlab.html?s_tid=hp_products_matlab | |
| Software, Algorithm | easFRAP-web | Koulouras et al., 2018 | https://easyfrap.vmnet.upatras.gr/?AspxAutoDetectCookieSupport=1 | |
| Software, Algorithm | MiniAnalysis | Synaptosoft | http://www.synaptosoft.com/MiniAnalysis | |
| Software, Algorithm | Clampfit | Molecular Devices | https://www.moleculardevices.com/ | |
| Software, Algorithm | Axopatch | Molecular Devices | https://www.moleculardevices.com/ | |
| Software, Algorithm | Vutara | Bruker: SRX Software | https://www.bruker.com/en/products-and-solutions/fluorescence-microscopy/super-resolution-microscopes/vutara-vxl.html |
Additional files
Download links
A two-part list of links to download the article, or parts of the article, in various formats.
Downloads (link to download the article as PDF)
Open citations (links to open the citations from this article in various online reference manager services)
Cite this article (links to download the citations from this article in formats compatible with various reference manager tools)
Probing the segregation of evoked and spontaneous neurotransmission via photobleaching and recovery of a fluorescent glutamate sensor
eLife 11:e76008.
https://doi.org/10.7554/eLife.76008


