Dithiothreitol causes toxicity in C. elegans by modulating the methionine–homocysteine cycle
- Department of Biological Sciences, Indian Institute of Science Education and Research, Bhopal, India
- Department of Biological Sciences, Indian Institute of Science Education and Research, Mohali, India
Figures
Figure 1 with 1 supplement
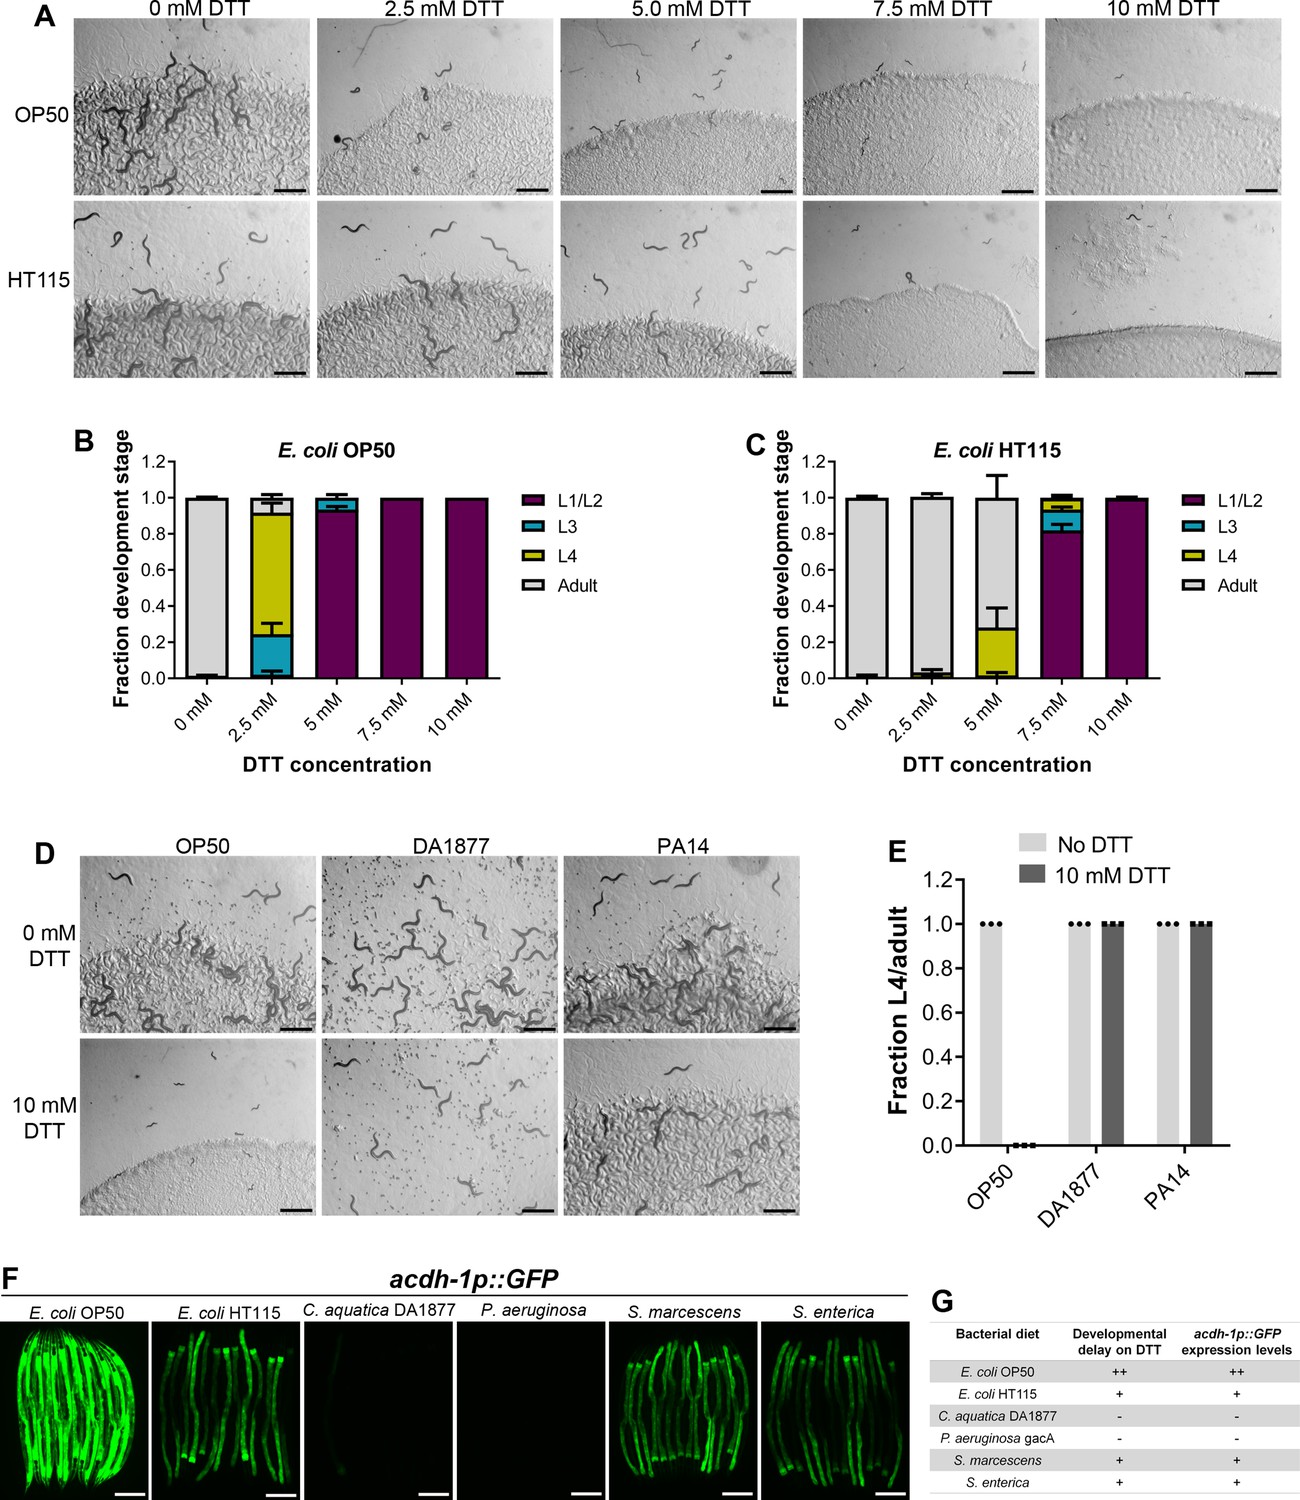
Dithiothreitol (DTT) affects C. elegans development in a diet-dependent manner.
(A) Representative images of wild-type N2 C. elegans on various concentrations of DTT on E. coli OP50 and E. coli HT115 diets after 72 hr of hatching at 20°C. Scale bar = 1 mm. Quantification of different developmental stages of wild-type N2 C. elegans on various concentrations of DTT on E. coli OP50 (B) and E. coli HT115 (C) diets after 72 hr of hatching at 20°C (n = 3 biological replicates; animals per condition per replicate >80). (D) Representative images of wild-type N2 C. elegans after 72 hr of hatching at 20°C on E. coli OP50, C. aquatica DA1877, and P. aeruginosa PA14 gacA mutant diets containing either 0 or 10 mM DTT. Scale bar = 1 mm. (E) Fraction L4 or adult wild-type N2 C. elegans after 72 hr of hatching at 20°C on E. coli OP50, C. aquatica DA1877, and P. aeruginosa PA14 gacA mutant diets containing either 0 or 10 mM DTT (n = 3 biological replicates; animals per condition per replicate >80). (F) Representative fluorescence images of acdh-1p::GFP animals (Watson et al., 2014) grown on various bacterial diets. Scale bar = 200 µm. (G) Table summarizing the effects of bacterial diet on DTT-induced developmental delay and on GFP levels in acdh-1p::GFP animals.
-
Figure 1—source data 1
DTT affects C. elegans development in a diet-dependent manner.
- https://cdn.elifesciences.org/articles/76021/elife-76021-fig1-data1-v2.xlsx
Figure 1—figure supplement 1
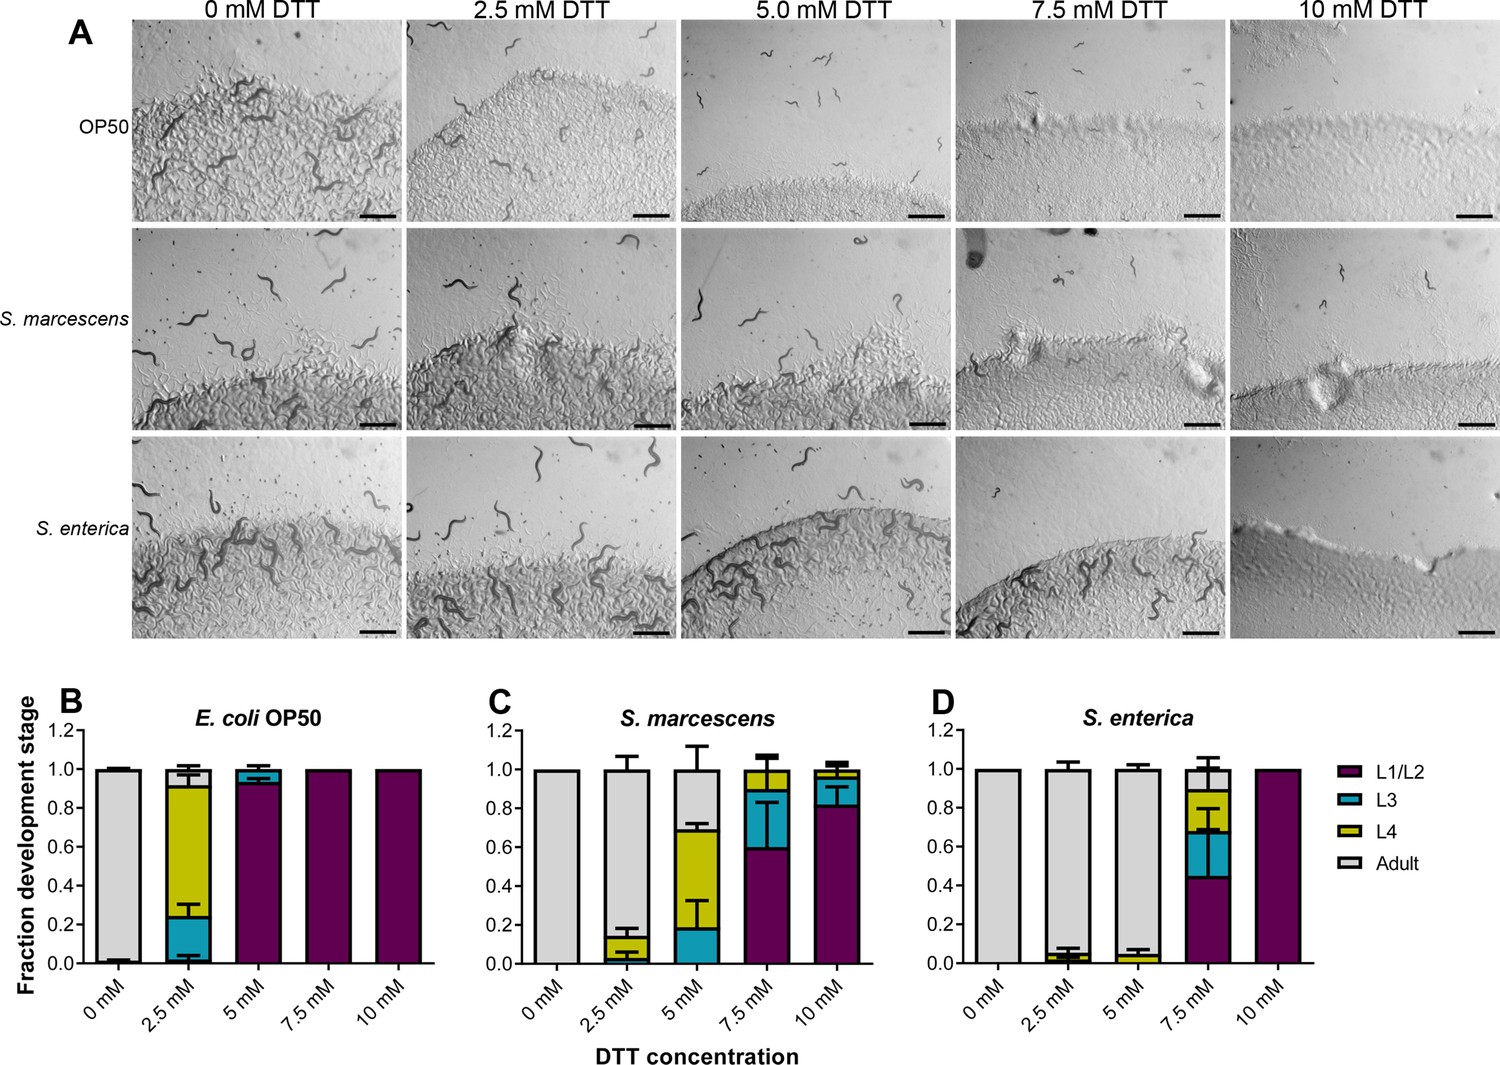
Dithiothreitol (DTT) affects C. elegans development in a diet-dependent manner.
(A) Representative images of wild-type N2 C. elegans on various concentrations of DTT on E. coli OP50, S. marcescens Db11, and S. enterica diets after 72 hr of hatching at 20°C. Scale bar = 1 mm. Quantification of different developmental stages of wild-type N2 C. elegans on various concentrations of DTT on E. coli OP50 (B), S. marcescens Db11 (C), and S. enterica (D) diets after 72 hr of hatching at 20°C (n = 3 biological replicates; animals per condition per replicate >80). The data in (B) are the same as in Figure 1B.
-
Figure 1—figure supplement 1—source data 1
Dithiothreitol (DTT) affects C. elegans development in a diet-dependent manner.
- https://cdn.elifesciences.org/articles/76021/elife-76021-fig1-figsupp1-data1-v2.xlsx
Figure 2 with 1 supplement
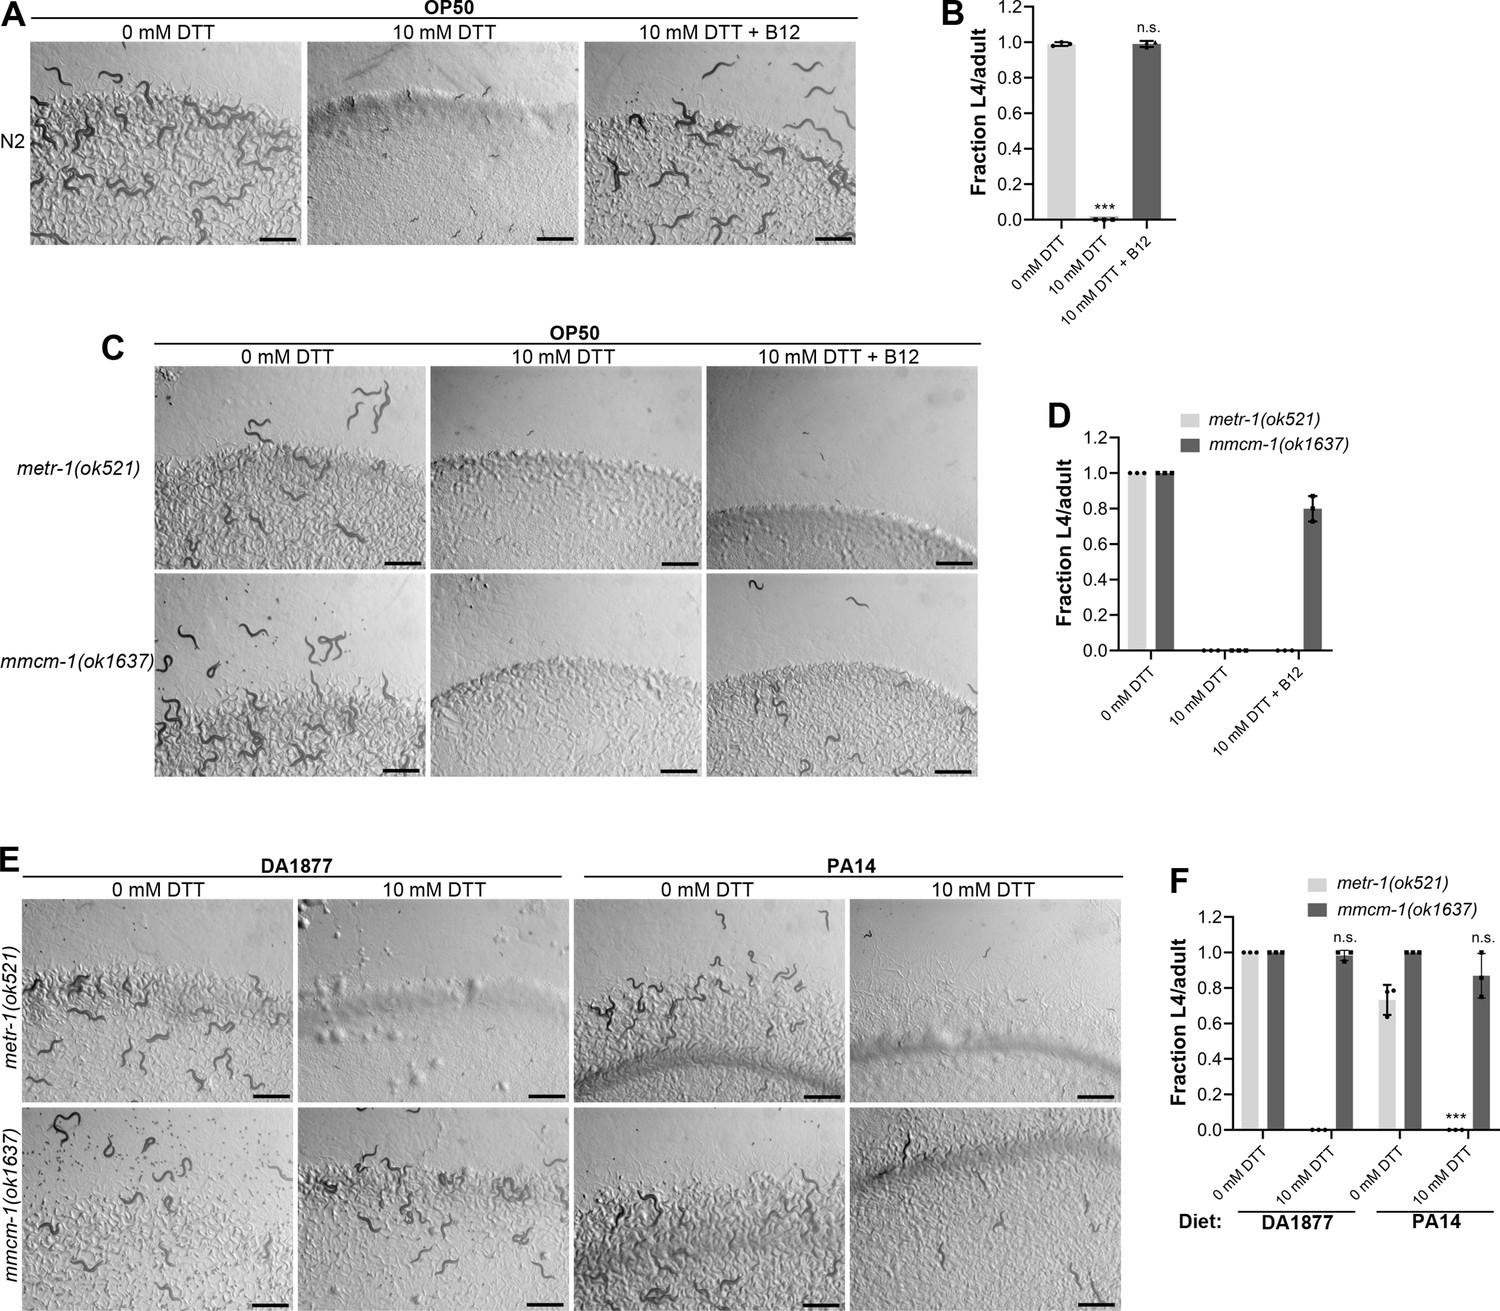
Vitamin B12 alleviates dithiothreitol (DTT) toxicity via methionine synthase.
(A) Representative images of wild-type N2 C. elegans after 72 hr of hatching at 20°C on E. coli OP50 diet containing 0, 10, and 10 mM DTT supplemented with 50 nM vitamin B12. Scale bar = 1 mm. (B) Fraction L4 or adult wild-type N2 C. elegans after 72 hr of hatching at 20°C on E. coli OP50 diet containing 0, 10, and 10 mM DTT supplemented with 50 nM vitamin B12. p values are relative to 0 mM DTT. ***p < 0.001 via the t-test. n.s., nonsignificant (n = 3 biological replicates; animals per condition per replicate >80). (C) Representative images of metr-1(ok521) and mmcm-1(ok1637) animals after 72 hr of hatching at 20°C on E. coli OP50 diet containing 0 mM DTT, 10 mM DTT, and 10 mM DTT supplemented with 50 nM vitamin B12. Scale bar = 1 mm. (D) Fraction L4 or adult metr-1(ok521) and mmcm-1(ok1637) animals after 72 hr of hatching at 20°C on E. coli OP50 diet containing 0, 10, and 10 mM DTT supplemented with 50 nM vitamin B12 (n = 3 biological replicates; animals per condition per replicate >60). (E) Representative images of metr-1(ok521) and mmcm-1(ok1637) animals after 72 hr of hatching at 20°C on C. aquatica DA1877 and P. aeruginosa PA14 gacA mutant diets containing either 0 or 10 mM DTT. Scale bar = 1 mm. (F) Fraction L4 or adult metr-1(ok521) and mmcm-1(ok1637) animals after 72 hr of hatching at 20°C on C. aquatica DA1877 and P. aeruginosa PA14 gacA mutant diets containing either 0 or 10 mM DTT. p values are relative to the corresponding 0 mM DTT condition for each mutant. ***p < 0.001 via the t-test. n.s., nonsignificant (n = 3 biological replicates; animals per condition per replicate>60).
-
Figure 2—source data 1
Vitamin B12 alleviates dithiothreitol (DTT) toxicity via methionine synthase.
- https://cdn.elifesciences.org/articles/76021/elife-76021-fig2-data1-v2.xlsx
Figure 2—figure supplement 1
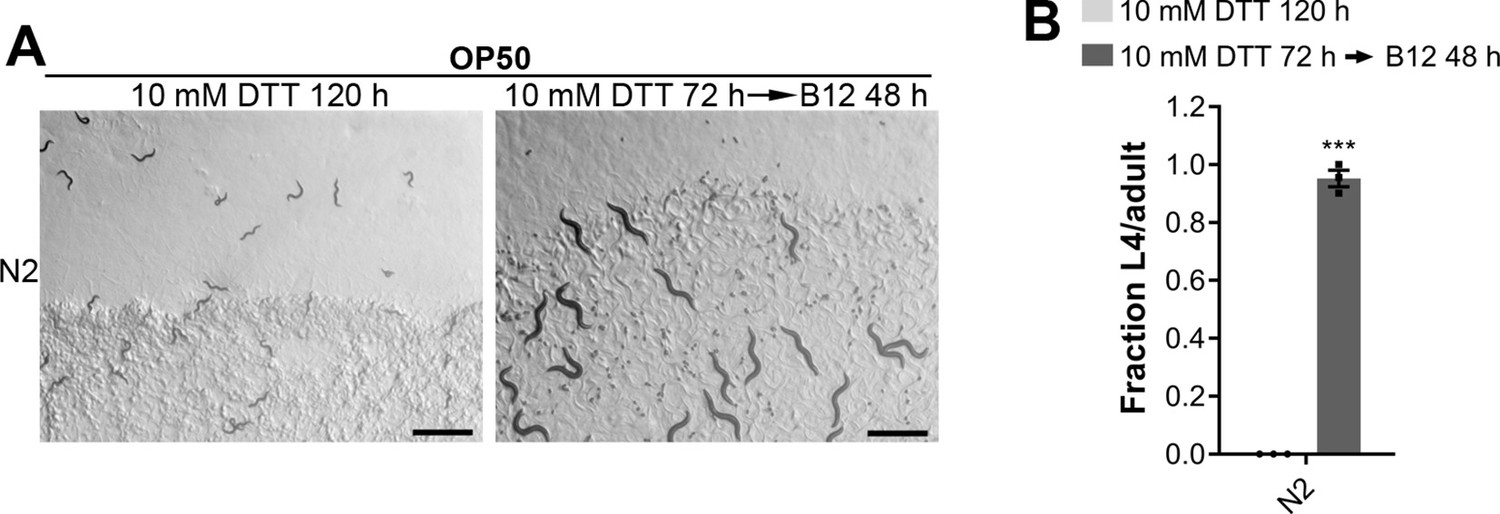
Vitamin B12 supplementation reverses dithiothreitol (DTT) toxicity.
(A) Representative images of wild-type N2 C. elegans grown on E. coli OP50 diet containing 10 mM DTT for 72 hr, followed by another 48 hr growth upon supplementation of either water blank (left panel) or 1.5 nmol of vitamin B12 (right panel). Scale bar = 1 mm. (B) Fraction L4 or adult wild-type N2 C. elegans grown on E. coli OP50 diet containing 10 mM DTT for 72 hr, followed by another 48 hr growth upon supplementation of either water blank (10 mM DTT 120 hr) or 1.5 nmol of vitamin B12. ***p < 0.001 via the t-test (n = 3 biological replicates; animals per condition per replicate >60).
-
Figure 2—figure supplement 1—source data 1
Vitamin B12 supplementation reverses dithiothreitol (DTT) toxicity.
- https://cdn.elifesciences.org/articles/76021/elife-76021-fig2-figsupp1-data1-v2.xlsx
Figure 3 with 4 supplements
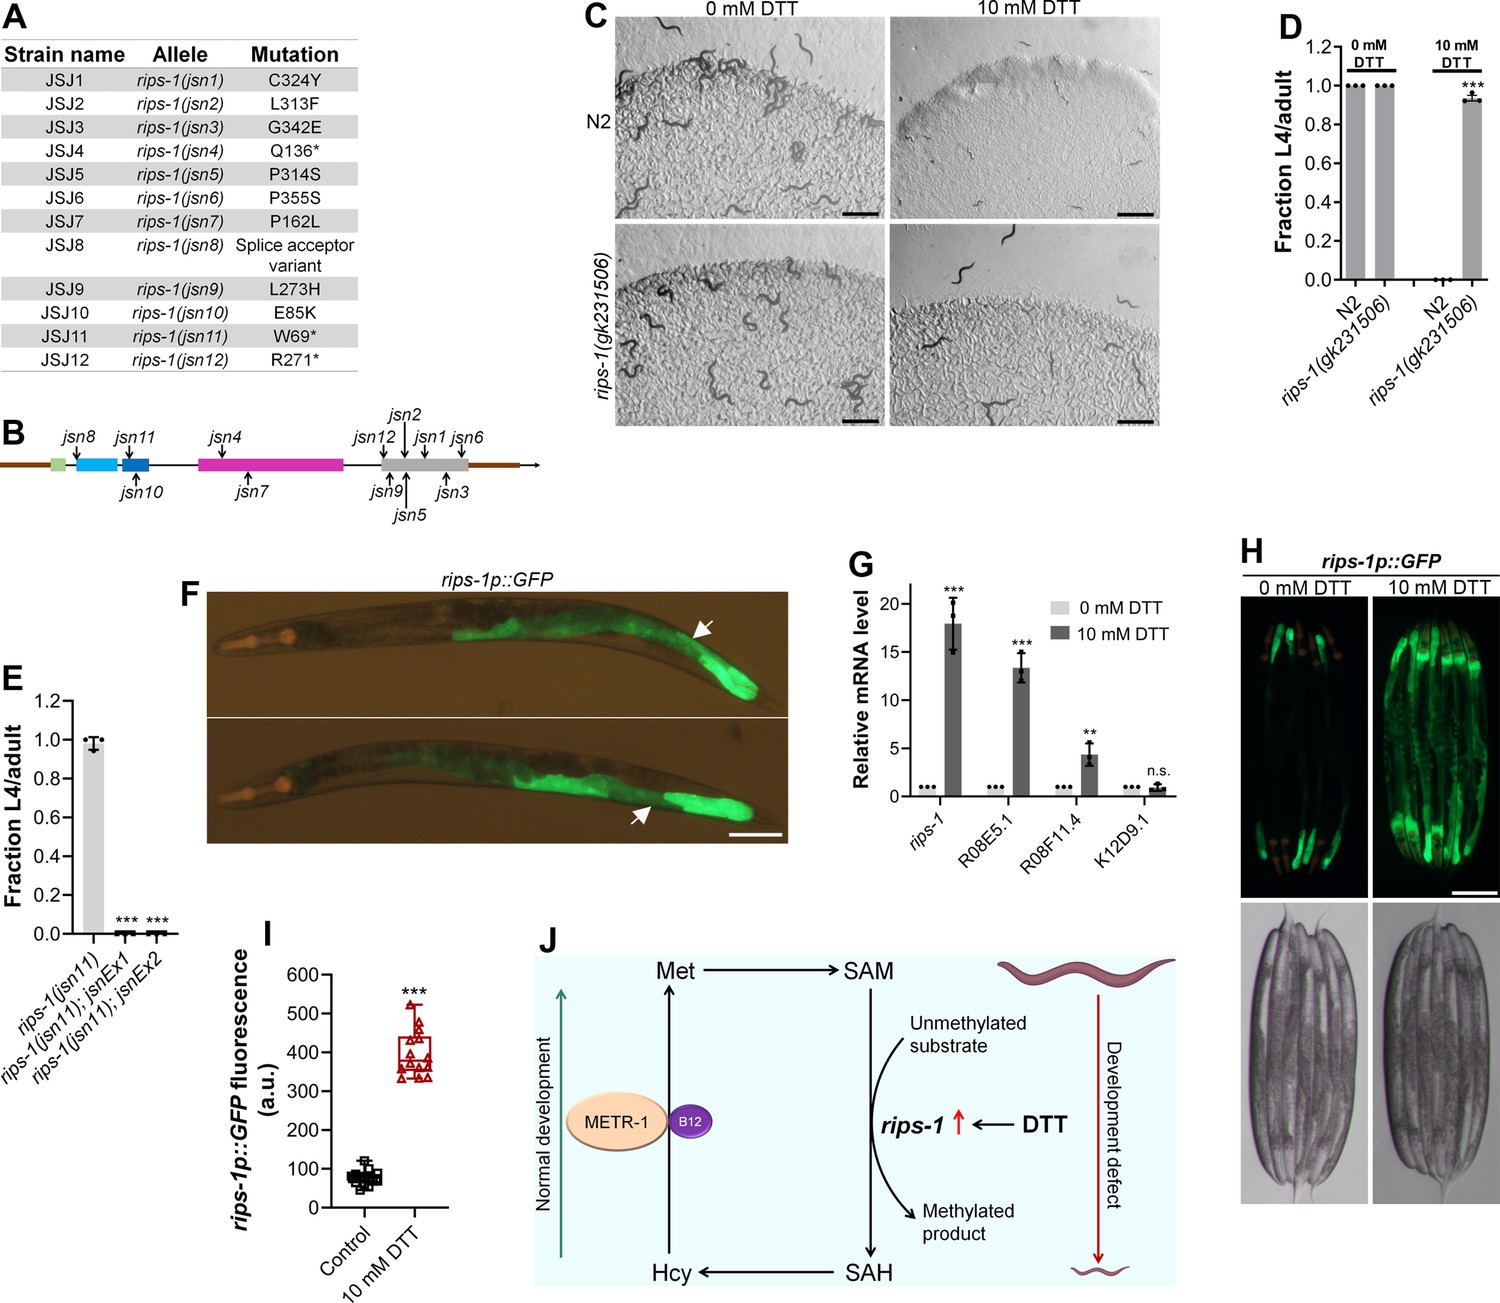
Dithiothreitol (DTT) causes developmental toxicity via rips-1.
(A) Table summarizing the alleles of rips-1 identified by whole-genome sequencing in different DTT-resistant strains. The corresponding amino acid changes in the RIPS-1 protein are also shown. (B) Mapping of the rips-1 alleles identified in the forward genetic screen. (C) Representative images of N2 and rips-1(gk231506) animals after 84 hr of hatching at 20°C on E. coli OP50 diets containing either 0 or 10 mM DTT. Scale bar = 1 mm. (D) Fraction L4 or adult N2 and rips-1(gk231506) animals after 84 hr of hatching at 20°C on E. coli OP50 diets containing either 0 or 10 mM DTT. ***p < 0.001 via the t-test (n = 3 biological replicates; animals per condition per replicate >50). (E) Fraction L4 or adult rips-1(jsn11), rips-1(jsn11);jsnEx1, and rips-1(jsn11);jsnEx2 animals after 72 hr of hatching at 20°C on E. coli OP50 diet containing 10 mM DTT. jsnEx1 and jsnEx2 represent two independent extrachromosomal arrays containing rips-1p::rips-1::SL2::GFP and myo-2p::mCherry. ***p < 0.001 via the t-test (n = 3 biological replicates; animals per condition per replicate >50). (F) Representative fluorescence images of jsnIs1[rips-1p::GFP +myo-2p::mCherry] animals. The white arrows point at the intestinal regions showing GFP expression. Scale bar = 100 µm. (G) Gene expression analysis of N2 animals grown on E. coli OP50 diet containing 0 mM DTT until the young adult stage, followed by incubation on E. coli OP50 diet containing 0 or 10 mM DTT for 4 hr. ***p < 0.001 and **p < 0.01 via the t-test. n.s., nonsignificant (n = 3 biological replicates). (H) Representative fluorescence (top) and the corresponding brightfield (bottom) images of rips-1p::GFP animals grown on E. coli OP50 diet containing 0 mM DTT until the young adult stage, followed by incubation on E. coli OP50 diet containing 0 mM or 10 mM DTT for 8 hr. Scale bar = 200 µm. (I) Quantification of GFP levels of rips-1p::GFP animals grown on E. coli OP50 diet containing 0 mM DTT until the young adult stage, followed by incubation on E. coli OP50 diet containing 0 or 10 mM DTT for 8 hr. ***p < 0.001 via the t-test (n = 14 worms each). (J) Model depicting the effects of DTT and vitamin B12 on C. elegans development via the methionine–homocysteine cycle.
-
Figure 3—source data 1
Dithiothreitol (DTT) causes developmental toxicity via rips-1.
- https://cdn.elifesciences.org/articles/76021/elife-76021-fig3-data1-v2.xlsx
Figure 3—figure supplement 1
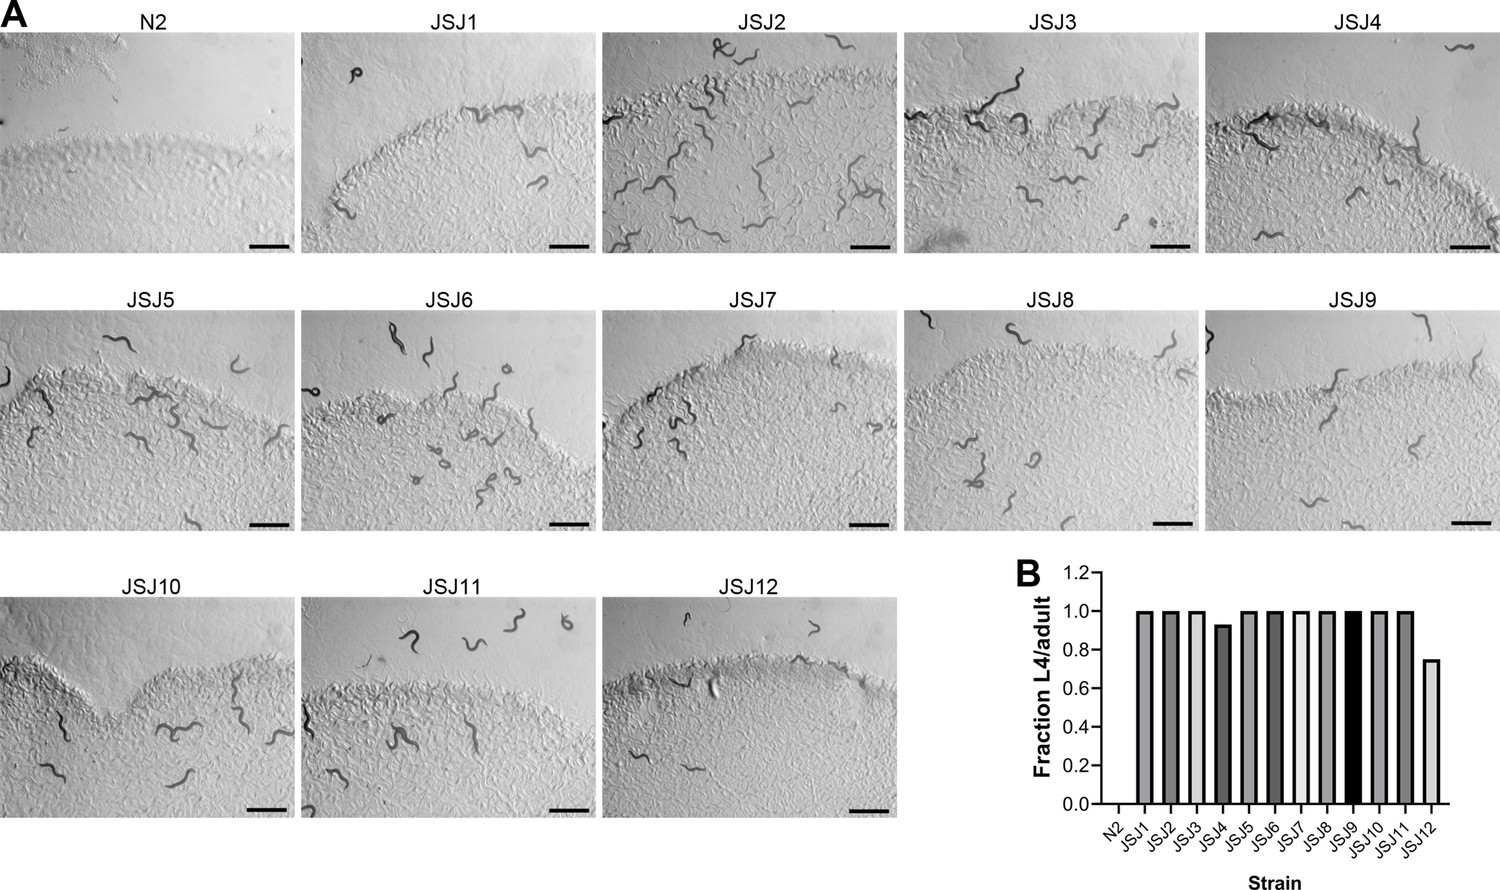
Forward genetic screen resulted in the isolation of 12 dithiothreitol (DTT)-resistant mutants.
(A) Representative images of N2 and DTT-resistant mutants (JSJ1 to JSJ12) on E. coli OP50 diet containing 10 mM DTT after 72 hr of hatching at 20°C. Scale bar = 1 mm. (B) Fraction L4 or adult N2 and DTT-resistant mutants on E. coli OP50 diet containing 10 mM DTT after 72 hr of hatching at 20°C.
Figure 3—figure supplement 2
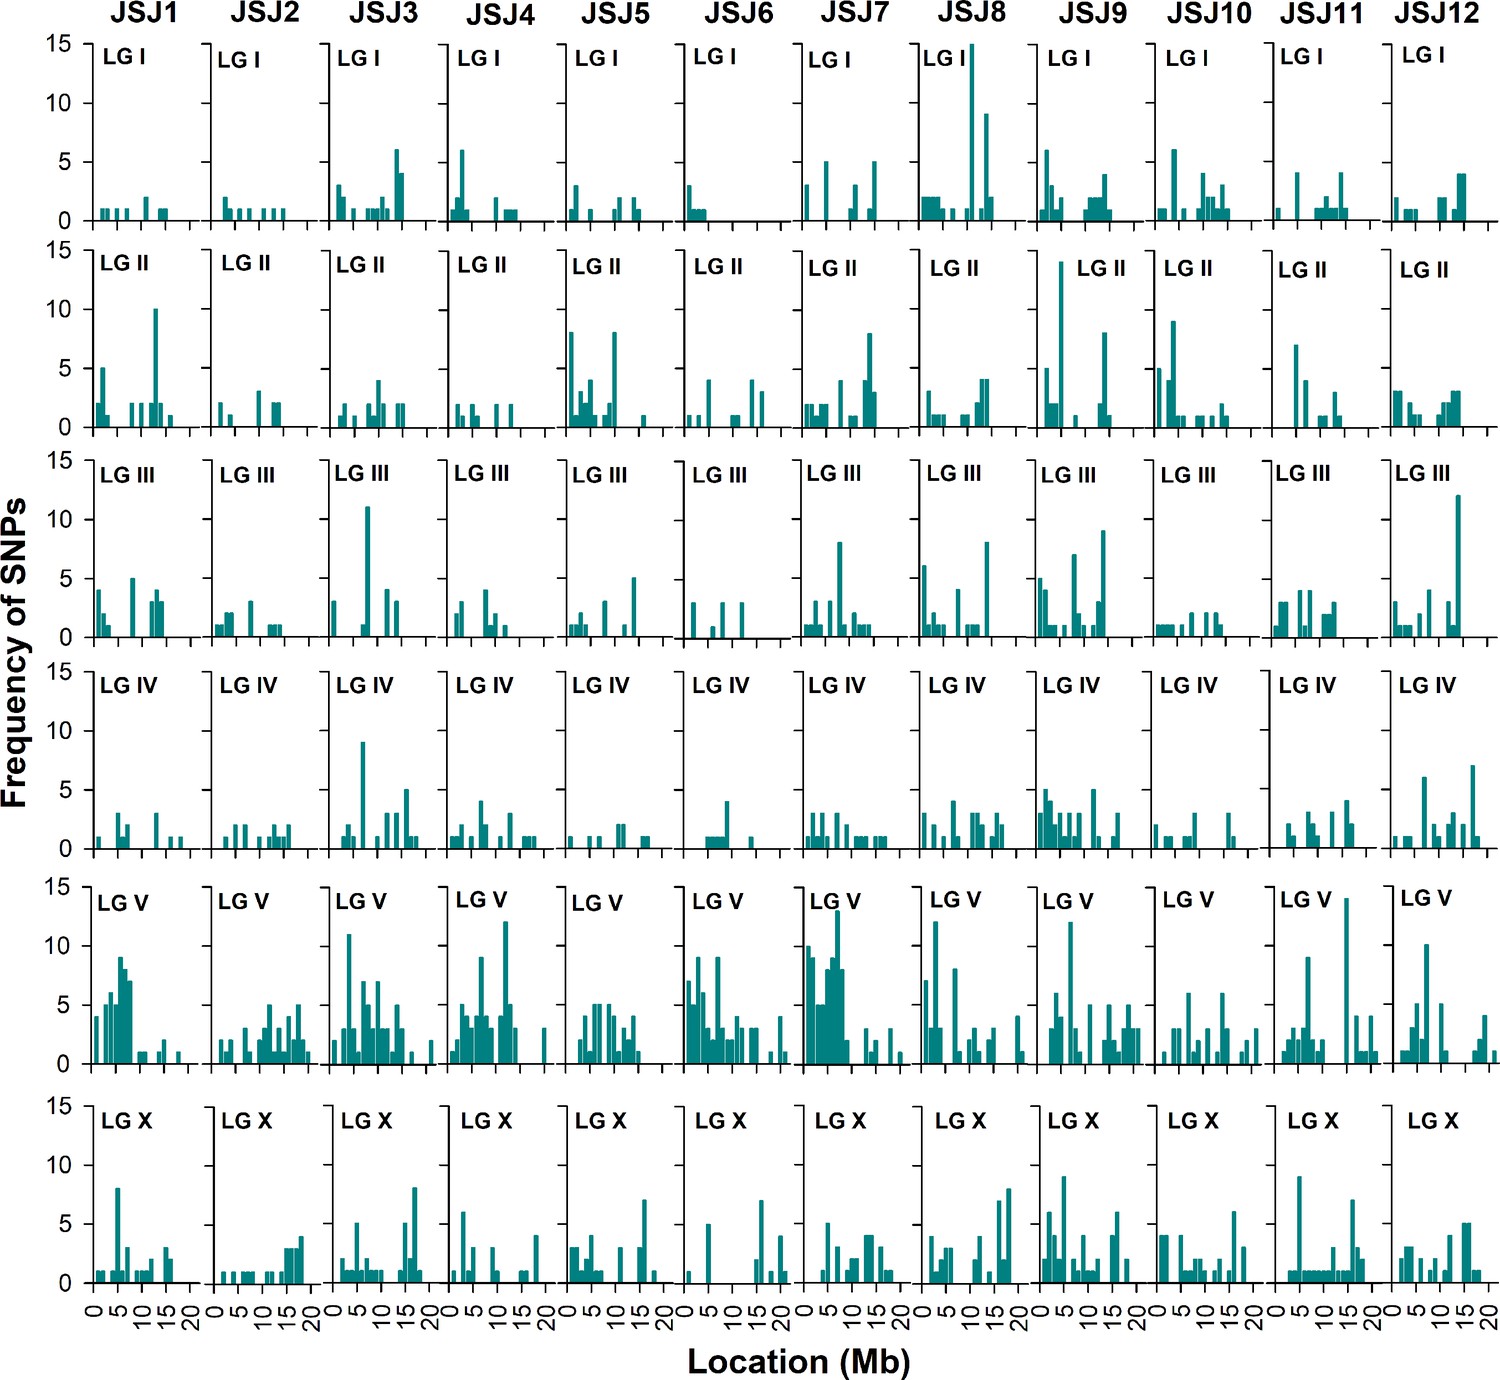
Mapping of the mutations by whole-genome sequencing.
The frequencies of single-nucleotide polymorphisms (SNPs) were plotted against the positions of different chromosomes or linkage groups (LG). The high frequency of SNPs on a particular chromosome compared to other regions of the genome represents the region linked with the causative mutation(s). All mutants showed a high frequency of SNPs on chromosome V.
-
Figure 3—figure supplement 2—source data 1
Mapping of the mutations by whole-genome sequencing.
- https://cdn.elifesciences.org/articles/76021/elife-76021-fig3-figsupp2-data1-v2.xlsx
Figure 3—figure supplement 3
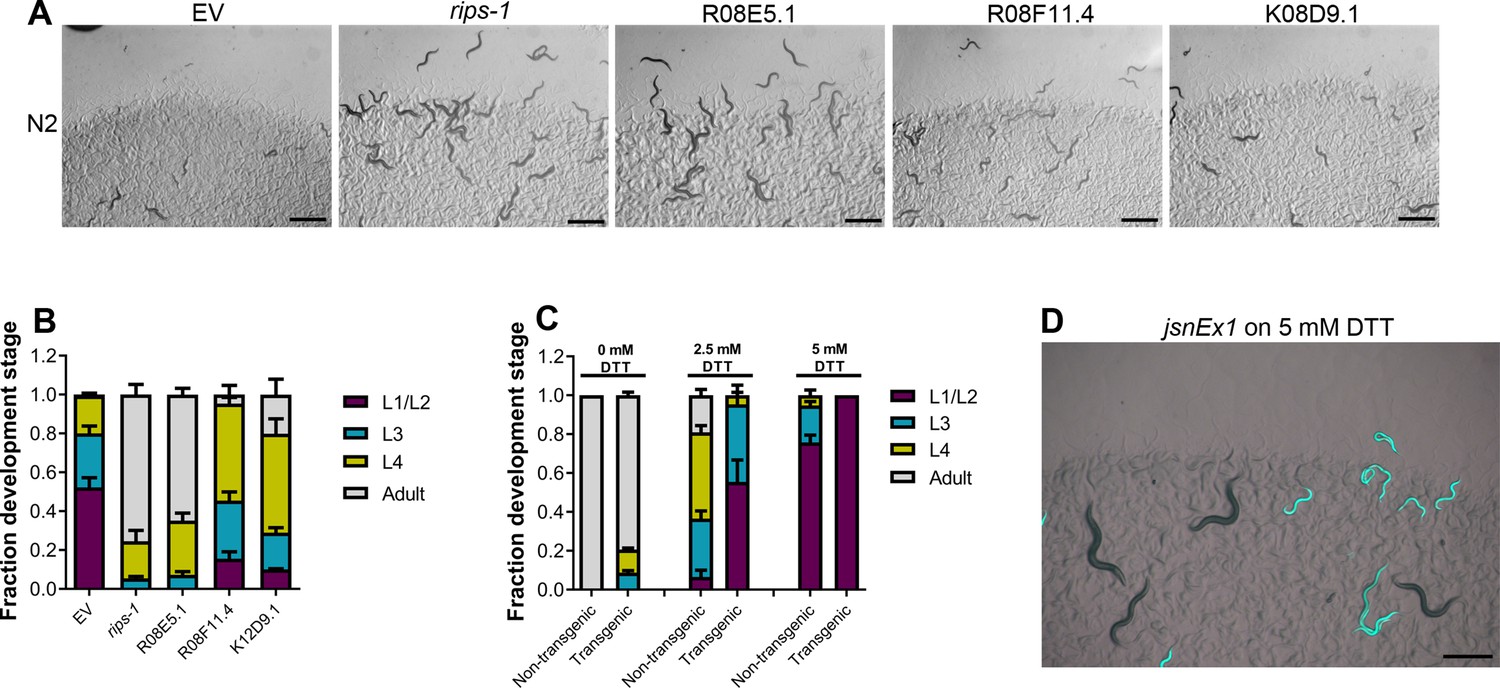
Dithiothreitol (DTT) causes developmental toxicity via rips-1.
(A) Representative images of N2 animals grown on RNA interference (RNAi) bacteria targeting the mentioned genes in the presence of 10 mM DTT after 72 hr of hatching at 20°C. EV, empty vector RNAi control. Scale bar = 1 mm. (B) Quantification of different developmental stages of N2 animals grown on RNAi bacteria targeting the mentioned genes in the presence of 10 mM DTT after 72 hr of hatching at 20°C (n = 3 biological replicates; animals per condition per replicate >100). (C) Quantification of different developmental stages of the nontransgenic and transgenic progenies of jsnEx1[rips-1p::rips-1::SL2::GFP + myo-2p::mCherry] animals after 72 hr of hatching at 20°C on E. coli OP50 diet containing 0, 2.5, and 5 mM DTT (n = 3 biological replicates; animals per condition per replicate >40). (D) Representative image of jsnEx1 animals after 4 days of hatching at 20°C on E. coli OP50 diet containing 5 mM DTT. Fluorescent (green) and nonfluorescent (nongreen) worms represent transgenic and nontransgenic progeny, respectively. Scale bar = 0.5 mm.
-
Figure 3—figure supplement 3—source data 1
Dithiothreitol (DTT) causes developmental toxicity via rips-1.
- https://cdn.elifesciences.org/articles/76021/elife-76021-fig3-figsupp3-data1-v2.xlsx
Figure 3—figure supplement 4
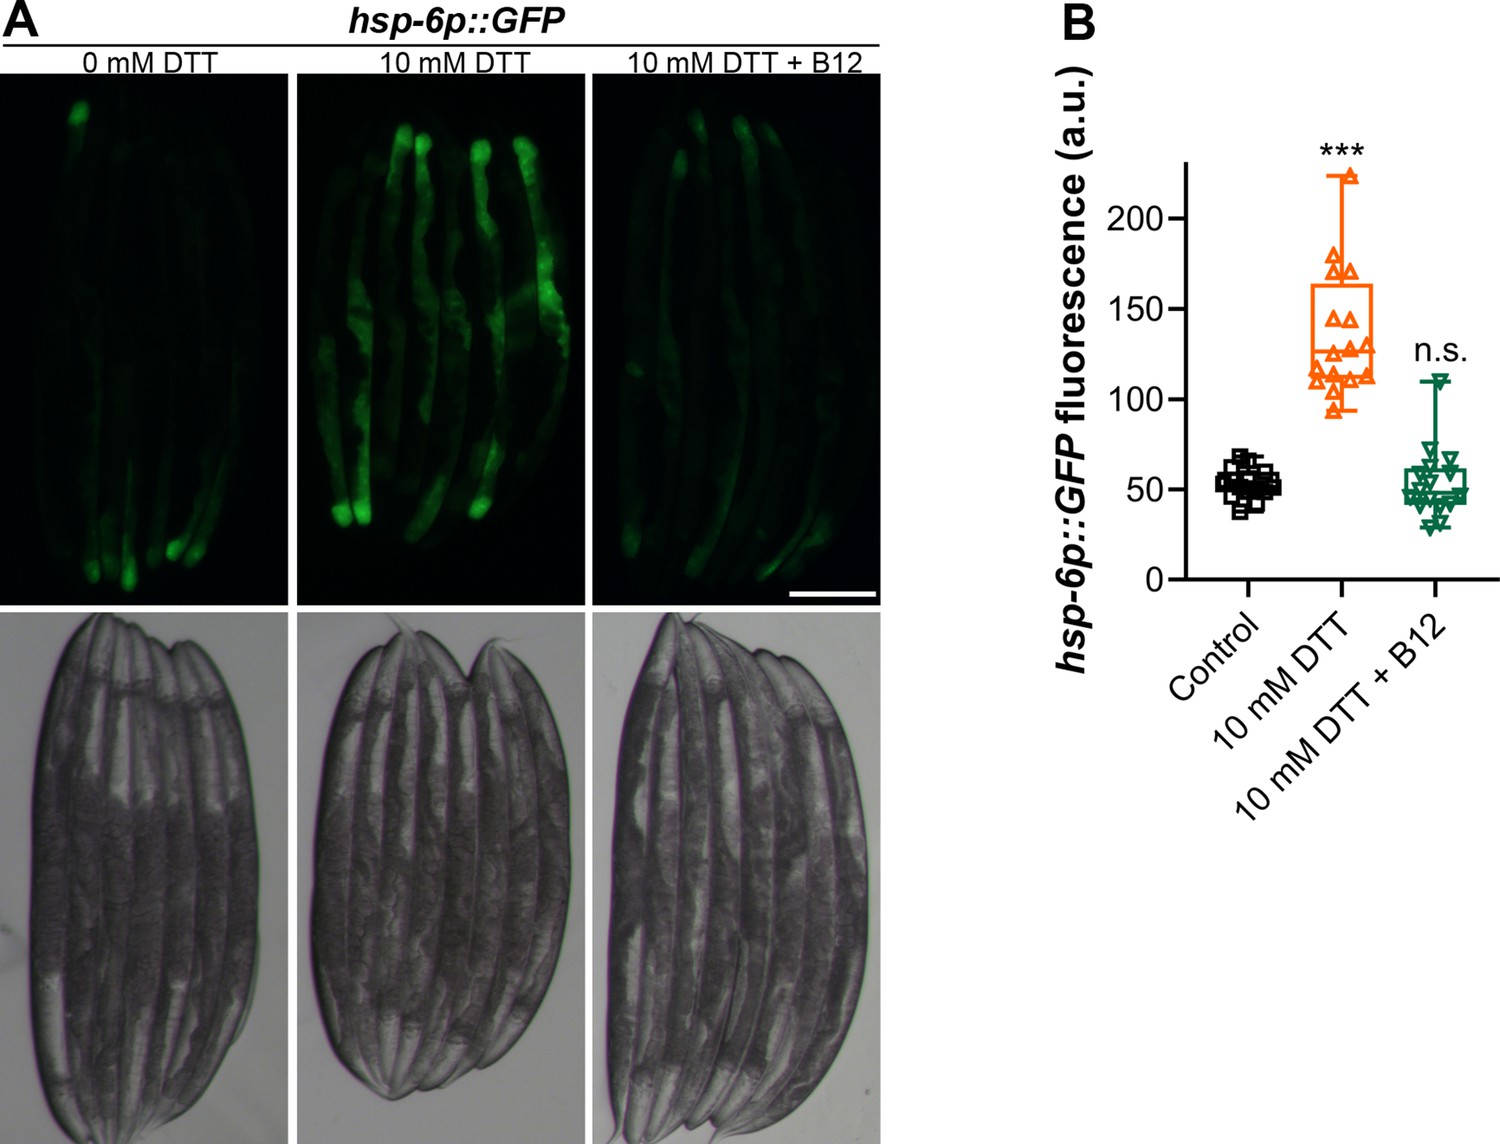
Dithiothreitol (DTT) upregulates the mitochondrial unfolded protein response (UPR).
(A) Representative fluorescence images (top) and the corresponding brightfield images (bottom) of hsp-6p::GFP animals grown on E. coli OP50 diet containing 0 mM DTT until the young adult stage, followed by incubation on E. coli OP50 diet containing 0, 10, and 10 mM DTT supplemented with 50 nM vitamin B12 for 24 hr. Scale bar = 200 µm. (B) Quantification of GFP levels of hsp-6p::GFP animals grown on E. coli OP50 diet containing 0 mM DTT until the young adult stage, followed by incubation on E. coli OP50 diet containing 0, 10, and 10 mM DTT supplemented with 50 nM vitamin B12 for 24 hr. p values are relative to the control. ***p < 0.001 via the t-test. n.s., nonsignificant (n = 15 for 0 mM DTT, and 16 each for 10 mM DTT and 10 mM DTT supplemented with 50 nM vitamin B12).
-
Figure 3—figure supplement 4—source data 1
Dithiothreitol (DTT) upregulates the mitochondrial unfolded protein response (UPR).
- https://cdn.elifesciences.org/articles/76021/elife-76021-fig3-figsupp4-data1-v2.xlsx
Figure 4
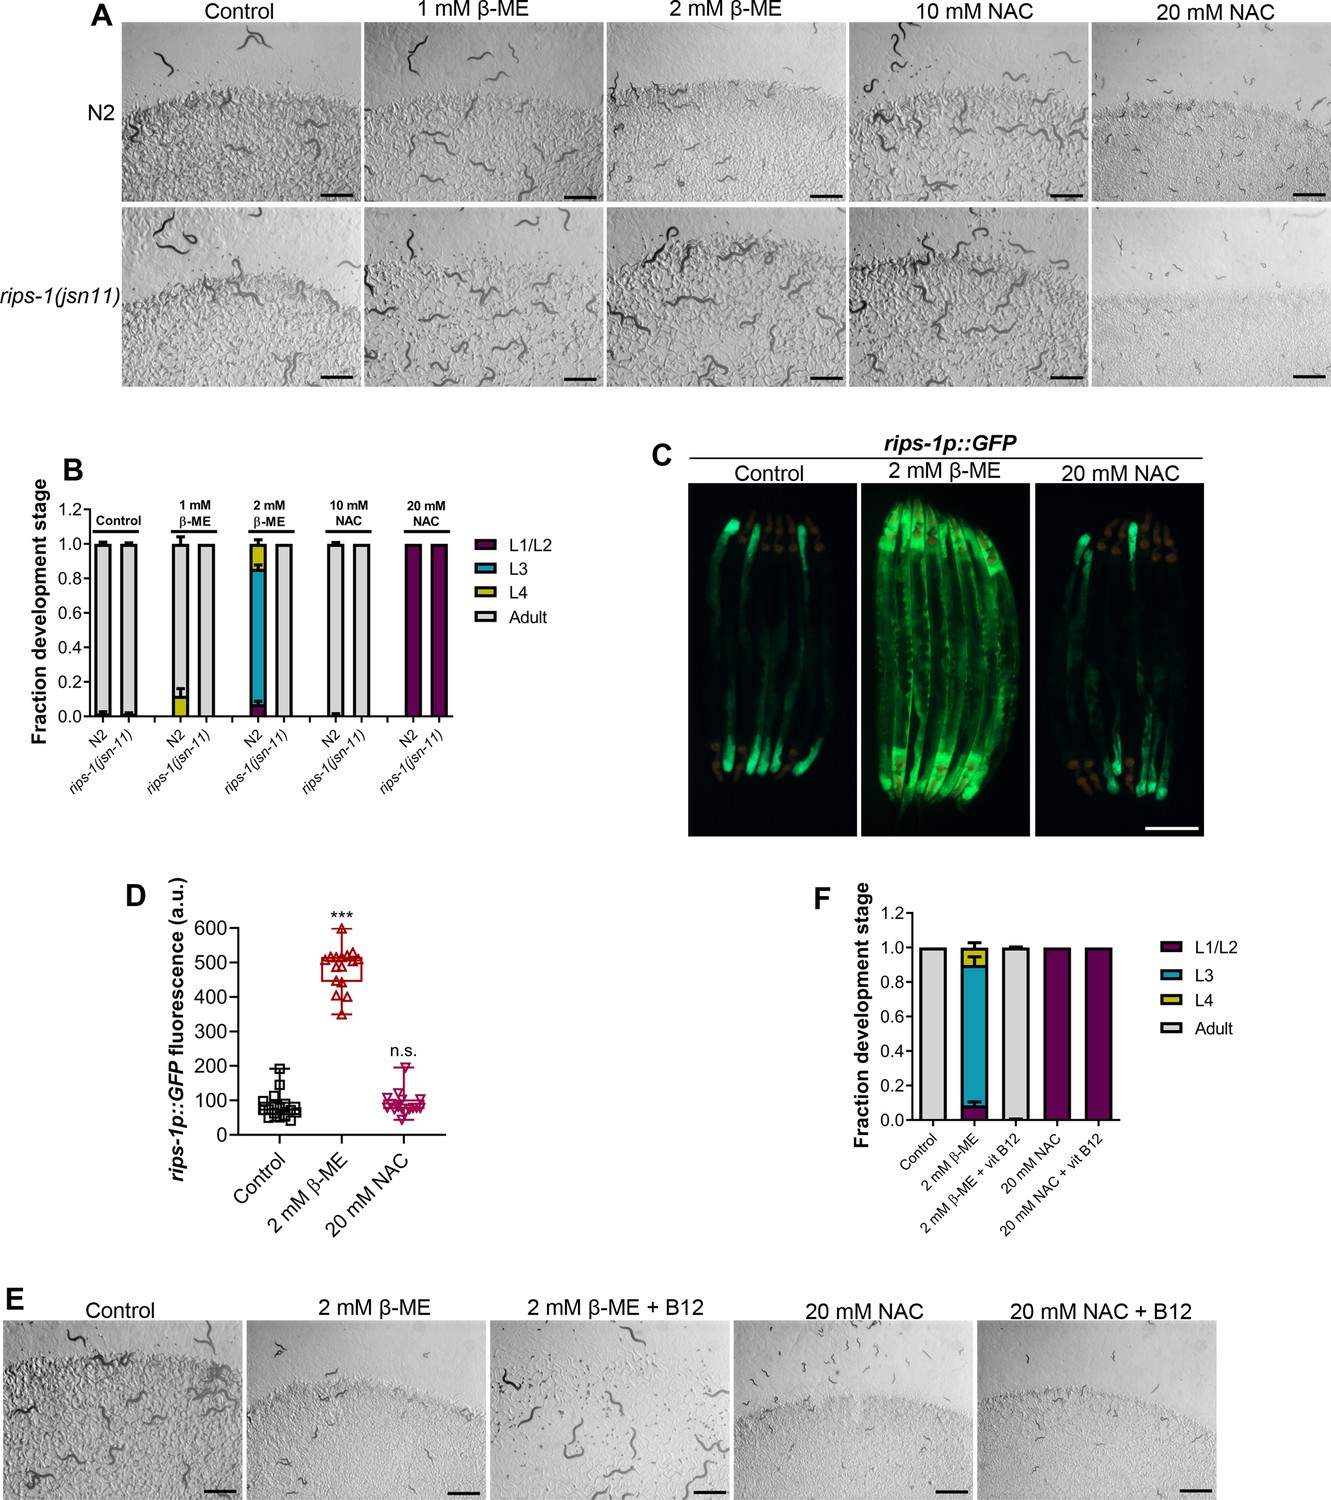
β-Mercaptoethanol (β-ME), but not N-acetylcysteine (NAC), shares toxicity pathway with dithiothreitol (DTT).
(A) Representative images of N2 and rips-1(jsn11) animals after 72 hr of hatching at 20°C on E. coli OP50 diet containing no supplements (control), 1 mM β-ME, 2 mM β-ME, 10 mM NAC, and 20 mM NAC. Scale bar = 1 mm. (B) Quantification of different developmental stages of N2 and rips-1(jsn11) animals after 72 hr of hatching at 20°C on E. coli OP50 diet containing no supplements (control), 1 mM β-ME, 2 mM β-ME, 10 mM NAC, and 20 mM NAC (n = 3 biological replicates; animals per condition per replicate >50). (C) Representative fluorescence (top) and the corresponding brightfield (bottom) images of rips-1p::GFP animals grown on E. coli OP50 diet without any supplements until the young adult stage, followed by incubation on E. coli OP50 diet containing no supplement (control), 2 mM β-ME, or 20 mM NAC for 8 hr. Scale bar = 200 µm. (D) Quantification of GFP levels of rips-1p::GFP animals grown on E. coli OP50 diet without any supplements until the young adult stage, followed by incubation on E. coli OP50 diet containing no supplement (control), 2 mM β-ME, or 20 mM NAC for 8 hr. p values are relative to the control. ***p < 0.001 via the t-test. n.s., nonsignificant (n = 16 worms each). (E) Representative images of N2 animals after 72 hr of hatching at 20°C on E. coli OP50 diet containing no supplements (control), 2 mM β-ME, 2 mM β-ME supplemented with 50 nM vitamin B12, 20 mM NAC, and 20 mM NAC supplemented with 50 nM vitamin B12. Scale bar = 1 mm. (F) Quantification of different developmental stages of N2 animals after 72 hr of hatching at 20°C on E. coli OP50 diet containing no supplements (control), 2 mM β-ME, 2 mM β-ME supplemented with 50 nM vitamin B12, 20 mM NAC, and 20 mM NAC supplemented with 50 nM vitamin B12 (n = 3 biological replicates; animals per condition per replicate >50).
-
Figure 4—source data 1
β-Mercaptoethanol (β-ME), but not N-acetylcysteine (NAC), shares toxicity pathway with dithiothreitol (DTT).
- https://cdn.elifesciences.org/articles/76021/elife-76021-fig4-data1-v2.xlsx
Figure 5
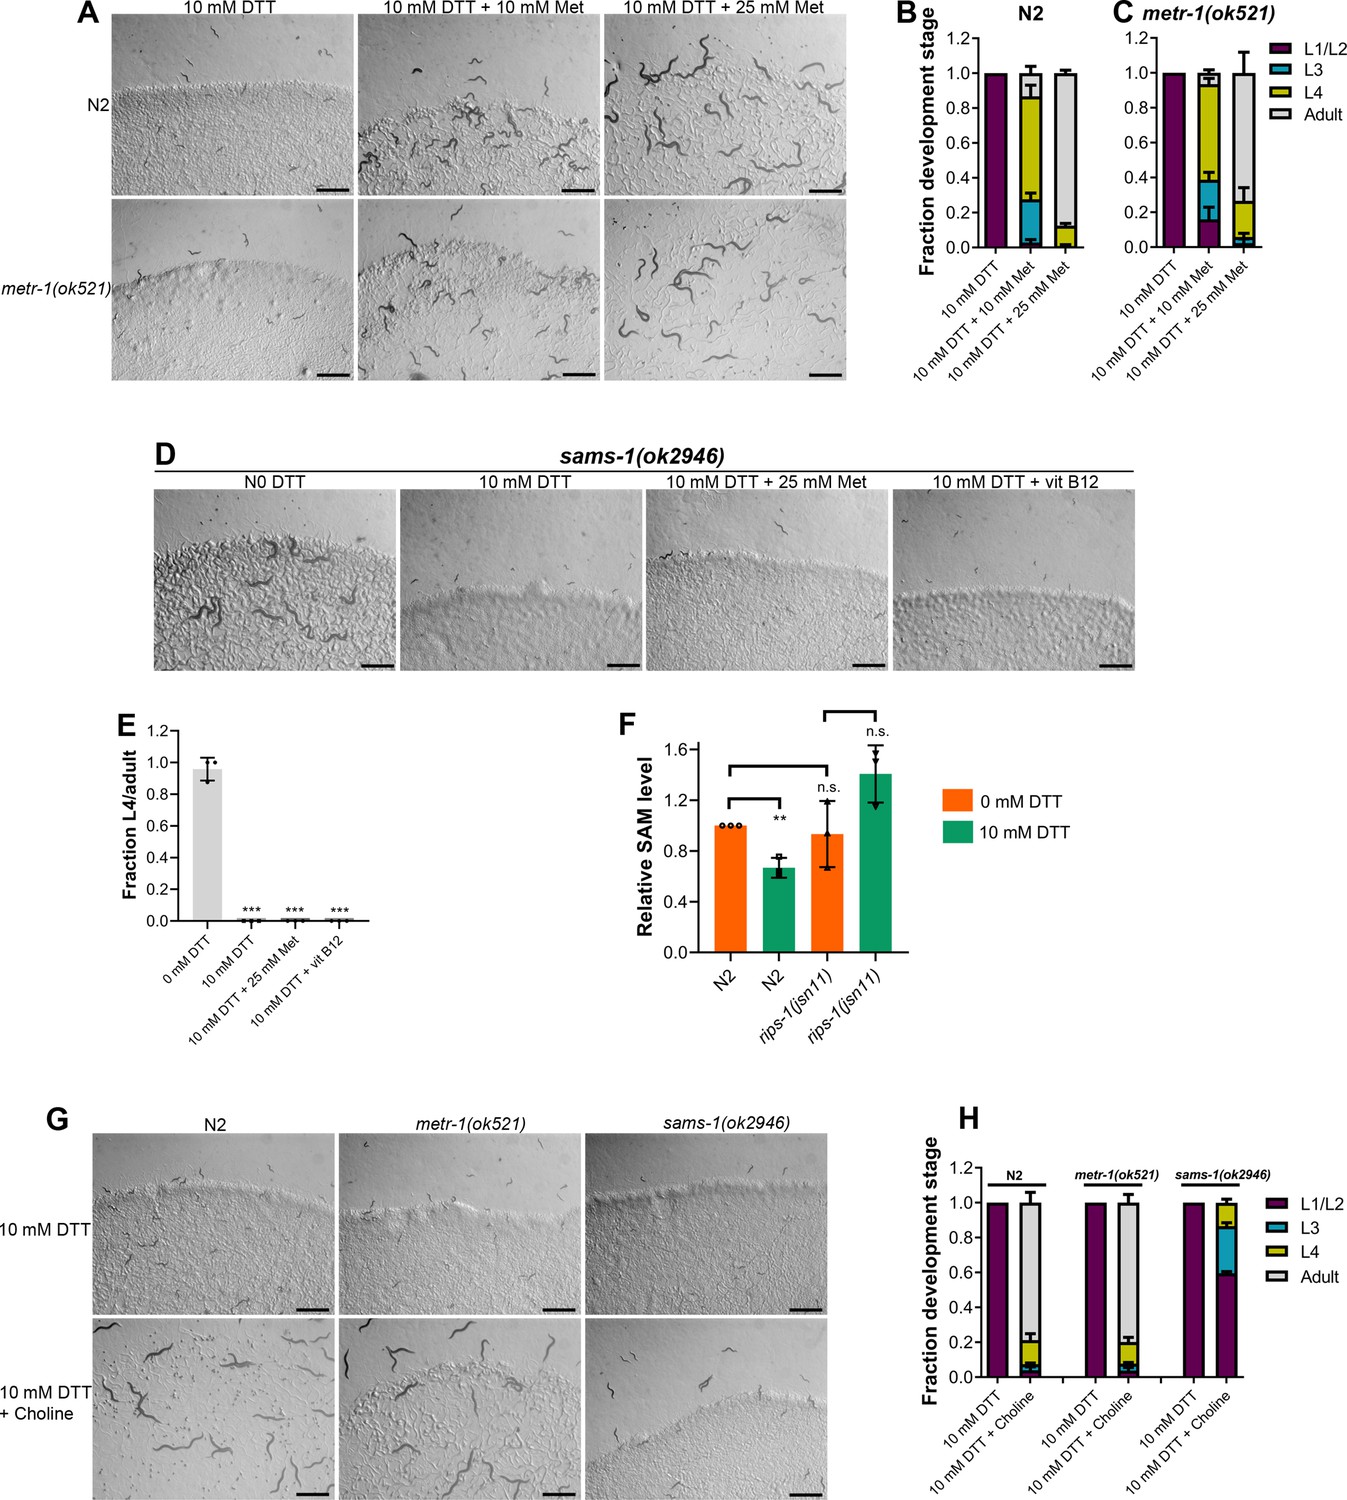
Methionine and choline supplementation alleviate dithiothreitol (DTT) toxicity.
(A) Representative images of N2 and metr-1(ok521) animals after 5 days of hatching at 20°C on E. coli OP50 diet containing 10 mM DTT, 10 mM DTT supplemented with 10 mM methionine, and 10 mM DTT supplemented with 25 mM methionine. Scale bar = 1 mm. Quantification of different developmental stages of N2 (B) and metr-1(ok521) (C) animals after 5 days of hatching at 20°C on E. coli OP50 diet containing 10 mM DTT, 10 mM DTT supplemented with 10 mM methionine, and 10 mM DTT supplemented with 25 mM methionine (n = 3 biological replicates; animals per condition per replicate >60). (D) Representative images of sams-1(ok2946) animals grown on E. coli OP50 diet containing 0 mM DTT, 10 mM DTT, 10 mM DTT supplemented with 25 mM methionine, and 10 mM DTT supplemented with 50 nM vitamin B12. The animals were grown for 5 days on the plates containing methionine and for 3 days under all other conditions. Scale bar = 1 mm. (E) Fraction L4 or adult sams-1(ok2946) animals grown on E. coli OP50 diet containing 0, 10, and 10 mM DTT supplemented with 25 mM methionine, and 10 mM DTT supplemented with 50 nM vitamin B12. The animals were grown for 5 days on the plates containing methionine and for 3 days under all other conditions. ***p < 0.001 via the t-test (n = 3 biological replicates; animals per condition per replicate >50). (F) Relative S-adenosylmethionine (SAM) levels in N2 and rips-1(jsn11) animals grown on E. coli OP50 diet containing 0 mM DTT until the young adult stage, followed by incubation on E. coli OP50 diet containing 0 or 10 mM DTT for 12 hr. **p < 0.01 via the t-test. n.s., nonsignificant (n = 3 biological replicates). (G) Representative images of N2, metr-1(ok521), and sams-1(ok2946) animals after 4 days of hatching at 20°C on E. coli OP50 diet containing 10 and 10 mM DTT supplemented with 80 mM choline. Scale bar = 1 mm. (H) Quantification of different developmental stages of N2, metr-1(ok521), and sams-1(ok2946) animals after 4 days of hatching at 20°C on E. coli OP50 diet containing 10 and 10 mM DTT supplemented with 80 mM choline (n = 3 biological replicates; animals per condition per replicate >50).
-
Figure 5—source data 1
Methionine and choline supplementation alleviate dithiothreitol (DTT) toxicity.
- https://cdn.elifesciences.org/articles/76021/elife-76021-fig5-data1-v2.xlsx
Figure 6 with 2 supplements
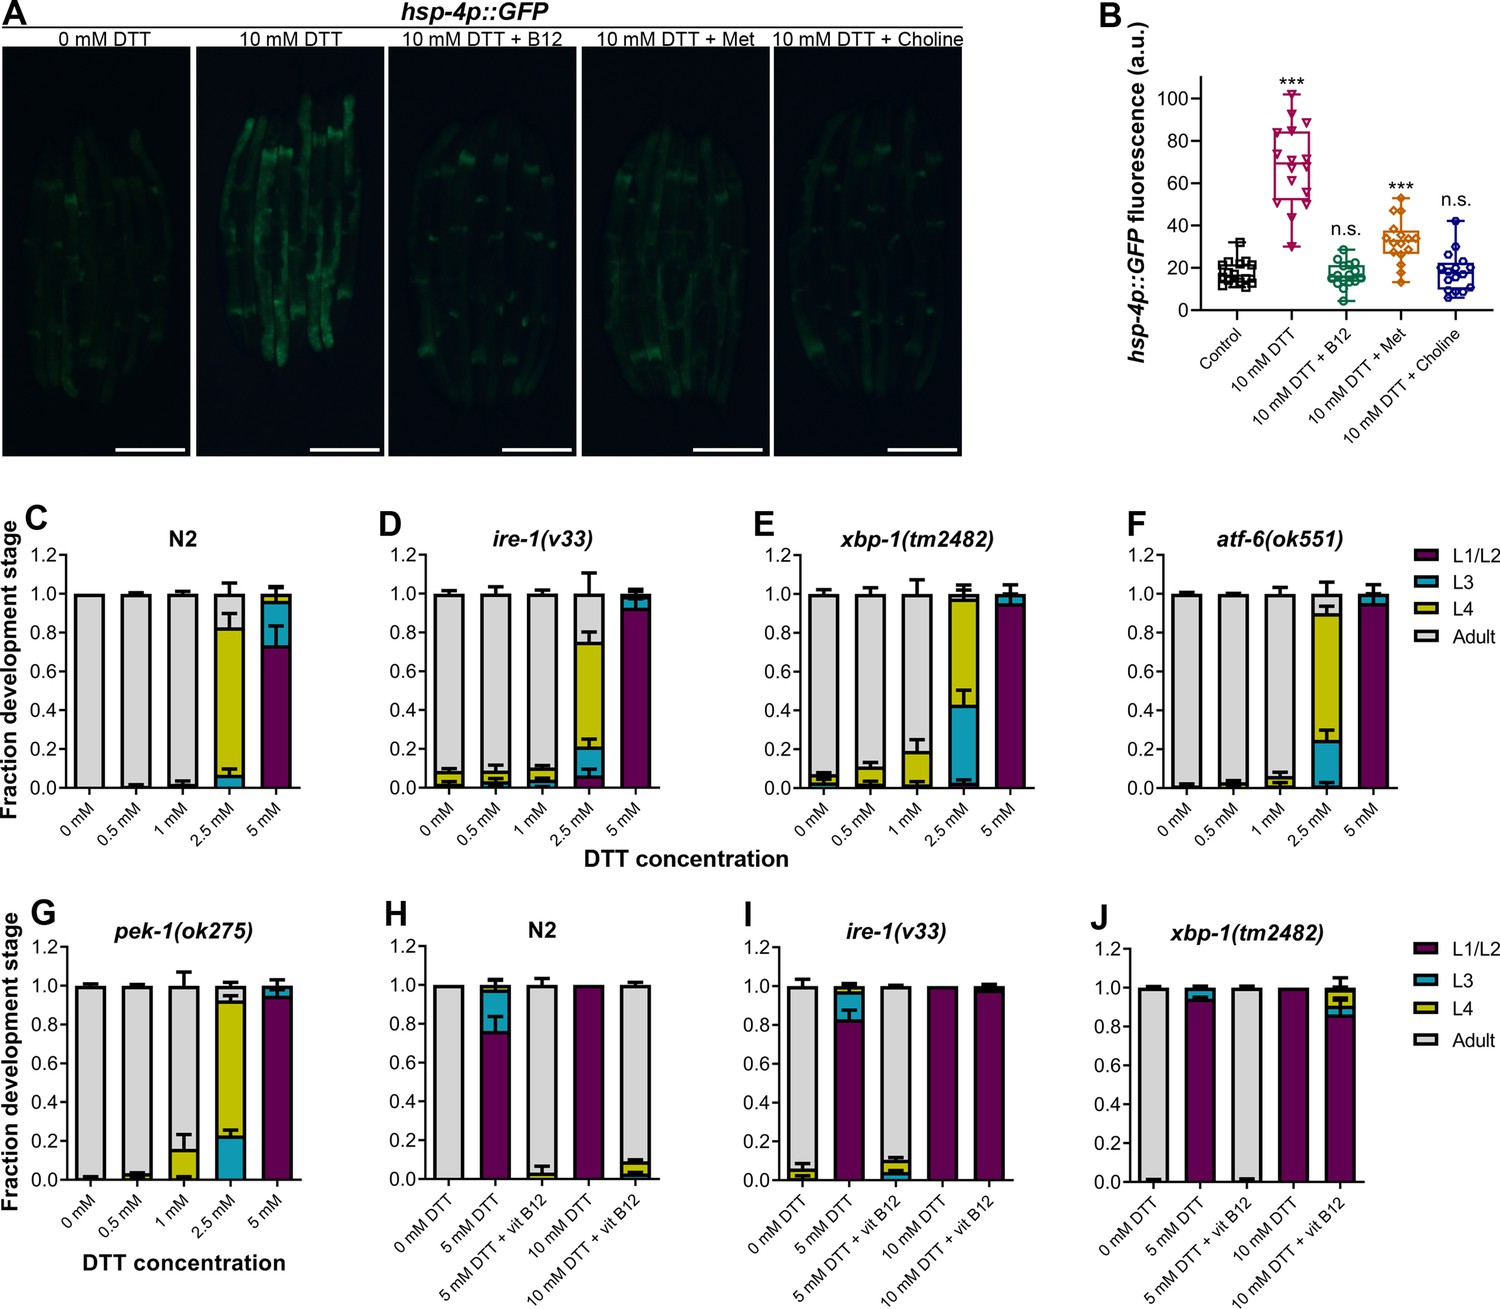
High levels of dithiothreitol (DTT) cause toxicity via the methionine–homocysteine cycle and ER proteotoxic stress.
(A) Representative fluorescence images of hsp-4p::GFP animals grown on E. coli OP50 diet containing 0 mM DTT until the young adult stage, followed by incubation on E. coli OP50 diet containing 0, 10, and 10 mM DTT supplemented with 50 nM vitamin B12, 10 mM DTT supplemented with 25 mM methionine, and 10 mM DTT supplemented with 80 mM choline for 24 hr. Scale bar = 200 µm. (B) Quantification of GFP levels of hsp-4p::GFP animals grown on E. coli OP50 diet containing 0 mM DTT until the young adult stage, followed by incubation on E. coli OP50 diet containing 0, 10, 10 mM DTT supplemented with 50 nM vitamin B12, 10 mM DTT supplemented with 25 mM methionine, and 10 mM DTT supplemented with 80 mM choline for 24 hr. ***p < 0.001 via the t-test. n.s., nonsignificant (n = 16 worms each). Quantification of different developmental stages of N2 (C), ire-1(v33) (D), xbp-1(tm2482) (E), atf-6(ok551) (F), and pek-1(ok275) (G) animals on various concentrations of DTT on E. coli OP50 diet. The ire-1(v33) animals were grown for 84 hr while all other animals were grown for 72 hr at 20°C (n = 3 biological replicates; animals per condition per replicate >80). Quantification of development of N2 (H), ire-1(v33) (I), and xbp-1(tm2482) (J) animals on E. coli OP50 plates containing 0, 5, and 5 mM DTT supplemented with 50 nM vitamin B12, 10 mM DTT, and 10 mM DTT supplemented with 50 nM vitamin B12 (n = 3 biological replicates; animals per condition per replicate >80).
-
Figure 6—source data 1
High levels of dithiothreitol (DTT) cause toxicity via the methionine–homocysteine cycle and ER proteotoxic stress.
- https://cdn.elifesciences.org/articles/76021/elife-76021-fig6-data1-v2.xlsx
Figure 6—figure supplement 1

The ATF-6 and PEK-1 pathways are not involved in combating dithiothreitol (DTT) toxicity.
(A) Representative fluorescence images of hsp-4p::GFP animals grown on E. coli OP50 diet containing 0 mM DTT until the young adult stage, followed by incubation on E. coli OP50 diet containing 0, 5, and 10 mM DTT for 24 hr. Scale bar = 200 µm. (B) Quantification of GFP levels of hsp-4p::GFP animals grown on E. coli OP50 diet containing 0 mM DTT until the young adult stage, followed by incubation on E. coli OP50 diet containing 0, 5, and 10 mM DTT for 24 hr. The 0 and 10 mM DTT data are the same as in Figure 6B. ***p < 0.001 and **p < 0.01 via the t-test (n = 16 worms each). (C) Representative images of N2, atf-6(ok551), and pek-1(ok275) animals on E. coli OP50 plates containing 0, 5, 5 mM DTT supplemented with 50 nM vitamin B12, 10 mM DTT, and 10 mM DTT supplemented with 50 nM vitamin B12. Scale bar = 1 mm. Quantification of different developmental stages of N2 (D), atf-6(ok551) (E), and pek-1(ok275) (F) animals on E. coli OP50 plates containing 0, 5, and 5 mM DTT supplemented with 50 nM vitamin B12, 10 mM DTT, and 10 mM DTT supplemented with 50 nM vitamin B12 (n = 3 biological replicates; animals per condition per replicate >80).
-
Figure 6—figure supplement 1—source data 1
The ATF-6 and PEK-1 pathways are not involved in combating dithiothreitol (DTT) toxicity.
- https://cdn.elifesciences.org/articles/76021/elife-76021-fig6-figsupp1-data1-v2.xlsx
Figure 6—figure supplement 2
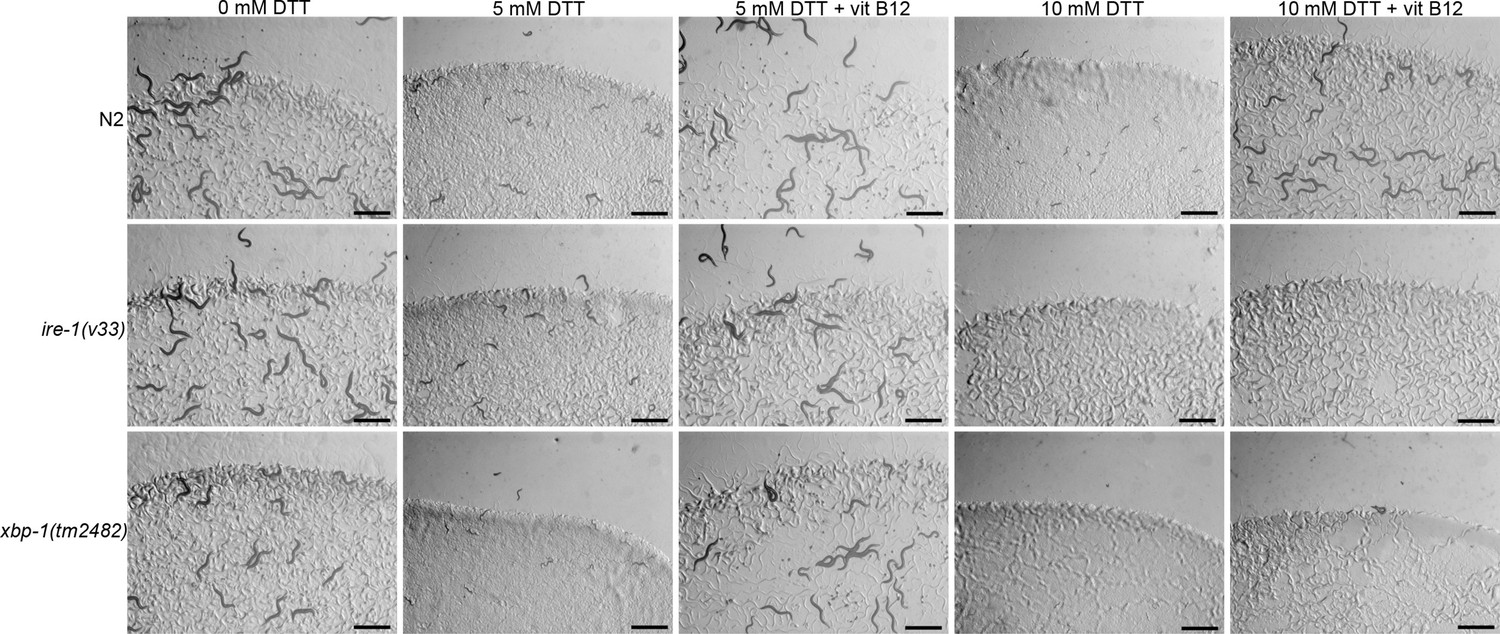
Counteracting high, but not low, levels of dithiothreitol (DTT) requires a functional IRE-1/XBP-1 unfolded protein response (UPR) pathway.
Representative images of N2, ire-1(v33), and xbp-1(tm2482) animals on E. coli OP50 plates containing 0, 5, and 5 mM DTT supplemented with 50 nM vitamin B12, 10 mM DTT, and 10 mM DTT supplemented with 50 nM vitamin B12. Scale bar = 1 mm.
Figure 7
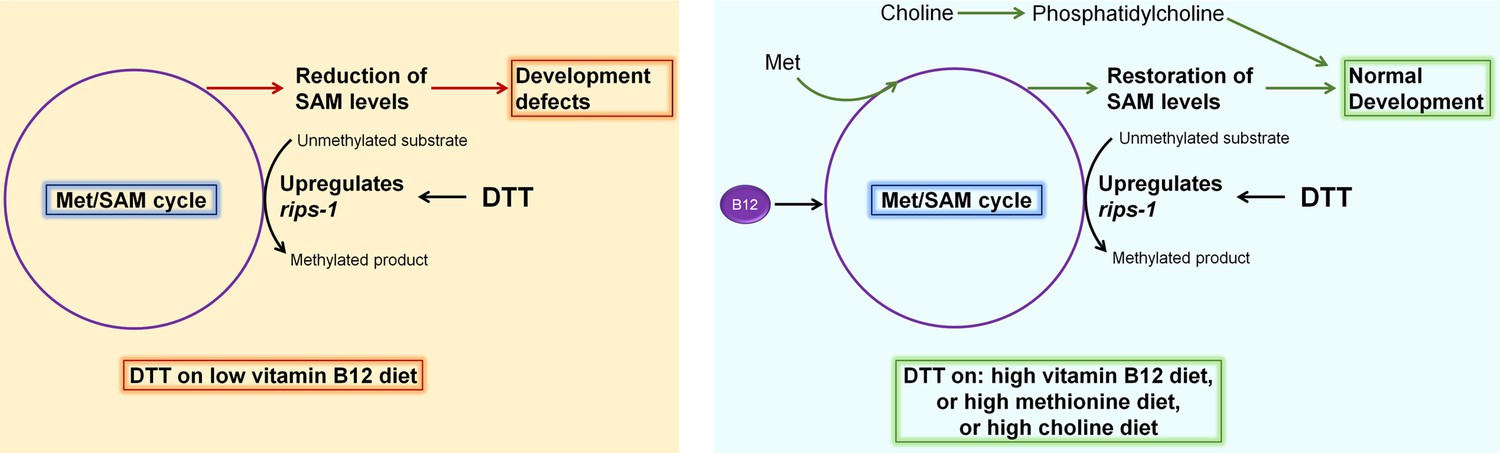
Model for dithiothreitol (DTT) toxicity via the methionine–homocysteine cycle.
DTT causes upregulation of the S-adenosylmethionine (SAM)-dependent methyltransferase gene rips-1. On low vitamin B12 diet, DTT leads to the depletion of SAM that results in toxicity. Supplementation of vitamin B12 and methionine attenuates DTT toxicity by restoring SAM levels. Supplementation of choline also rescues DTT toxicity by repleting phosphatidylcholine via an SAM-independent pathway.
Tables
Key resources table
| Reagent type (species) or resource | Designation | Source or reference | Identifiers | Additional information |
|---|---|---|---|---|
| Strain, strain background (Escherichia coli) | OP50 | CaenorhabditisGenetics Center (CGC) | OP50 | |
| Strain, strain background (E. coli) | HT115 | Source BioScience | HT115 | |
| Strain, strain background (P. aeruginosa) | PA14 gacA | Meta Kuehn laboratory | PA14 gacA | |
| Strain, strain background (Comamonas aquatica) | C. aquatica DA1877 | CGC | DA1877 | |
| Strain, strain background (Serratia marcescens) | S. marcescens Db11 | CGC | Db11 | |
| Strain, strain background (Salmonella enterica serovar Typhimurium 1344) | S. enterica | Frederick M. Ausubel laboratory | Typhimurium 1344 | |
| Strain, strain background (Caenorhabditis elegans) | N2 Bristol | CGC | N2 | |
| Strain, strain background (C. elegans) | wwIs24 [acdh-1p::GFP + unc-119(+)] | CGC | VL749 | |
| Strain, strain background (C. elegans) | metr-1(ok521) | CGC | RB755 | |
| Strain, strain background (C. elegans) | mmcm-1(ok1637) | CGC | RB1434 | |
| Strain, strain background (C. elegans) | sams-1(ok2946) | CGC | VC2428 | |
| Strain, strain background (C. elegans) | ire-1(v33) | CGC | RE666 | |
| Strain, strain background (C. elegans) | atf-6(ok551) | CGC | RB772 | |
| Strain, strain background (C. elegans) | pek-1(ok275) | CGC | RB545 | |
| Strain, strain background (C. elegans) | zcIs13 [hsp-6p::GFP + lin-15(+)] | CGC | SJ4100 | |
| Strain, strain background (C. elegans) | zcIs4 [hsp-4::GFP] | CGC | SJ4005 | |
| Strain, strain background (C. elegans) | rips-1(gk231506) | CGC | VC20288 | |
| Strain, strain background (C. elegans) | xbp-1(tm2482) | National Bioresource Project, Japan | xbp-1(tm2482) | |
| Strain, strain background (C. elegans) | rips-1(jsn1) | This study | JSJ1 | Materials and methods |
| Strain, strain background (C. elegans) | rips-1(jsn2) | This study | JSJ2 | Materials and methods |
| Strain, strain background (C. elegans) | rips-1(jsn3) | This study | JSJ3 | Materials and methods |
| Strain, strain background (C. elegans) | rips-1(jsn4) | This study | JSJ4 | Materials and methods |
| Strain, strain background (C. elegans) | rips-1(jsn5) | This study | JSJ5 | Materials and methods |
| Strain, strain background (C. elegans) | rips-1(jsn6) | This study | JSJ6 | Materials and methods |
| Strain, strain background (C. elegans) | rips-1(jsn7) | This study | JSJ7 | Materials and methods |
| Strain, strain background (C. elegans) | rips-1(jsn8) | This study | JSJ8 | Materials and methods |
| Strain, strain background (C. elegans) | rips-1(jsn9) | This study | JSJ9 | Materials and methods |
| Strain, strain background (C. elegans) | rips-1(jsn10) | This study | JSJ10 | Materials and methods |
| Strain, strain background (C. elegans) | rips-1(jsn11) | This study | JSJ11 | Materials and methods |
| Strain, strain background (C. elegans) | rips-1(jsn12) | This study | JSJ12 | Materials and methods |
| Strain, strain background (C. elegans) | jsnIs1[rips-1p::GFP + myo-2p::mCherry] | This study | JSJ13 | Materials and methods |
| Strain, strain background (C. elegans) | rips-1(jsn11);jsnEx1 [rips-1p::rips-1::SL2::GFP + myo-2p::mCherry] | This study | Materials and methods | |
| Strain, strain background (C. elegans) | rips-1(jsn11);jsnEx2 [rips-1p::rips-1::SL2::GFP + myo-2p::mCherry] | This study | Materials and methods | |
| Strain, strain background (C. elegans) | jsnEx1 [rips-1p::rips-1::SL2::GFP + myo-2p::mCherry] | This study | Materials and methods | |
| Recombinant DNA reagent | rips-1p::rips-1::SL2::GFP (plasmid) | This study | Materials and methods | |
| Recombinant DNA reagent | rips-1p::GFP (plasmid) | This study | Materials and methods | |
| Sequence-based reagent | Pan-act_qPCR_F | This study | qPCR primers | TCGGTATGGGACAGAAGGAC |
| Sequence-based reagent | Pan-act_qPCR_R | This study | qPCR primers | CATCCCAGTTGGTGACGATA |
| Sequence-based reagent | R08E5.1_qPCR_F | This study | qPCR primers | CAATGACAGGGCCAACATGG |
| Sequence-based reagent | R08E5.1_qPCR_R | This study | qPCR primers | GCAGTATACAACACATTTAGGGGA |
| Sequence-based reagent | rips-1_qPCR_F | This study | qPCR primers | ACAACACGTGGACAACGGTAT |
| Sequence-based reagent | rips-1_qPCR_R | This study | qPCR primers | TTGCTGACGGCGAGGTTAAA |
| Sequence-based reagent | R08F11.4_qPCR_F | This study | qPCR primers | AGACCTACGGGAAGATGGCT |
| Sequence-based reagent | R08F11.4_qPCR_R | This study | qPCR primers | CGCAACATAGTGCATCTGGC |
| Sequence-based reagent | K12D9.1_qPCR_F | This study | qPCR primers | CCGATGGATCCGACTTCCAG |
| Sequence-based reagent | K12D9.1_qPCR_R | This study | qPCR primers | TCGAAGCAACCAGTCCAGTC |
| Sequence-based reagent | rips-1_promoter_F | This study | PCR primers (Cloning) | AAGGTCGACCATTGCTTACTGCTAGGTTCT |
| Sequence-based reagent | rips-1_promoter_R | This study | PCR primers (Cloning) | AGCGGATCCAGTGATCAATTGAACATACAC |
| Sequence-based reagent | rips-1_gene_R | This study | PCR primers (Cloning) | AGTGGATCCCTAATTTTTCTGGGCACAATAC |
| Software, algorithm | GraphPad Prism 8 | GraphPad Software | RRID:SCR_002798 | https://www.graphpad.com/scientificsoftware/prism/ |
| Software, algorithm | Photoshop CS5 | Adobe | RRID:SCR_014199 | https://www.adobe.com/products/photoshop.html |
| Software, algorithm | ImageJ | NIH | RRID:SCR_003070 | https://imagej.nih.gov/ij/ |
Additional files
Download links
A two-part list of links to download the article, or parts of the article, in various formats.
Downloads (link to download the article as PDF)
Open citations (links to open the citations from this article in various online reference manager services)
Cite this article (links to download the citations from this article in formats compatible with various reference manager tools)
Dithiothreitol causes toxicity in C. elegans by modulating the methionine–homocysteine cycle
eLife 11:e76021.
https://doi.org/10.7554/eLife.76021


