Cognitive experience alters cortical involvement in goal-directed navigation
- Department of Neurobiology, Harvard Medical School, United States
Figures
Figure 1 with 6 supplements
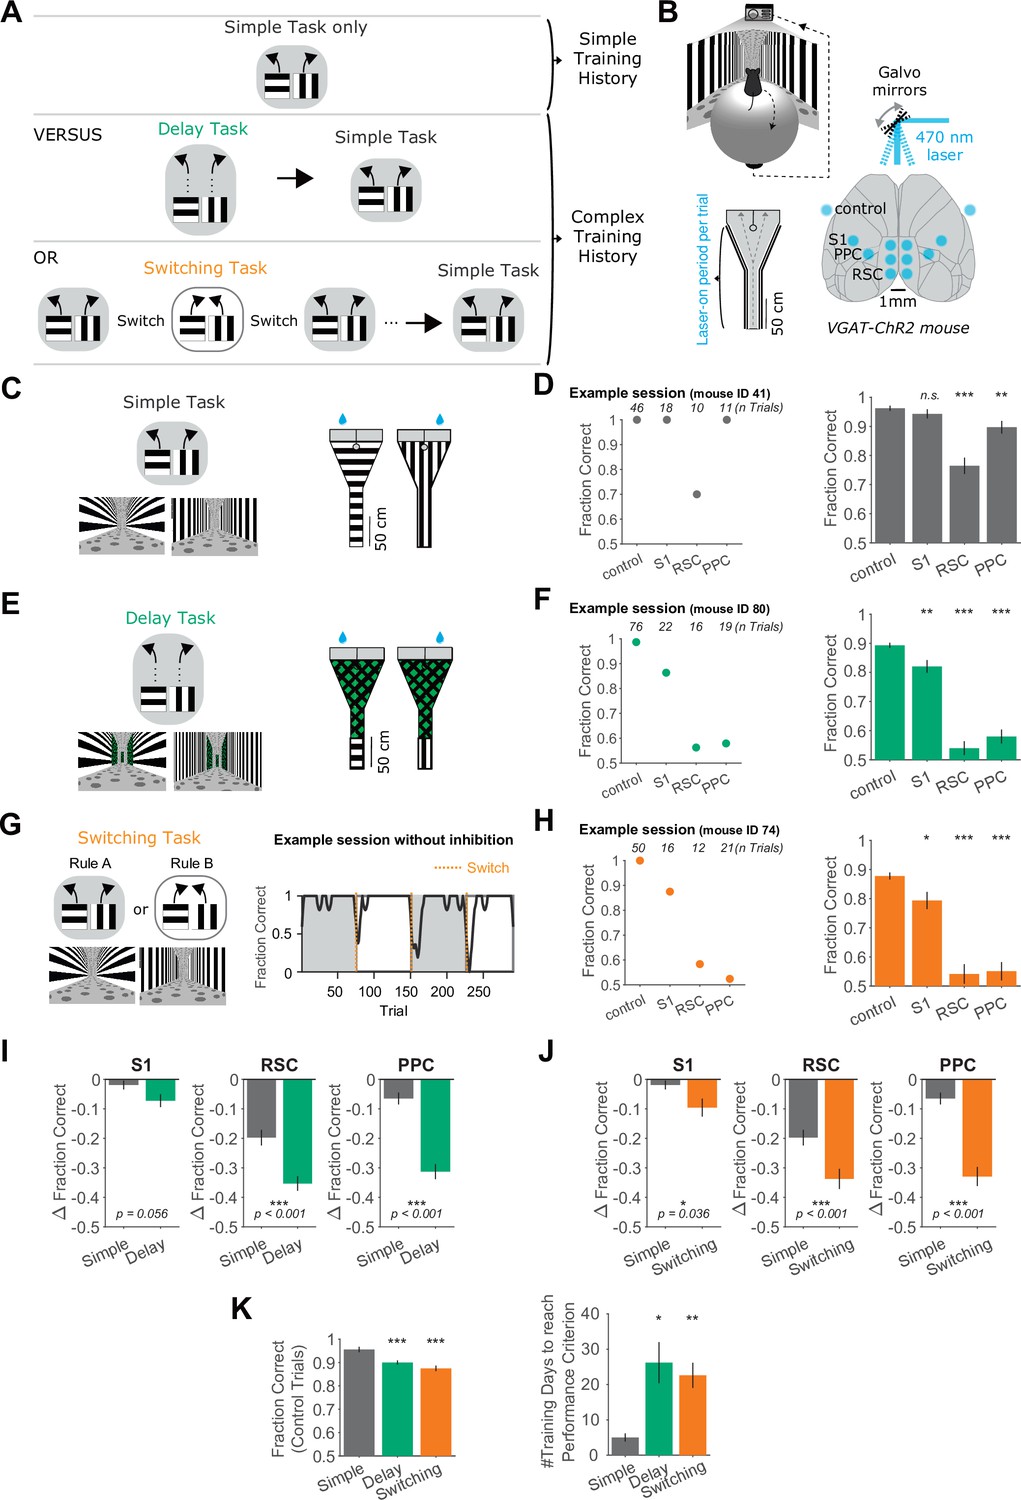
Increased necessity of cortical association areas in complex versus simple decision tasks.
(A) Schematic overview of the behavioral tasks and task training sequences used in this study. Top row: One group of mice is trained in the simple task only. Middle row: Another group of mice is trained on the delay task and then transitioned to the simple task. Bottom row: Another group of mice is trained on the switching task and then transitioned to the simple task. The middle and bottom rows indicate complex training histories. (B) Top: Schematic of virtual reality behavioral setup. Bottom right: Schematic of optogenetic inhibition with bilateral target locations. Bottom left: Top view of Y-maze. Inhibition lasted from trial onset throughout maze traversal. (C) Left: Simple task schematic indicating two trial types (horizontal or vertical cues) and corresponding rewarded navigation decisions (running left or right). Corresponding VR screenshots at the trial start are below. Right: Top view of the two maze schematics. Water drops indicate hidden reward locations. (D) Left: Example session in the simple task showing mean performance for each inhibited location. Right: Performance in the simple task for each inhibited location across 45 sessions from 4 mice. Bars indicate mean ± standard error of the mean (SEM) of a bootstrap distribution of the mean. S1 p = 0.84; RSC p < 0.001; PPC p = 0.006; from bootstrapped distributions of ΔFraction Correct (difference from control performance) compared to 0, two-tailed test, α = 0.05 plus Bonferroni correction. *: p < 0.05; **: p < 0.01; ***: p < 0.001. Sessions per mouse: 11 ± 2. Trials per session: 53 ± 23 (control), 19 ± 8 (S1), 18 ± 9 (RSC), 20 ± 9 (PPC), mean ± standard deviation (SD). (E) Similar to (C), but for the delay task. (F) Similar to (D), but for the delay task. Sixty-two sessions from 7 mice. S1 p = 0.006; RSC p < 0.001; PPC p < 0.001. Sessions per mouse: 9 ± 4. Trials per session: 60 ± 15 (control), 16 ± 6 (S1), 15 ± 4 (RSC), 17 ± 5 (PPC), mean ± SD. (G) Left: Schematic of the switching task, utilizing the identical mazes as the simple task. The cue–choice associations from the simple task (Rule A) were switched within a session (to Rule B). Right: Behavioral performance from an example session. Dotted orange lines indicate rule switches. (H) Similar to (D), but for the switching task, Rule A trials only. 89 sessions from 6 mice. S1 p = 0.036; RSC p < 0.001; PPC p < 0.001. Sessions per mouse: 15 ± 5. Trials per session: 26 ± 9 (control), 8 ± 3 (S1), 7 ± 4 (RSC), 8 ± 3 (PPC), mean ± SD. (I) Comparison of inhibition effects (ΔFraction Correct) in the simple and the delay tasks for each cortical inhibition location. Bars indicate mean ± SEM of a bootstrap distribution of the mean; two-tailed comparisons of bootstrapped ΔFraction Correct distributions, α = 0.05. *: p < 0.05; **: p < 0.01; ***: p < 0.001. Same datasets as in (F, G). (J) Similar to (I), but for the simple versus switching task (Rule A trials only). Same datasets as in (F, H). The simple task data are the same as in (I). (K) Left: Comparison of performance on control trials across tasks, using only the first two laser-on blocks in each session. Bars indicate mean ± SEM of a bootstrap distribution of the mean. Delay versus simple p < 0.001; switching versus simple p < 0.001; two-tailed comparisons of bootstrapped Fraction Correct distributions, α = 0.05. *** p < 0.001. Right: The number of training sessions needed to reach performance criteria across tasks (Methods). Bars indicate mean ± SEM across mice, n = 4 for simple task, n = 5 for delay task, n = 6 for switching task. Both delay and switching task data were compared to the simple task data using an unpaired two-sided t-test. Delay versus simple p = 0.015; switching versus simple p = 0.006. *: p < 0.05, **: p < 0.01.
Figure 1—figure supplement 1
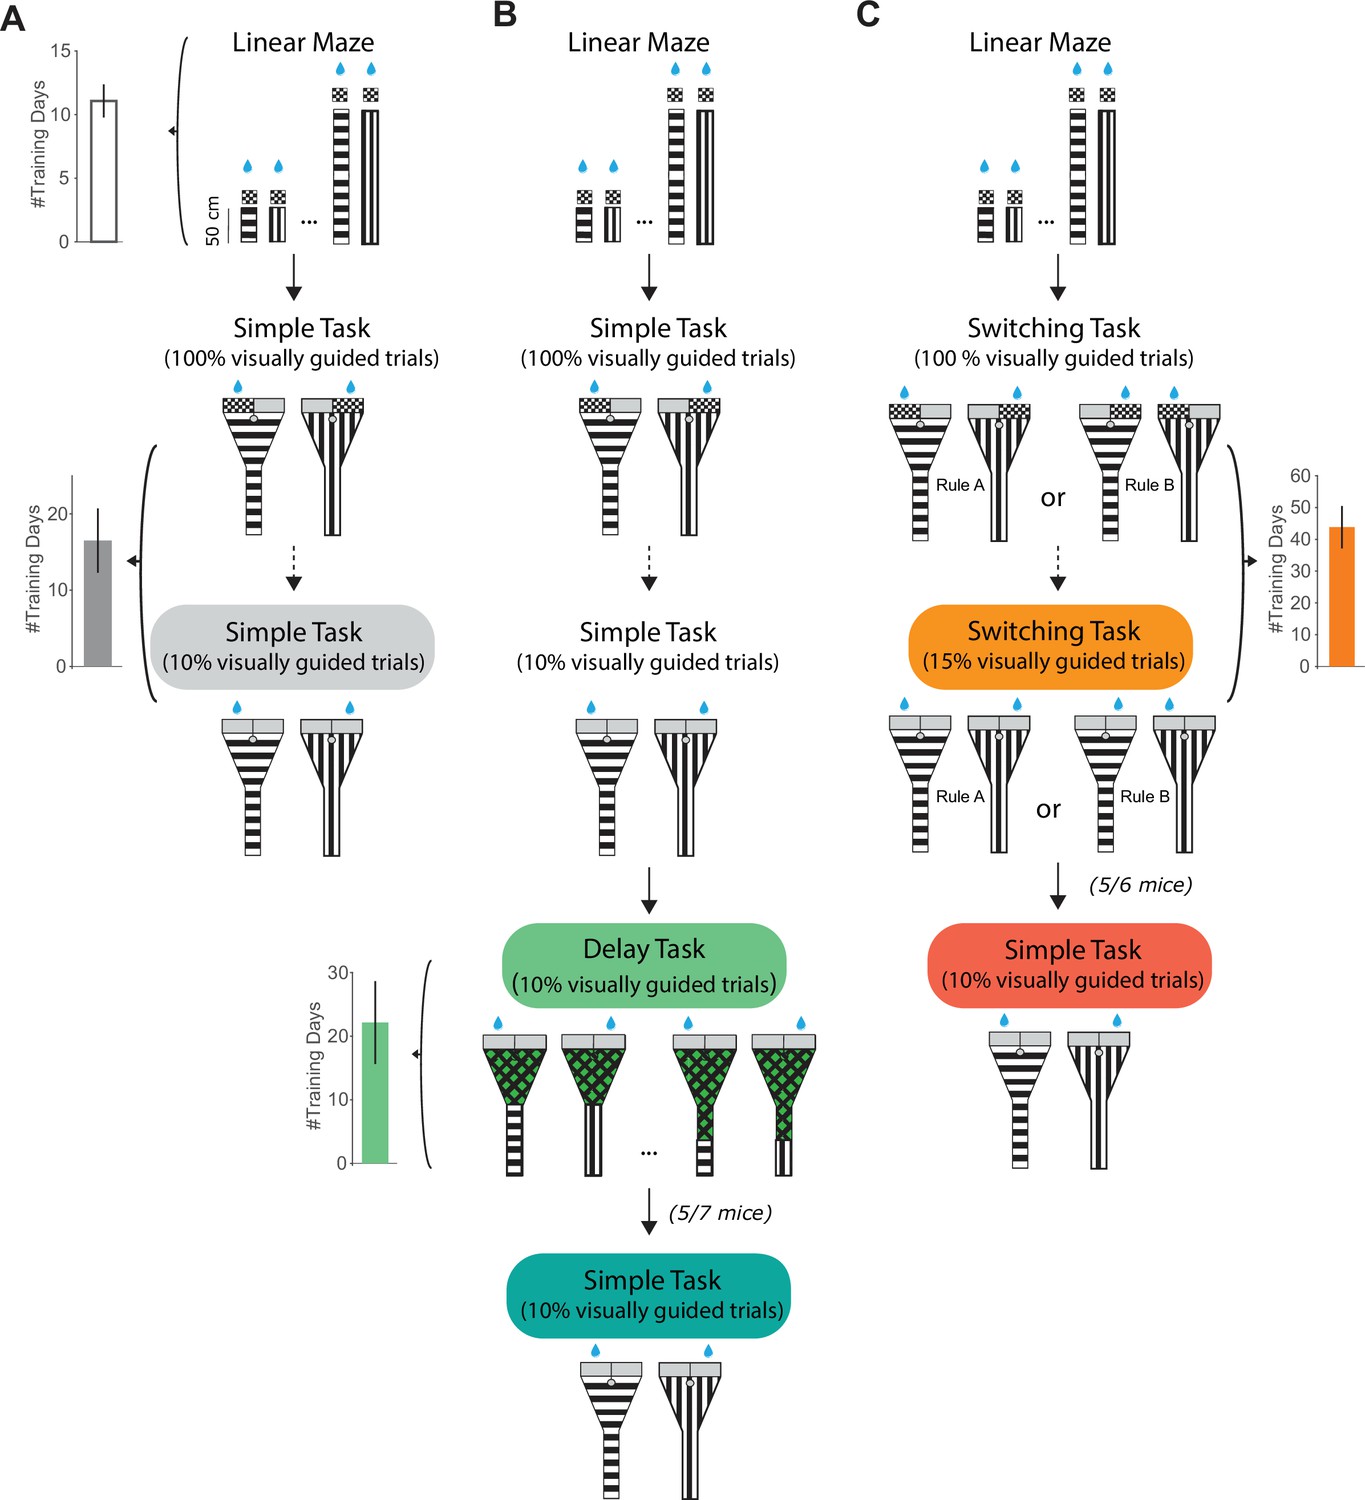
Behavioral training stages and task transitions.
(A) Behavioral training stages for mice trained on the simple task only. Top: In the initial training stage, to get used to running in the virtual environment, mice learned to run down a linear maze toward a checkerboard pattern to obtain a reward. Linear maze length was gradually increased across sessions. Left: The number of days spent in this training stage across mice and tasks (including mice from (B) (top) and (C) (top)). Error bars indicate mean ± standard error of the mean (SEM) across 13 mice. Middle: The second training stage was the simple task with 100% visually guided trials, meaning the correct choice to be made in each trial was indicated with a checkerboard pattern at the left or right maze end depending on the visual cue on the maze walls. Across sessions, the fraction of visually guided trials was gradually decreased (dotted arrow), until only 10% of trials were visually guided in the full simple task (bottom). Left: The number of training days that mice were trained on the simple task, regardless of the fraction of visually guided trials (mean ± SEM across 4 mice). Note that the number of training days is the overall number of days mice were run on the simple task prior to photoinhibition sessions, including sessions after they had reached high simple task performance levels. (B) Similar to (A), but for mice trained on the delay task. The first three training stages are the same as in (A). After full simple task training, mice were moved to the delay task. In this stage, the delay was gradually increased, and the visual cue was shortened across sessions. Left: The number of days spent on the delay stage (mean ± SEM across seven mice). Bottom: After delay task training and photoinhibition, five out of seven mice were transitioned to the simple task (see Figure 2). (C) Similar to (A), but for mice trained on the switching task. After initial linear maze training, the second training stage was the switching task with 100% visually guided trials. The fraction of visually guided trials was gradually decreased across sessions (dotted arrow). Right: The number of training days that mice were trained on the switching task, regardless of the fraction of visually guided trials (mean ± SEM across six mice). Bottom: After switching task training and photoinhibition, five out of six mice were transitioned to the simple task (see Figure 3).
Figure 1—figure supplement 2
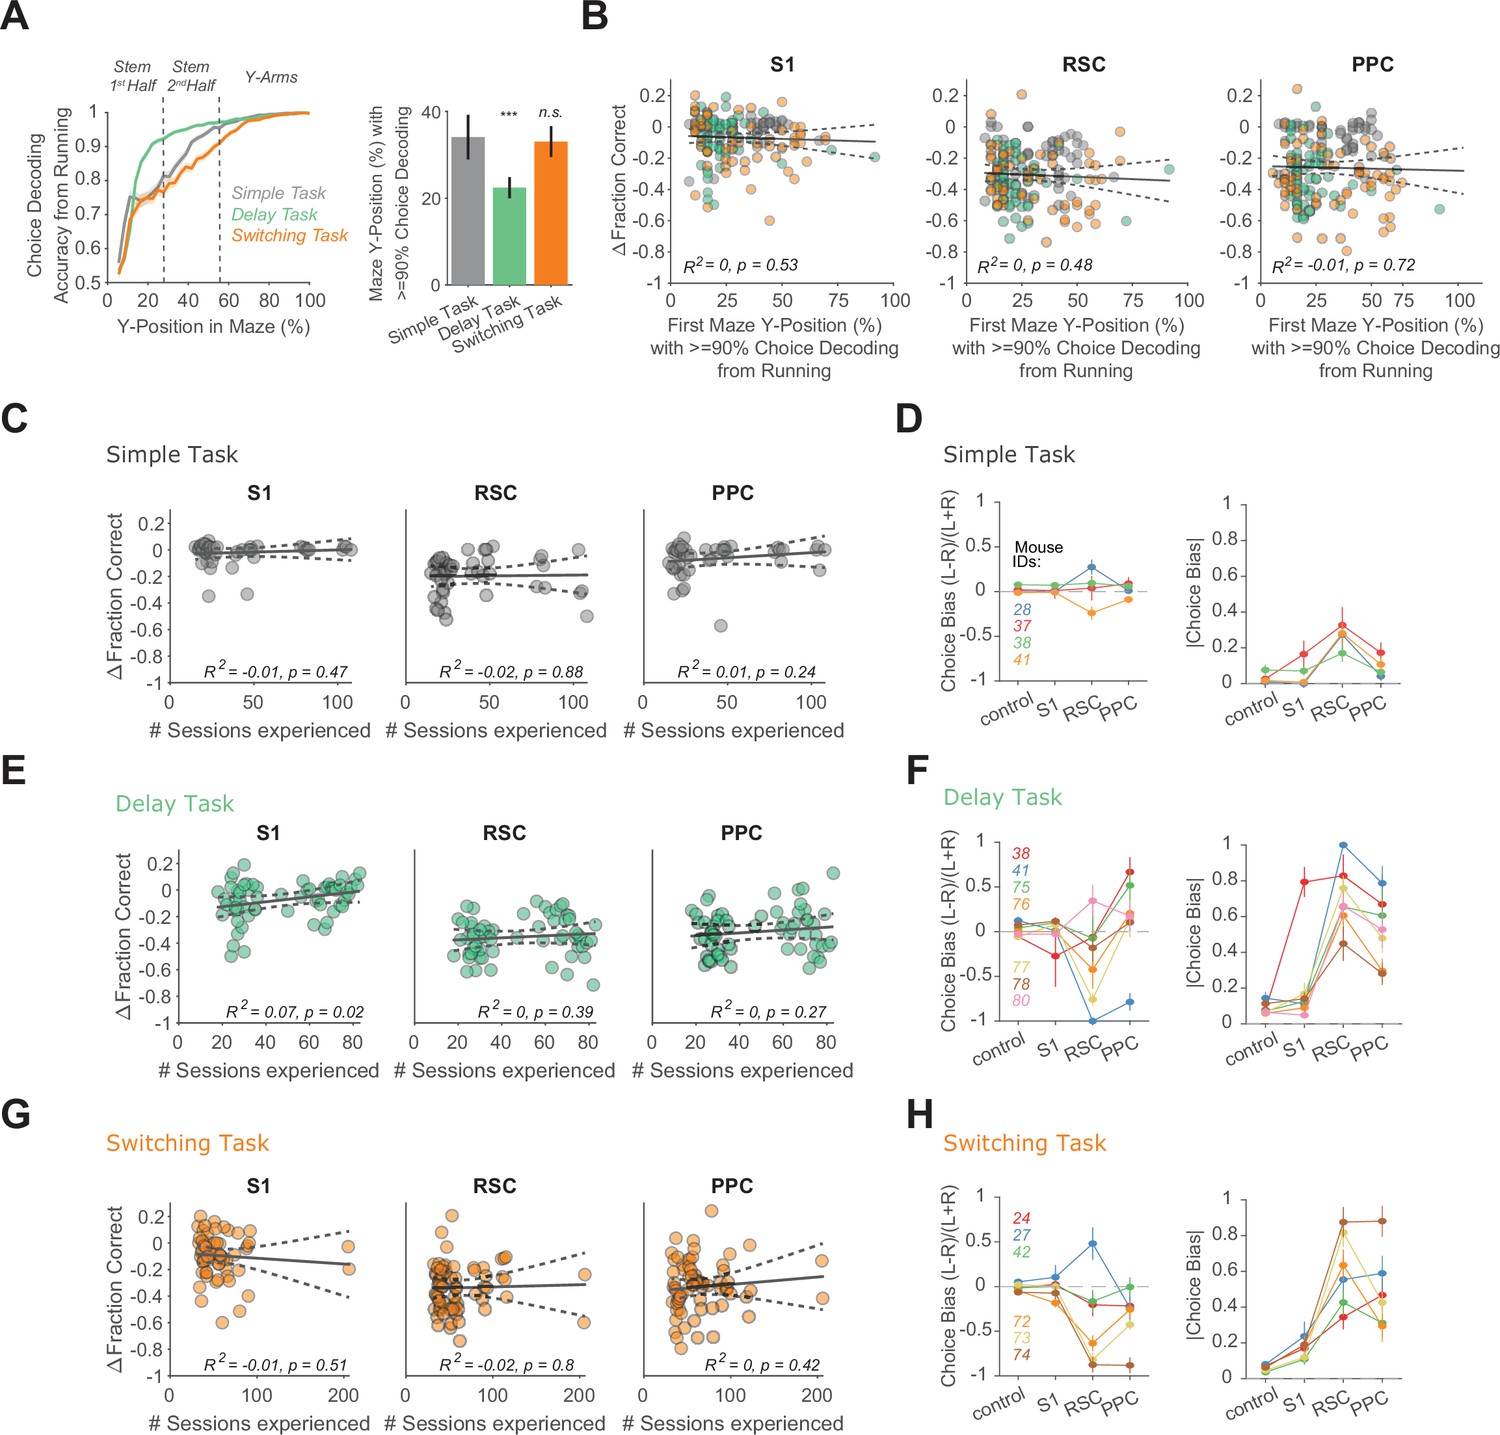
Choice decoding from running, stability of inhibition effects and choice biases from inhibition across tasks.
(A) Left: Decoding accuracy of the reported choice using instantaneous treadmill velocities and lateral position, binned along the maze’s long axis (5 cm bins) per task, using control trials only. Shading indicates mean ± standard error of the mean (SEM) across sessions. Dashed lines indicate the different maze segments. In the delay task, the choice-informative cue was only present in the first maze segment (stem first half). Right: First maze position (as a fraction of the maze long axis) at which decoding of choice exceeded 90%, approximating decision points in the maze. Error bars indicate mean ± SEM across sessions. Compared to simple task: delay task p = 1.91 × 10−06; switching task p = 0.74; two-sample t-test with α = 0.05. Sessions per task per mouse: 11± 2 (simple, four mice), 12 ± 5 (delay, seven mice), and 15 ± 5 (switching, six mice, Rule A trials only). (B) Maze decision positions are plotted versus the inhibition effects on task performance for each cortical inhibition location. Circles indicate individual sessions color coded by task as in (A). Black line: regression line, error bars: 95% confidence intervals. N sessions overall: 166 (S1), 167 (RSC), and 175 (PPC). (C) For each cortical inhibition location, the number of experienced simple task sessions is plotted versus the inhibition effect on performance in the simple task (n = 45 sessions). Circles indicate individual sessions. Black line: regression line, error bars: 95% confidence intervals. (D) Signed choice bias (left) and unsigned choice bias (right) for each inhibited location in the simple task. Line colors indicate different mice. Error bars indicate mean ± SEM across sessions. 11 ± 2 sessions per mouse. (E) Similar to (C), but for the delay task. N = 62 sessions. (F) Similar (D), but for the delay task. 12 ± 5 sessions per mouse. (G) Similar to (C), but for the switching task. N sessions = 61 (S1), 62 (RSC), and 70 (PPC). (H) Similar to (D), but for the switching task. 15 ± 5 sessions per mouse.
Figure 1—figure supplement 3
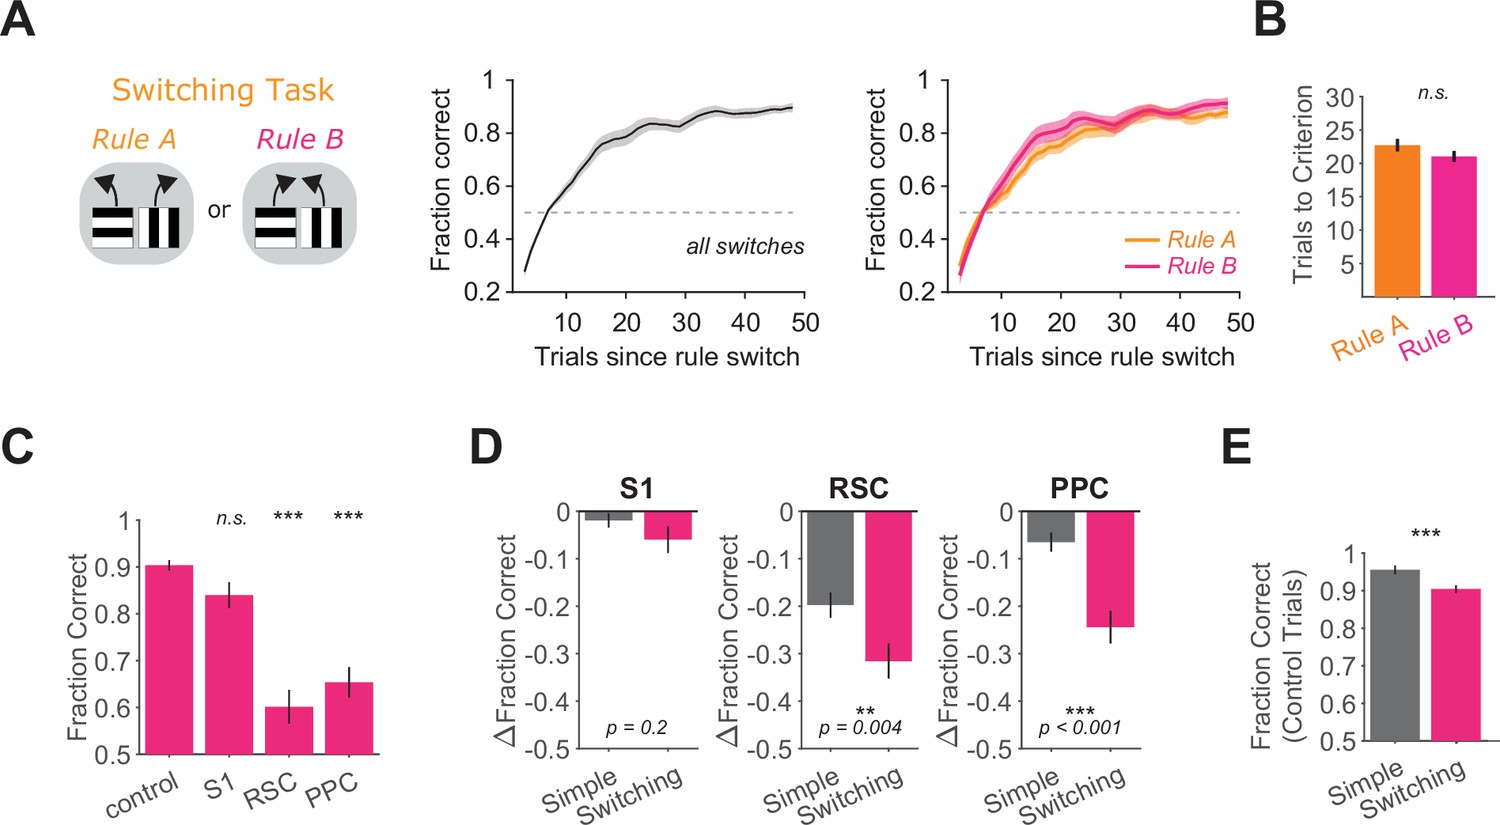
Performance after rule switches and inhibition effects in high-performance periods of Rule B in the switching task.
(A) In the switching task, behavioral performance after rule switches across rules from eight mice total (middle, switches per mouse: 23 ± 18) and separately for each rule (right, switches per mouse per rule: 11 ± 9 (mean ± standard deviation [SD])). Fraction Correct was Gaussian filtered (window of seven trials, sigma of three trials). Error bars indicate mean ± standard error of the mean (SEM) across mice. Dashed line indicates chance level. (B) Comparison of number of trials needed to reach performance criterion (Methods) after switches to Rule A versus switches to Rule B. p = 0.18, two-sample t-test, n = 91 switches to Rule A and 93 switches to Rule B across eight mice. (C) Performance in high-performance periods of Rule B in the switching task for each inhibited location across 87 sessions from 6 mice. Bars indicate mean ± SEM of a bootstrap distribution of the mean. S1 p = 0.07; RSC p < 0.001; PPC p < 0.001; from bootstrapped distributions of ΔFraction Correct (difference from control performance) compared to 0, two-tailed test, α = 0.05 plus Bonferroni correction. ***: p < 0.001. Sessions per mouse: 15 ± 5. Trials per session: 29 ± 11 (control), 5 ± 5 (S1), 6 ± 5 (RSC), 7 ± 6 (PPC), mean ± SD. (D) Comparison of inhibition effects (ΔFraction Correct) in the simple task and the switching task (Rule B trials only) for each cortical inhibition location. Bars indicate mean ± SEM of a bootstrap distribution of the mean; two-tailed comparisons of bootstrapped ΔFraction Correct distributions, α = 0.05. **: p < 0.01; ***: p < 0.001. (E) Comparison of performance on control trials in the simple task and Rule B trials of the switching task, using only the first two laser-on blocks in each session. Bars indicate mean ± SEM of a bootstrap distribution of the mean. p < 0.001; two-tailed comparison of bootstrapped Fraction Correct distributions, α = 0.05. ***: p < 0.001.
Figure 1—figure supplement 4
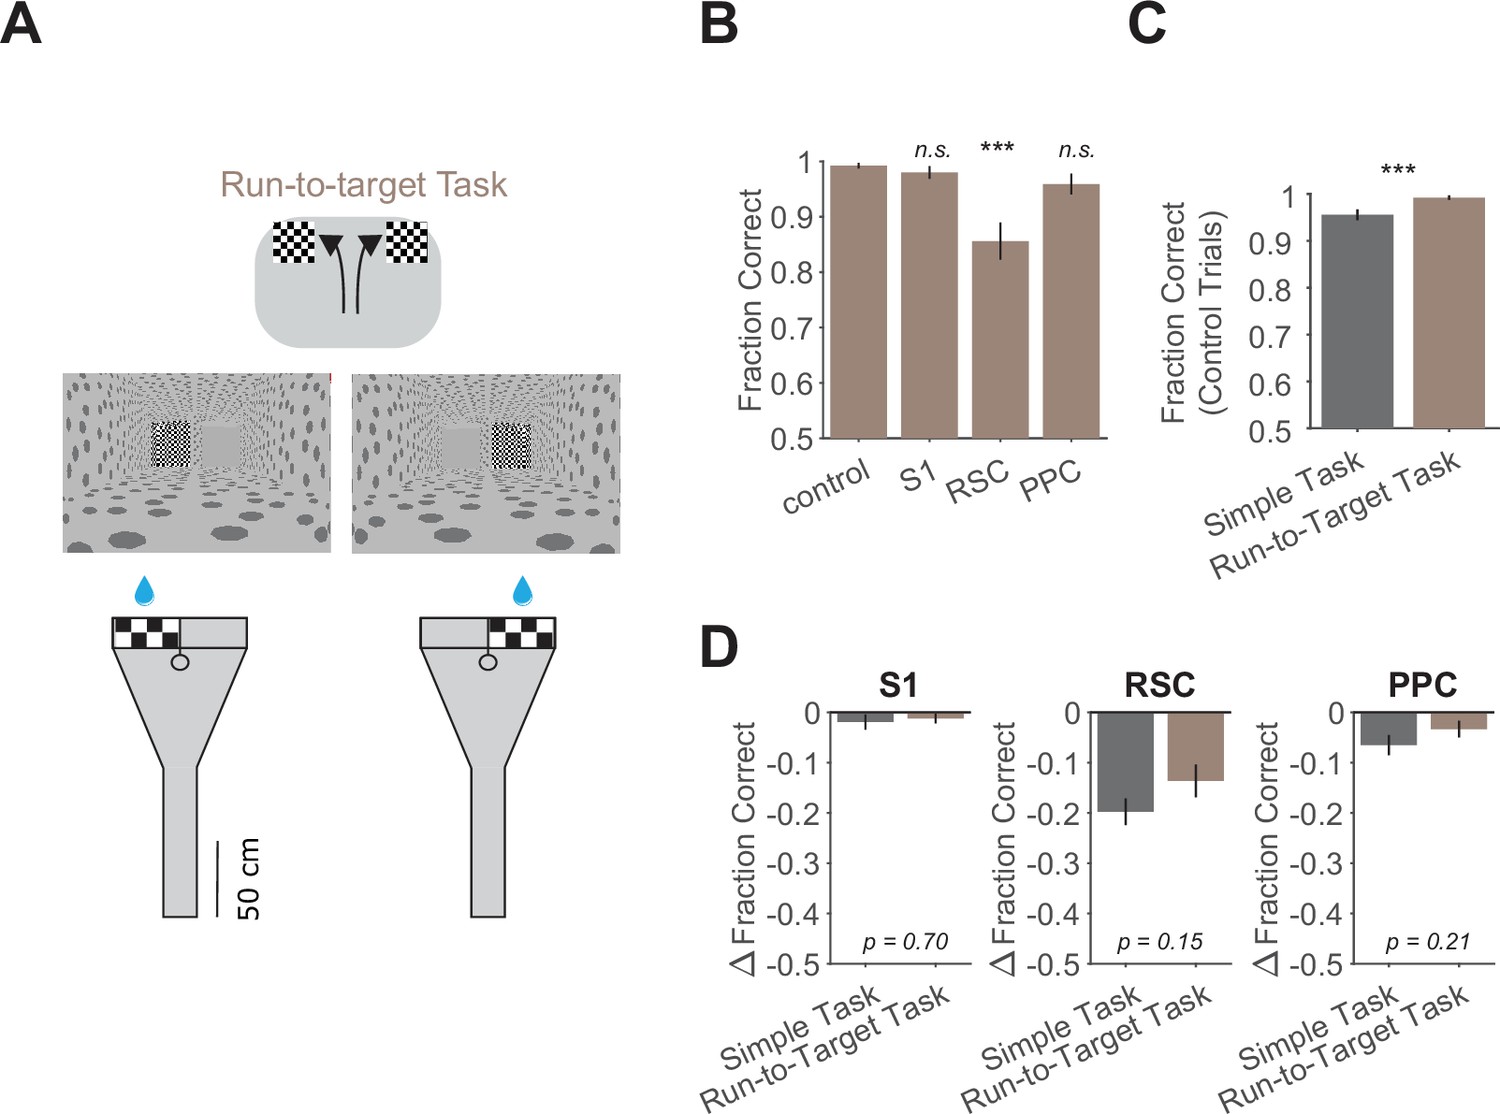
Similar deficits from inhibition in a run-to-target task as in the simple task.
(A) Schematic and virtual reality screenshots of run-to-target task showing left and right trials. (B) Performance in the run-to-target task for each inhibited location across 15 sessions from 3 mice. Bars indicate mean ± standard error of the mean (SEM) of a bootstrap distribution of the mean. S1 p = 0.85; RSC p < 0.001; PPC p = 0.16; from bootstrapped distributions of ΔFraction Correct (difference from control performance) compared to 0, two-tailed test, α = 0.05 plus Bonferroni correction. ***: p < 0.001. Sessions per mouse: 5 ± 2. Trials per session: 93 ± 11 (control), 26 ± 5 (S1), 24 ± 5 (RSC), 28 ± 6 (PPC), mean ± standard deviation (SD). (C) Comparison of performance on control trials in the simple task (same dataset as in Figure 1K) versus the run-to-target task using only the first two laser-on blocks in each session. Bars indicate mean ± SEM of a bootstrap distribution of the mean; p < 0.001, two-tailed comparison of bootstrapped Fraction Correct distributions, α = 0.05. ***: p < 0.001. Trials per session: 51 ± 23 (simple task), 93 ± 11 (run-to-target task), mean ± SD. (D) Comparison of inhibition effects (ΔFraction Correct) in the simple task (same dataset as in Figure 1F) and the run-to-target task for each cortical inhibition location. Bars indicate mean ± SEM of a bootstrap distribution of the mean; two-tailed comparisons of bootstrapped ΔFraction Correct distributions, α = 0.05.
Figure 1—figure supplement 5
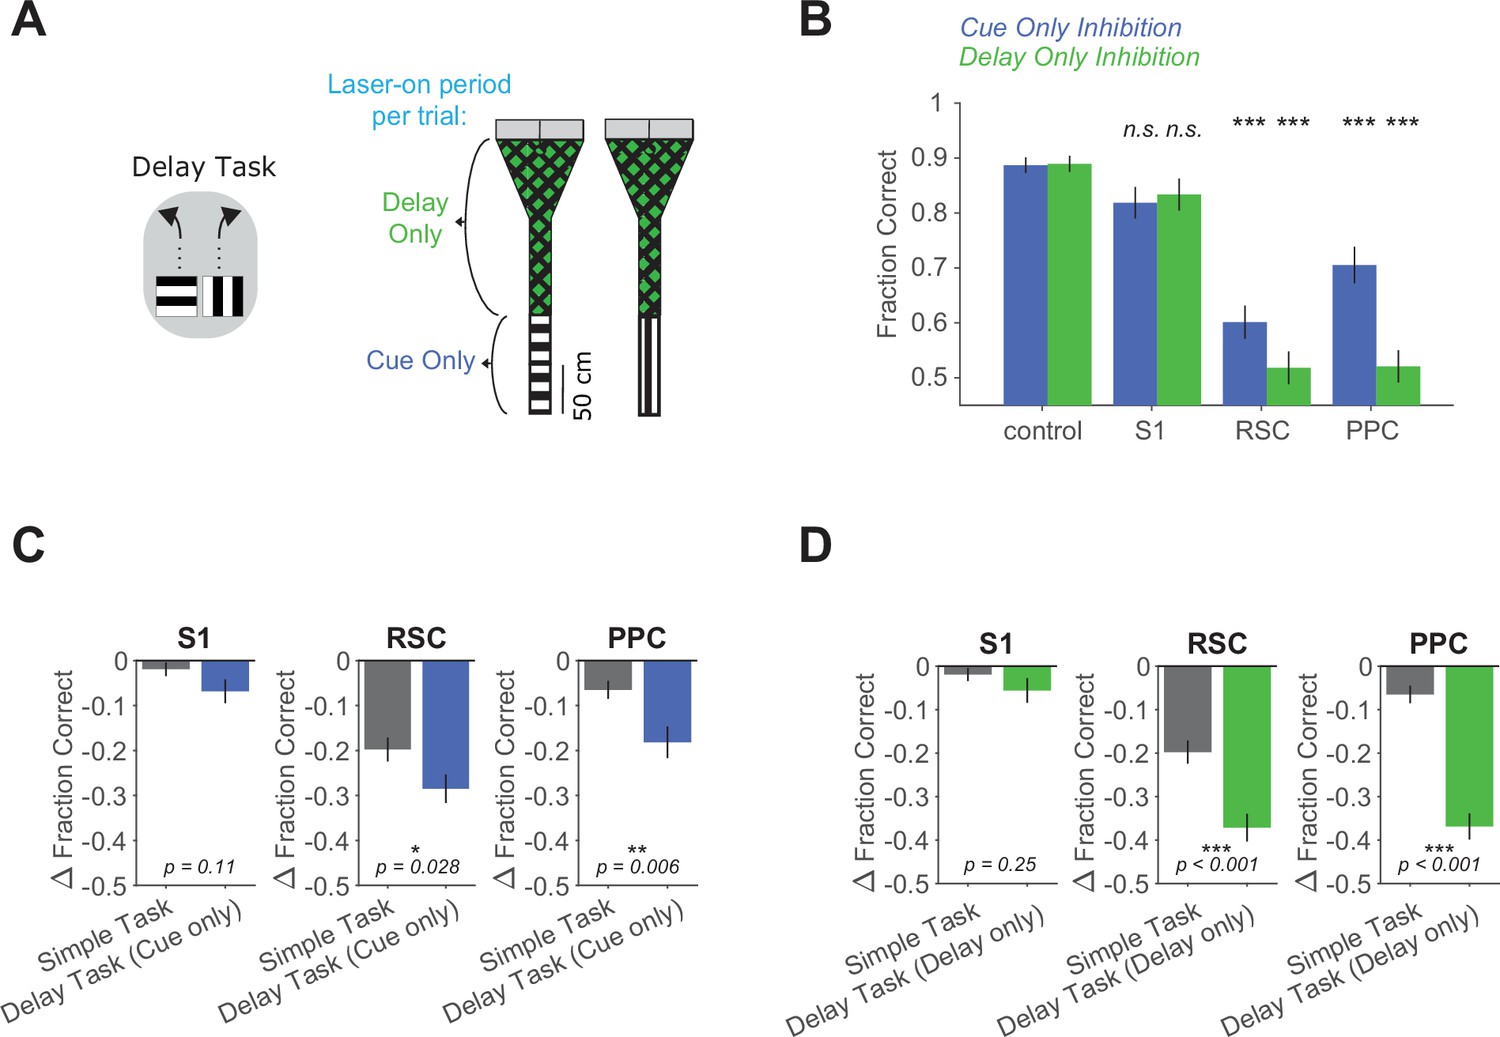
Cue only or delay only inhibition in the delay task.
(A) Left: Schematic of the delay task. Right: Inhibition was restricted to either the cue period only or the delay period only in a given session. (B) Performance in the delay task with cue only (blue, 48 sessions from 5 mice) or delay only (green, 45 sessions from 5 mice) inhibition for each inhibited location. Bars indicate mean ± standard error of the mean (SEM) of a bootstrap distribution of the mean. For cue only or delay only inhibition individually, inhibition performance was compared to control performance, two-tailed test, α = 0.05 plus Bonferroni correction. Cue only: S1 p = 0.09; RSC p < 0.001; PPC p < 0.001. Sessions per mouse: 10 ± 2. Trials per session: 59 ± 16 (control), 14 ± 6 (S1), 14 ± 5 (RSC), 15 ± 5 (PPC), mean ± standard deviation (SD). Delay only: S1 p = 0.27; RSC p < 0.001; PPC p < 0.001. Sessions per mouse: 9 ± 2. Trials per session: 61 ± 15 (control), 14 ± 5 (S1), 15 ± 4 (RSC), 15 ± 5 (PPC), mean ± SD. (C) Comparison of inhibition effects (ΔFraction Correct) in the simple task (same dataset as in Figure 1F) and the delay task with cue inhibition only for each cortical location. Bars indicate mean ± SEM of a bootstrap distribution of the mean; two-tailed comparisons of bootstrapped ΔFraction Correct distributions, α = 0.05. (D) Similar to (C), but for delay inhibition only in the delay task.
Figure 1—figure supplement 6
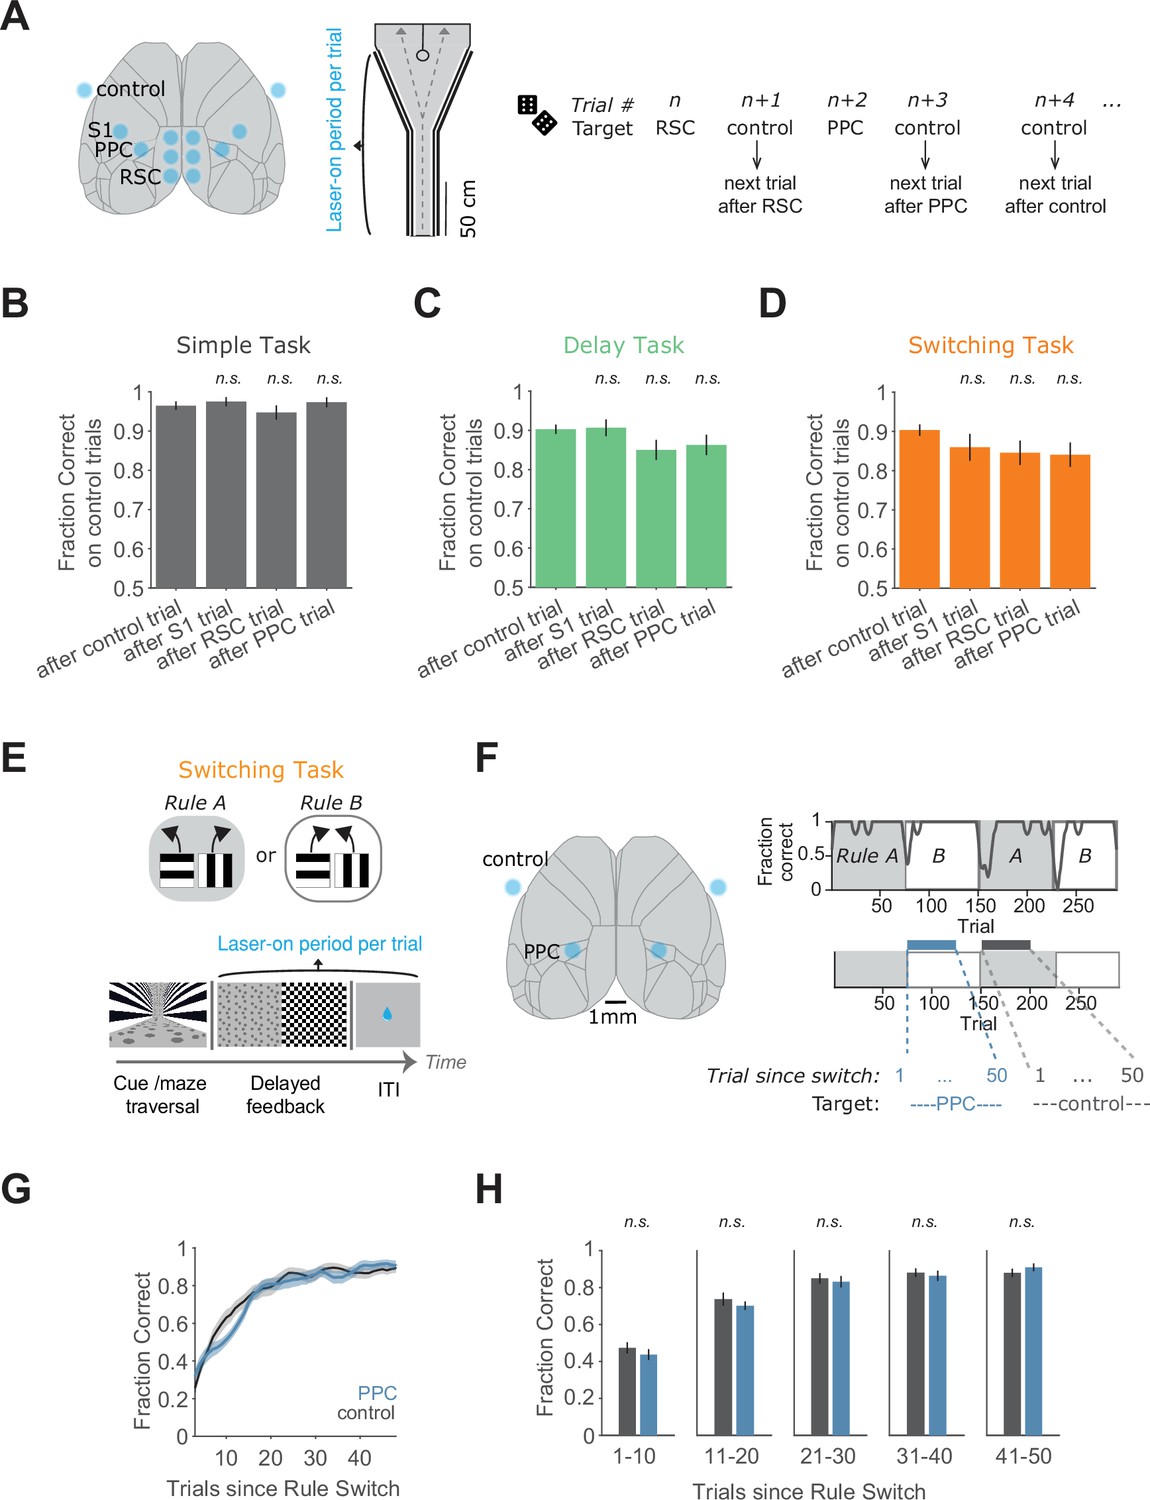
Performance on trials following inhibition and rule switching with inhibition during the feedback/ITI period.
(A) Left: Schematic of the inhibition locations (same as in Figure 1). Middle: Inhibition lasted from trial onset throughout maze traversal. Right: As in Figure 1, inhibition target locations per trial were randomly interleaved. Analysis here used performance on control trials that directly followed inhibition of the labeled location on the preceding trial. (B) Performance on control trials immediately following an inhibition trial, for the simple task, for each inhibited location across 45 sessions from 4 mice. Bars indicate mean ± standard error of the mean (SEM) of a bootstrap distribution of the mean. S1 p = 1; RSC p = 1; PPC p = 1; from bootstrapped distributions of ΔFraction Correct (difference from control performance) compared to 0, two-tailed test, α = 0.05 plus Bonferroni correction. Sessions per mouse: 11 ± 2. Trials per session: 22 ± 12 (control), 8 ± 3 (S1), 8 ± 4 (RSC), 9 ± 4 (PPC), mean ± standard deviation (SD). (C) Similar to (B), except for the delay task. Sixty-two sessions from seven mice. S1 p = 1; RSC p = 0.12; PPC p = 0.50. Sessions per mouse: 9 ± 4. Trials per session: 29 ± 8 (control), 8 ± 3 (S1), 9 ± 4 (RSC), 7 ± 3 (PPC). (D) Similar to (B), except for the switching task (Rule A trials only). 89 sessions from 6 mice. S1 p = 0.66; RSC p = 0.27; PPC p = 0.19. Sessions per mouse: 15 ± 5. Trials per session: 13 ± 6 (control), 4 ± 2 (S1), 5 ± 2 (RSC), and 4 ± 2 (PPC). (E) Top: Schematic of the switching task. Bottom: Schematic of a single trial with inhibition during the feedback and ITI period. (F) Left: Schematic of PPC and control targets. Right top: Example behavioral performance in one session in the switching task. Right bottom: Inhibition blocks of 50 trials started after a rule switch, with inhibition during the feedback/ITI period. The same area was targeted on every trial. (G) Average performance after a rule switch with PPC (blue) or control (black) inhibition on every trial during the feedback/ITI. Thirty-three sessions from four mice (8 ± 2 sessions per mouse, mean ± SD). Shading indicates mean ± SEM across sessions. Thin lines indicate single sessions. Fraction Correct was Gaussian filtered (window of seven trials, sigma of three trials) and smoothed again with a moving average filter of three trials for plotting. (H) Comparison of mean performance with PPC versus control inhibition after a rule switch in bins of 10 trials. Error bars indicate mean ± SEM across sessions, gray lines show single sessions (n = 33). Paired two-sided t-tests. p (trials 1–10): 0.42; p (trials 11–20): 0.43; p (trials 21–30): 0.64; p (trials 31–40): 0.66; p (trials 41–50): 0.34.
Figure 2 with 1 supplement
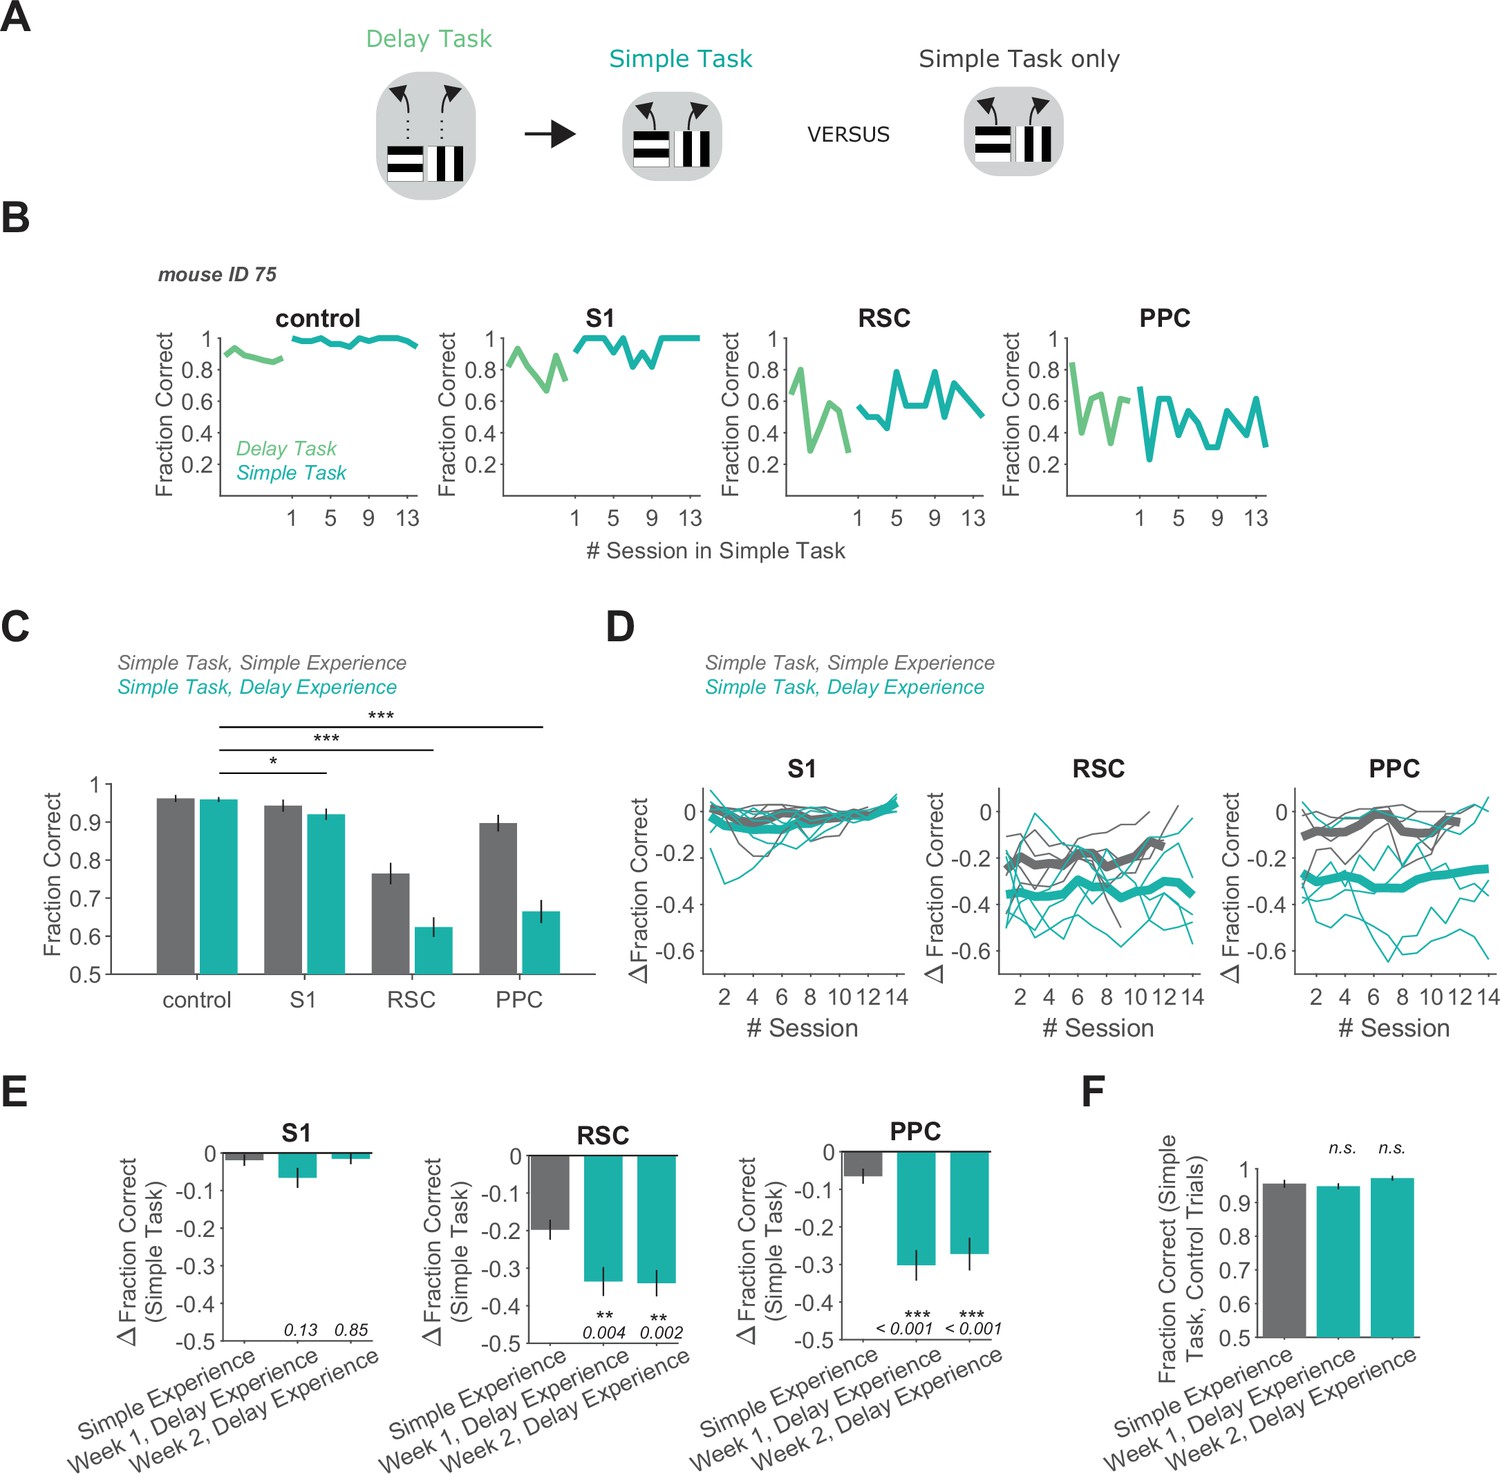
Delay task experience increases the necessity of RSC and PPC in a simple decision task.
(A) Schematic of the training history sequence. One group of mice was trained on the delay task and then permanently transitioned to the simple task. This group of mice was compared to another group trained only on the simple task. (B) Performance of an example mouse transitioned from the delay task to the simple task on control and inhibition trials. (C) Performance in the simple task for each inhibited location in mice with simple task experience only (gray, 45 sessions from 4 mice, same dataset as in Figure 1F), and in mice with previous delay task experience (blue, 70 sessions from 5 mice). Bars indicate mean ± standard error of the mean (SEM) of a bootstrap distribution of the mean. S1 p = 0.012; RSC p < 0.001; PPC p < 0.001; from bootstrapped distributions of ΔFraction Correct (difference from control performance) compared to 0, two-tailed test, α = 0.05 plus Bonferroni correction. *: p < 0.05; ***: p < 0.001. Sessions per mouse: 14. Trials per session: 53 ± 7 (control), 13 ± 3 (S1), 13 ± 2 (RSC), 14 ± 2 (PPC), mean ± standard deviation (SD). (D) Inhibition effects (ΔFraction Correct) across sessions in the simple task in mice with only simple task experience (gray), and in mice with previous delay task experience (blue), for each cortical inhibition location. Thin lines show individual mice (n = 4 with simple task experience, n = 5 with delay task experience), thick lines show average across mice. ΔFraction Correct was smoothed with a moving average filter of three sessions. (E) Comparison of inhibition effects (ΔFraction Correct) in the simple task for mice with simple task experience only (45 sessions from 4 mice) versus delay task experience 1 or 2 weeks after transition from the delay task to the simple task (35 sessions per week from 5 mice). Bars indicate mean ± SEM of a bootstrap distribution of the mean; two-tailed comparisons of bootstrapped ΔFraction Correct distributions, α = 0.05. **: p < 0.01; ***: p < 0.001. Simple experience datasets are the same as in Figure 1F and Figure 2C. (F) Comparison of performance on control trials in the simple task with simple versus delay task experience, using only the first two laser-on blocks in each session. Bars indicate mean ± SEM of a bootstrap distribution of the mean. Simple task data in week 1 (p = 0.59) and week 2 (p = 0.19) after transition from the delay task were compared to the simple task only experience data; two-tailed comparisons of bootstrapped Fraction Correct distributions, α = 0.05. Trials per session: 51 ± 23 (simple experience), 51 ± 6 (delay experience, week 1), 53 ± 3 (delay experience, week 2), mean ± SD.
Figure 2—figure supplement 1
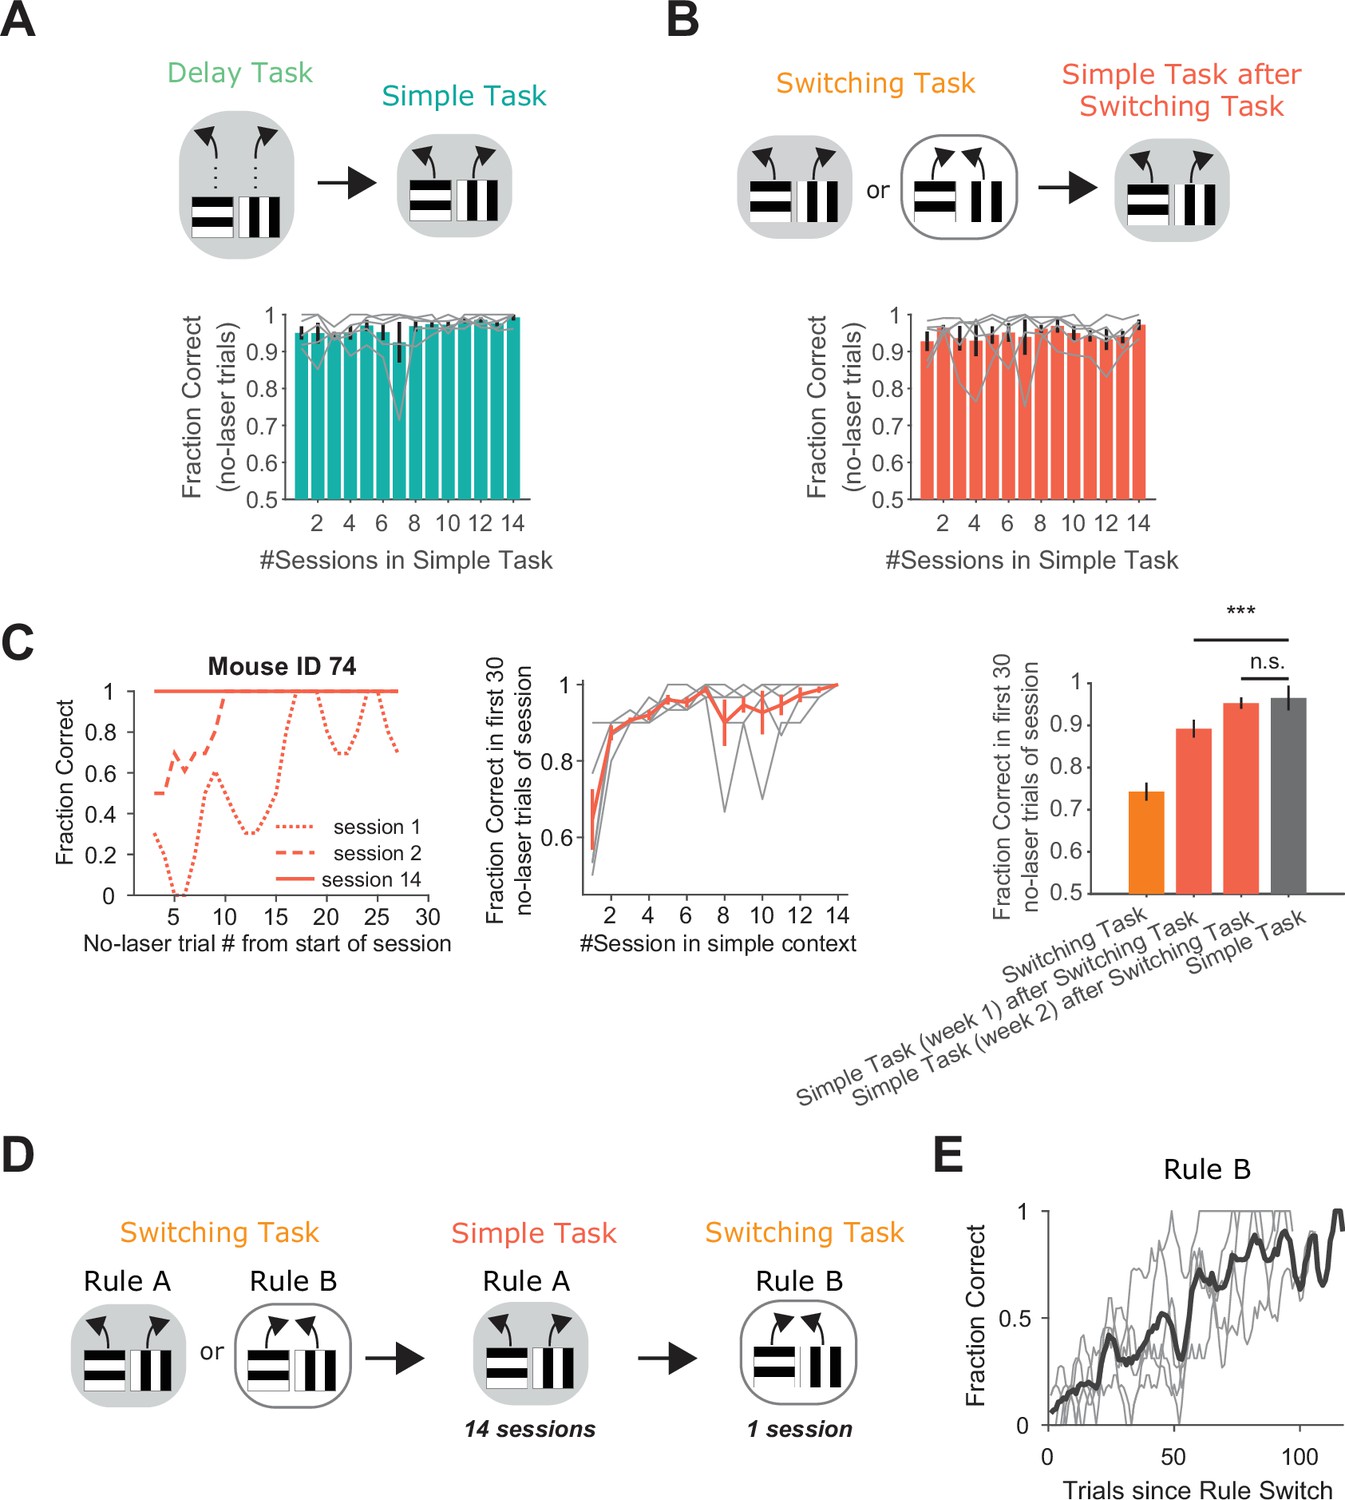
Mice with complex-task experience perform at high levels in the simple task.
(A) Top: Schematic of the training history sequence. Mice were trained on the delay task and then permanently transitioned to the simple task. Bottom: Performance on no-laser trials for each session after transition to the simple task. Bars indicate mean ± standard error of the mean (SEM) across mice (n = 5). Gray lines show individual mice. (B) Similar to (A), but for mice transitioned to the simple task from the switching task (n = 5). (C) Left: Performance for an example mouse with switching task experience across the first 30 trials per session for sessions 1, 2, and 14 in the simple task. Each session started with a block of no-laser trials (minimum of 50 trials) before the first laser-on block. Fraction Correct was Gaussian smoothed with a window size of seven trials, sigma of three trials. Middle: Average performance in the first 30 no-laser trials of a session in the simple task. Gray lines: individual mice. Bars indicate mean ± SEM across mice (n = 5). Right: Average initial performance in the switching task (orange, 90 sessions from 6 mice), in each week in the simple task of mice with previous switching task experience (red, 35 and 34 sessions from 5 mice in weeks 1 and 2, respectively), and in the simple task in mice with simple-task-only experience (gray, 45 sessions from 4 mice). Bars indicate mean ± SEM across sessions. Unpaired two-sided t-tests comparing performance in the simple task with and without switching task experience. Week 1: p = 0.00096, week 2: p = 0.43. ***: p < 0.001. (D) Schematic of task sequence: After training in the switching task, mice were transitioned to the simple task without any rule switches for 14 sessions. Then for a single session, mice were exposed to the rule they had not been exposed to for 14 sessions. (E) Performance in the rule mice had not experienced for 14 sessions. Gray lines: individual mice. Black line: average across mice. Lines are only shown until the next rule switch, which different mice encountered at different numbers of trials based on their performance.
Figure 3 with 1 supplement
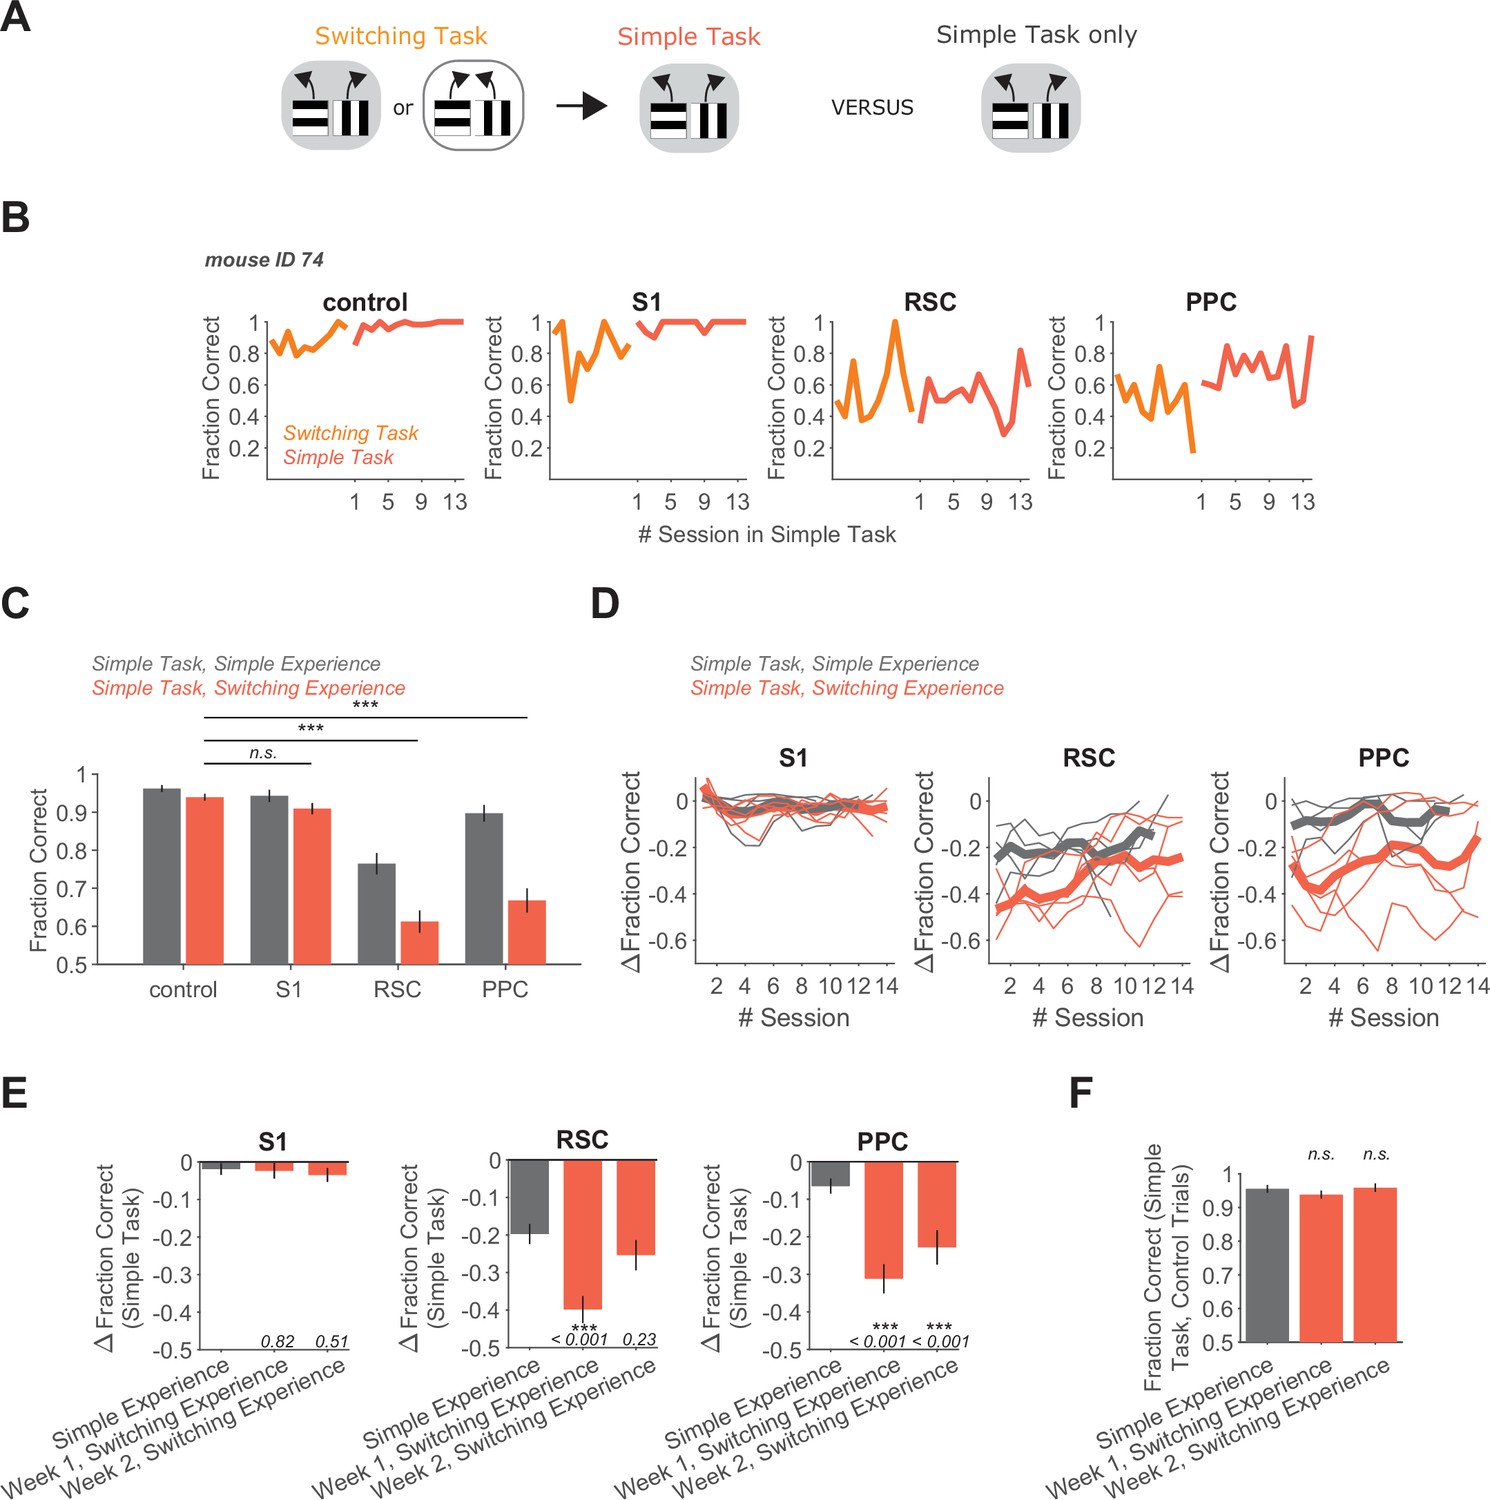
Switching task experience increases the necessity of RSC and PPC in a simple decision task.
(A) Schematic of the training history sequence. One group of mice was trained on the switching task and then permanently transitioned to the simple task. This group of mice was compared to another group trained only on the simple task. (B) Performance of an example mouse transitioned from the switching task to the simple task on control and inhibition trials. (C) Performance in the simple task for each inhibited location in mice with simple task experience only (gray, 45 sessions from 4 mice, same dataset as in Figure 1F), and in mice with previous switching task experience (red, 69 sessions from 5 mice). Bars indicate mean ± standard error of the mean (SEM) of a bootstrap distribution of the mean. S1 p = 0.26; RSC p<0.001; PPC p < 0.001; from bootstrapped distributions of ΔFraction Correct (difference from control performance) compared to 0, two-tailed test, α = 0.05 plus Bonferroni correction. ***: p < 0.001. Sessions per mouse: 13 ± 0.4. Trials per session: 55 ± 11 (control), 14 ± 4 (S1), 13 ± 4 (RSC), 15 ± 4 (PPC), mean ± standard deviation (SD). (D) Inhibition effects (ΔFraction Correct) across sessions in the simple task in mice with only simple task experience (gray), and in mice with previous switching task experience (red), for each cortical inhibition location. Thin lines show individual mice (n = 4 with simple task experience, n = 5 with switching task experience), thick lines show average across mice. ΔFraction Correct was smoothed with a moving average filter of three sessions. (E) Comparison of inhibition effects (ΔFraction Correct) in the simple task for mice with simple task experience only (45 sessions from 4 mice) versus switching task experience 1 (35 sessions from 5 mice) or 2 (34 sessions from 5 mice) weeks after transition from the switching task to the simple task. Bars indicate mean ± SEM of a bootstrap distribution of the mean; two-tailed comparisons of bootstrapped ΔFraction Correct distributions, α = 0.05. ***: p < 0.001. Same datasets as in Figure 1F and Figure 3C. (F) Comparison of performance on control trials in the simple task with simple versus switching task experience using only the first two laser-on blocks in each session. Bars indicate mean ± SEM of a bootstrap distribution of the mean. Simple task data in week 1 (p = 0.32) and week 2 (p = 0.81) after transition from the switching task were compared to the simple task only experience data; two-tailed comparisons of bootstrapped Fraction Correct distributions, α = 0.05. Trials per session: 51 ± 23 (simple experience), 51 ± 5 (switching experience, week 1), 50 ± 7 (switching experience, week 2), mean ± SD.
Figure 3—figure supplement 1
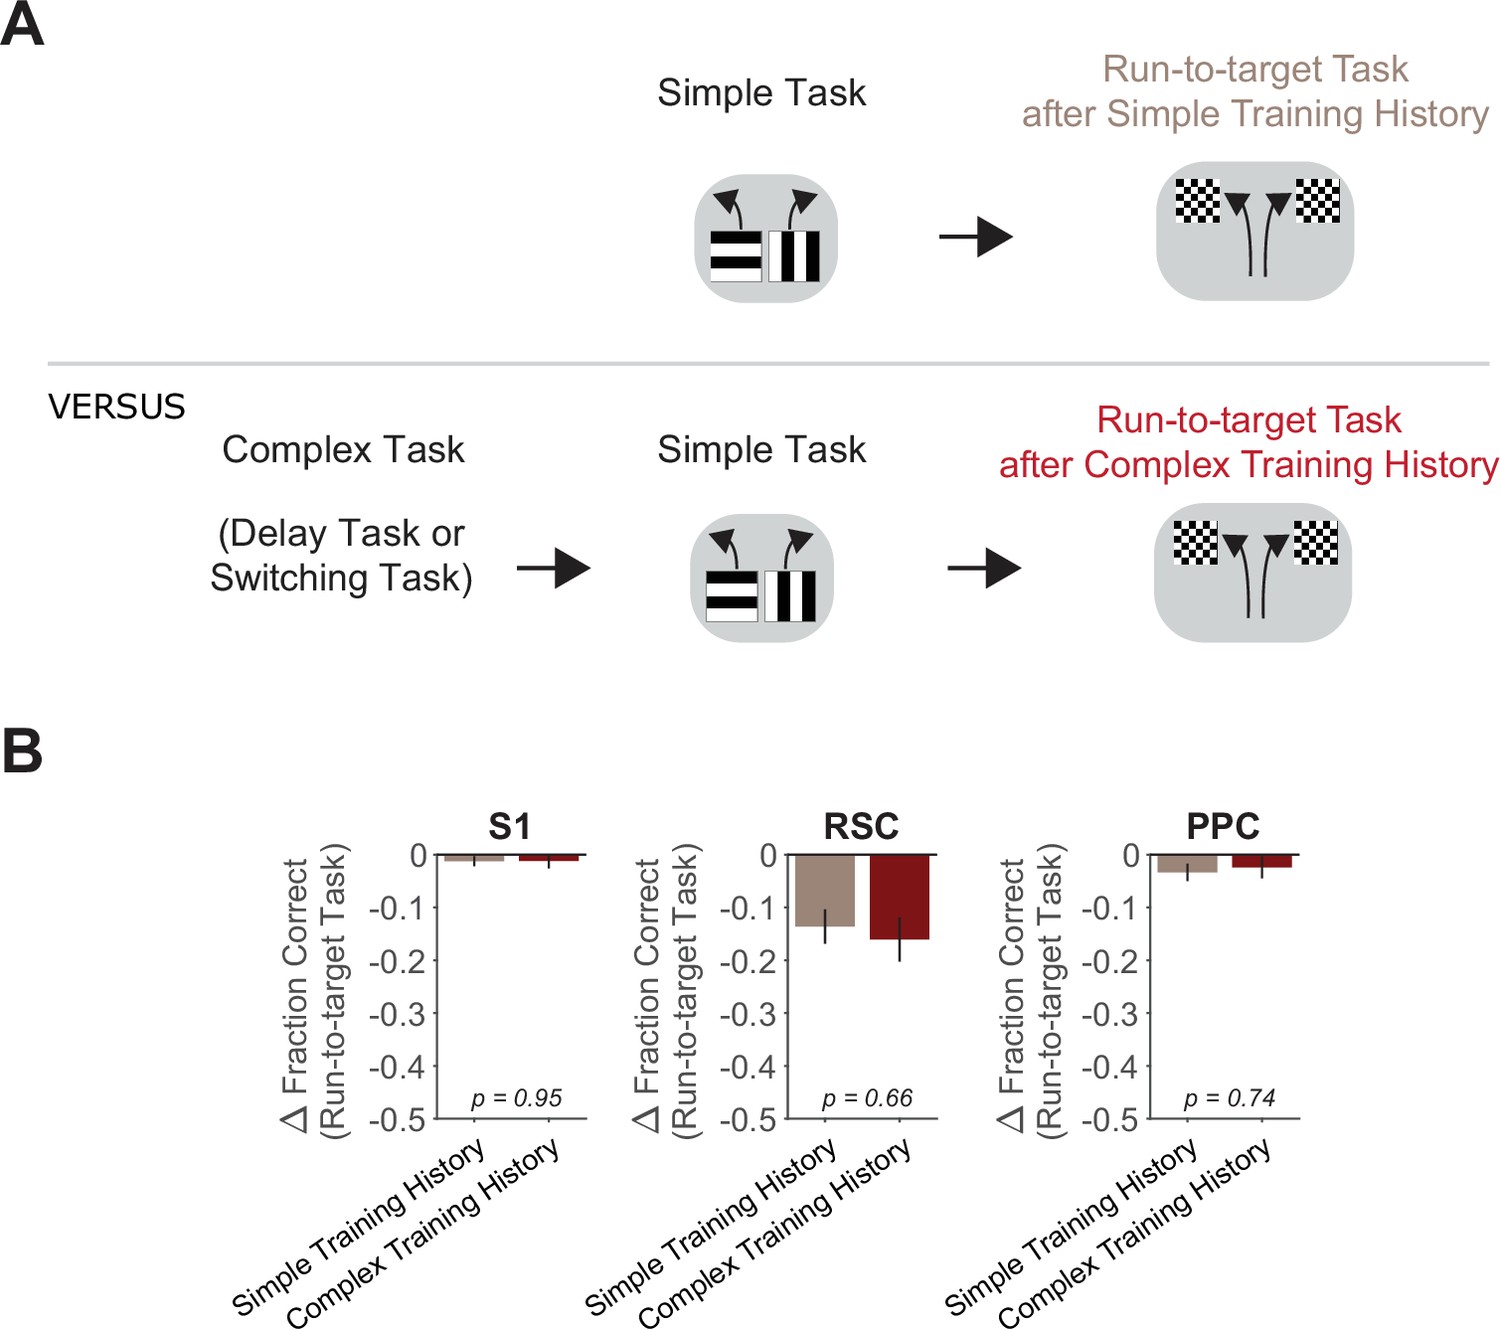
Increased cortical involvement in the simple task after complex-task experience does not generalize to the run-to-target task.
(A) Schematic of task training sequence. One group of mice was trained in the simple task and then transitioned to the run-to-target task. Another group of mice was first trained in a complex task (switching or delay task), then transitioned to the simple task for 14 days, and then tested on the run-to-target task. (B) Comparison of inhibition effects (ΔFraction Correct) in the run-to-target task in mice with simple task-only versus complex- and simple task experience, for each cortical inhibition location. Bars indicate mean ± standard error of the mean (SEM) of a bootstrap distribution of the mean; two-tailed comparisons of bootstrapped ΔFraction Correct distributions, α = 0.05. Simple task-only experience (same dataset as in Figure 1—figure supplement 1): 15 sessions from 3 mice, 5 ± 2 sessions per mouse. Trials per session: 93 ± 11 (control), 26 ± 5 (S1), 24 ± 5 (RSC), 28 ± 6 (PPC), mean ± standard deviation (SD). Complex- and simple task experience: 11 sessions from 3 mice, 4 ± 2 sessions per mouse. Trials per session: 94 ± 4 (control), 28 ± 2 (S1), 23 ± 2 (RSC), 28 ± 4 (PPC), mean ± SD.
Figure 4 with 4 supplements
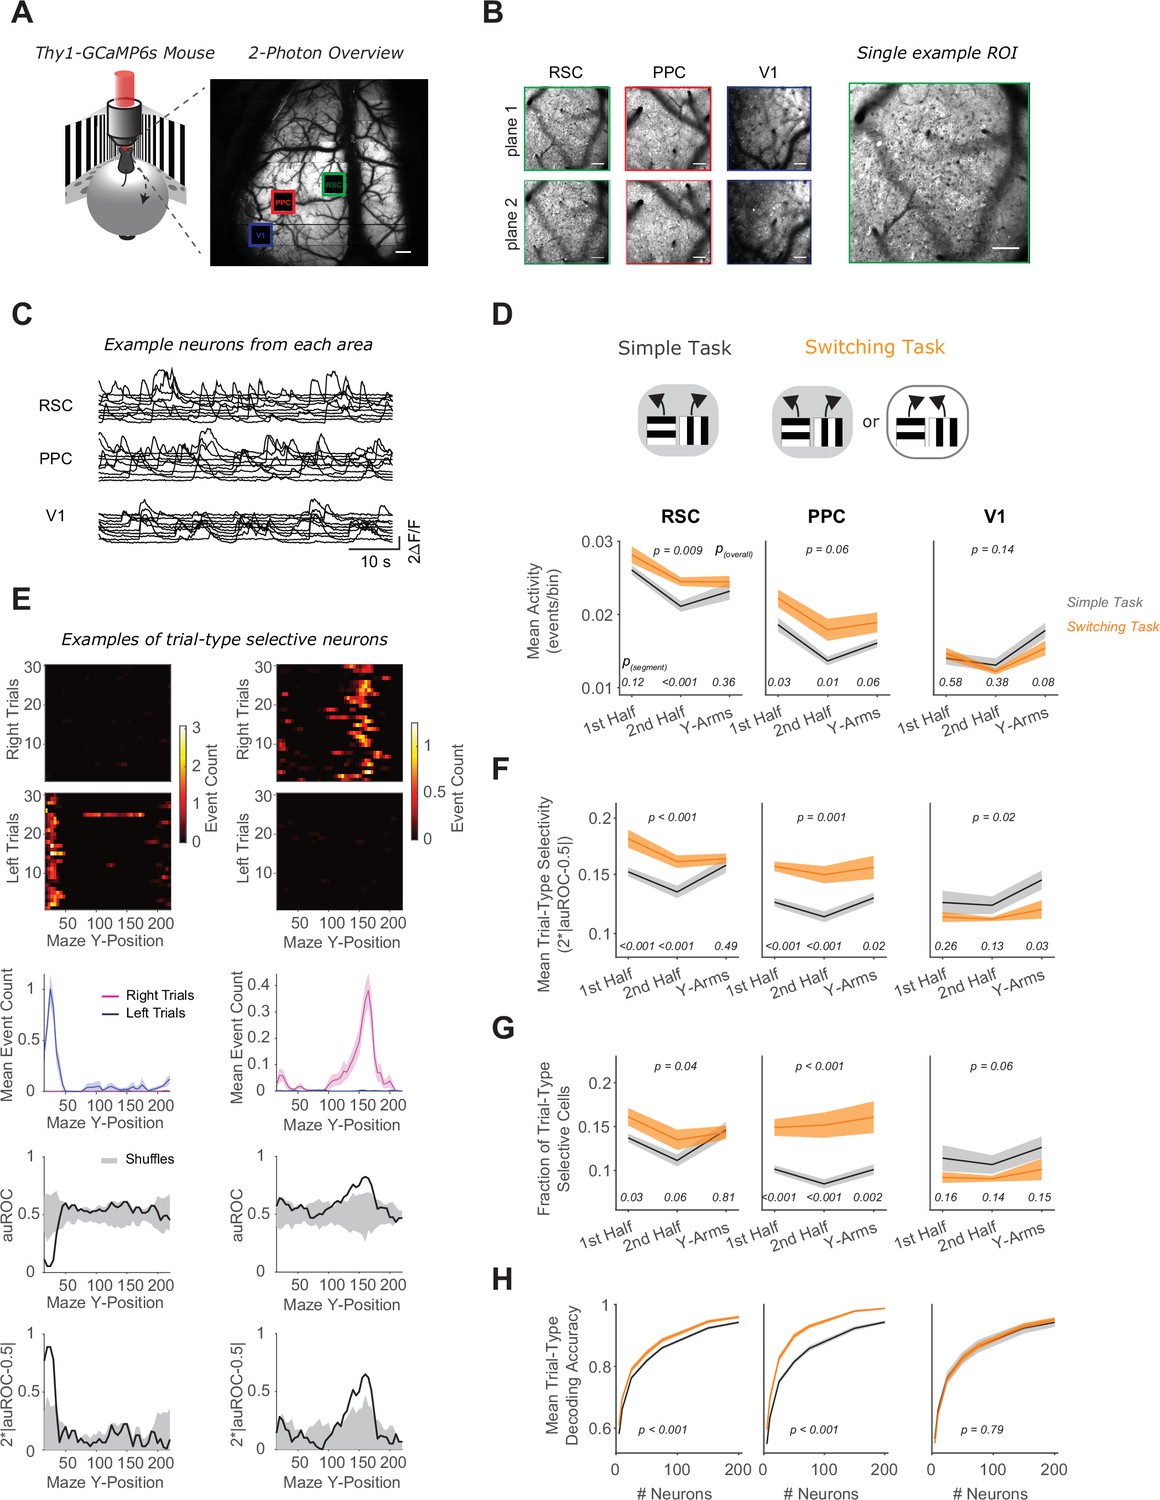
RSC and PPC neurons have activity patterns with higher selectivity in the switching task.
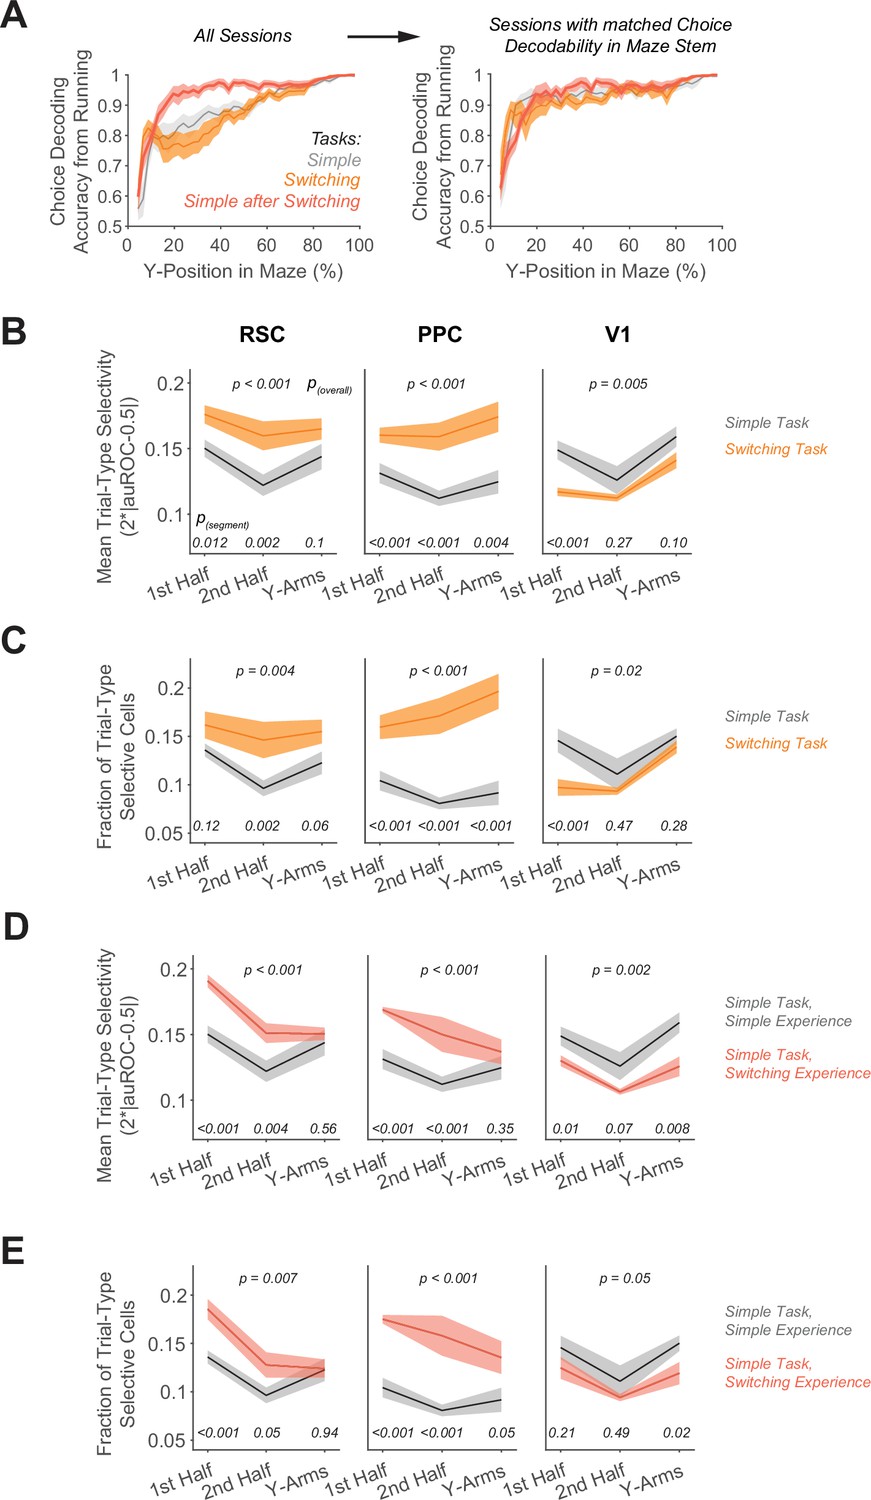
(A) Left: Schematic of virtual reality behavioral setup with mesoscopic two-photon imaging. Right: Two-photon overview image of cortical window and locations of three areas imaged simultaneously. Scale bar: 500 μm. (B) Mean intensity two-photon images of each imaged area, color coded by area as in (A). Areas were imaged at two depths. Scale bars: 100 μm. (C) Example activity traces of 10 cells from each area. (D) In each area, mean activity levels across cells by maze segment are compared in the simple (gray) versus the switching (orange) task (only Rule A trials). The maze segments are the first half of the Y-stem (15–75 cm Y-Position), the second half of the Y-stem (75–150 cm), and the Y-arms (150–220 cm). Shading indicates mean ± standard error of the mean (SEM) of bootstrapped distributions of the mean. p(segment) shows p values of two-tailed comparisons of bootstrapped distributions per maze segment. p(overall) shows the p value for the task factor from a two-way analysis of variance (ANOVA; factors: task and maze segment). Simple task: n = 3 mice, 4 sessions per mouse, neurons per session by area: RSC: 1438 ± 217, PPC: 456 ± 172, V1: 498 ± 170. Switching task: n = 3 mice, 4 sessions per mouse, neurons per session by area: RSC: 1510 ± 398, PPC: 513 ± 304, V1: 363 ± 92 (mean ± standard deviation [SD]). (E) Left and right panel columns show activity from two different example neurons. Top: Spatially binned activity separated by trial type. Each row shows a single trial. Trials were subsampled to 30 trials per trial type. Middle: Mean activity for each trial type (pink: right trials, blue: left trials). Bottom: The area under the ROC curve (auROC) was calculated for each spatial bin. A shuffled distribution of auROC values (gray) was generated by randomly assigning left/right trial labels to each trial and recomputing auROC 100 times. Trial-type selectivity was defined as an absolute deviation of auROC from chance level (2*|auROC − 0.5|). To determine significance of trial-type selectivity, at each bin, this value was compared to the trial-type selectivity of the shuffle distribution (gray, significance threshold of p < 0.01). (F) Similar to (D), except for the metric of trial-type selectivity, that is 2*|auROC − 0.5|. (G) Similar to (D), except for the fraction of trial-type selective cells as determined from comparing each cell’s selectivity value to a distribution with shuffled trial labels (significance threshold of p < 0.01). (H) In each area, trial-type decoding accuracy using activity of subsampled neurons is compared in the simple versus the switching task (Rule A trials only). Shading indicates mean ± SEM across sessions. p value is for the task factor from a two-way ANOVA (factors: task and neuron number).
Figure 4—figure supplement 1
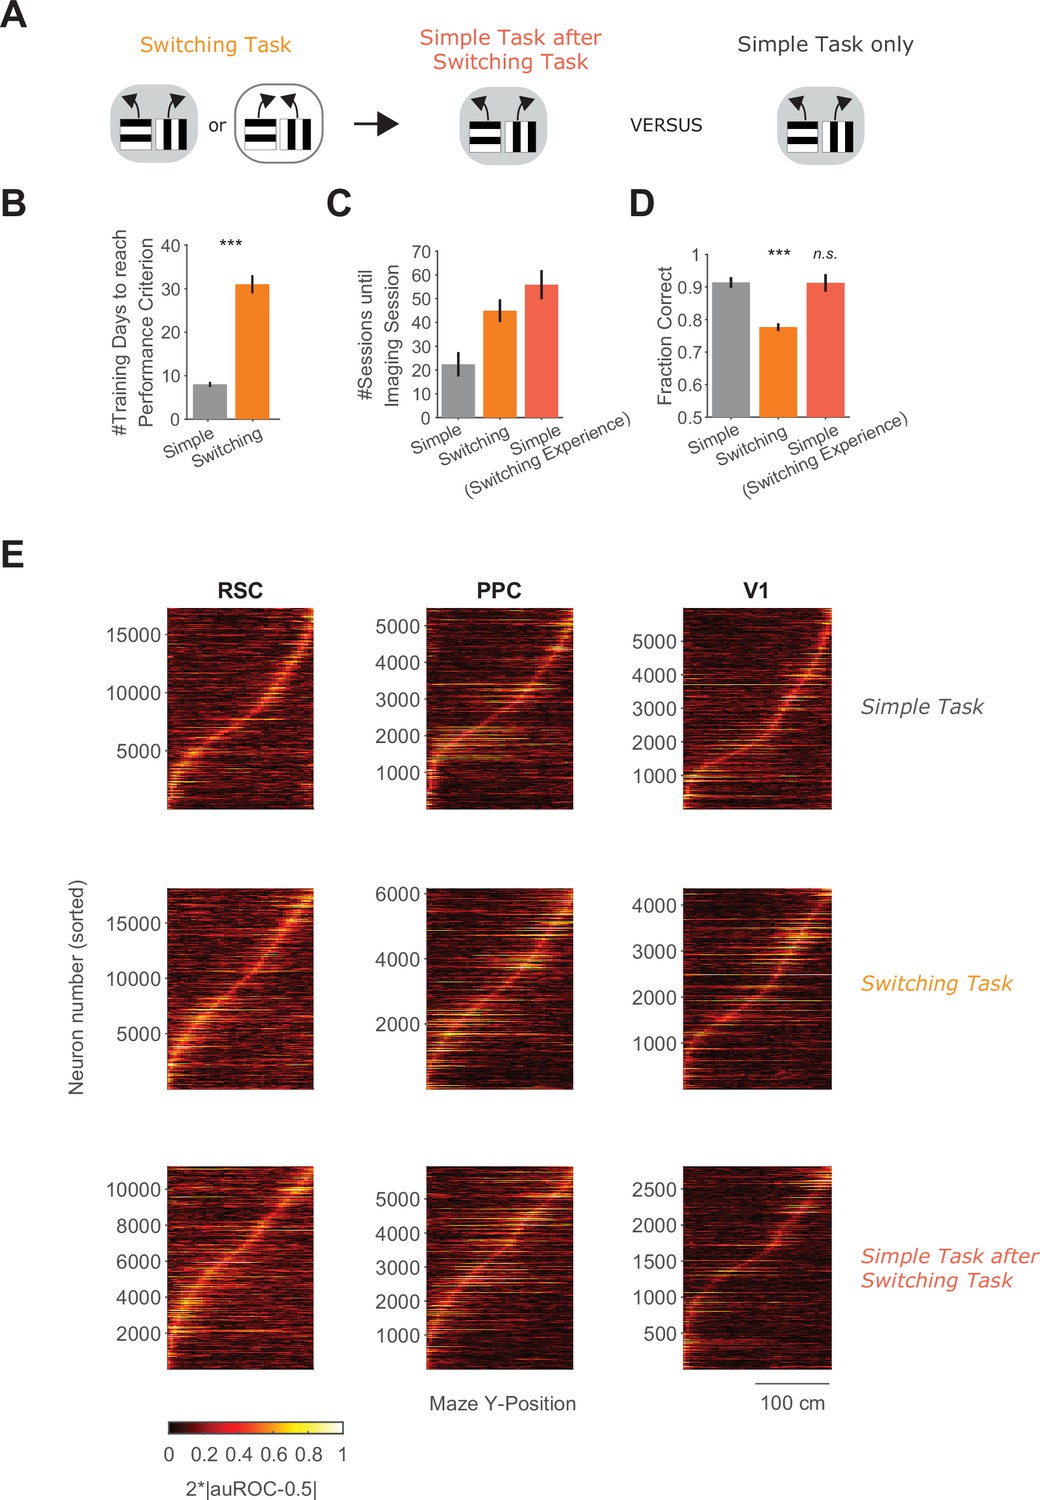
Task training times, task performance, and neuronal trial-type selectivity sequences across task conditions.
(A) Schematic overview of the behavioral tasks and task training sequences used in the two-photon imaging experiments. Left: One group of mice is trained on the switching task and then transitioned to the simple task. Right: Another group of mice is trained in the simple task only. (B) The number of training sessions needed to reach performance criteria for mice trained in the simple task only (n = 3 mice) or the switching task (n = 3 mice) (Methods). Bars indicate mean ± standard error of the mean (SEM) across mice. p = 0.0004, unpaired two-sided t-test. ***: p < 0.001. (C) Overall number of sessions experienced (including task learning sessions) until each two-photon imaging session in the different task conditions. Bars indicate mean ± SEM across sessions (simple task: 12 sessions from 3 mice, switching task: 12 sessions from 3 mice, simple task after switching task: 10 sessions from 2 mice). Note that in the simple task after switching task condition, the total number of sessions includes all switching and simple task sessions. (D) Comparison of performance across task conditions using all trials per session. Bars indicate mean ± SEM across sessions. Both switching and simple tasks with switching experience data were compared to the simple task only data using an unpaired two-sided t-test. Switching versus simple only: p = 8.90 × 10−07; simple with switching experience versus simple only: p = 0.97. ***: p < 0.001. (E) Trial-type selectivity (absolute deviation of auROC from chance level, 2*|auROC − 0.5|) was calculated per neuron and spatial maze bin (5 cm bin size) and is shown for all neurons pooled across mice and sessions in each cortical area and task condition. Neurons were sorted by the maze position of their selectivity peak. Mice per task: simple (3), switching (3), and simple after switching (2).
Figure 4—figure supplement 2
Trial-type selectivity for sessions with similar running patterns.
(A) Left: Decoding accuracy of the reported choice using instantaneous treadmill velocities and lateral position, binned along the maze’s long axis (5 cm bins). Shading indicates mean ± standard error of the mean (SEM) across all sessions per task. Sessions per task: 12 (simple), 12 (switching), and 8 (simple after switching). Right: Decoding accuracy using a subset of sessions with similar running patterns, that is with average choice decoding accuracy in the maze stem ranging from 85% to 95%. Sessions per task: 4 (simple), 5 (switching), and 5 (simple after switching). (B) For sessions with similar running patterns, in each area, mean trial-type selectivity levels across cells by maze segment are compared in the simple versus the switching task (Rule A trials only). Shading indicates mean ± SEM of bootstrapped distributions. p(segment) shows p values of two-tailed comparisons of bootstrapped distributions per maze segment. p(overall) shows the p value for the task factor from a two-way analysis of variance (ANOVA; factors: task and maze segment). (C) For sessions with similar running patterns, similar to (B), except for the fraction of trial-type selective cells as determined from comparing each cell’s selectivity value to a distribution with shuffled trial labels (significance threshold of p < 0.01). (D) For sessions with similar running patterns, similar to (B), but for the simple task after switching task experience. (E) For sessions with similar running patterns, similar to (C), but for the simple task after switching task experience.
Figure 4—figure supplement 3
Neuronal activity and selectivity in Rule B of the switching task compared to the simple task.
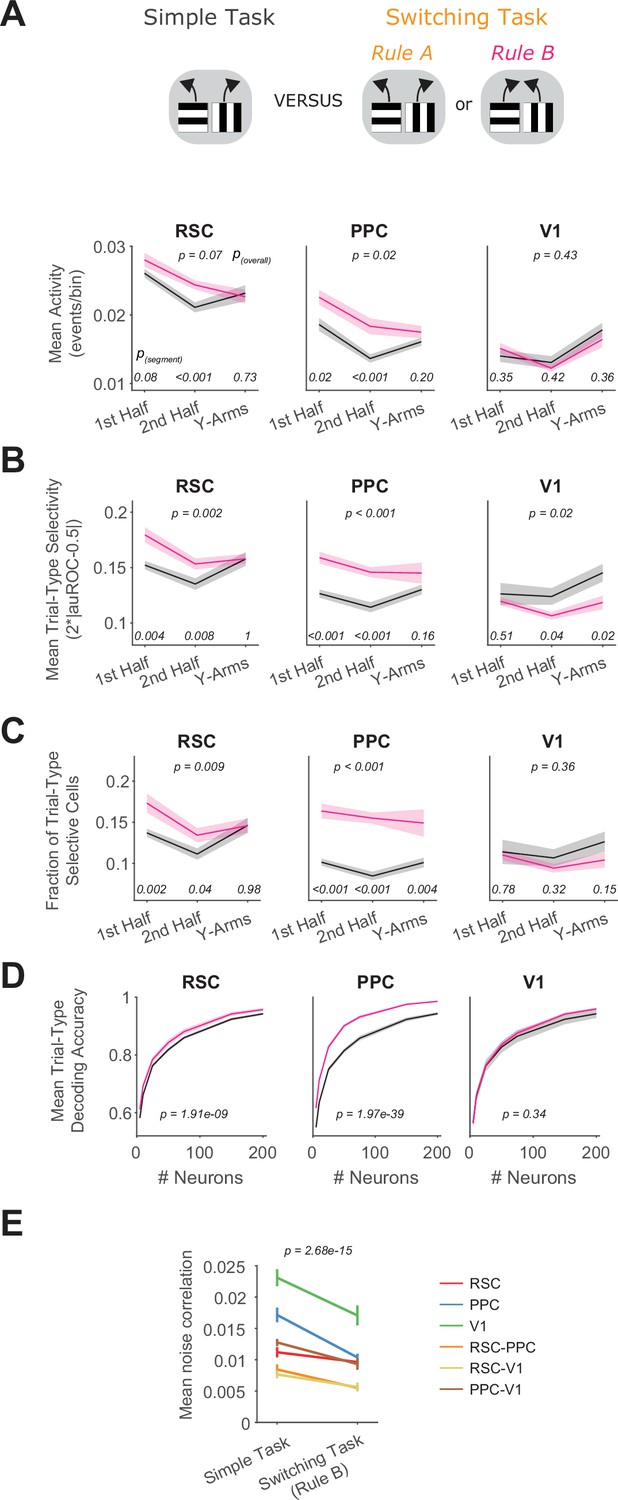
(A) In each area, mean activity levels across cells by maze segment are compared in the simple (gray) versus the switching task (pink, only Rule B trials). The maze segments are the first half of the Y-stem (15–75 cm Y-Position), the second half of the Y-stem (75–150 cm), and the Y-arms (150–220 cm). Shading indicates mean ± standard error of the mean (SEM) of bootstrapped distributions of the mean. p(segment) shows p values of two-tailed comparisons of bootstrapped distributions per maze segment. p(overall) shows the p value for the task factor from a two-way analysis of variance (ANOVA; factors: task and maze segment). Simple task: n = 3 mice, 4 sessions per mouse, neurons per session by area: RSC: 1438 ± 217, PPC: 456 ± 172, V1: 498 ± 1 70. Switching task: n = 3 mice, 4 sessions per mouse, neurons per session by area: RSC: 1510 ± 398, PPC: 513 ± 304, V1: 363 ± 92 (mean ± standard deviation [SD]). (B) Similar to (A), except for the metric of trial-type selectivity, that is 2*|auROC − 0.5|. (C) Similar to (A), except for the fraction of trial-type selective cells as determined from comparing each cell’s selectivity value to a distribution with shuffled trial labels (significance threshold of p < 0.01). (D) In each area, trial-type decoding accuracy using activity of subsampled neurons is compared in the simple versus the switching task (Rule B trials only). Shading indicates mean ± SEM across sessions. p value is for the task factor from a two-way ANOVA (factors: task and neuron number). (E) Comparison of mean noise correlations in the simple task versus the switching task (Rule B trials only), p value is for the task factor from a two-way ANOVA (factors: task and area combination). Error bars indicate mean ± SEM across sessions per area combination (n = 6 area combinations, n sessions: 12 [simple task] and 12 [switching task]).
Figure 4—figure supplement 4
Neuronal selectivity in the switching task across rules.
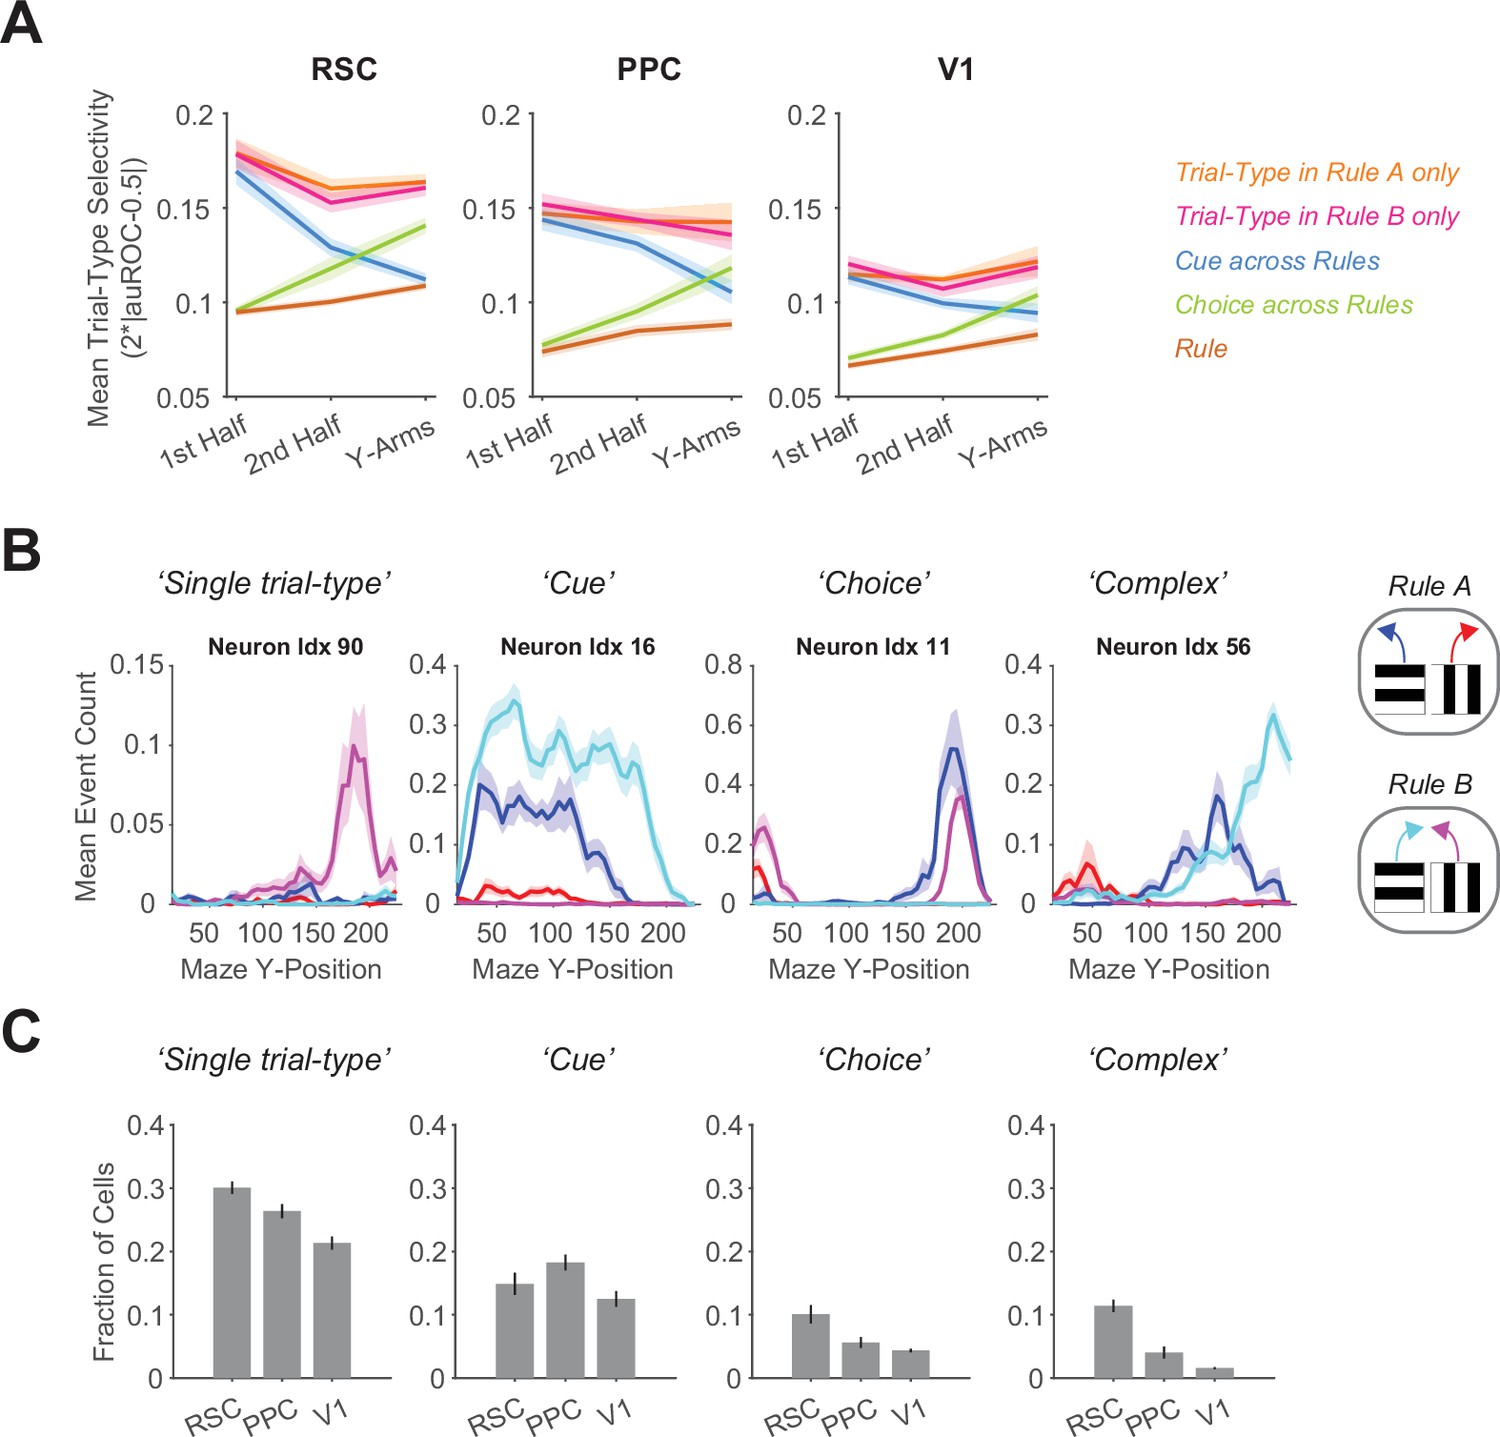
(A) In each area, mean selectivity levels (i.e., 2*|auROC − 0.5|) across cells by maze segment are plotted for different selectivity categories in the switching task. Selectivity values for the categories ‘Trial-Type in Rule A only’ (orange) or ‘Trial-Type in Rule B only’ (pink) were calculated using only trials from Rule A or B, respectively. For the categories ‘Cue’ (blue), ‘Choice’ (green), or ‘Rule’ (brown), trials from both rules were used. Maze segments are the first half of the Y-stem (15–75 cm Y-Position), the second half of the Y-stem (75–150 cm), and the Y-arms (150–220 cm). Shading indicates mean ± standard error of the mean (SEM) of bootstrapped distributions of the mean. n = 3 mice, 4 sessions per mouse, neurons per session by area: RSC: 1510 ± 398, PPC: 513 ± 304, V1: 363 ± 92 (mean ± standard deviation [SD]). (B) Each column shows activity from an example neuron to illustrate different selectivity categories (Methods). Activity was spatially binned and separated by the four trial types constituting the switching task (see color codes for the 4 cue–choice combinations on the right). Shading indicates mean ± SEM across trials. (C) For the selectivity categories exemplified in (C), the fraction of neurons falling into each category are shown by area. Error bars show mean ± SEM across sessions.
Figure 5
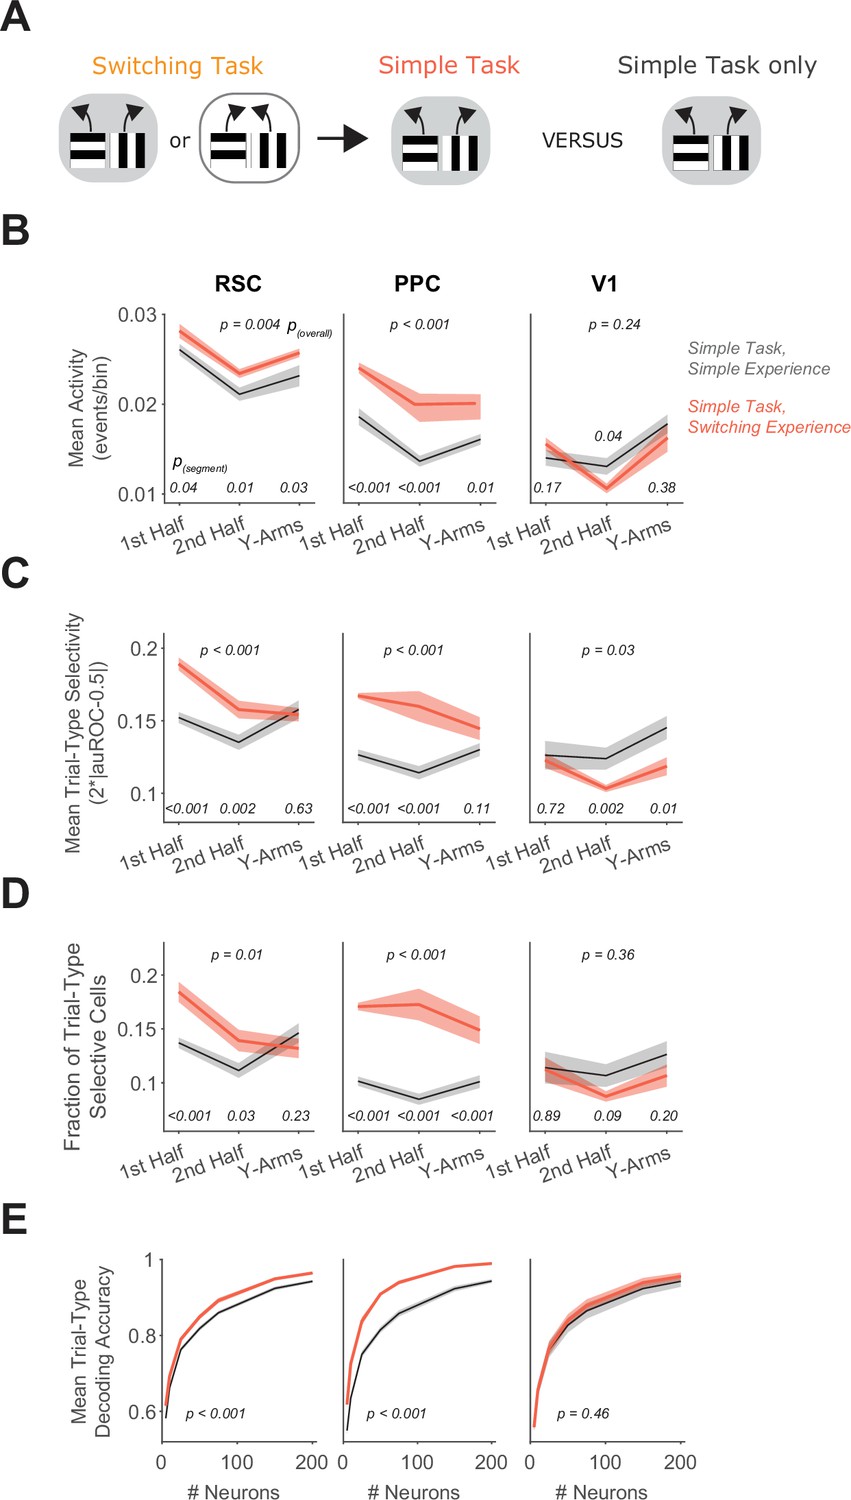
Previous switching task experience increases trial-type selectivity in RSC and PPC.
(A) Schematic of the training history sequence. One group of mice was trained on the switching task and then permanently transitioned to the simple task. This group of mice was compared to another group trained only on the simple task. (B) In each area, mean activity levels across cells by maze segment are compared in the simple task in mice with (red) and without (gray) previous experience in the switching task. Shading indicates mean ± standard error of the mean (SEM) of bootstrapped distributions of the mean. p(segment) shows p values of two-tailed comparisons of bootstrapped distributions per maze segment. p(overall) shows the p value for the previous task experience factor from a two-way analysis of variance (ANOVA; factors: previous task experience and maze segment). Simple task: n = 3 mice, 4 sessions per mouse, cells per session by area: RSC: 1438 ± 217, PPC: 456 ± 172, V1: 498 ± 170 (same dataset as in Figure 4D–H). Simple task after switching task experience: n = 2 mice, 3 and 5 sessions per mouse, neurons per session by area: RSC: 1407 ± 327, PPC: 744 ± 219, V1: 351 ± 90 (mean ± standard deviation [SD]). (C) Similar to (B), except for the metric of trial-type selectivity, that is 2*|auROC − 0.5|. (D) Similar to (B), except for the fraction of trial-type selective cells as determined from comparing each cell’s selectivity value to a distribution with shuffled trial labels. (E) In each area, trial-type decoding accuracy using activity of subsampled neurons is compared in the simple task in mice with and without previous experience in the switching task. Shading indicates mean ± SEM across sessions. p value is for the previous task experience factor from a two-way ANOVA (factors: previous task experience and neuron number).
Figure 6
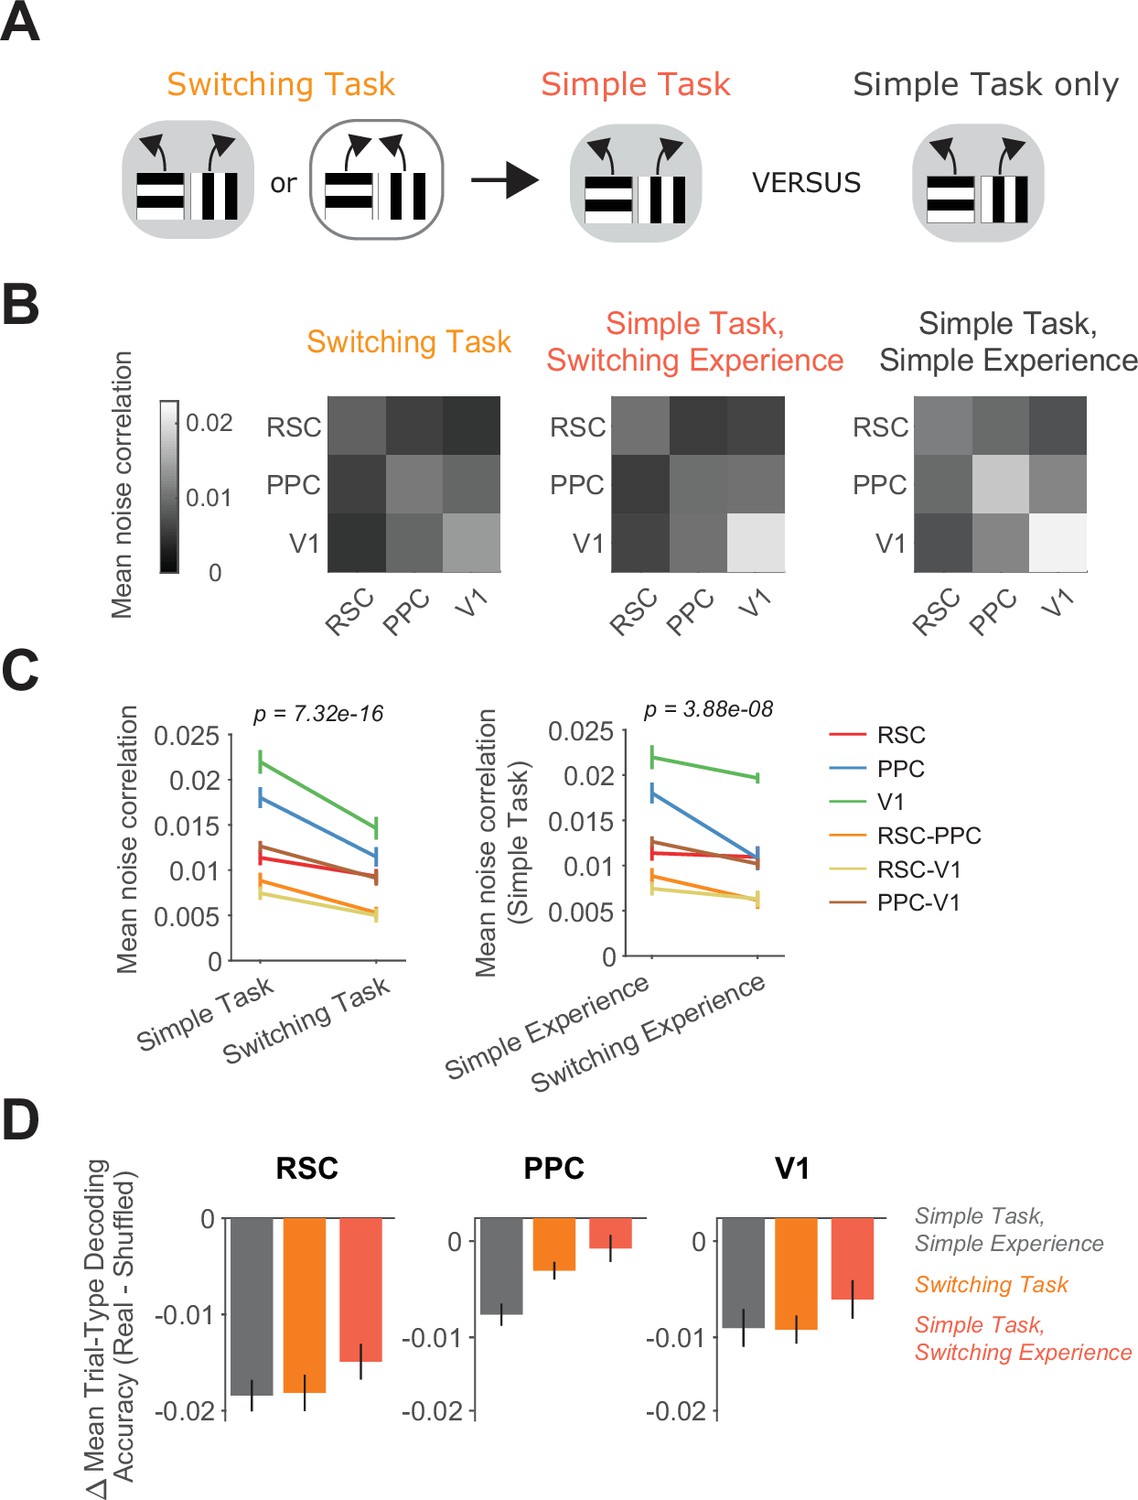
Switching task experience decreases noise correlations.
(A) Schematic of the training history sequence. One group of mice was first trained on the switching task and then permanently transitioned to the simple task. Another group was trained only on the simple task. (B) Mean pairwise noise correlations within and across areas from bootstrapped distributions of the mean in the switching task (left), the simple task with previous switching task experience (middle), and the simple task with only simple task experience (right). Noise correlations were calculated on spatially binned data in correct trials during high-performance periods (Methods). (C) Left: Comparison of mean noise correlations in the switching task versus the simple task, p value is for the task factor from a two-way analysis of variance (ANOVA; factors: task and area combination). Error bars indicate mean ± standard error of the mean (SEM) across sessions per area combination (n = 6 area combinations, n sessions: 12 (simple task) and 12 (switching task)). Right: Similar to left, except for the comparison of simple task noise correlations with and without previous switching task experience. n sessions: 12 (simple experience) and 8 (switching experience). (D) For each area and task or previous task experience, the difference in trial-type decoding accuracy between neural populations (200 subsampled neurons) with intact and disrupted noise correlations. Noise correlations were disrupted by shuffling trials independently for each cell within a given trial type. Error bars show mean ± SEM across sessions.
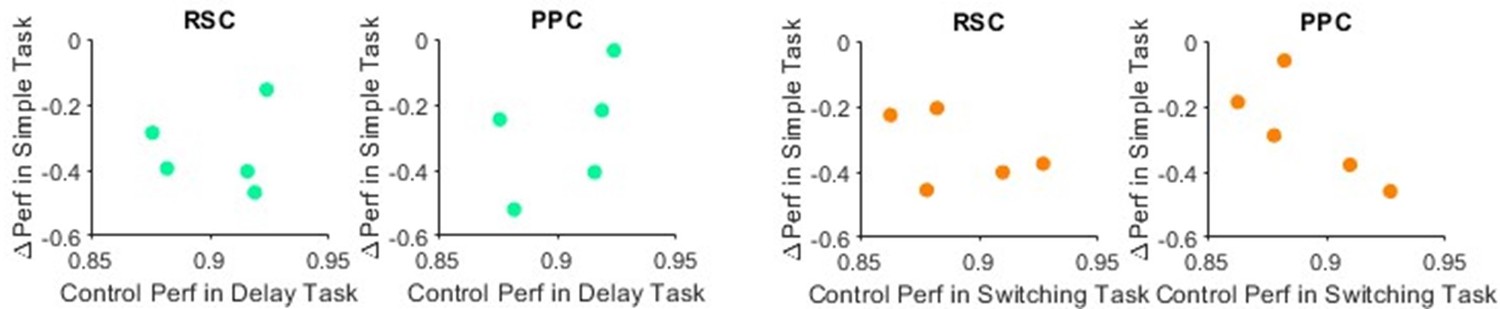
Author response image 1
Additional files
Download links
A two-part list of links to download the article, or parts of the article, in various formats.
Downloads (link to download the article as PDF)
Open citations (links to open the citations from this article in various online reference manager services)
Cite this article (links to download the citations from this article in formats compatible with various reference manager tools)
Cognitive experience alters cortical involvement in goal-directed navigation
eLife 11:e76051.
https://doi.org/10.7554/eLife.76051


