scRNA-sequencing reveals subtype-specific transcriptomic perturbations in DRG neurons of PirtEGFPf mice in neuropathic pain condition
- Department of Anesthesiology and Critical Care Medicine, The Johns Hopkins University School of Medicine, United States
- Department of Ophthalmology, The Johns Hopkins University School of Medicine, United States
- Department of Orthopaedic Surgery, The Johns Hopkins University School of Medicine, United States
- The Solomon H. Snyder Department of Neuroscience, The Johns Hopkins University School of Medicine, United States
- Department of Neurological Surgery, The Johns Hopkins University School of Medicine, United States
Figures
Figure 1 with 1 supplement
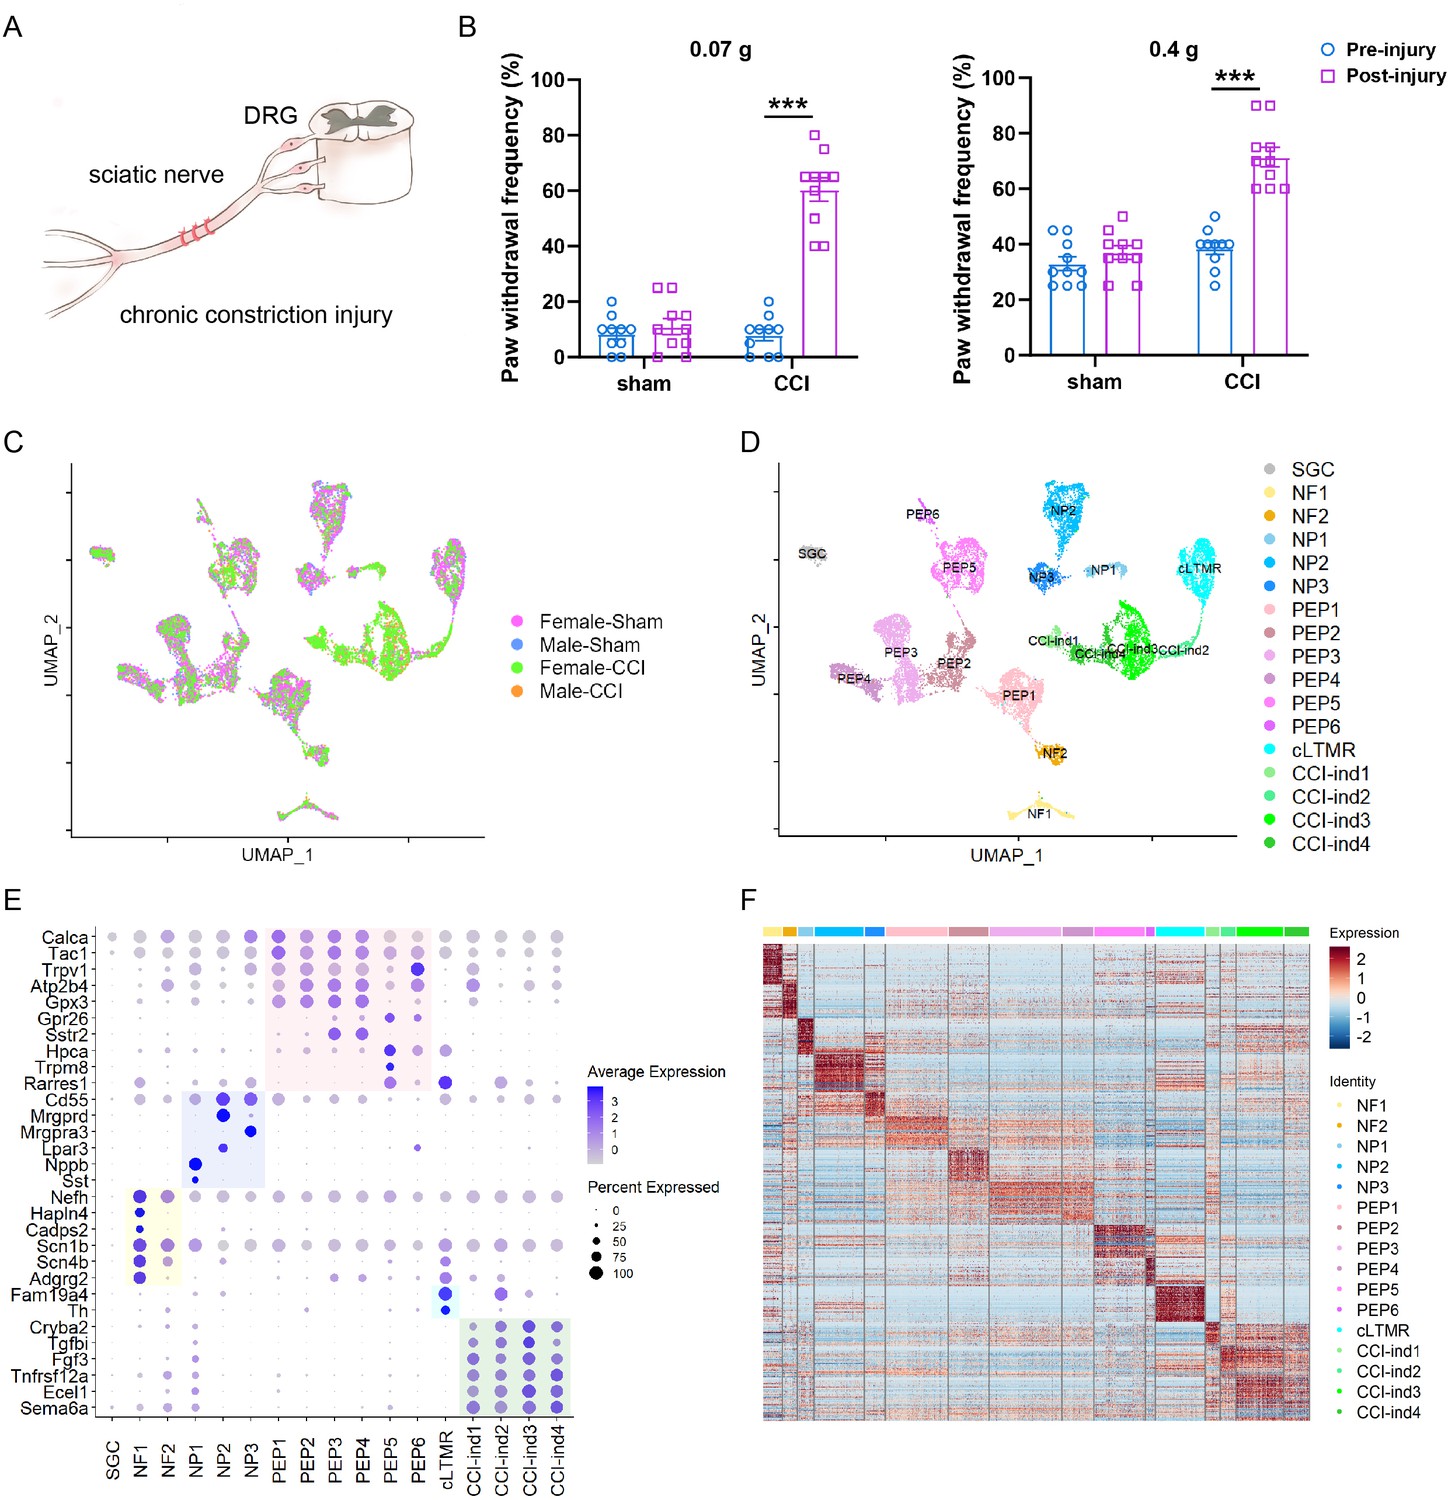
Single-cell RNA-sequencing (scRNA-seq) identified distinct clusters of cells in the dorsal root ganglion (DRG) of PirtEGFPf mice.
(A) Schematic diagram showing the procedure for chronic constriction injury (CCI) of the sciatic nerve. (B) Paw withdrawal frequencies to low-force (0.07 g von Frey filament, left) and high-force (0.4 g, right) mechanical stimuli before and 6 days after CCI or sham surgery. n=10 per group (n=5/sex). Two-way mixed-model analysis of variance (ANOVA) followed by Bonferroni post hoc test. Data are expressed as mean ± SD, ***p<0.001 versus pre-injury. (C) Integration of four datasets visualized by uniform manifold approximation and projection (UMAP). (D) Seventeen distinct cell clusters were identified by Seurat, including SGC (1), NF (2), NP (3), PEP (6), cLTMR (1), and CCI-induced clusters (4). (E) Dot plot of subtype-specific marker genes in each cluster. Genes highlighted in the yellow, purple, pink, and blue zones are known markers for NF, NP, PEP, and cLTMR, respectively. Genes highlighted in the green zone are markers identified in CCI-induced (CCI-ind) clusters. The dot size represents the percentage of cells expressing the gene, and the color scale indicates the average normalized expression level in each cluster. (F) A heatmap shows the expression patterns of the top 50 marker genes in each cluster.
Figure 1—figure supplement 1
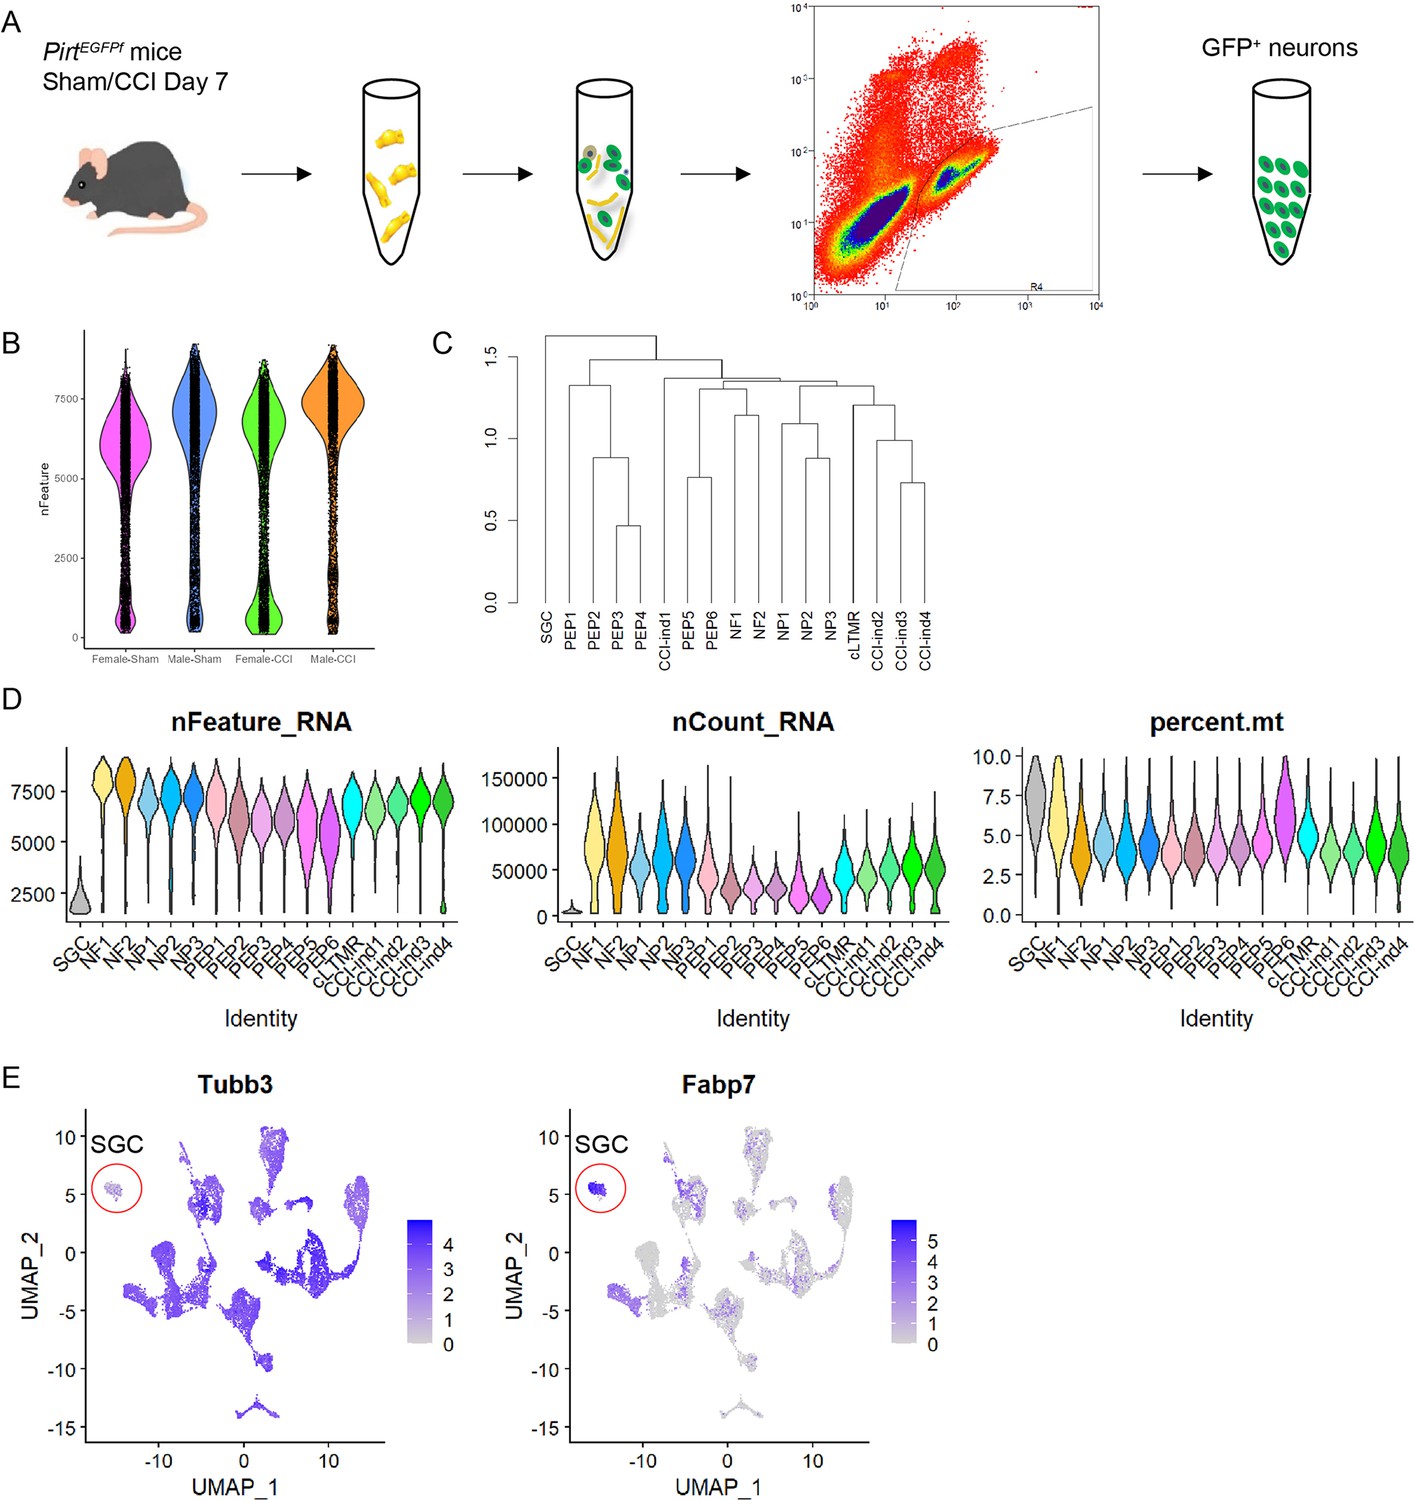
Data quality assays.
(A) Schematic diagram of the experimental procedure. Bilateral L4-5 dorsal root ganglions (DRGs) were dissected from PirtEGFPf mice on day 7 after sham surgery (sham) or bilateral chronic constriction injury (CCI) of the sciatic nerve. The dissociated cell suspension was processed with flow cytometry to collect GFP+ cells. (B) The violin plots showed the number of expressed genes in each dataset. (C) Hierarchical clustering of 17 cell clusters identified in the DRG. (D) The violin plots showed the number of expressed genes (left), unique molecular identifier (UMI) counts (middle), and percent of mitochondrial genes in each cell cluster (right). (E) Feature heatmaps show the expression of Tubb3 (a pan-neuronal marker) and Fabp7 (a satellite glial cell [SGC] marker) in all clusters. The SGC cluster is indicated with a red circle. The color scale indicates the Log2 normalized transcript counts.
Figure 2
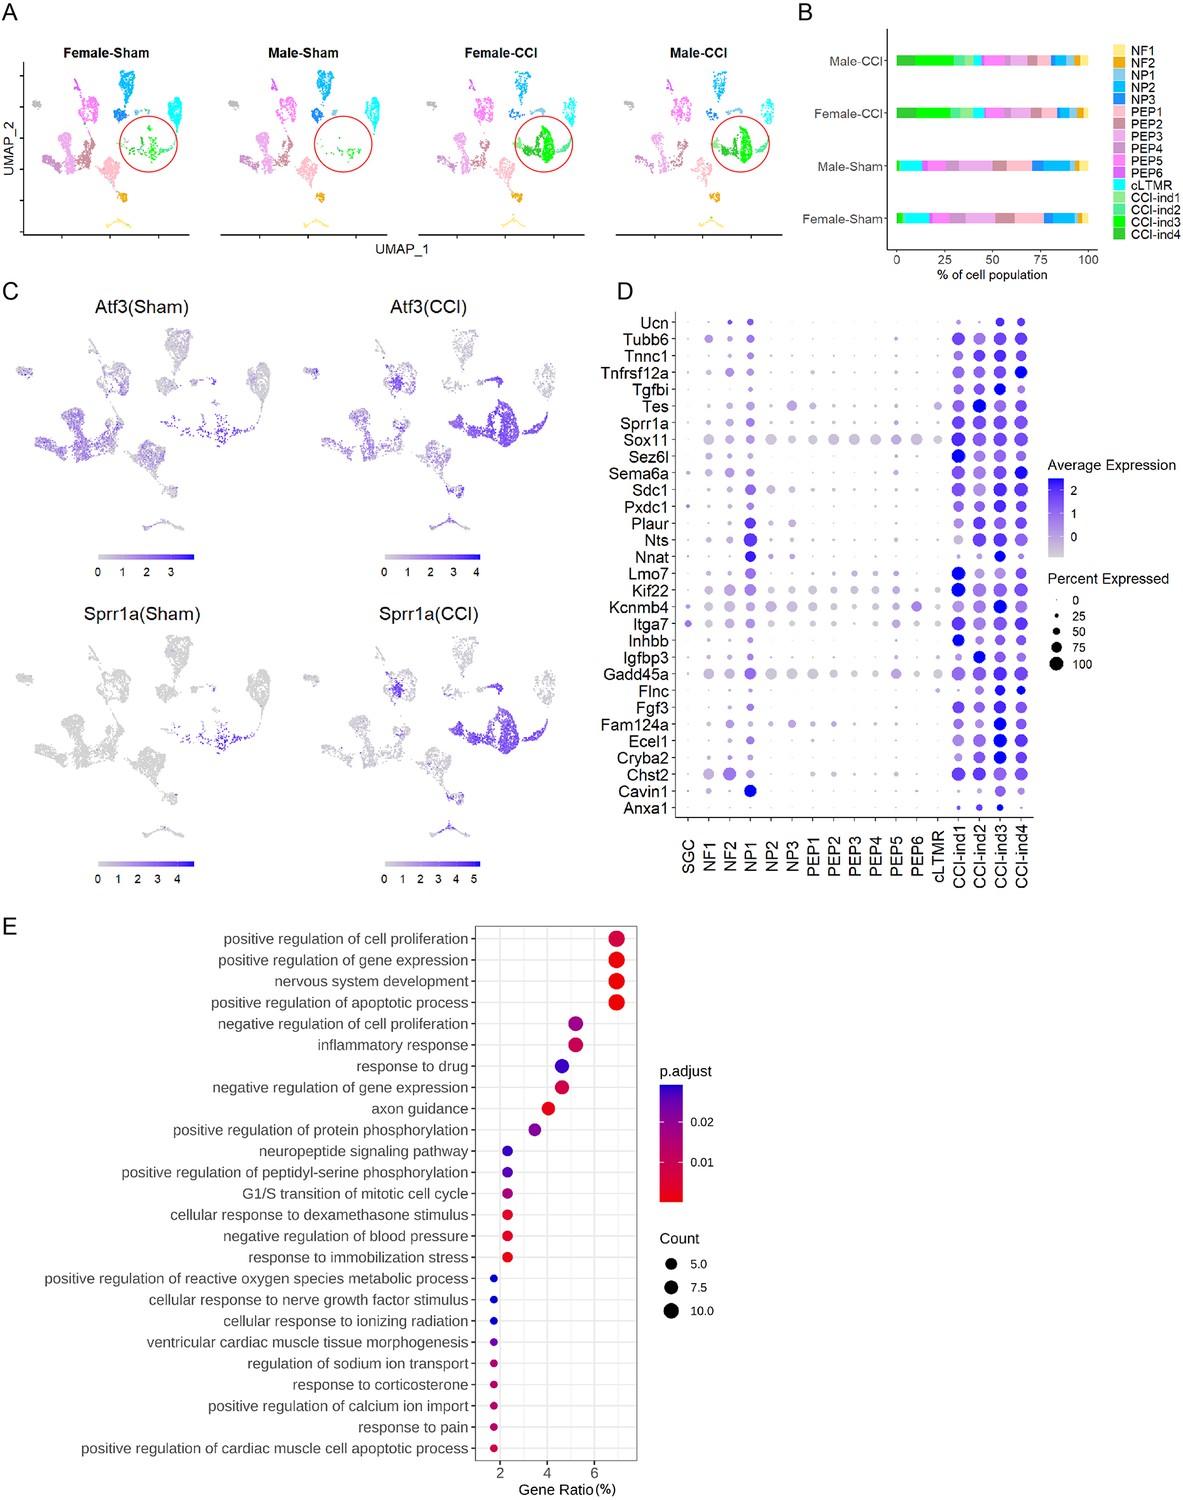
New neuronal clusters are induced by chronic constriction injury (CCI) of the sciatic nerve.
(A) Sciatic CCI induced four new clusters (marked in a red circle) of dorsal root ganglion (DRG) neurons in both female and male mice. These new clusters were named CCI-induced (CCI-ind) 1, 2, 3, and 4, and were not prominent in sham groups. x-axis: uniform manifold approximation and projection 1 (UMAP1), y-axis: UMAP2. (B) Percentage of cell population in 16 neuronal clusters present in each of the four treatment groups. (C) Feature heatmap shows the expression levels of injury-induced genes (Atf3, Sprr1a) in different clusters of CCI and sham groups. (D) The dot plot shows the top 30 marker genes of CCI-ind1-4 clusters, as compared to those in other clusters. (E) Top 25 biological processes enriched by the top 50 marker genes from CCI-ind1-4 clusters.
Figure 3 with 1 supplement
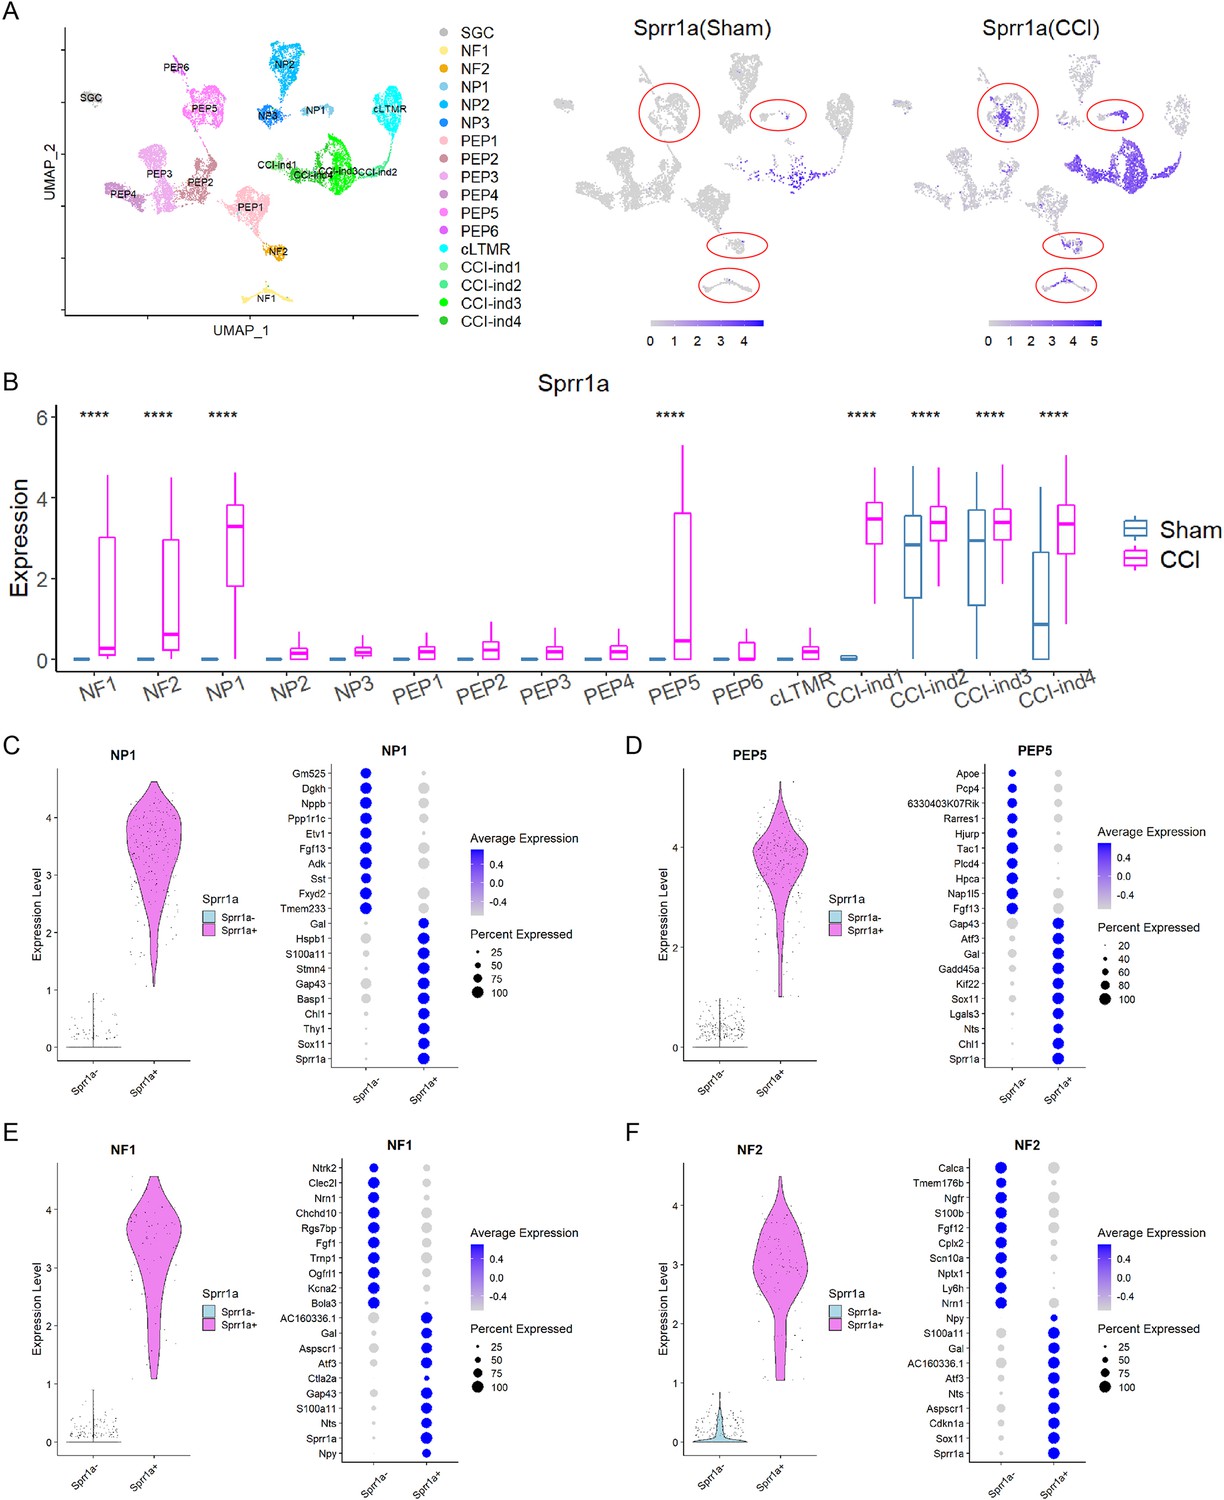
Transcriptional program changes in different neuronal clusters after sciatic nerve chronic constriction injury (CCI).
(A) Left: The identities of 17 clusters of dorsal root ganglion (DRG) cells visualized by uniform manifold approximation and projection (UMAP). Right: UMAP displays distinct expression patterns of Sprr1a, an injury-induced gene, in cells of NP1, PEP5, NF1, and NF2 clusters (indicated by red circles). Each of these clusters contained Sprr1a+and Sprr1a- cells, resulting in two subpopulations. (B) Box plots show that Sprr1a expression was statistically different between sham and CCI groups in only four standard neuronal clusters (NP1, PEP5, NF1, and NF2), suggesting a subtype-specific expression profile in sham and CCI groups. We selected clusters (NF1, NF2, NP1, PEP5, CCI-ind1, CCI-ind2, CCI-ind3, CCI-ind4) with normalized unique molecular identifier (UMI) expression >1 in sham and CCI conditions for statistical analysis. n=330 (NF1), 180 (NF2), 190 (NP1), 806 (PEP5), 28 (CCI-ind1), 70 (CCI-ind2), 138 (CCI-ind3), and 64 (CCI-ind4) for clusters in sham condition, and n=202, 215, 258, 631, 369, 351, 1188, 638 for these clusters in CCI condition. Student’s t-test, ****p<0.0001 versus sham. (C–F) Left: Two subpopulations (Sprr1a+, Sprr1a-) of cells in NP1 (C), PEP5 (D), NF1 (E), and NF2 (F) clusters were separated based on the expression of Sprr1a. Right: Top 10 DEGs in Sprr1a+and Sprr1a- subpopulations of NP1, PEP5, NF1, and NF2 clusters.
Figure 3—figure supplement 1
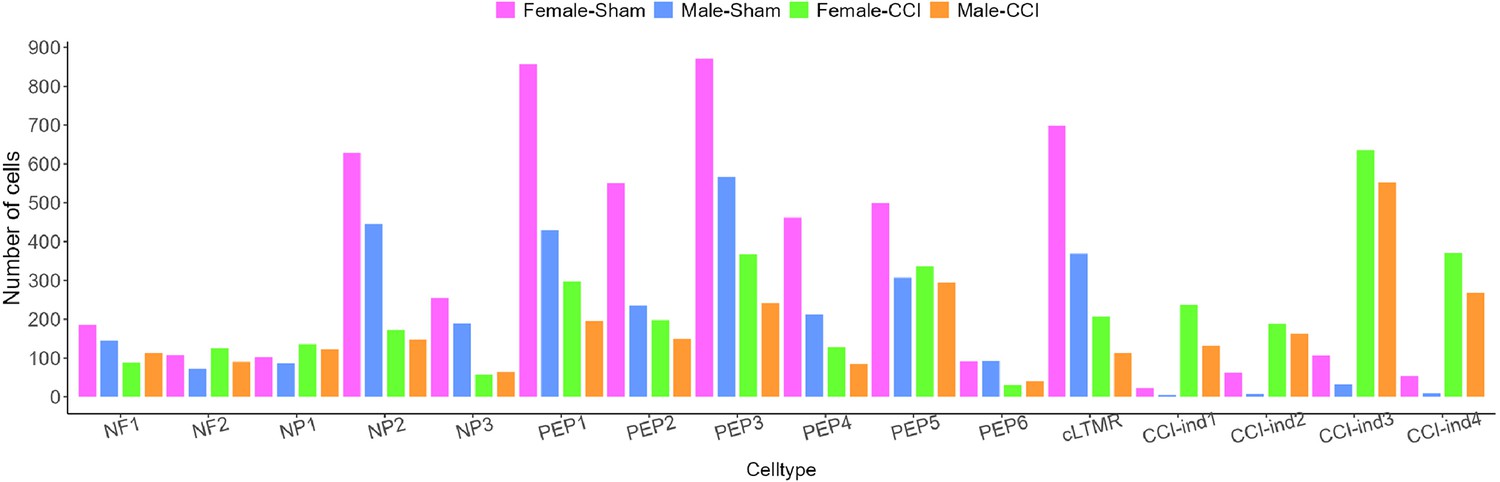
Cell number of each neuronal cluster in the four datasets.
Figure 4 with 1 supplement
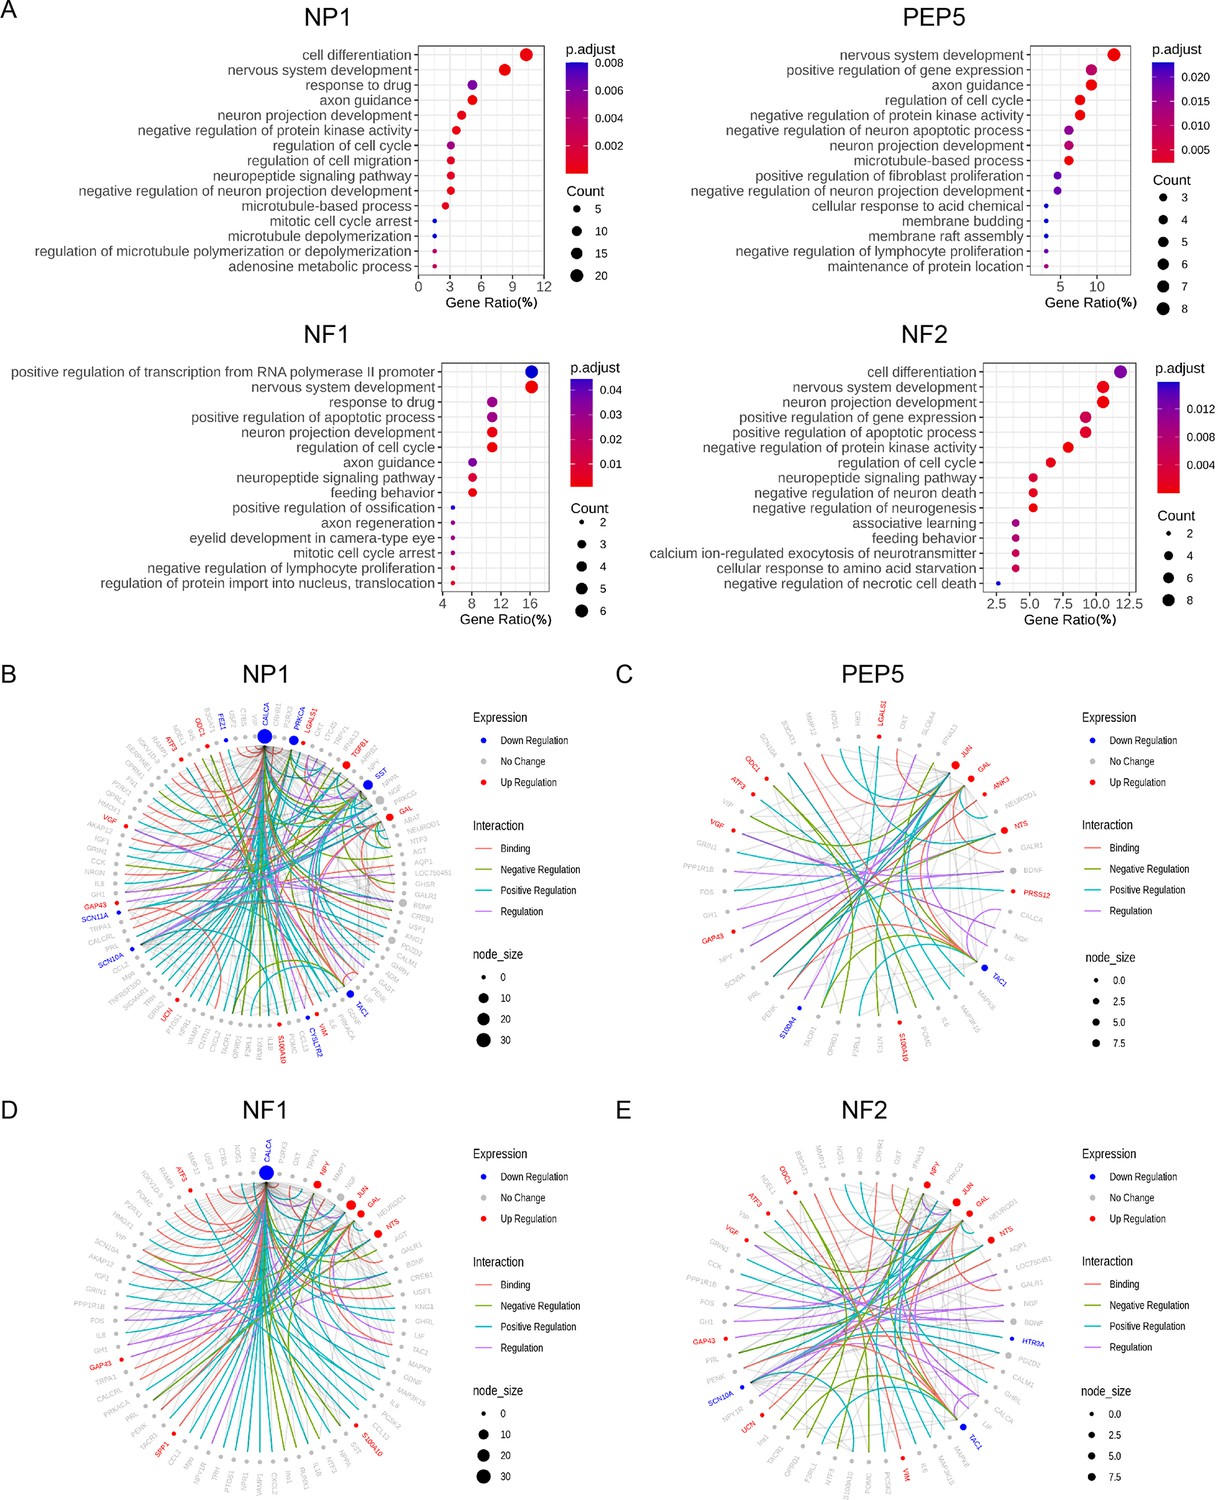
Gene ontology analysis of chronic constriction injury (CCI)-induced differentially expressed genes (DEGs) and pain-related protein-protein interaction (PPI) networks in NP1, PEP5, NF1, and NF2 clusters.
(A) Gene ontology analysis of biological processes enriched by CCI-induced DEGs in NP1, PEP5, NF1, and NF2 clusters. (B–E) The neuropathic pain-specific PPI networks of CCI-induced DEGs in NP1, PEP5, NF1, and NF2 clusters. Colored edges mark the type of interaction. Colored nodes mark the expression changes after CCI. Node size indicates the number of interactions against pain interactome.
Figure 4—figure supplement 1
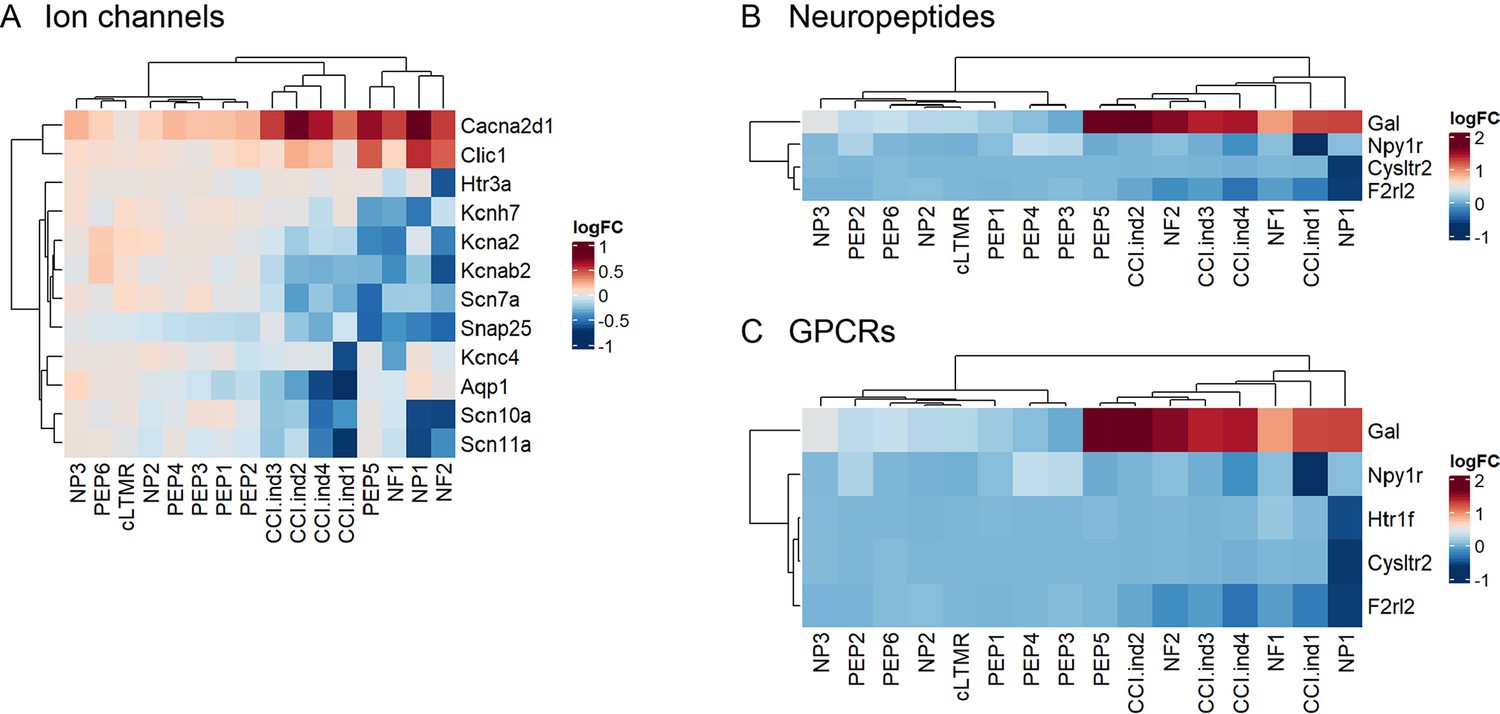
Chronic constriction injury (CCI) altered the expression of genes that encode ion channels, neuropeptides, and G-protein-coupled receptors (GPCRs) in dorsal root ganglion (DRG) neurons.
(A–C) Heatmaps of the log2FC (fold-change) (each cluster of CCI compared to that of sham) of select genes encoding ion channels (A), neuropeptides (B), and GPCRs (C). Genes shown on the heatmap are significantly regulated after CCI.
Figure 5
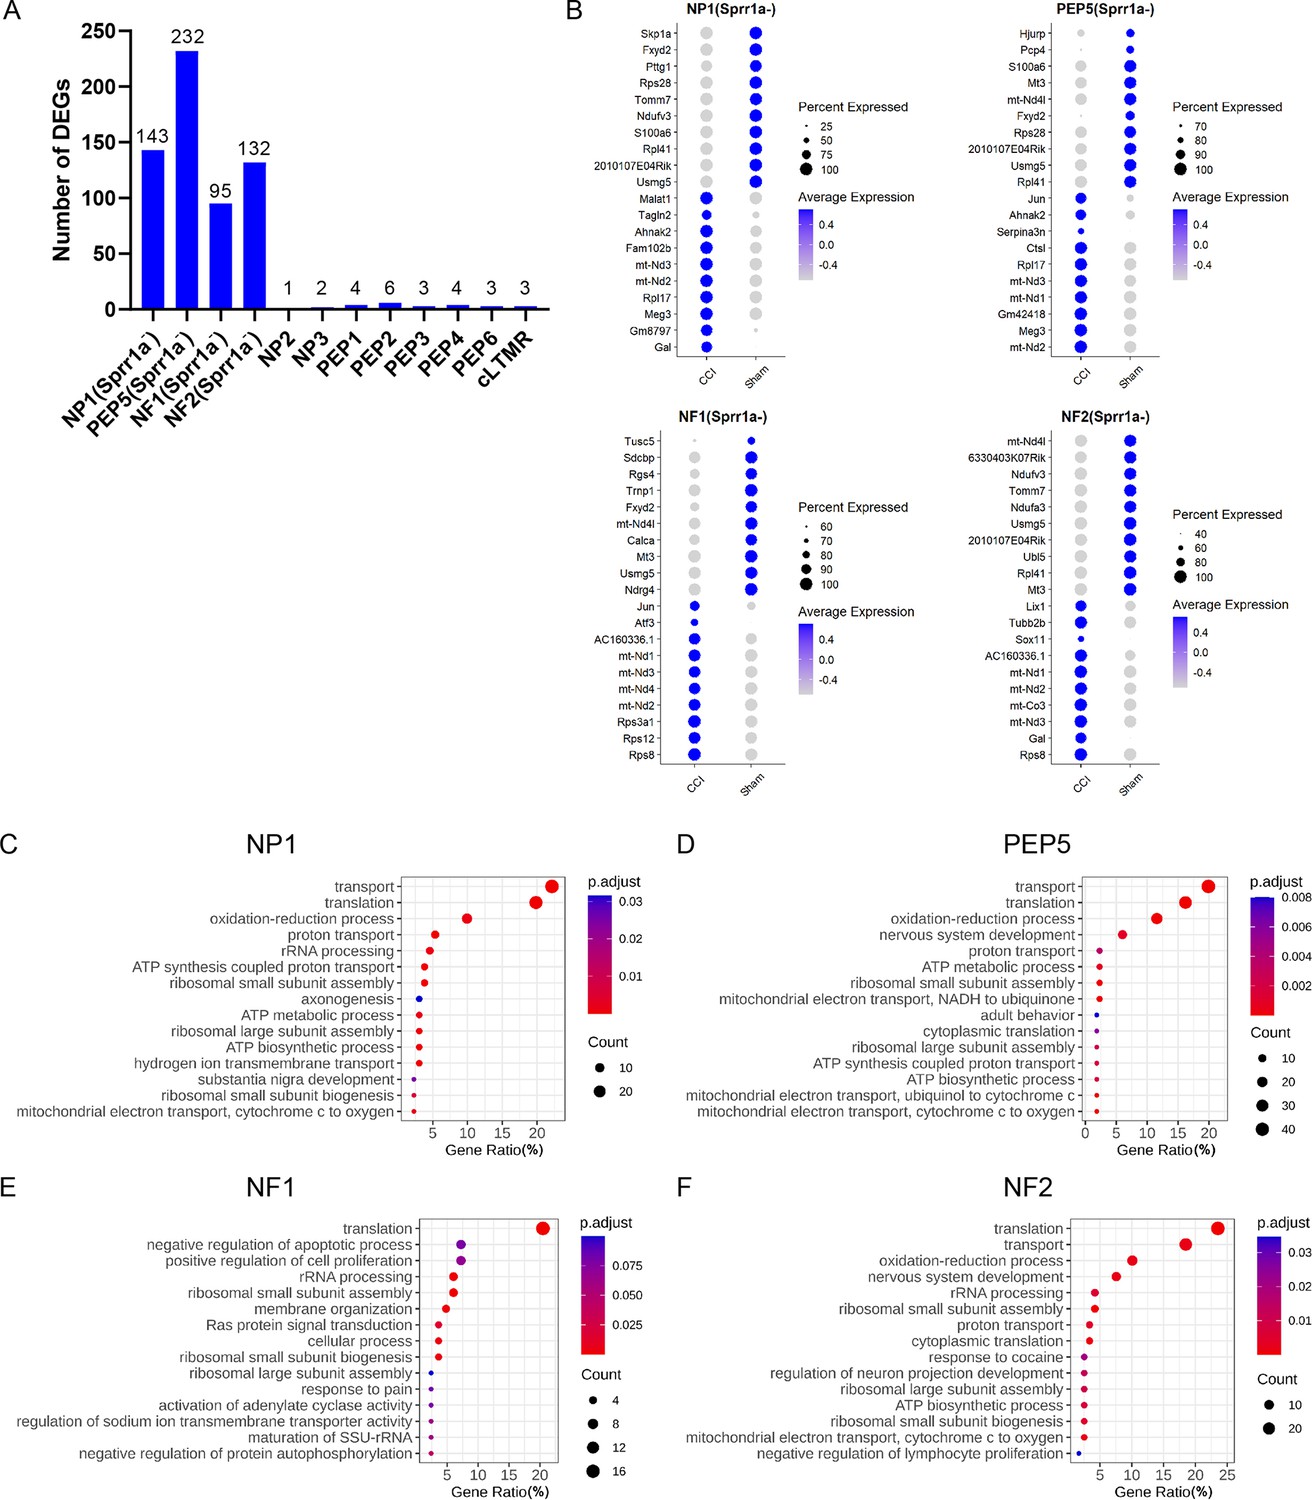
Gene ontology analysis of chronic constriction injury (CCI)-induced differentially expressed genes (DEGs) in the Sprr1a- subpopulation of NP1, PEP5, NF1, and NF2 clusters.
(A) The bar graph shows the number of DEGs induced by CCI in Sprr1a- neurons of each cluster. (B) Top 10 marker genes of Sprr1a- neurons in NP1, PEP5, NF1, and NF2 clusters of CCI and sham groups. (C–F) Gene ontology analysis of CCI-induced DEGs in Sprr1a- neurons in NP1 (C), PEP5 (D), NF1 (E), and NF2 (F) clusters.
Figure 6 with 1 supplement
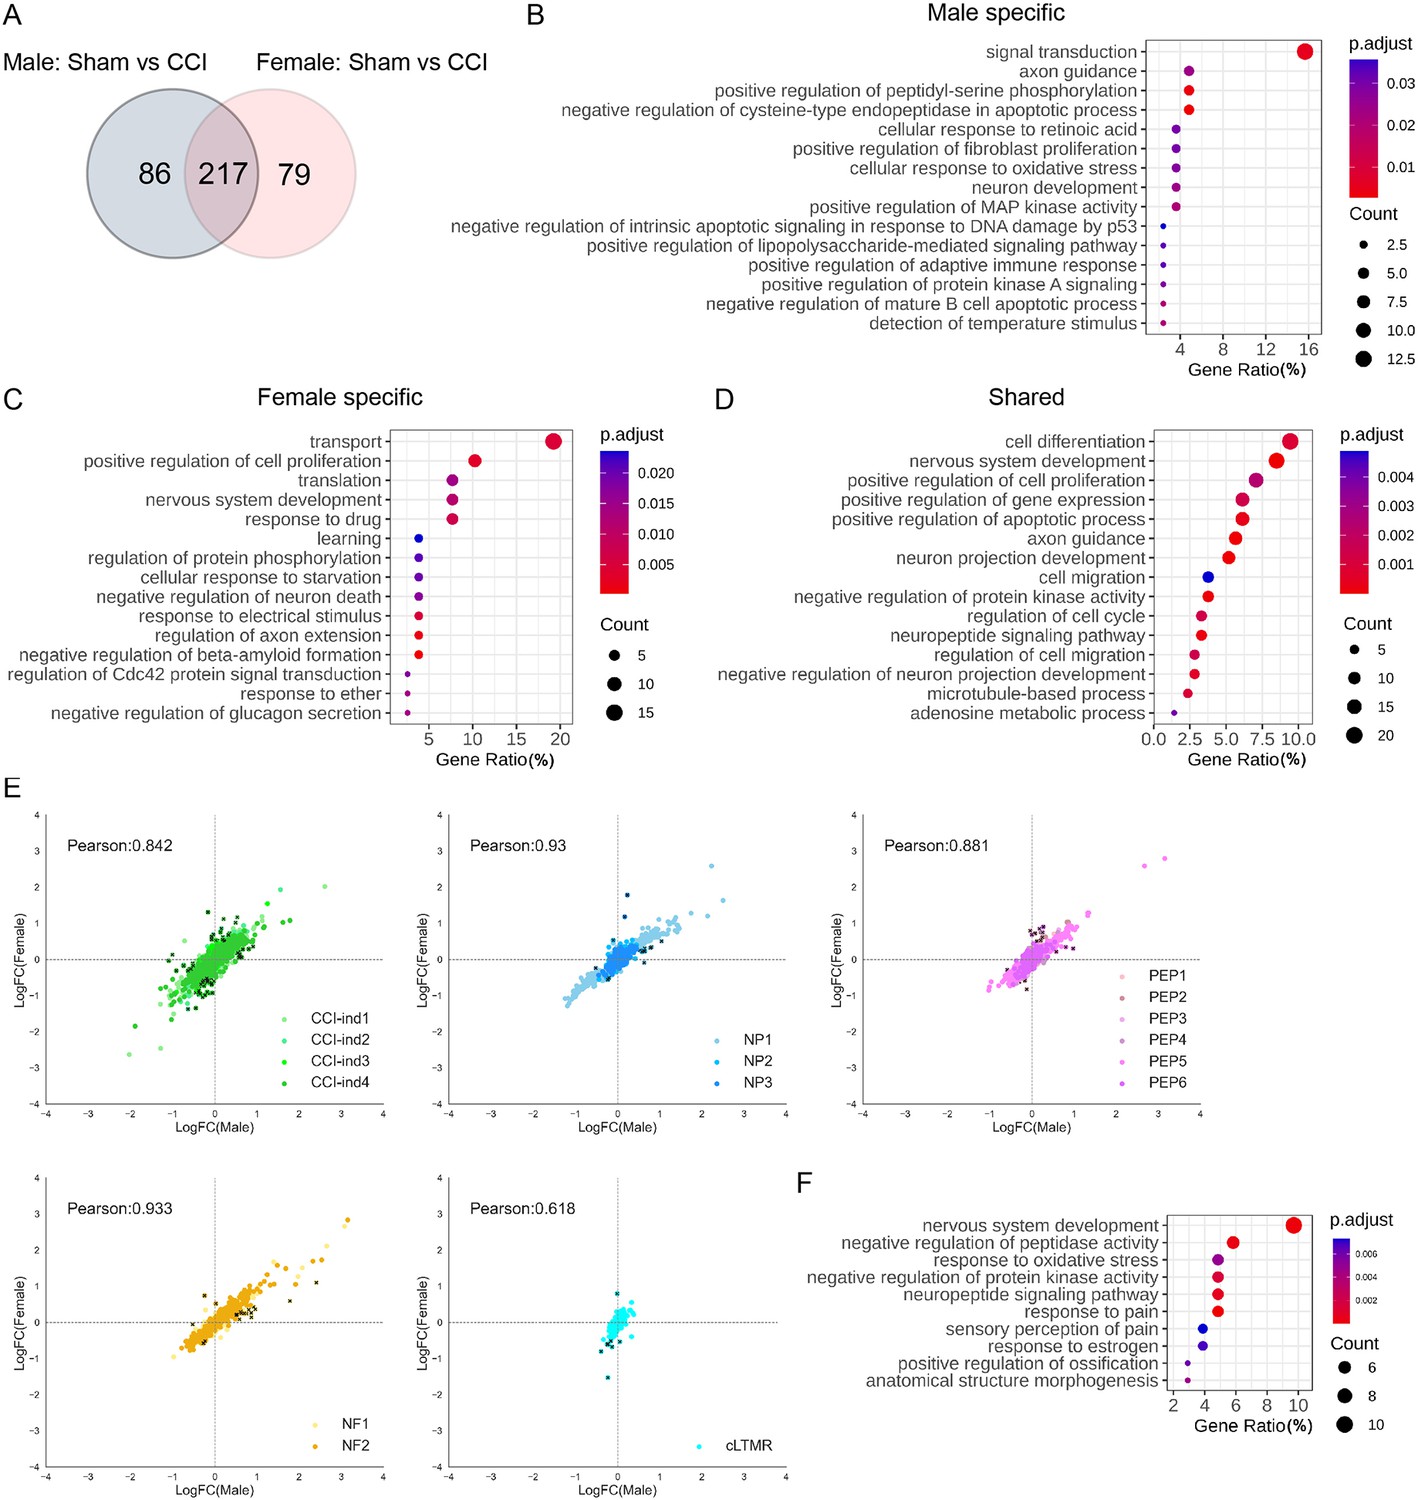
Comparisons of transcriptional changes between female and male mice after chronic constriction injury (CCI).
(A) The Venn diagram shows the number of genes that were differentially expressed between CCI and sham in male and female mice. (B–D) Gene ontology pathways that are associated with differentially expressed genes (DEGs) in male mice (B), female mice (C), and both male and female mice (D). (E) Pearson correlations based on the fold-change of 382 DEGs after CCI in CCI-ind clusters, NP, PEP, NF, and cLTMR. Black dots represent 106 genes that showed >2-fold differences between female and male mice. (F) Gene ontology analysis of the 106 genes from panel E.
Figure 6—figure supplement 1
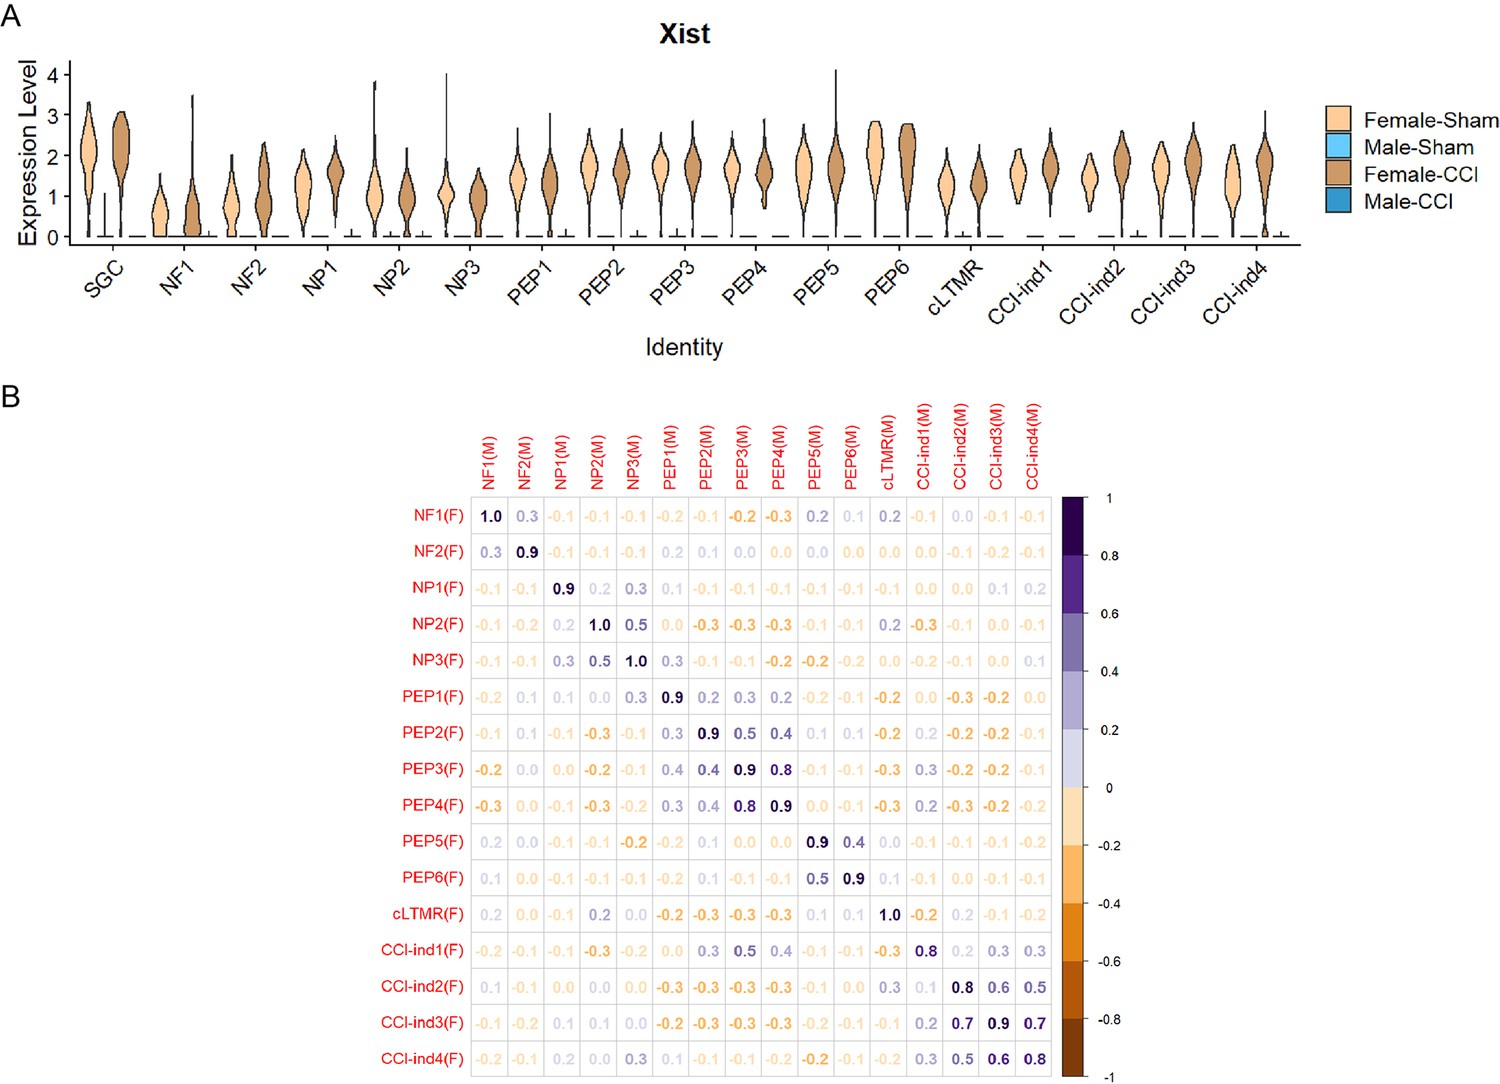
Comparisons of specific differentially expressed genes (DEGs) between female and male mice after chronic constriction injury (CCI).
(A) Violin plot shows the expression levels of X inactive-specific transcript (Xist) in each cell cluster in the four groups/datasets. (B) Pearson correlation of each neuronal cluster between Male-Sham and Female-Sham mice, based on whole transcript counts. The scale on the right indicates the interpretations of different colors. The different shades of blue represent a positive correlation coefficient while the different shades of brown represent a negative correlation coefficient.
Figure 7 with 2 supplements
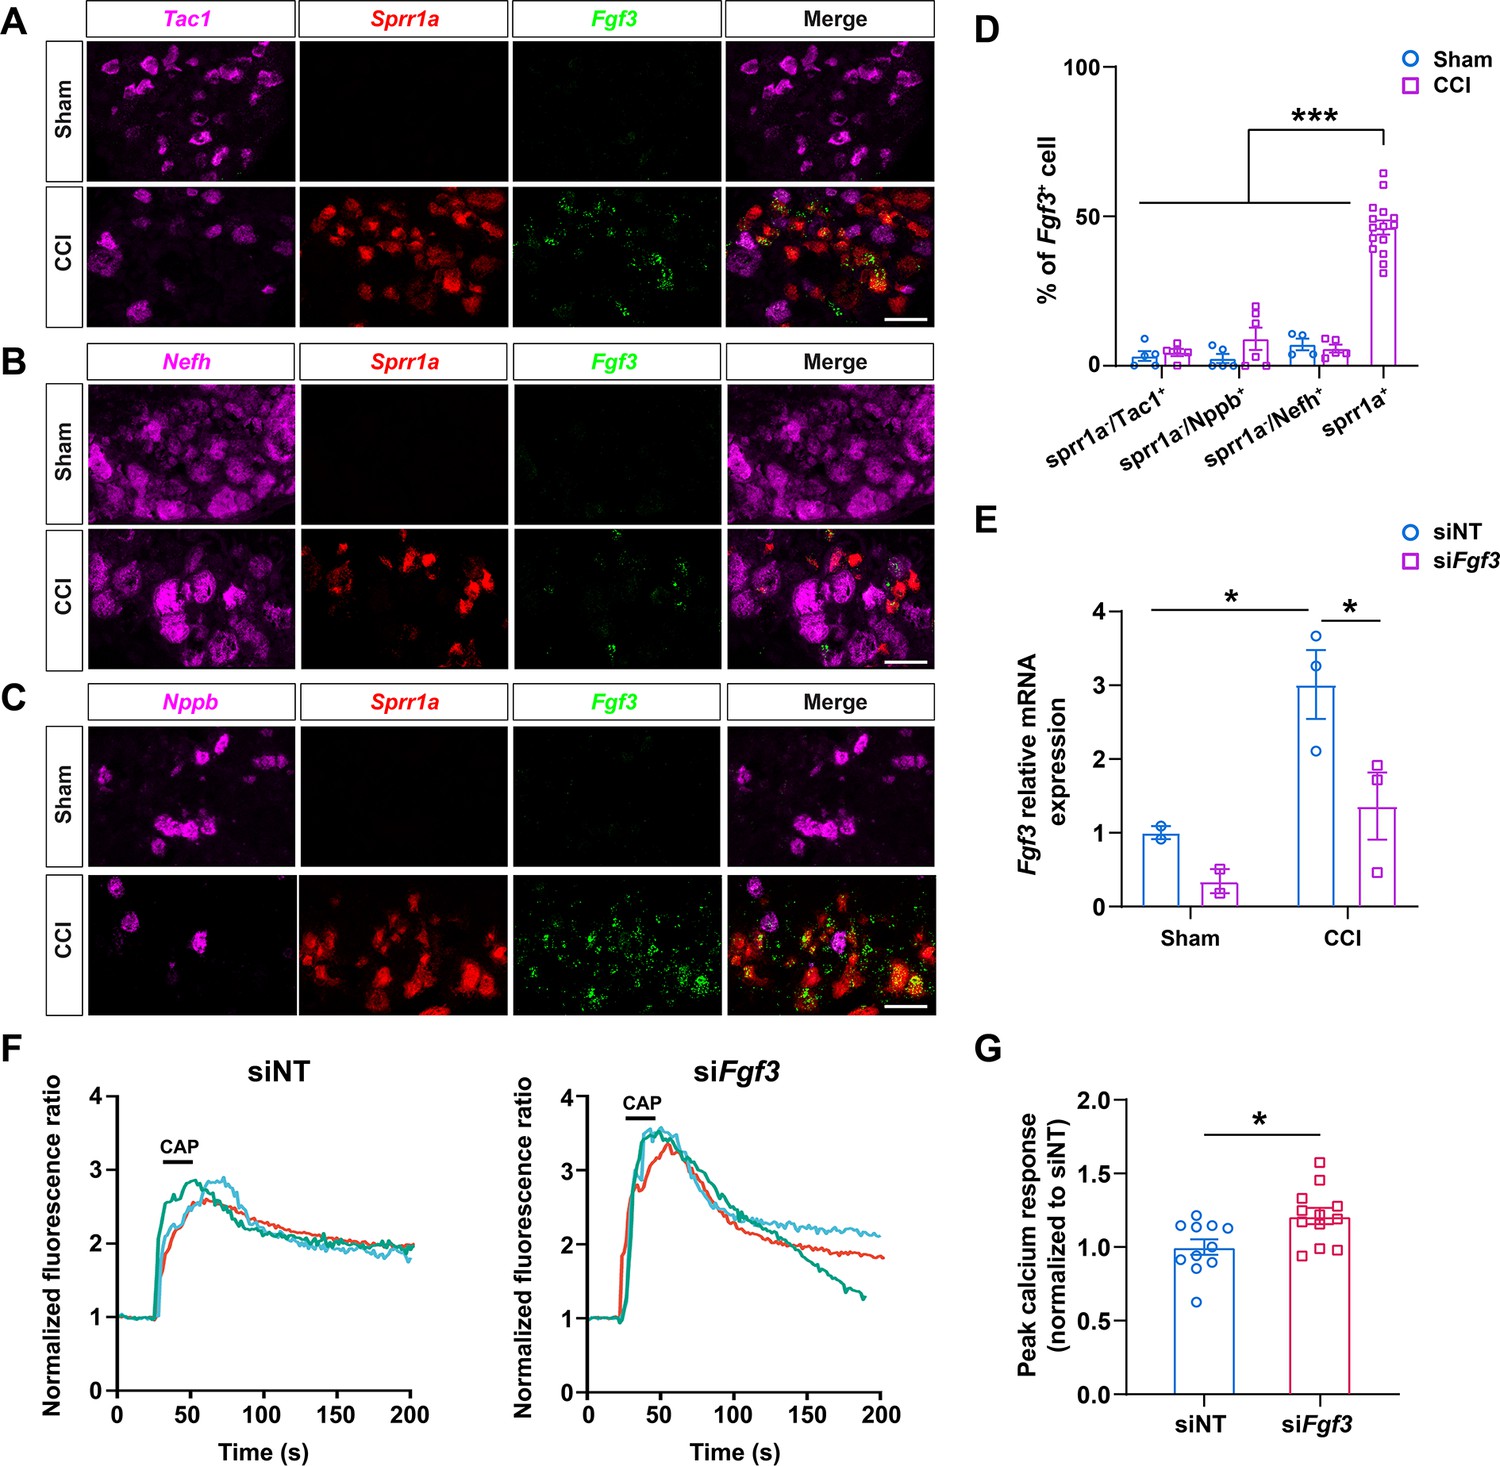
The distribution and functional examination of Fgf3 in mouse dorsal root ganglion (DRG) neurons.
(A–C) Representative RNAscope in situ hybridization images of lumbar DRGs from sham-operated (Sham) and chronic constriction injury (CCI) mice stained with probes against Fgf3 (green), Sprr1a (red, an injury marker), and different cell subtype markers Tac1(A), Nefh (B), and Nppb (C) (magenta). Scale bar, 50 μm. (D) Quantification of labeled cells as the percentage of Fgf3+ cells. (n=316, 278, 106 for Sprr1a-/Tac1+, Sprr1a-/Nefh+, Sprr1a-/Nppb+ cells from four sham-operated mice; n=252, 360, 88 for Sprr1a-/Tac1+, Sprr1a-/Nefh+, and Sprr1a-/Nppb+ cells, and n=1771 for Sprr1a+ cells from four CCI mice). One-way analysis of variance (ANOVA) followed by Bonferroni post hoc test. Data are expressed as mean ± SEM, ***p<0.001 versus indicated groups. (E) The levels of Fgf3 mRNA in cultured DRG neurons from sham-operated (n=2) and CCI mice (n=3) were assayed by qPCR. DRG neurons were transfected with siRNA specifically targeting Fgf3 (siFgf3, 0.2 nmol) or non-targeting siRNA (siNT) as control. Two-way ANOVA followed by Bonferroni post hoc test. Data are expressed as mean ± SEM, *p<0.05 versus siNT in sham group and siFGF3 in CCI group. (F) Representative traces of calcium responses to capsaicin (0.3 μM, bath application) in cultured DRG neurons from CCI mice. Before in vitro calcium imaging, DRG neurons were treated with either siFgf3 (0.2 nmol) or siNT control. (G) The quantification of evoked calcium responses to capsaicin in each group (siFgf3: n=12 coverslips with 263 neurons; siNT: n=11 coverslips with 193 neurons). Student’s t-test. Data are expressed as mean ± SEM, *p<0.05 versus siNT.
Figure 7—figure supplement 1
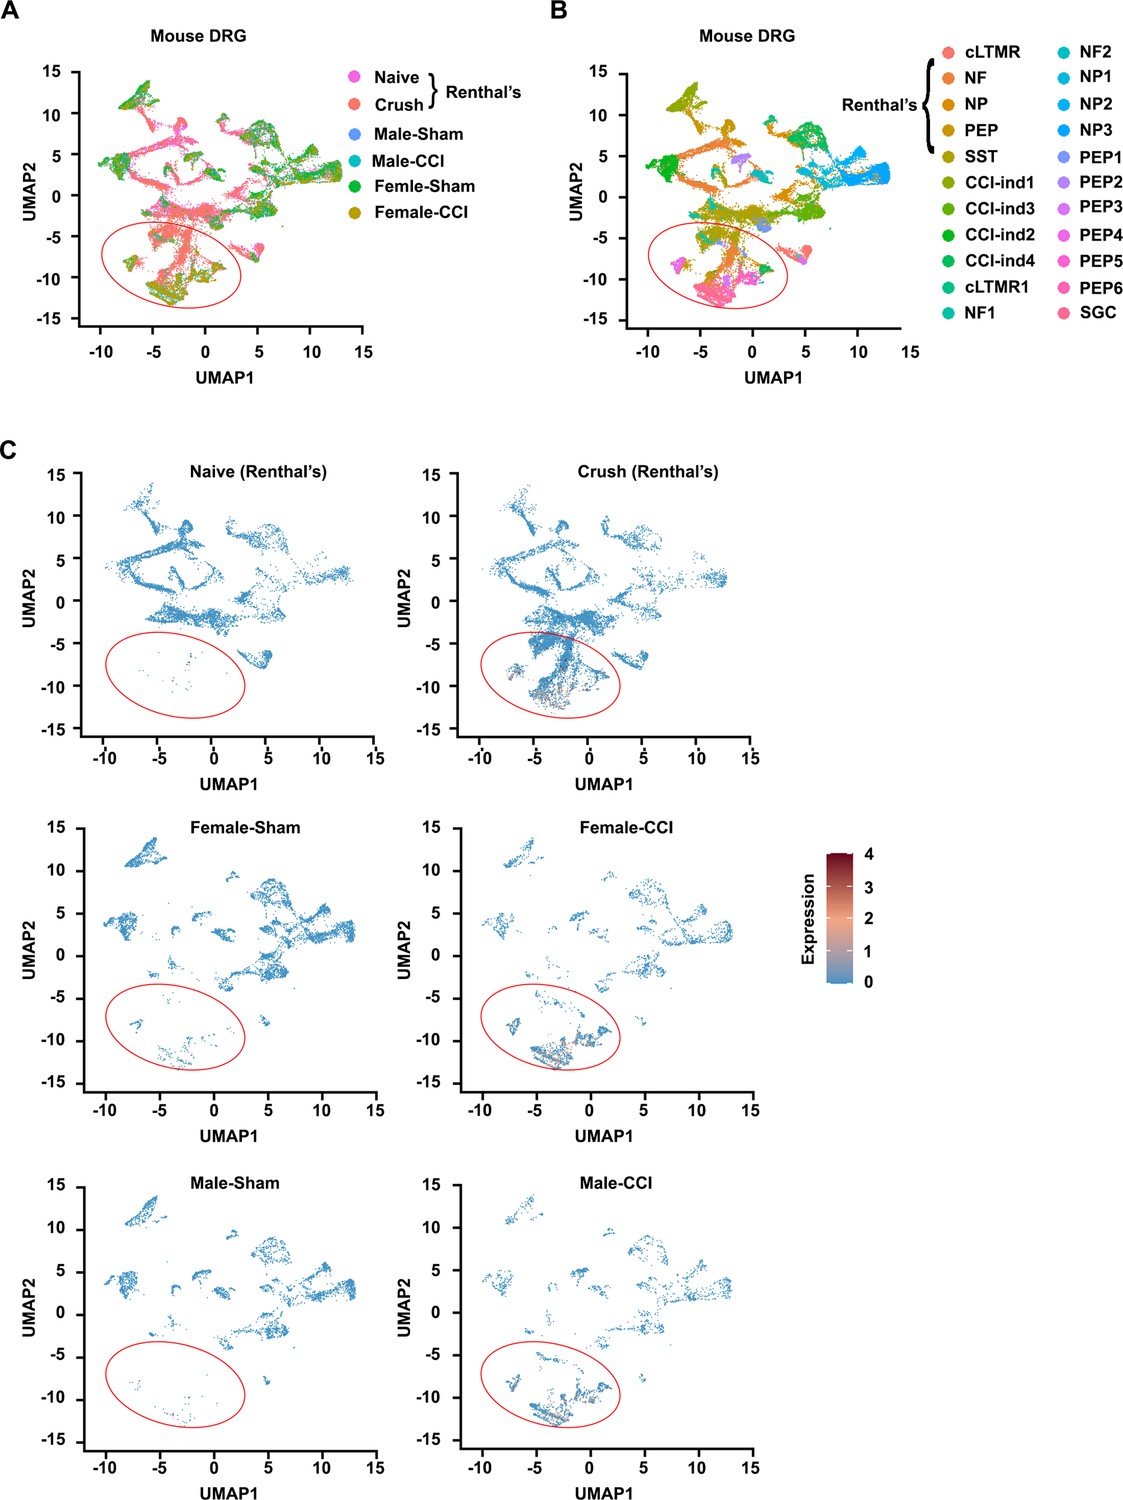
The Fgf3 expression was increased in nerve injury-induced new neuronal clusters.
(A) Integration of two datasets from Renthal’s study (Crush, Naïve) and four datasets from the current study (Male-CCI, Female-CCI, Male-Sham, Female-Sham), visualized by UMAP. Different colors represent cells from different datasets/groups. The new clusters that emerged after nerve injury (i.e., injury-induced new clusters) were indicated with a red circle, and were prominent in three injury groups (Crush, Male-CCI, Female-CCI) but were minimal in naïve and sham groups (Naïve, Male-Sham, Female-Sham). (B) Twenty-two distinct cell clusters were identified by Seurat, including five neuronal clusters from Renthal’s datasets (cLTMR, NF, NP, PEP, SST) and seventeen clusters from our datasets (SGC, NF1-2, NP1-3, PEP1-6, cLTMR, and CCI-ind1-4 clusters). (C) Feature heatmaps show the expression patterns of Fgf3 in different clusters of six datasets. The color scale indicates the normalized expression level of Fgf3. The increased Fgf3 expression (e.g., brown dots) occurred mainly in injury-induced new clusters in the Crush, Male-CCI, and Female-CCI datasets. UMAP, uniform manifold approximation and projection; cLTMR, C low-threshold mechanoreceptors; NF, Aβ low-threshold mechanoreceptors; NP, non-peptidergic nociceptors; PEP, peptidergic nociceptors; SST, somatostatin (SST)-expressing itch-sensing neurons; CCI, chronic constriction injury.
Figure 7—figure supplement 2
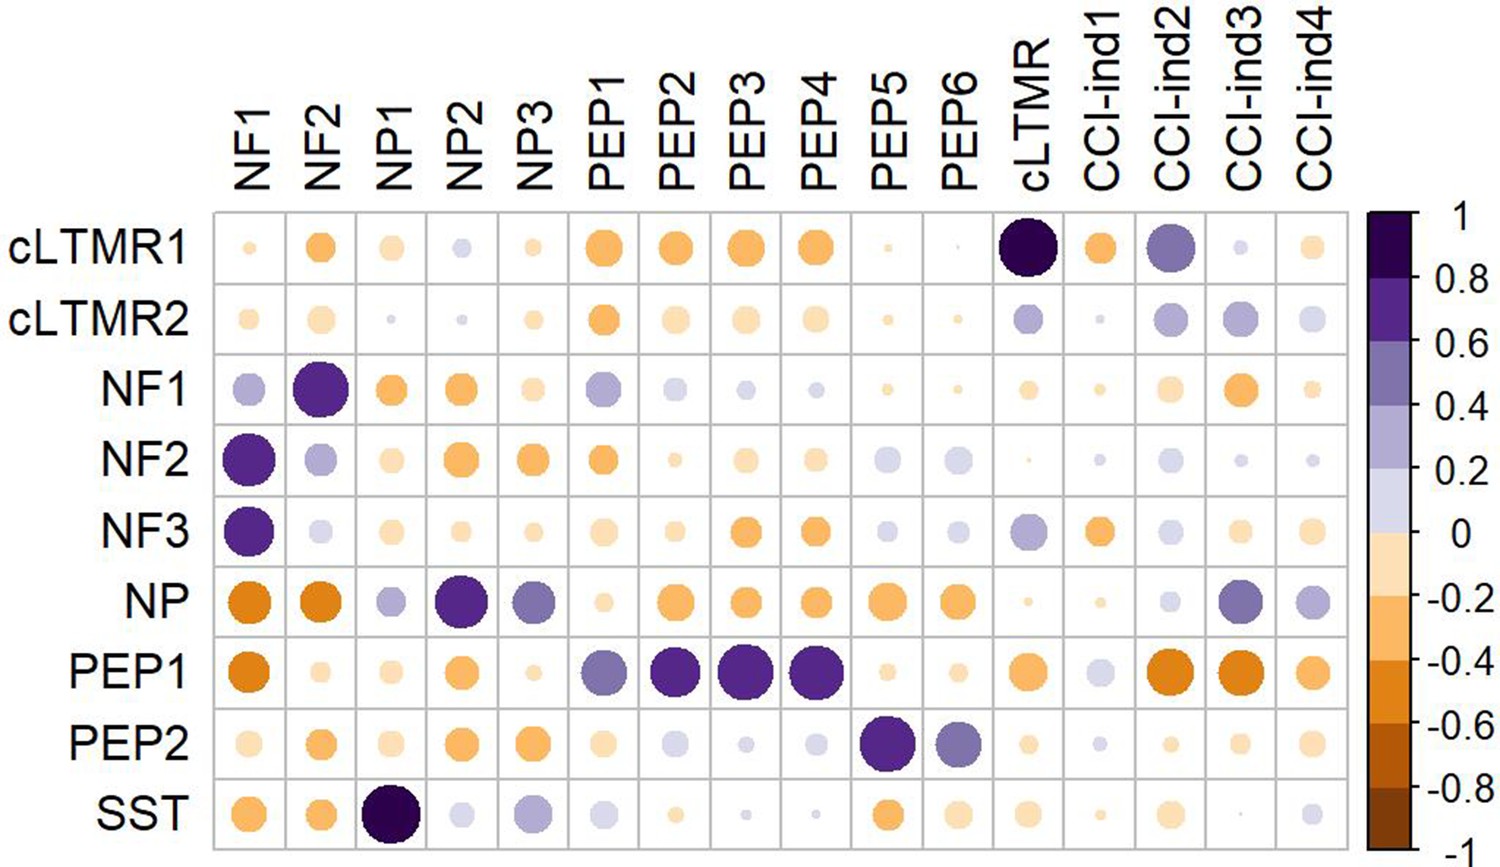
Correlation analysis between dorsal root ganglion (DRG) neuronal clusters identified in our study and those from Renthal’s study.
Heatmap shows correlation matrix of DRG neuronal clusters between our study (X-axis) and Renthal’s study (Y-axis). The correlations were calculated by the Pearson method. The color of the circles corresponds to Pearson correlation coefficient. The scale on the right indicates the interpretations of different colors. The different shades of blue represent a positive correlation coefficient while the different shades of brown represent a negative correlation coefficient. The sizes of circles represent absolute values of the Pearson coefficients.
Additional files
-
Supplementary file 1
Top 50 conserved marker genes in 16 neuronal clusters (related to Figure 1).
- https://cdn.elifesciences.org/articles/76063/elife-76063-supp1-v2.xlsx
-
Supplementary file 2
Quality control metrics (related to Figure 1).
- https://cdn.elifesciences.org/articles/76063/elife-76063-supp2-v2.xlsx
-
Supplementary file 3
Differentially expressed genes in NP1, PEP5, NF1, and NF2, comparing chronic constriction injury (CCI) with Sham (padj <0.05) (related to Figure 4).
- https://cdn.elifesciences.org/articles/76063/elife-76063-supp3-v2.xlsx
-
Supplementary file 4
Nineteen differentially expressed genes shared by NP1, PEP5, NF1, and NF2, comparing chronic constriction injury (CCI) with Sham (related to Figure 4).
- https://cdn.elifesciences.org/articles/76063/elife-76063-supp4-v2.xlsx
-
Supplementary file 5
Differentially expressed genes in Sprr1a- neurons of NP1, PEP5, NF1, and NF2, comparing chronic constriction injury (CCI) with Sham (padj <0.05) (related to Figure 5).
- https://cdn.elifesciences.org/articles/76063/elife-76063-supp5-v2.xlsx
-
Supplementary file 6
Enriched pathways after chronic constriction injury (CCI) in NP1, PEP5, NF1, and NF2 with the corresponding genes (related to Figure 5).
- https://cdn.elifesciences.org/articles/76063/elife-76063-supp6-v2.xlsx
-
Supplementary file 7
Lists of chronic constriction injury (CCI)-induced differentially expressed genes (DEGs) including DEGs only in males, DEGs only in females, and DEGs shared by both males and females (padj <0.05, Log2fold-change >0.5) (related to Figure 6).
- https://cdn.elifesciences.org/articles/76063/elife-76063-supp7-v2.xlsx
-
Supplementary file 8
Enriched pathways with the 106 chronic constriction injury (CCI)-induced differentially expressed genes (DEGs) (related to Figure 6).
- https://cdn.elifesciences.org/articles/76063/elife-76063-supp8-v2.xlsx
-
Transparent reporting form
- https://cdn.elifesciences.org/articles/76063/elife-76063-transrepform1-v2.docx
Download links
A two-part list of links to download the article, or parts of the article, in various formats.
Downloads (link to download the article as PDF)
Open citations (links to open the citations from this article in various online reference manager services)
Cite this article (links to download the citations from this article in formats compatible with various reference manager tools)
scRNA-sequencing reveals subtype-specific transcriptomic perturbations in DRG neurons of PirtEGFPf mice in neuropathic pain condition
eLife 11:e76063.
https://doi.org/10.7554/eLife.76063


