Control of nuclear size by osmotic forces in Schizosaccharomyces pombe
- Department of Cell and Tissue Biology, University of California, San Francisco, United States
- Centro Andaluz de Biología del Desarrollo, Spain
- Institute for Systems Genetics, New York University Langone Health, United States
- Department of Mathematics and Volen Center for Complex Systems, Brandeis University, United States
Figures
Figure 1
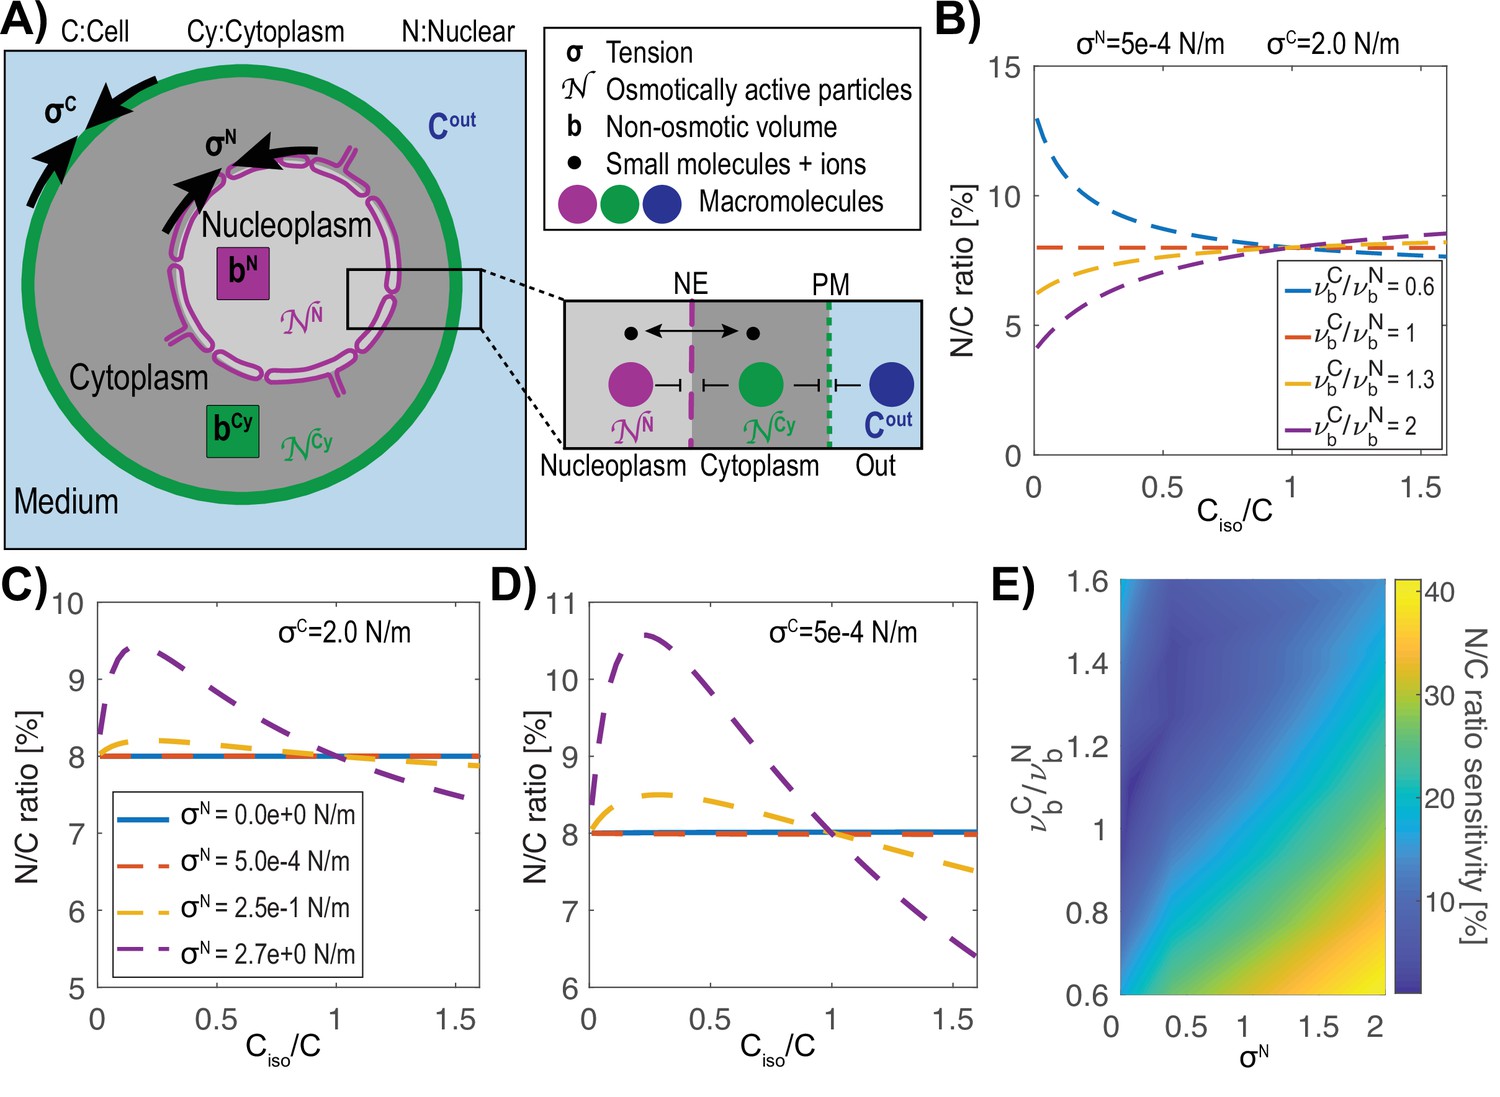
Model of the nucleus and the cell as “a vesicle within a vesicle”, osmotically challenged.
(A) Schematic of the model and parameters used in the mathematical model: membrane tension σ, non-osmotic volume b, number (N) of macromolecules that cannot freely cross either the cell or nuclear membranes, concentration of the buffer Cout. (B) Theoretical prediction of the effect of a change in the external concentration on the N/C ratio for various ratios of normalized cellular (νC) and nuclear (νN) non-osmotic volume values keeping the cell and nuclear membrane tensions (σC, σN) constant. (C) Predictions of osmotic shifts on the N/C ratio for various nuclear membrane tensions (σN), keeping a high cell tension (σC) constant. (D) Same as (C) keeping a low membrane tension. (E) Phase diagram of the N/C ratio sensitivity to osmotic shocks defined as [max(N/C ratio)-min(N/C ratio)] / (N/C ratioisotonic) for various ratios of non-osmotic volumes and nuclear membrane tension.
Figure 2 with 2 supplements
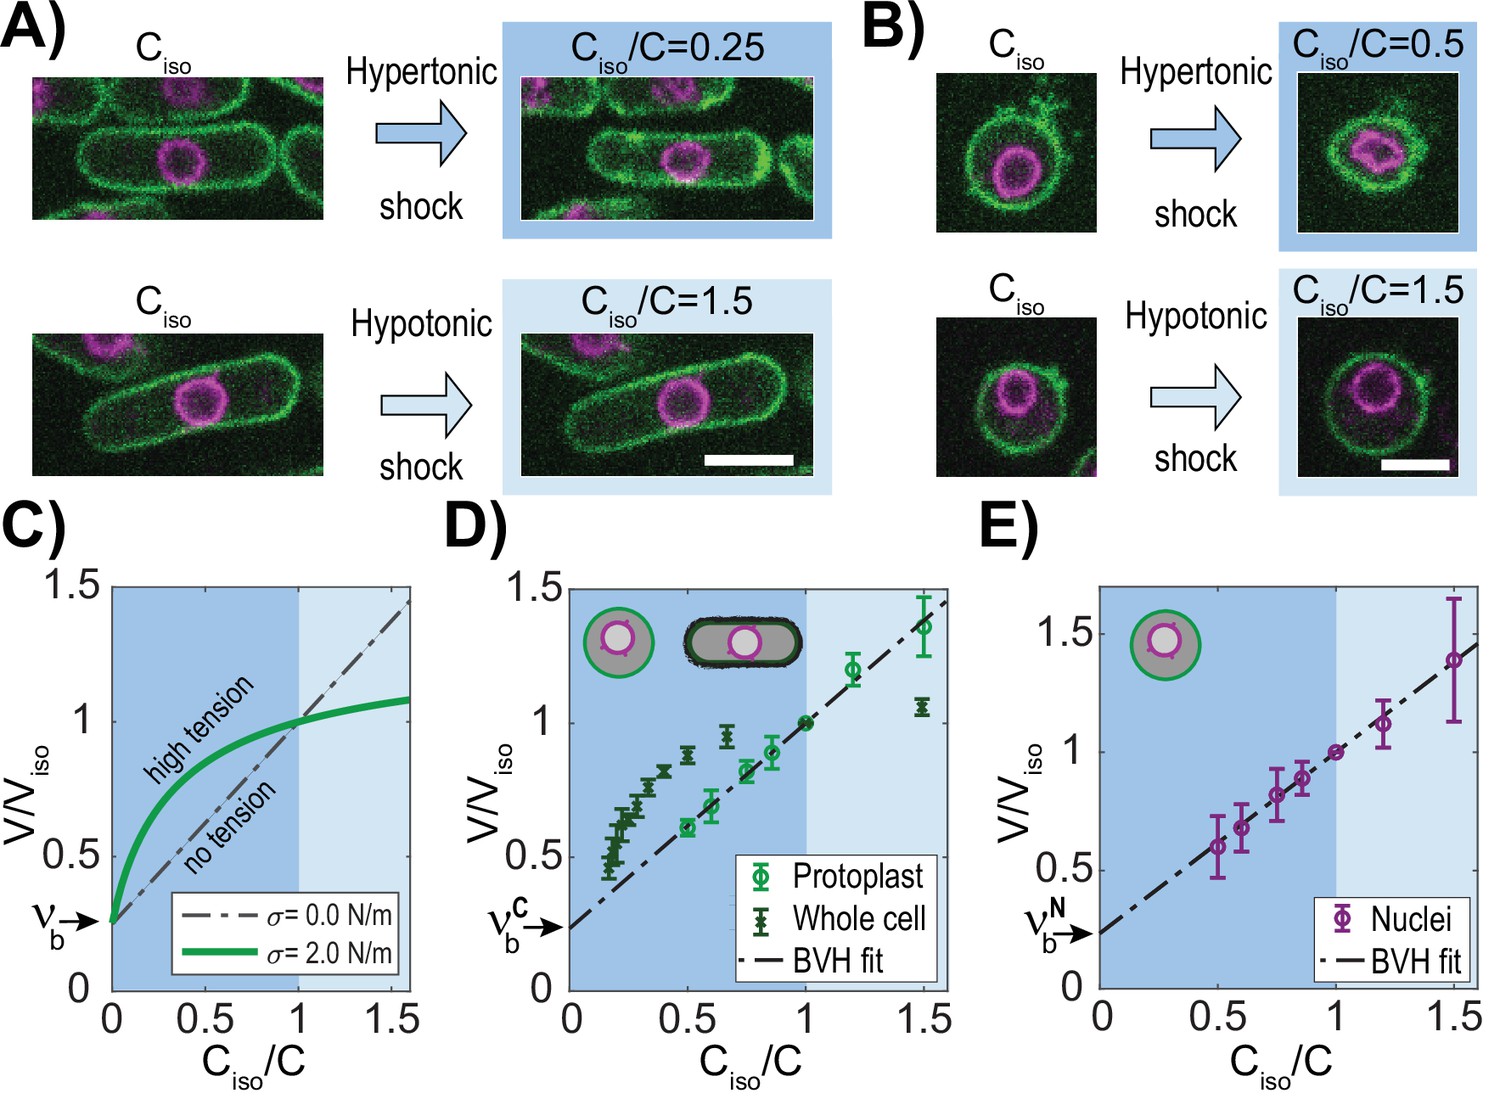
The fission yeast nucleus behaves as an ideal osmometer.
(A) Images of cells expressing a plasma membrane marker mCherry-Psy1 (green) and a nuclear envelope marker Ish1-GFP (purple). Individual cells in isotonic medium (Ciso) were shifted to hypertonic or hypotonic medium and imaged for 3D volume measurements (Materials and methods). (B) Images of individual protoplasts in response to hypertonic and hypotonic shifts. See also Figure 2—figure supplement 1. Scale bar = 5 µm. (C–E) BVH plots of the effects of osmotic shifts on the volume of the cell and nucleus. (C) Theoretical predictions of effects of osmotic concentration in the medium (Ciso/C) on the volume of a cell or nucleus with zero (black) or large (green) membrane tension (σ). Dashed line (black) depicts the behavior of an ideal osmometer in which there is no effect of membrane tension. (D) Effect of osmotic shifts on the relative volumes (V/Viso, mean ± STD) of whole fission yeast cells (N=707, three biological replicates) and protoplasts (N=441, from at least five biological replicates). (E) Effect of osmotic shifts on relative nuclear volume (V/Viso, mean ± STD) in protoplasts (N=441, from at least five biological replicates). Note that the response of nuclei fits to the predicted behavior of an ideal osmometer.
-
Figure 2—source data 1
BVH plots.
Related to Figure 2, Figure 3B–D, Figure 3—figure supplement 1B-J.
- https://cdn.elifesciences.org/articles/76075/elife-76075-fig2-data1-v2.xlsx
Figure 2—figure supplement 1
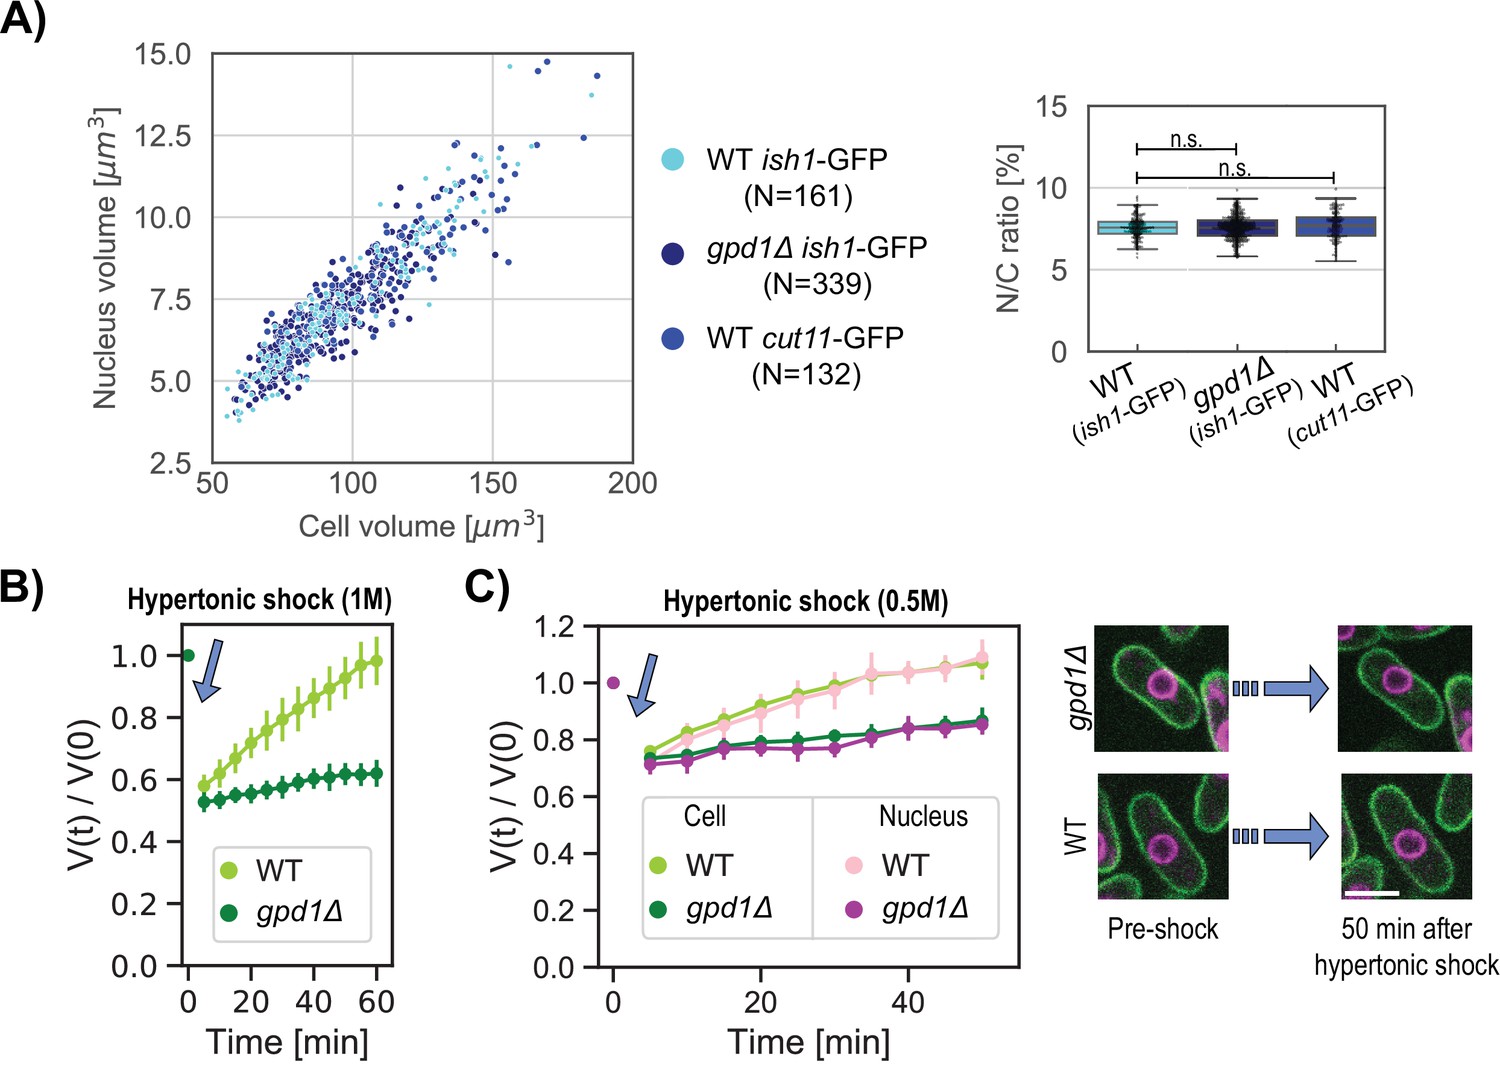
3D image analysis methods and use of an osmotic adaptation mutant allow for robust volume measurements.
Previous fission yeast cell studies estimated nuclear and cell volumes from length and single width measurements using assumptions of symmetric ellipsoid or cylindrical geometry (Facchetti et al., 2019; Kume et al., 2017; Lemière et al., 2021; Neumann and Nurse, 2007). As the shape of fission yeast cells are not perfectly symmetric ellipsoids, we determined volumes using a 3D segmentation approach (Machado et al., 2019). To minimize the adaptation responses to osmotic stress, most of these studies were done with cells with a gpd1∆ background, which is defective in glycerol synthesis responsible for the rapid volume adaptation to osmotic stresses (Hohmann, 2002). (A) N/C ratio is maintained in distinct cellular backgrounds. Scatter plot of cell size and nuclear size for asynchronous cells in growth medium. Right, Box and whisker plots of the N/C ratio for the three strains. Our 3D measurements of mean cell volume (97.5±27.1 µm3), nuclear volume (7.3±2.1 µm3), and the N/C ratio (7.5±0.8) of a population of asynchronous cells were consistent with previously reported values that used different image analysis methods. (Kume et al., 2017; Neumann and Nurse, 2007). For all box and whiskers plots, the horizontal line indicates the median, the box indicates the interquartile range (IQR) of the data set while the whiskers show the rest of the distribution within 1.5*IQR except for points that are defined as outliers. Statistical difference compared with an unpaired t-test. These data show that the N/C ratio measurements was not affected by the gpd1∆ background, or by use of different nuclear envelope markers ish1-GFP and cut11-GFP. (B&C) Time course of volume adaption in response to hyperosmotic shocks of 1 M sorbitol (B) and 0.5 M sorbitol (C). Normalized cell volume dynamics WT (chartreuse, N=12 cells) and gpd1Δ (green, N=12 cells) after 1 M sorbitol shock, mean ±STD. (C) Normalized cell and nucleus volume dynamics after 0.5 M sorbitol shock in WT (N=12) and gpd1Δ (N=10) background cells, mean values ±STD. These measurements of volume adaption enabled us to define time windows in which acute volume changes can be measured.
-
Figure 2—figure supplement 1—source data 1
N/C ratio comparison.
Related to Figure 2—figure supplement 1.
- https://cdn.elifesciences.org/articles/76075/elife-76075-fig2-figsupp1-data1-v2.xlsx
-
Figure 2—figure supplement 1—source data 2
WT - gpd1∆ background cells volumes over time after a hyper-osmotic shock.
Related to Figure 2—figure supplement 1.
- https://cdn.elifesciences.org/articles/76075/elife-76075-fig2-figsupp1-data2-v2.xlsx
-
Figure 2—figure supplement 1—source data 3
WT - gpd1∆ background cells and nuclei volumes over time after a hyper-osmotic shock.
Related to Figure 2—figure supplement 1.
- https://cdn.elifesciences.org/articles/76075/elife-76075-fig2-figsupp1-data3-v2.xlsx
Figure 2—figure supplement 2
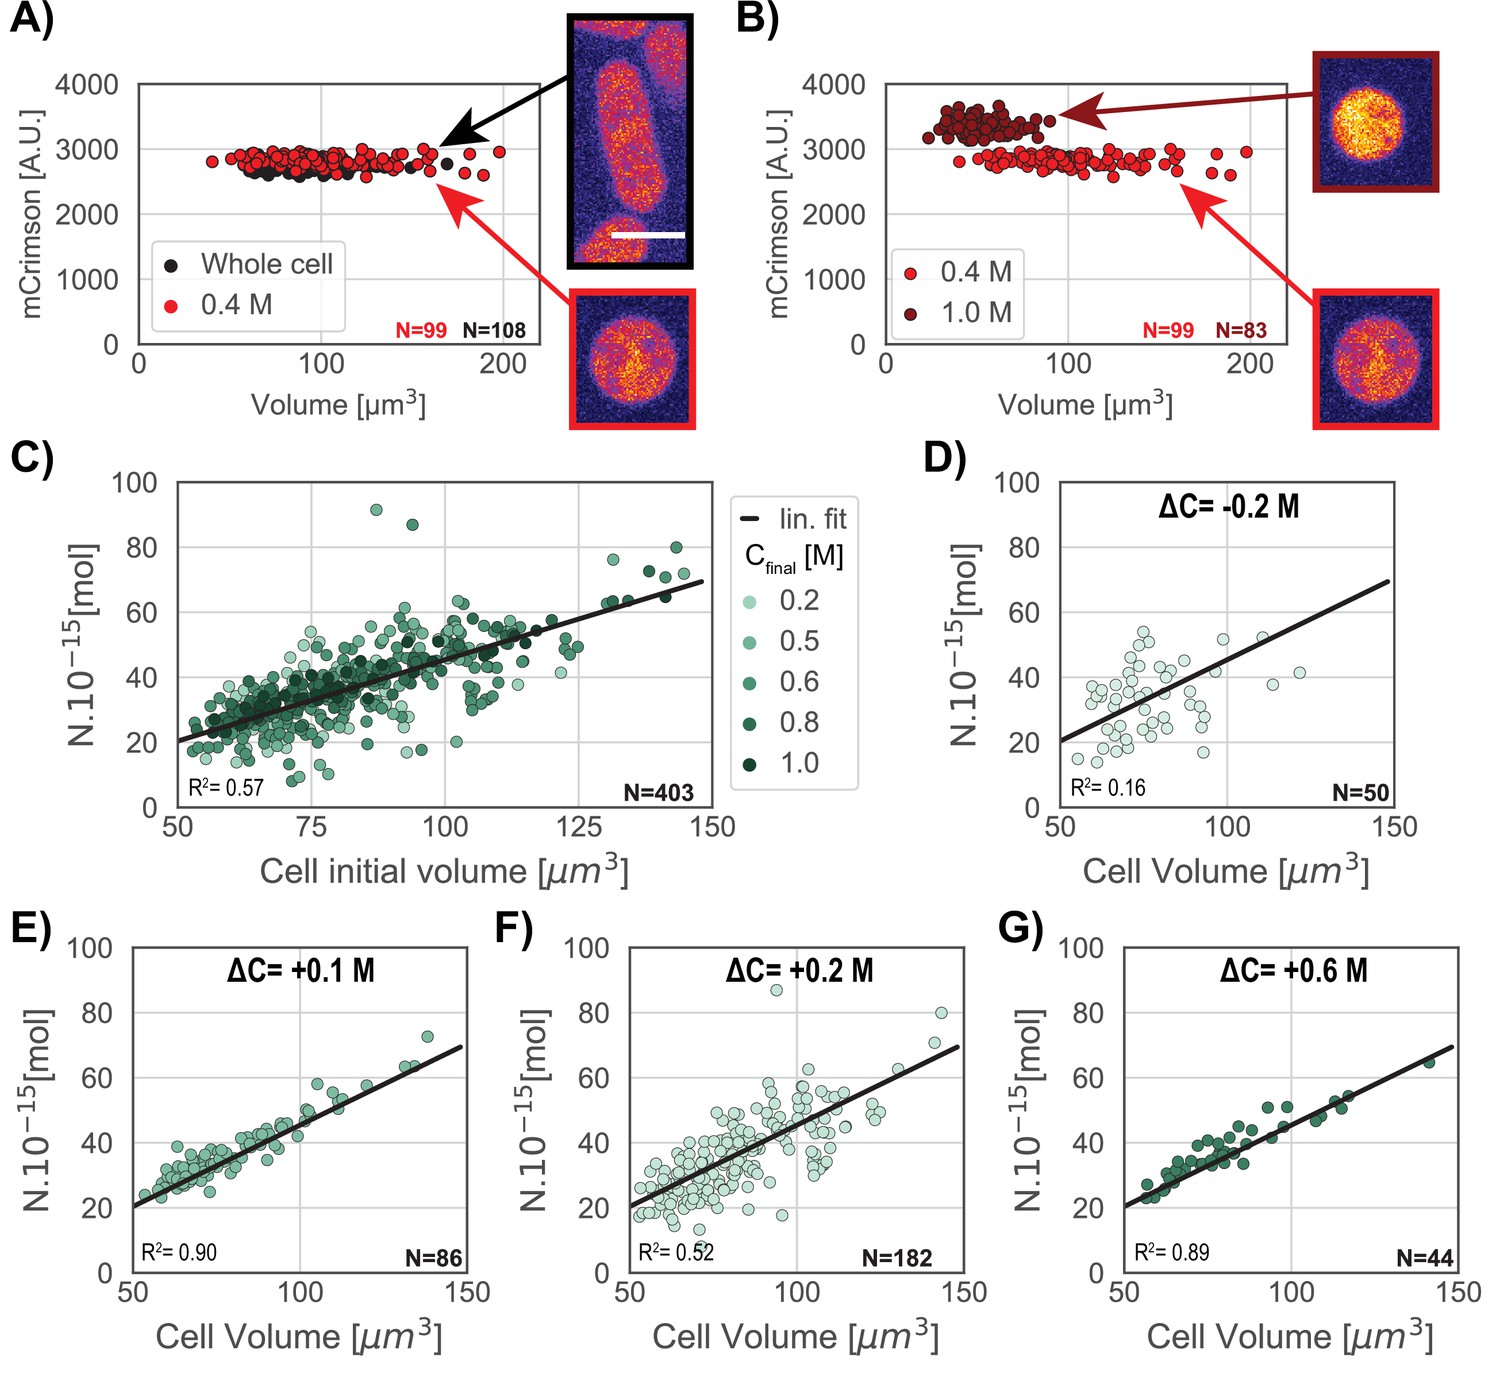
Additional evidence that protoplasts behave as ideal osmometers.
(A) Defining an isotonic medium for protoplasts. The osmotic pressure of the medium changes the protoplasts’ volume and concentration of proteins due to addition or removal of water from the cell. To assess cytoplasmic concentration, we monitored fluorescence intensity of a protein E2-mCrimson expressed from the ACT1 promoter, which has been shown to normally maintain a largely constant concentration in whole cells throughout the cell cycle (Al-Sady et al., 2016; Knapp et al., 2019). mCrimson fluorescence intensity and cellular volume in a population of whole cells in isotonic medium (black) were similar to those of protoplasts in same medium supplemented with 0.4 M sorbitol (red), demonstrating that this is the isotonic condition for these protoplasts. Right panels, mid focal plane image of a cell (top) and protoplast (bottom) expressing mCrimson. (B) In contrast, comparison of mCrimson fluorescence intensities in protoplasts in 1 M sorbitol (dark red) and 0.4 M sorbitol (red), showed that 1 M sorbitol led to higher protein concentration than in isotonic conditions. (C–G) Number of intracellular osmolytes (N) was measured as described in Methods. Consistent with an ideal osmometer, N is directly proportional to the change in cell volume under osmotic shocks. N is proportional to the cell initial volume and does not depend on the range of osmotic shock used to probe the cells (Methods). R2 values are R-squared values for linear regression. Scale bar = 5 µm.
-
Figure 2—figure supplement 2—source data 1
Cytoplasmic mCrimson concentration.
Related to Figure 2—figure supplement 2.
- https://cdn.elifesciences.org/articles/76075/elife-76075-fig2-figsupp2-data1-v2.xlsx
-
Figure 2—figure supplement 2—source data 2
Number of osmolytes as a function of cell volume.
Related to Figure 2—figure supplement 2.
- https://cdn.elifesciences.org/articles/76075/elife-76075-fig2-figsupp2-data2-v2.xlsx
Figure 3 with 1 supplement
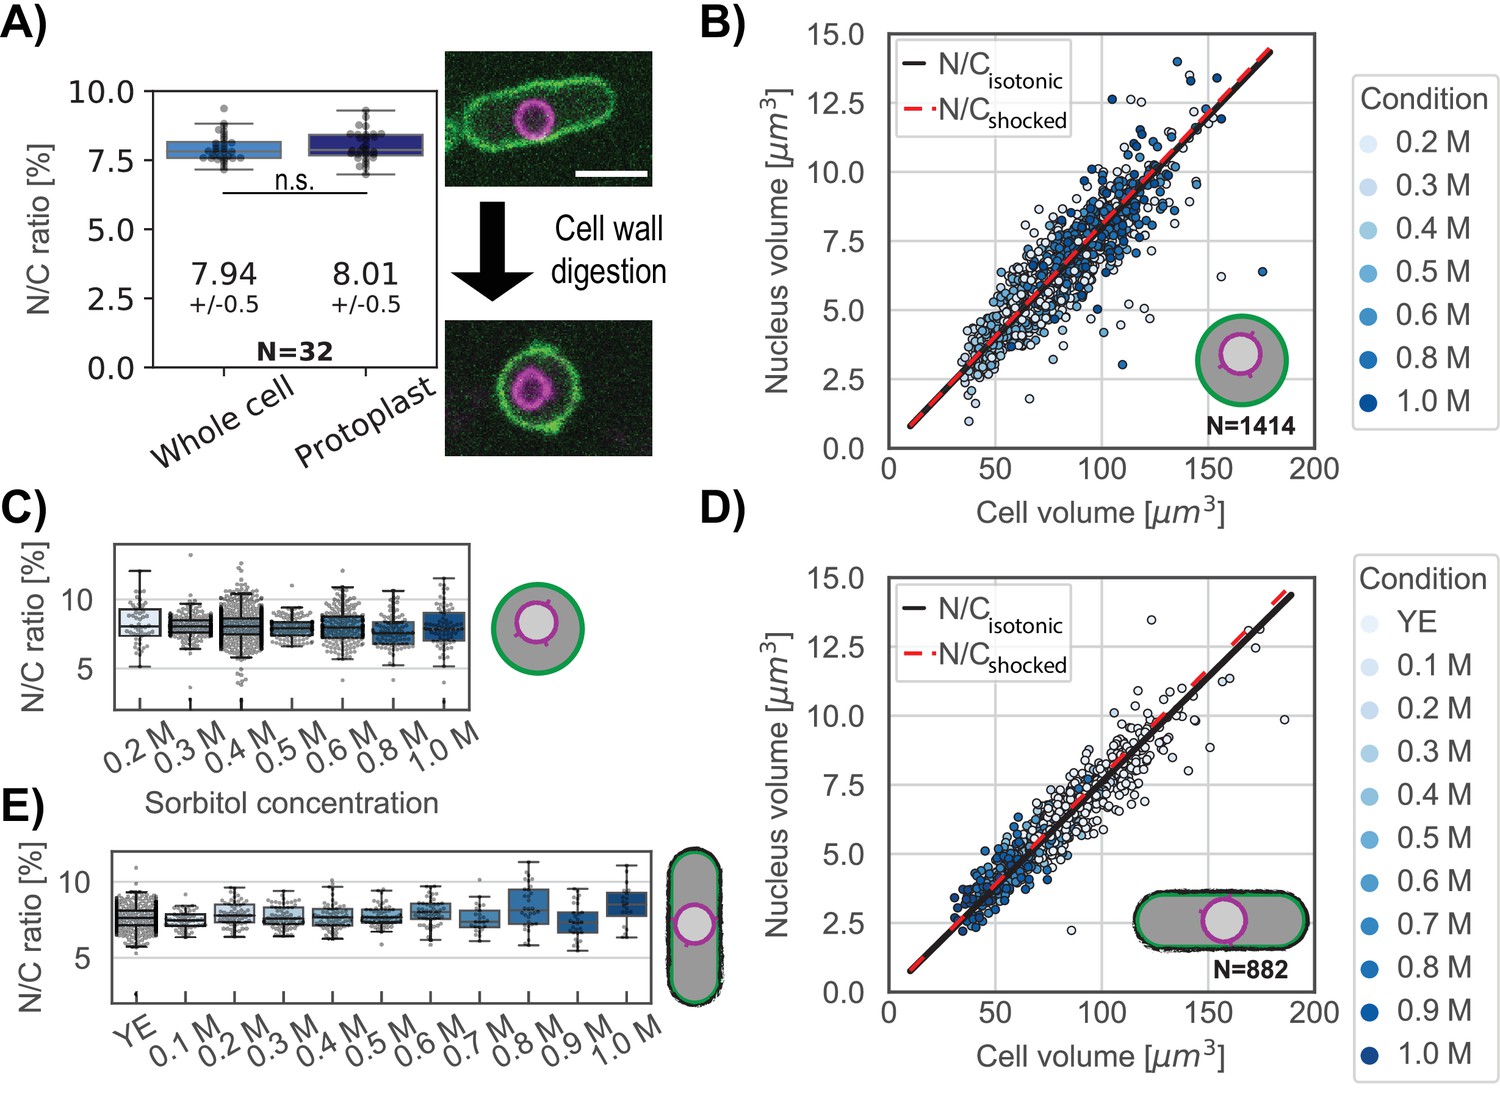
The N/C ratio is maintained in osmotic shifts and upon cell-wall removal.
(A) The N/C ratio of the same cells before and after cell wall digestion (mean ± STD) reveals no statistical differences (paired t test, p=0.36). Right panel, overlay of the plasma membrane (green) and nuclear membrane (purple) of the same cell middle plane before and after cell-wall digestion. For all box and whiskers plots, the horizontal line indicates the median, the box indicates the interquartile range of the data set (IQR) while the whiskers show the rest of the distribution within 1.5*IQR except for points that are defined as outliers. Scale bar = 5 µm. From six biological replicates. (B) Scatter plot of cell size and nuclear size for protoplasts under isotonic conditions (YE +0.4 M sorbitol) and immediately following osmotic shocks. Black and dashed red lines, measured N/C ratio of cells under isotonic conditions and osmotically shocked, respectively. From at least two biological replicates. (C) Protoplasts with the individual N/C ratio per osmotic condition described in (B). (D) Same as (B) for whole cells in YE under isotonic condition. Black line, measured N/C ratio of cells in isotonic conditions. From two biological replicates. (E) Same as (C) for whole cells with the individual N/C ratio per osmotic condition described in (D). See also Figure 3—figure supplement 1.
-
Figure 3—source data 1
N/C ratio of the same cells before and after cell wall digestion.
Related to Figure 3A.
- https://cdn.elifesciences.org/articles/76075/elife-76075-fig3-data1-v2.xlsx
Figure 3—figure supplement 1
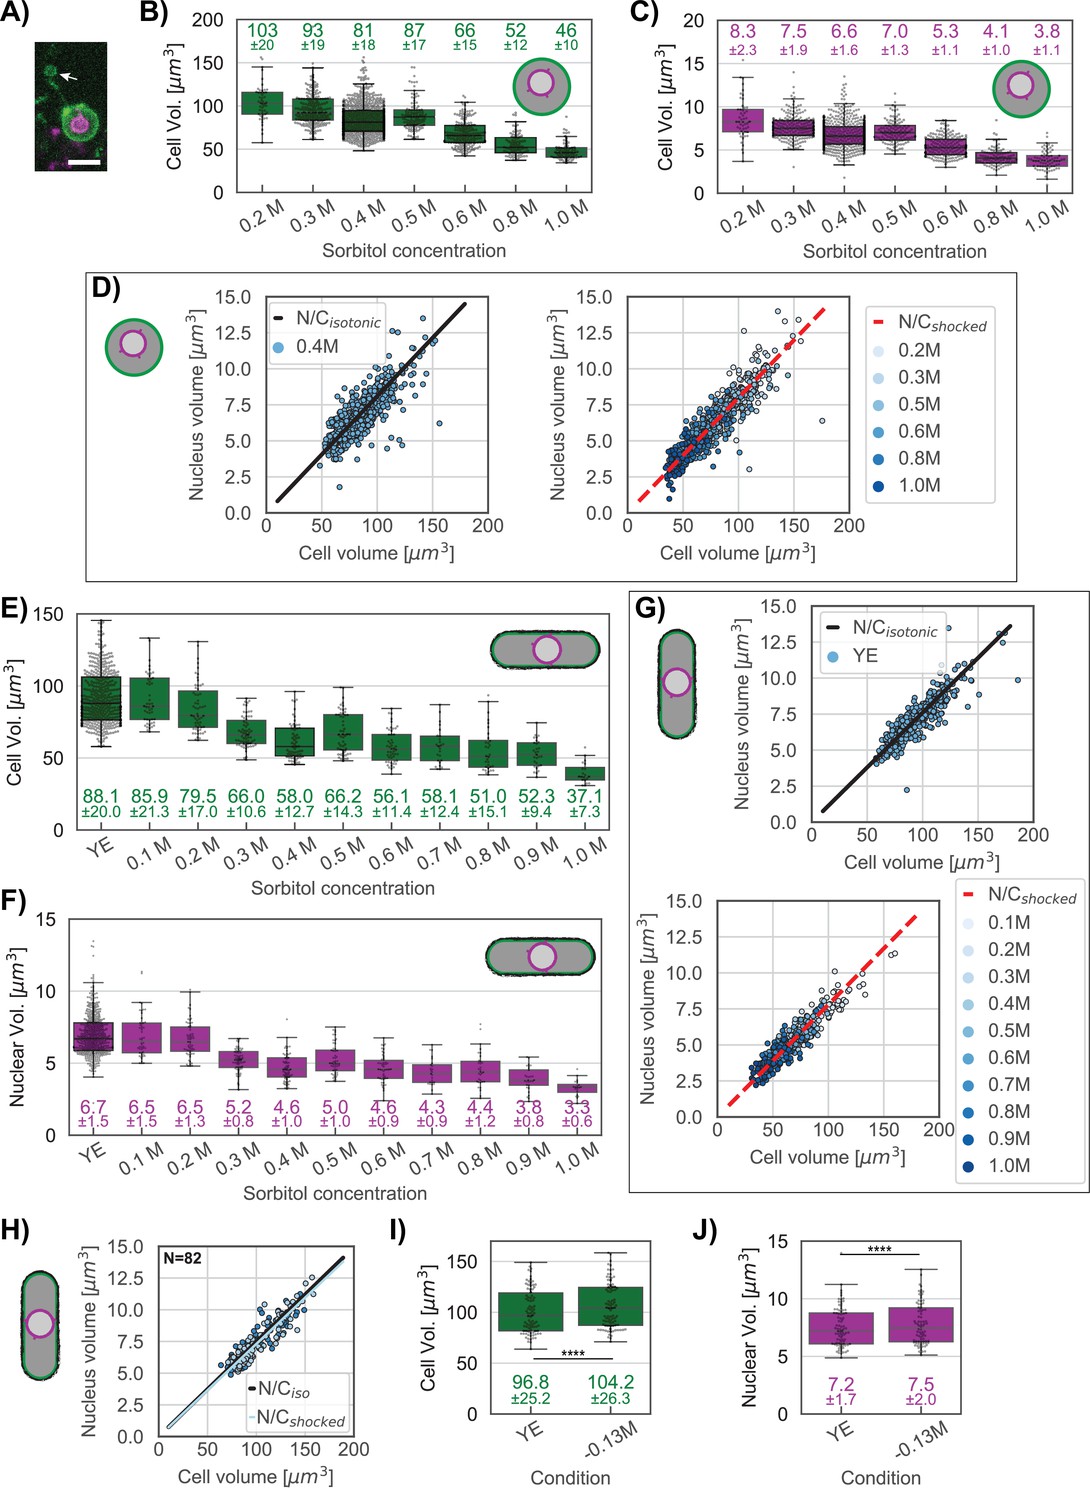
Measurements of cellular and nuclear volumes under osmotic shocks in protoplasts and whole cells.
(A) During protoplast preparation, a small portion of the cytoplasm was sometimes lost when the protoplast extruded out of the remaining cell wall. Image depicts a sum projection image of a protoplast with a portion of the plasma membrane (green) left behind (arrow). This behavior led to initial measurements that N/C ratio was slightly increased in some protoplasts compared to walled cells Figure 3B and D. To address this issue, for Figure 3 we therefore focused our analysis on cells that did not show any loss of cytoplasm during protoplasting. (B) Box and whisker plots for protoplasts showing individual cells volumes per osmotic condition described in main Figure 3. (C) (E) Same as (B) for protoplasts nuclei. (D) Separated plot from Figure 3B. Scatter plot of cell size and nuclear size for protoplasts under isotonic conditions (YE +0.4 M sorbitol, left panel) and immediately following osmotic shocks (right panel). Black and dashed red lines, measured N/C ratio of cells under isotonic conditions and osmotically shocked, respectively. (E) Box and whisker plots for whole cells showing individual cells volumes per osmotic condition described in main Figure 3. Mean ±STD are indicated under each condition. (F) Same as (E) for whole cells nuclei. (G) Separated plot from Figure 3D. Scatter plot of cell size and nuclear size for whole cells under isotonic conditions (YE, top panel) and immediately following osmotic shocks (bottom panel). Black and red lines, measured N/C ratio of cells under isotonic conditions and hypo-osmotically shocked, respectively. From two biological replicates. (H) Scatter plot of cell size and nuclear size for whole cells under isotonic conditions (YE) and immediately following hypo-osmotic shock. Black and blue lines, measured N/C ratio of cells under isotonic conditions and hypo-osmotically shocked, respectively. paired t test, p=0.0215 indicates a small difference in the N/C ratio. From two biological replicates. (I) Box and whisker plots for whole cells showing individual cells volumes per osmotic condition. Mean ±STD are indicated under each condition. (J) Same as (G) for whole cells nuclei. (I–J) Statistical differences indicate significant increase in nuclear and cell size under hypotonic cells (Wilcoxon paired t test, p<0.0001). For all box and whiskers plots, the horizontal line indicates the median, the box indicates the interquartile range (IQR) of the data set while the whiskers show the rest of the distribution within 1.5*IQR except for points that are defined as outliers.
Figure 4 with 1 supplement
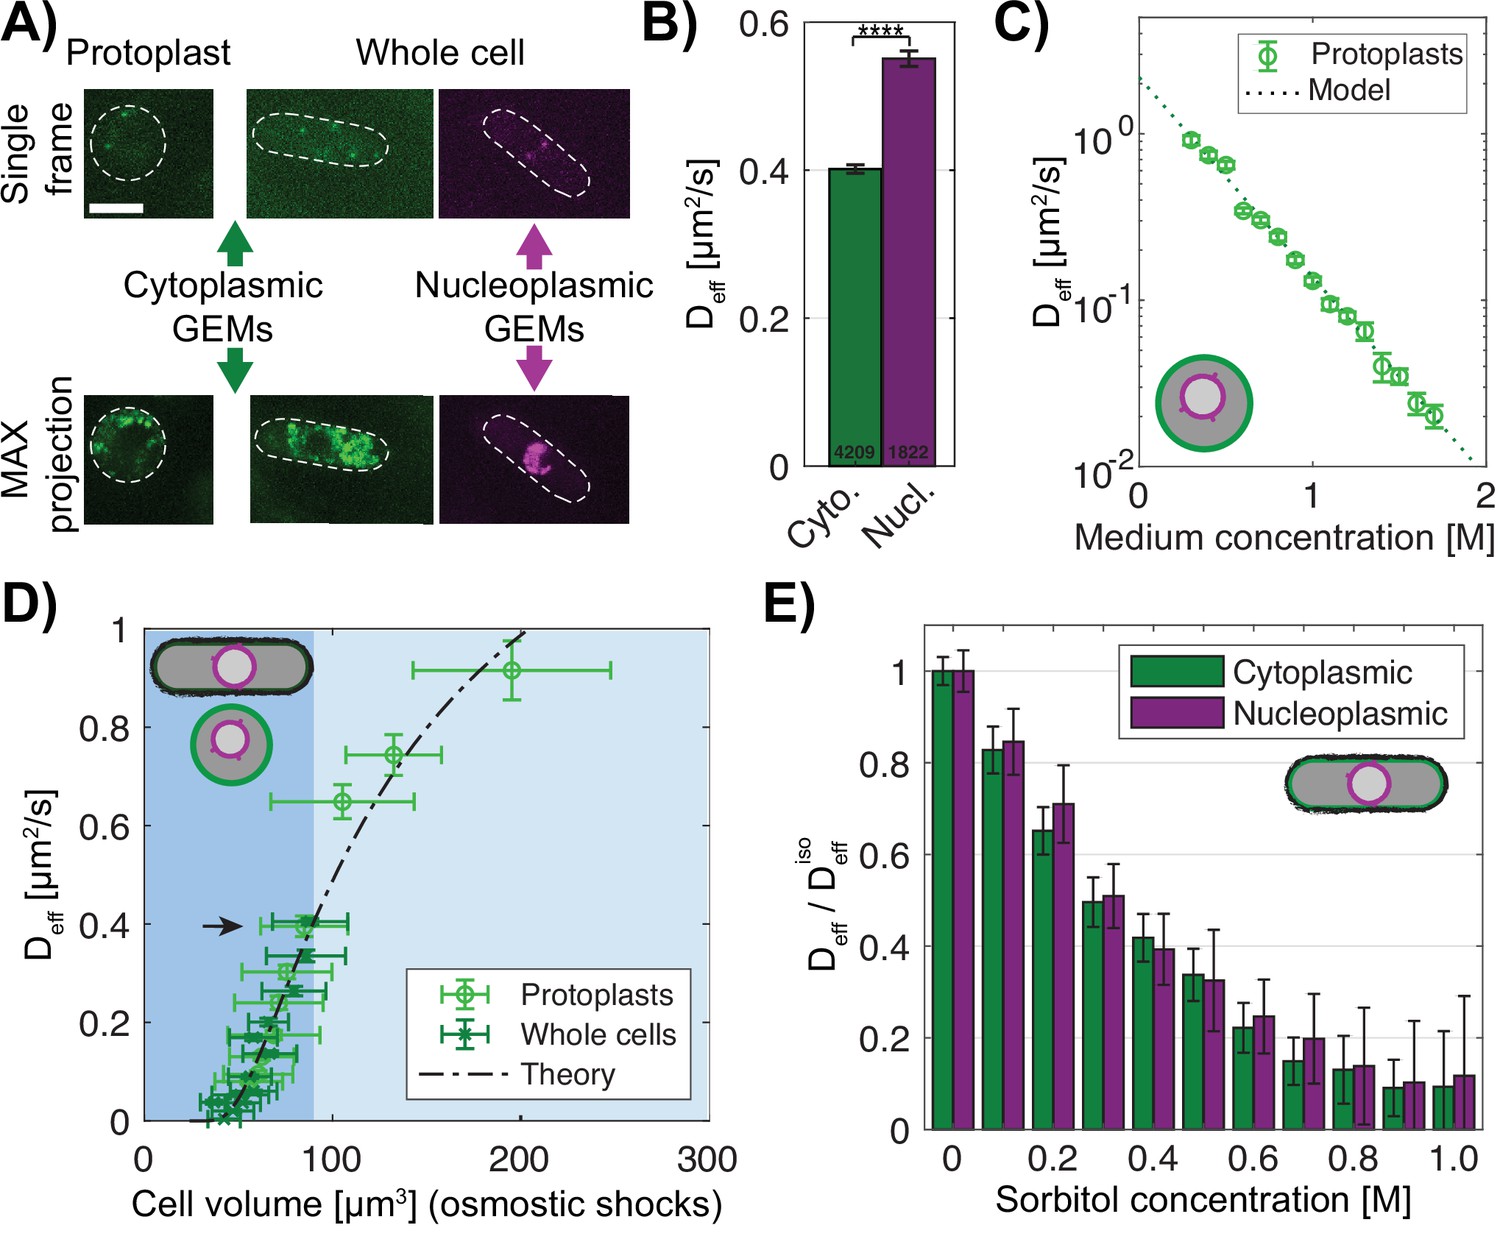
Macromolecular crowding is affected similarly in the nucleus and cytoplasm under osmotic shocks.
(A) Images of protoplasts (left) and whole cells (right) expressing cytoplasmic 40 nm GEMs and nucleoplasmic 40 nm GEMs. Top, single time point image; bottom, maximum projection of 100 frames. Dashed lines, the cell boundary. Scale bar = 5 µm. (B) GEMs effective diffusion coefficient (mean ± SEM) is slower in the cytoplasm (green) than in the nucleoplasm (purple) in whole cells in YE medium. Numbers indicate the number of tracks, p-value <0.0001 Mann-Whitney U test. (C) Effective diffusion coefficient of cytoplasmic GEMs (mean ± SEM) in protoplasts shifted to various sorbitol concentrations in the medium. Dashed lines, predictions of Phillies’ model for diffusion with a power law λ=1. NGEMs tracked = 4058, from at least two biological replicates per condition. (D) Effective diffusion coefficient of cytoplasmic GEMs (mean ± SEM) plotted against cell volume under hypotonic and hypertonic shock (light blue and blue background respectively). Volumes represent mean distribution of an asynchronous culture ± STD. Dashed line, fit of Phillies’ model for self-diffusing trackers in a polymer solution. Black arrow indicates Deff for a population of cells in YE and protoplasts in isotonic condition. Protoplasts: NGEMs = 3355, NVolume = 2216 cells, whole cells: NGEMs = 9849, NVolume = 981 cells. (E) Effects of hyperosmotic shifts on the relative effective diffusion coefficients (mean ± SEM) of cytoplasmic and nuclear GEMs; no statistically significant difference was detected (F-test, p-value = 0.90). Cytoplasm NGEMs = 9365,, nuclear NGEMs = 3732, from at least two biological replicates per condition. See also Figure 4—figure supplement 1.
-
Figure 4—source data 1
Effective diffusion of cytGEMs and nucGEMs.
Related to Figure 4B.
- https://cdn.elifesciences.org/articles/76075/elife-76075-fig4-data1-v2.xlsx
-
Figure 4—source data 2
Effective diffusion of cytGEMs in protoplasts in various sorbitol concentrations.
Related to Figure 4C, Figure 4—figure supplement 1.
- https://cdn.elifesciences.org/articles/76075/elife-76075-fig4-data2-v2.xlsx
-
Figure 4—source data 3
Effective diffusion of cytGEMs plotted against cell volume under hypotonic and hypertonic.
Related to Figure 4D.
- https://cdn.elifesciences.org/articles/76075/elife-76075-fig4-data3-v2.xlsx
-
Figure 4—source data 4
Normalized effective diffusion of cytGEMs and nucGEMs in various sorbitol concentrations.
Related to Figure 4E.
- https://cdn.elifesciences.org/articles/76075/elife-76075-fig4-data4-v2.xlsx
Figure 4—figure supplement 1
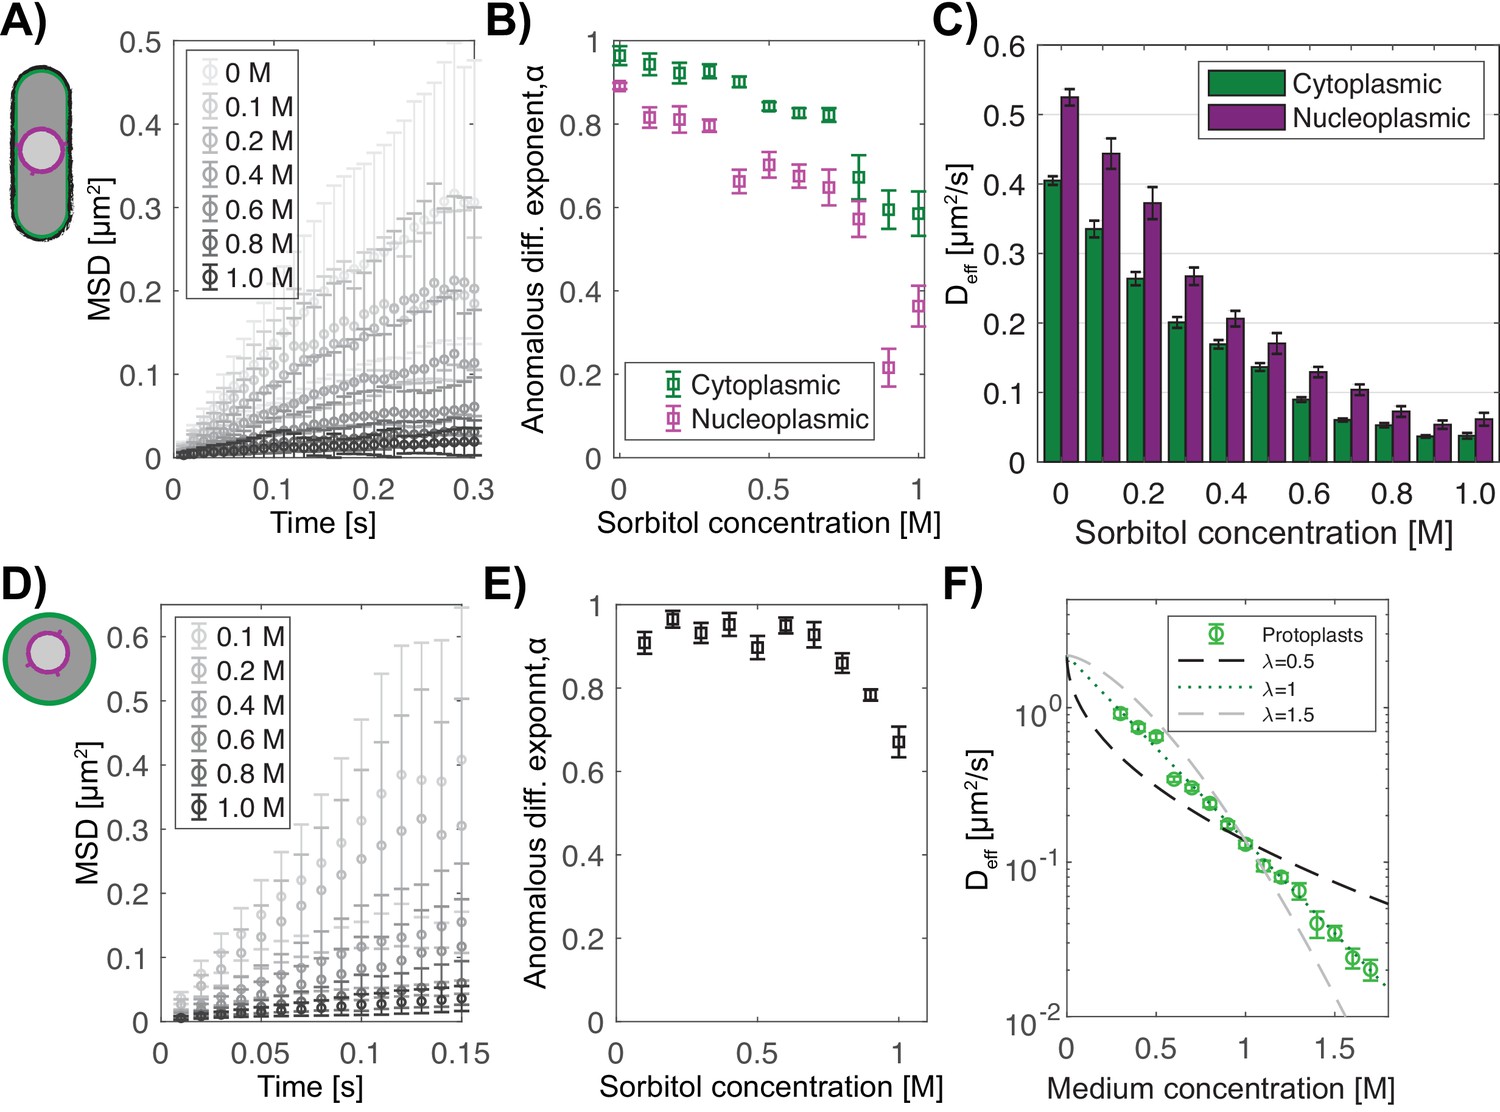
Comparison of the cytoplasmic and nucleoplasmic GEMs diffusion and anomalous exponent under osmotic shocks.
(A) Example of MSD plots for cytoplasmic GEMs in whole cells under isotonic condition (0 M) or hypertonic shock (0.1–1.0 M of sorbitol). (B) Cytoplasmic (green) and nucleoplasmic (purple) GEM anomalous diffusion exponents for whole cells under osmotic shock. (C) Effects of hyperosmotic shifts on the effective diffusion coefficients (mean ± SEM) of cytoplasmic and nuclear GEMs; no statistically significant difference was detected (F-test, p-value = 0.90). Cytoplasm NGEMs = 9365, nuclear NGEMs = 3732, from at least two biological replicates per condition. (D) Example of cytoplasmic GEMs MSD plots in protoplasts in isotonic condition (0.4 M) or osmotically shocked (0.1–0.2 M and 0.6–1.0 M). (E) Anomalous diffusion exponent ⍺ obtained from linear fits of the MSD plots presented in (D). (F) Effective diffusion coefficient of cytoplasmic GEMs in protoplasts for various medium concentrations. Dashed lines, Phillies’ model for diffusion from three power law values: λ=0.5 (black), λ=1 (green), and λ=1.5 (gray).
-
Figure 4—figure supplement 1—source data 1
cytGEMs MSD and anomalous diffusion exponent plots in whole cells.
Related to Figure 4—figure supplement 1.
- https://cdn.elifesciences.org/articles/76075/elife-76075-fig4-figsupp1-data1-v2.xlsx
-
Figure 4—figure supplement 1—source data 2
Effective diffusion of cytGEMs and nucGEMs in whole cells.
Related to Figure 4—figure supplement 1.
- https://cdn.elifesciences.org/articles/76075/elife-76075-fig4-figsupp1-data2-v2.xlsx
-
Figure 4—figure supplement 1—source data 3
cytGEMs MSD plots and anomalous diffusion exponent in protoplasts.
Related to Figure 4—figure supplement 1.
- https://cdn.elifesciences.org/articles/76075/elife-76075-fig4-figsupp1-data3-v2.xlsx
Figure 5 with 2 supplements
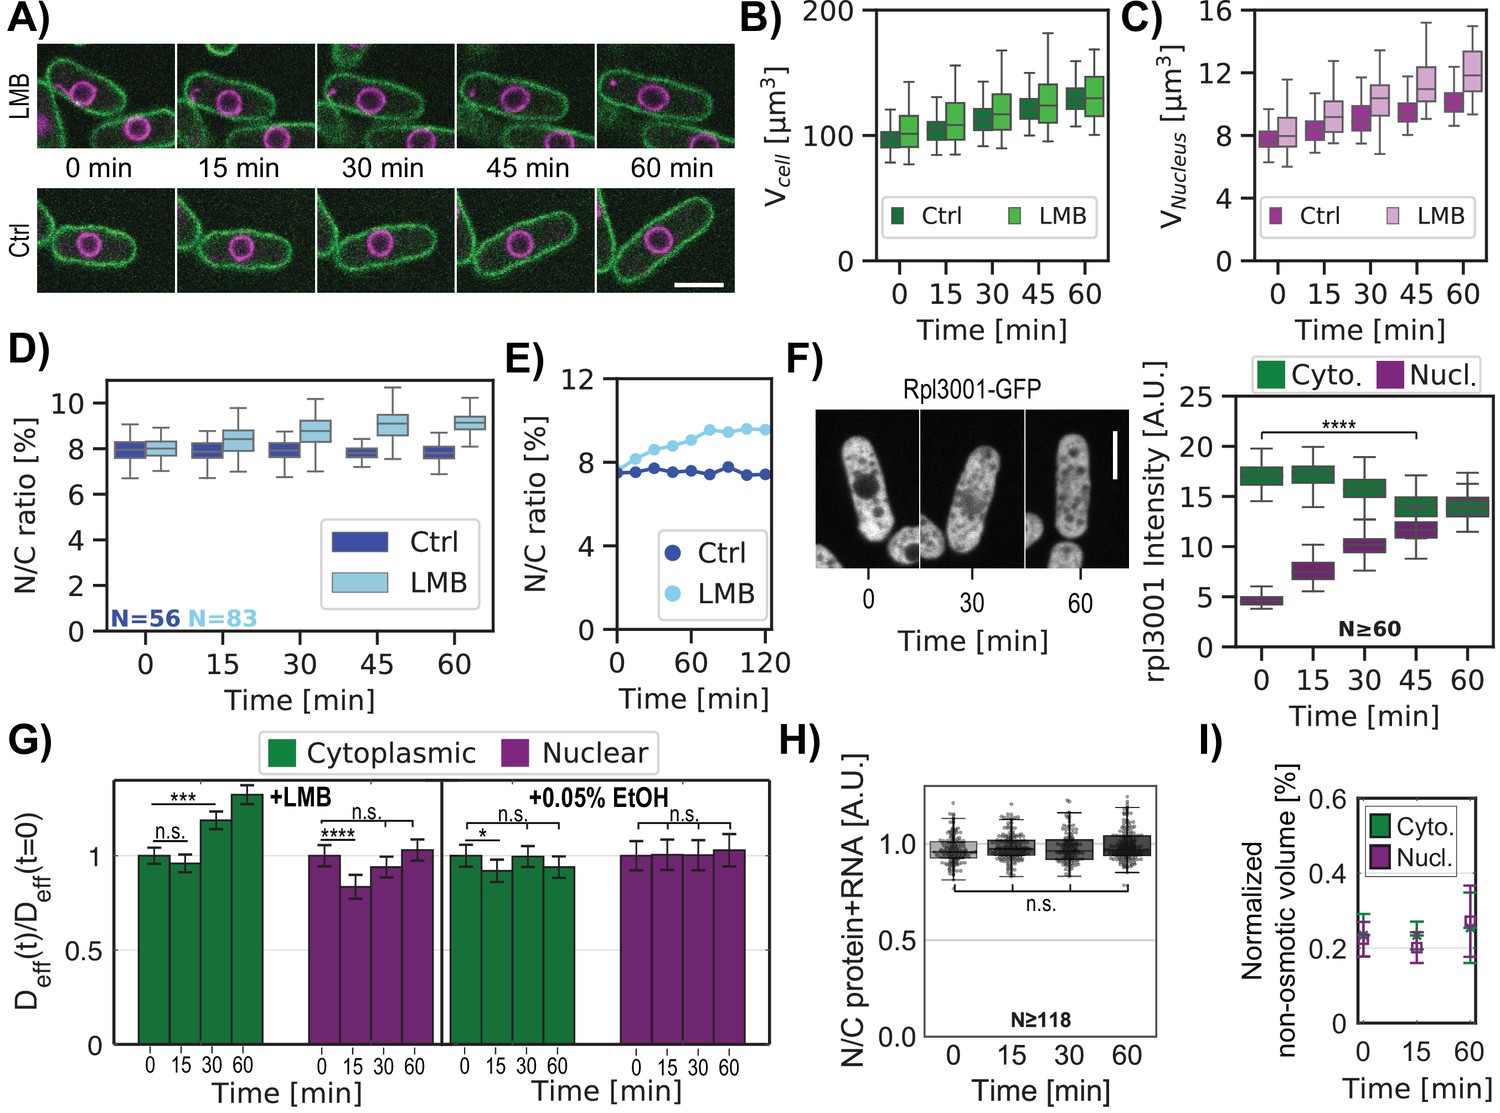
Inhibition of nuclear export rapidly leads to an increase in the N/C ratio and changes in crowding.
(A) Individual cells expressing plasma membrane and nuclear markers were imaged in time upon treatment with LMB or control (Ctrl). Images show a mid-focal plane of plasma membrane (green) and nuclear membrane (purple) treated with LMB (top) or not (Ctrl, bottom) over time (min). (B) Cell volumes were measured from 3D images. (C) Same as (B) for nuclear volume. (D) Box and whisker plot of N/C ratio of individual cells treated with LMB (cyan) and control condition (blue) at t=0 min and followed by time lapse microscopy. (E) N/C ratio dynamics of representative individual cells extracted from (D). (F) Cells expressing chromosomally tagged proteins that mark the large ribosomal subunit (Rpl3001-GFP) were treated with LMB and imaged over time. Mid focal plane confocal images and quantitation of their relative fluorescence intensities are displayed. Kruskal-Wallis statistical test was used. (G) Cells expressing cytoplasmic or nuclear GEMs were treated with LMB or control (0.05% ethanol) and were imaged for GEMs diffusion over time. Bar graphs show the relative changes in mean effective diffusion coefficients ± SEM for cytoplasmic (green) and nucleoplasmic (purple) GEMs in cells treated with LMB (left panel) and ethanol control (right panel). Statistical differences compared with Mann-Whitney U test. (A–G) From at least three biological replicates. (H) Cells were stained for total protein and RNA using FITC dye, plots indicate ratios of FITC intensities in nuclear and cytoplasmic regions over time after the addition of LMB. Statistical differences compared with Kruskal-Wallis test (p-value = 0.077), from at two biological replicates. (I) Normalized non-osmotic volume over time for cells and their nuclei in protoplasts treated with LMB. Scale bar = 5 µm. See also Figure 5—figure supplements 1 and 2.
-
Figure 5—source data 1
Cell and nucleus volumes over time treated with LMB.
Related to Figure 5B–E.
- https://cdn.elifesciences.org/articles/76075/elife-76075-fig5-data1-v2.xlsx
-
Figure 5—source data 2
Ribosomal tagged subunit localization in cells treated with LMB.
Related to Figure 5F, Figure 5—figure supplement 1.
- https://cdn.elifesciences.org/articles/76075/elife-76075-fig5-data2-v2.xlsx
-
Figure 5—source data 3
Effective diffusion of cytGEMs and nucGEMs in cells treated with LMB over time.
Related to Figure 5G.
- https://cdn.elifesciences.org/articles/76075/elife-76075-fig5-data3-v2.xlsx
-
Figure 5—source data 4
N/C ratio of total protein and RNA over time after the addition of LMB.
Related to Figure 5H.
- https://cdn.elifesciences.org/articles/76075/elife-76075-fig5-data4-v2.xlsx
-
Figure 5—source data 5
Normalized non-osmotic volume over time for cells and their nuclei in protoplasts treated with LMB.
Related to Figure 5I.
- https://cdn.elifesciences.org/articles/76075/elife-76075-fig5-data5-v2.xlsx
Figure 5—figure supplement 1
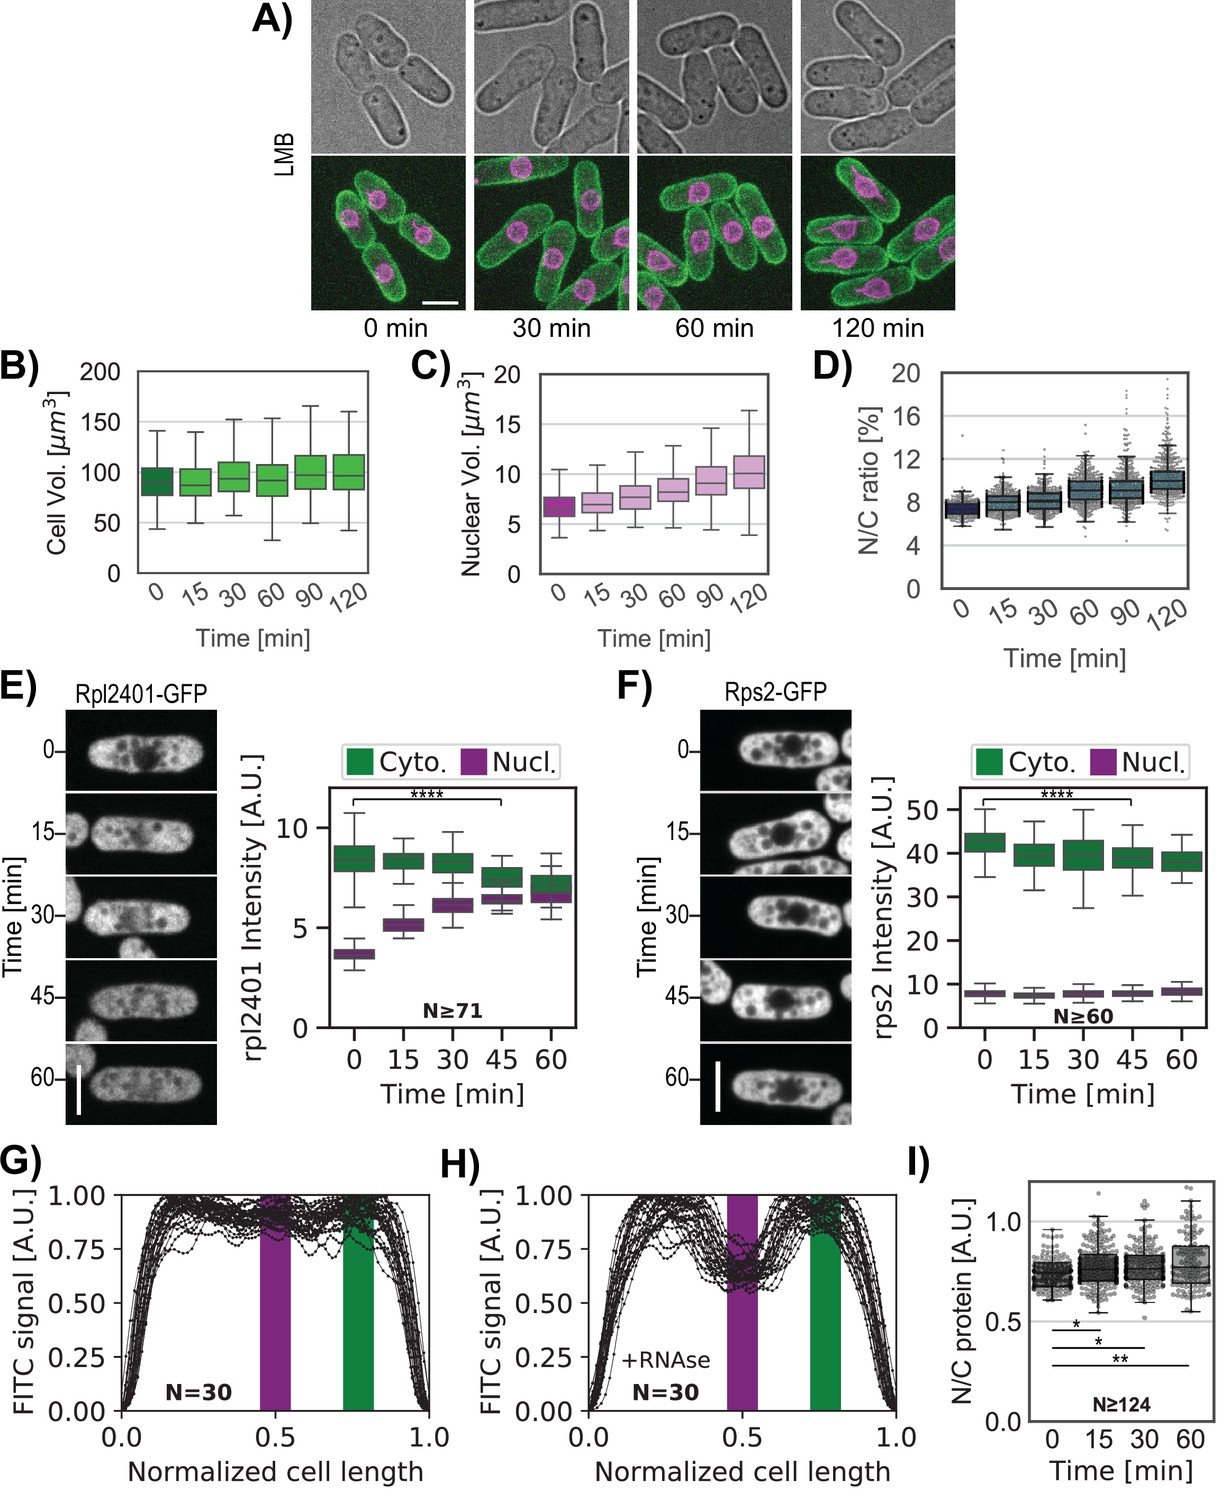
Effects of LMB on the N/C ratio and ribosomal protein localization.
(A) Bright field mid-focal plane (top) and max Z-projection (bottom) images of the plasma membrane (green) and nuclear membrane (purple) of whole cells treated with LMB over time. Cells were selected to have approximately the same size. (B–C) Whole-cell volume and nuclear volume of distinct populations of cells treated with LMB and initial condition. (D) N/C ratio of a population of cells treated with LMB (light blue) and initial condition (blue). N≥463 per time point. (E–F) Cells expressing chromosomally tagged proteins that mark the large ribosomal subunit (Rpl2401-GFP) and the small ribosomal subunit (Rps2-GFP) were treated with LMB and imaged over time. Mid focal plane confocal images and quantitation of their relative fluorescence intensities are displayed. Statistical differences between 0 and 45 min were compared with Kruskal-Wallis test. (G) To reveal the distribution of total protein and RNA cells were fixed and stained with FITC dye. FITC fluorescence intensities along the normalized cell length were measured. (H) Same as (G), to reveal the distribution of total protein cells were also treated with RNAse. (G–H) FITC intensities in nuclear and cytoplasmic regions are defined by the signal in purple and green bar. Only a subpopulation of cells was plotted. (I) Evolution over time of the ratios of FITC intensities in nuclear and cytoplasmic regions after LMB treatment. Kruskal-Wallis statistical test was used, from at three biological replicates. Scale bar = 5 µm.
-
Figure 5—figure supplement 1—source data 1
Whole-cell volume and nuclear volume of distinct populations of cells treated with LMB.
Related to Figure 5—figure supplement 1.
- https://cdn.elifesciences.org/articles/76075/elife-76075-fig5-figsupp1-data1-v2.xlsx
-
Figure 5—figure supplement 1—source data 2
N/C ratio of total protein over time after the addition of LMB.
Related to Figure 5—figure supplement 1.
- https://cdn.elifesciences.org/articles/76075/elife-76075-fig5-figsupp1-data2-v2.xlsx
Figure 5—figure supplement 2
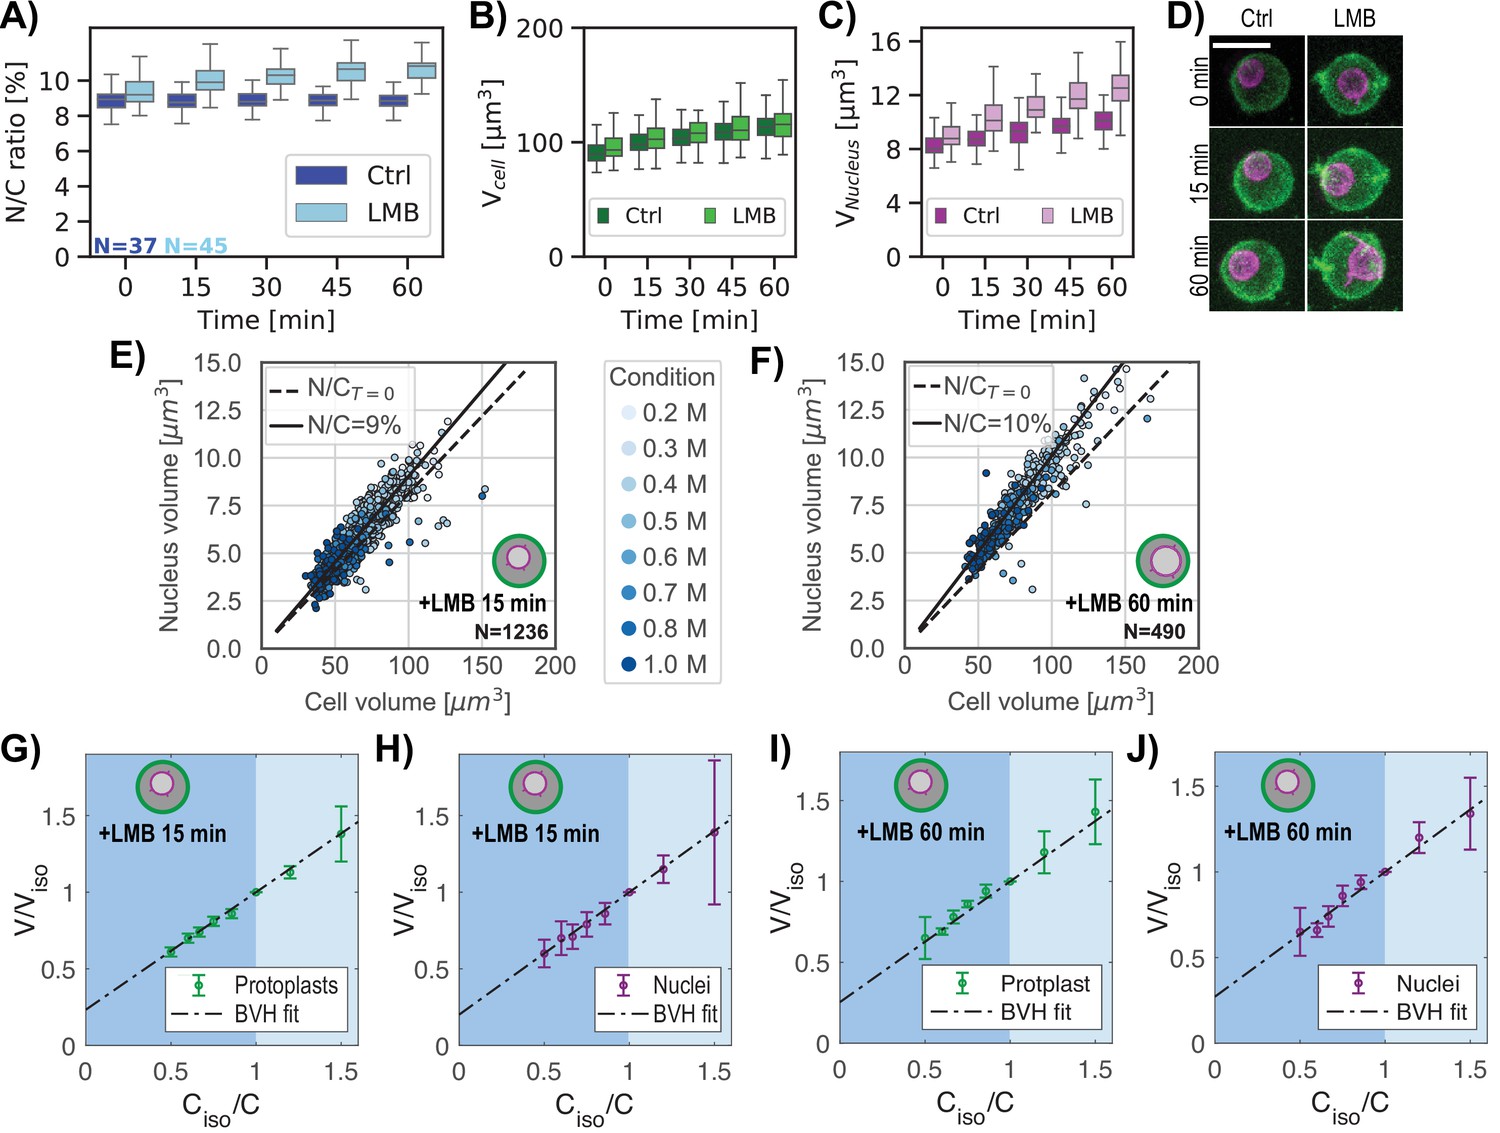
Effects of LMB and osmotic shifts on protoplasts.
(A–C) Time course of N/C ratio cellular volume and nuclear volume in individual control and LMB-treated protoplasts. (D) Z-sum projection image of the plasma membrane (green) and nuclear membrane (purple) of protoplasts over time treated with LMB (right) or not (Ctrl, left). Scale bar = 5 µm. (E) Scatter plot of cell size and nuclear size for protoplasts in isotonic condition treated with LMB for 15 min (YE +0.4 M sorbitol) and immediately following osmotic shock. Black line, N/C ratio of cells under isotonic condition (N/C=9%). Dashed line, N/C ratio of cells in isotonic condition before the addition of LMB (N/CT=0). (F) Same as (E) for protoplasts treated with LMB for 60 min. (G–H) Effect of osmotic shifts on the relative volumes (V/Viso, mean ±STD) protoplasts treated with LMB for 15 minutes (N=618, from at least two biological replicates). (I–J) Same as (G–H) for protoplasts treated with LMB for 60 minutes. (N=245, from at least two biological replicates).
-
Figure 5—figure supplement 2—source data 1
Time course of N/C ratio, cellular volume, and nuclear volume in individual LMB-treated protoplasts.
Related to Figure 5—figure supplement 2.
- https://cdn.elifesciences.org/articles/76075/elife-76075-fig5-figsupp2-data1-v2.xlsx
-
Figure 5—figure supplement 2—source data 2
BVH plots for protoplasts treated with LMB.
Related to Figure 5—figure supplement 2.
- https://cdn.elifesciences.org/articles/76075/elife-76075-fig5-figsupp2-data2-v2.xlsx
Figure 6 with 1 supplement
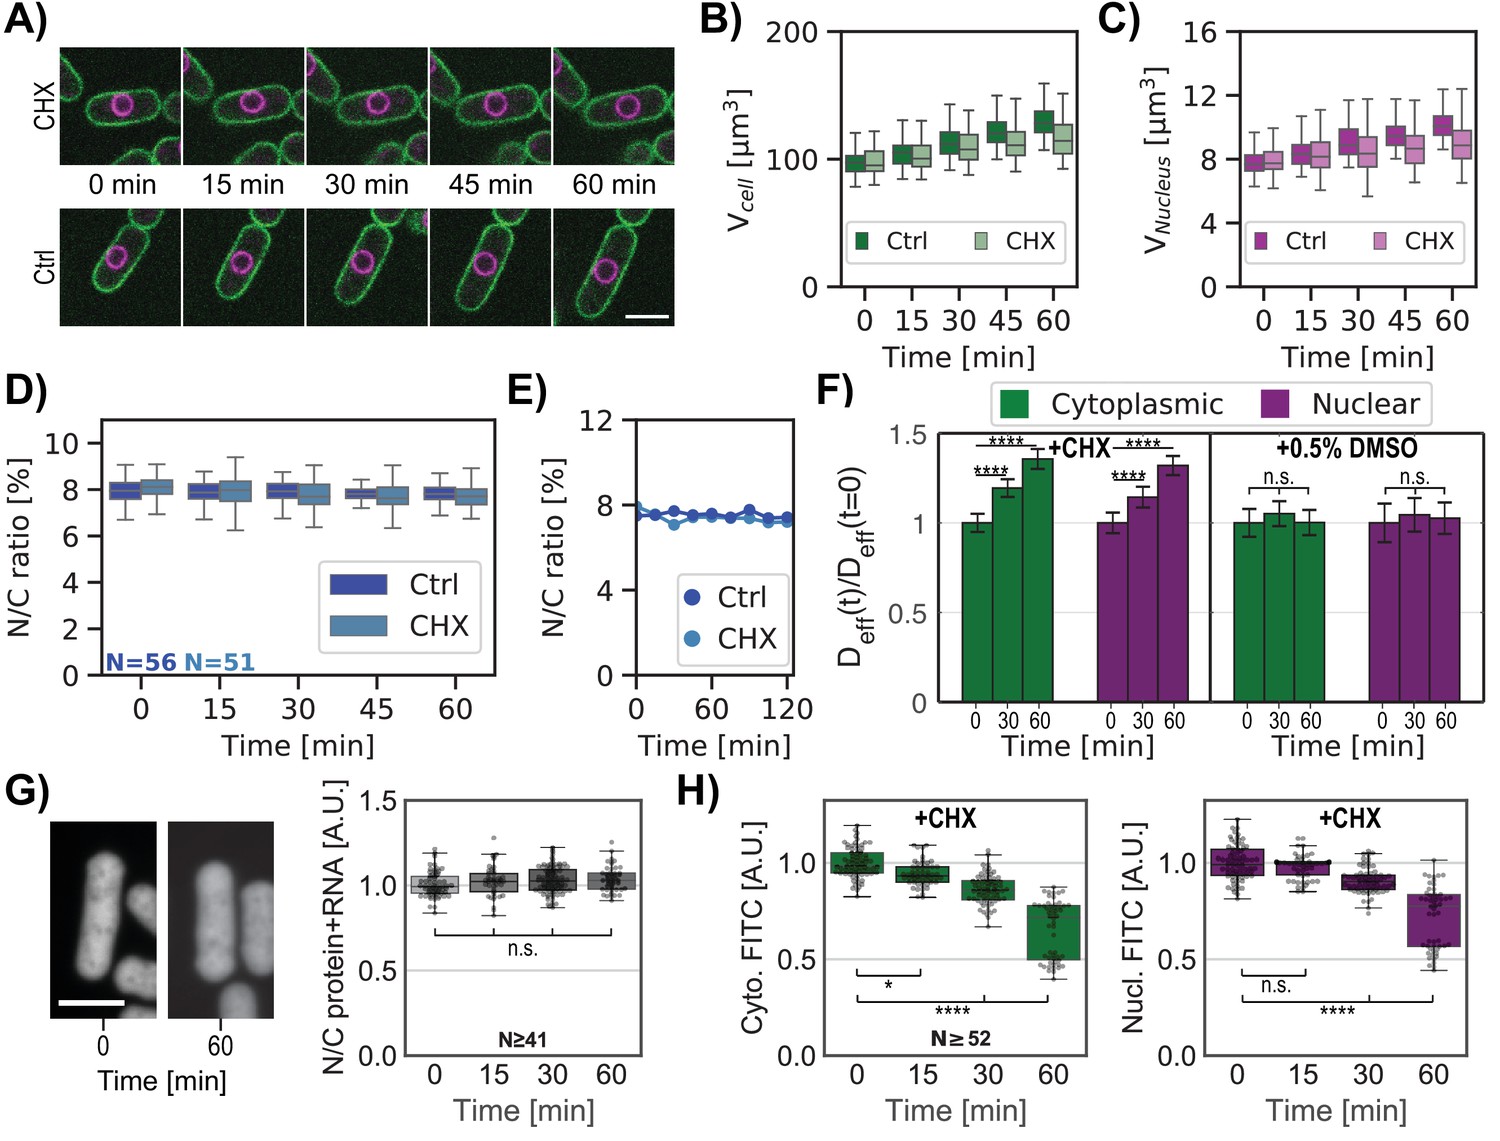
Inhibition of protein synthesis is accompanied by a similar decrease in nucleo-cytoplasmic crowding and does not perturb the N/C ratio.
(A) Overlay of the plasma membrane (green) and nuclear membrane (purple) of whole cells middle plane over time treated with 50 mg/ml cycloheximide (CHX, top) or not (Ctrl, bottom). (B) Single whole-cell volume dynamics treated with CHX or not (Ctrl). (C) Same as (B) for single-nucleus volume dynamics treated with CHX or not (Ctrl). (D) Individual whole cells N/C ratio dynamics treated with CHX or not (Ctrl). (E) Single whole-cell N/C ratio dynamics extracted from (D) for each condition. (F) Relative cytoplasmic (green) and nucleoplasmic (purple) GEM effective diffusion dynamics for cells treated with CHX (left panel) or only the drug buffer for control (0.5% dimethyl sulfoxide (DMSO), right panel). Statistical differences compared with Mann-Whitney U test. (G) Cells were stained for total protein and RNA using FITC dye. Left, confocal middle plane image of cells before (0 min) or after CHX treatment for 60 min. Right, quantification ratios of FITC intensities in nuclear and cytoplasmic regions over time after the addition of CHX. Kruskal-Wallis statistical test was used, from at two biological replicates. (H) Cytoplasmic (green, left) and nucleoplasmic (purple, right) protein signals for the same cells over time under CHX treatment decrease similarly. Kruskal-Wallis statistical test was used. Scale bar = 5 µm. See also Figure 6—figure supplement 1. (A-F &H) From at least three biological replicates.
-
Figure 6—source data 1
Whole-cell volume and nuclear volume of distinct populations of cells treated with CHX.
Related to Figure 6B–E.
- https://cdn.elifesciences.org/articles/76075/elife-76075-fig6-data1-v2.xlsx
-
Figure 6—source data 2
Effective diffusion of cytGEMs and nucGEMs in cells treated with CHX over time.
Related to Figure 6F.
- https://cdn.elifesciences.org/articles/76075/elife-76075-fig6-data2-v2.xlsx
-
Figure 6—source data 3
N/C ratio of total protein and RNA over time after the addition of CHX.
Related to Figure 6G.
- https://cdn.elifesciences.org/articles/76075/elife-76075-fig6-data3-v2.xlsx
-
Figure 6—source data 4
Cytoplasmic and nucleoplasmic protein signals over time under CHX.
Related to Figure 6H.
- https://cdn.elifesciences.org/articles/76075/elife-76075-fig6-data4-v2.xlsx
Figure 6—figure supplement 1
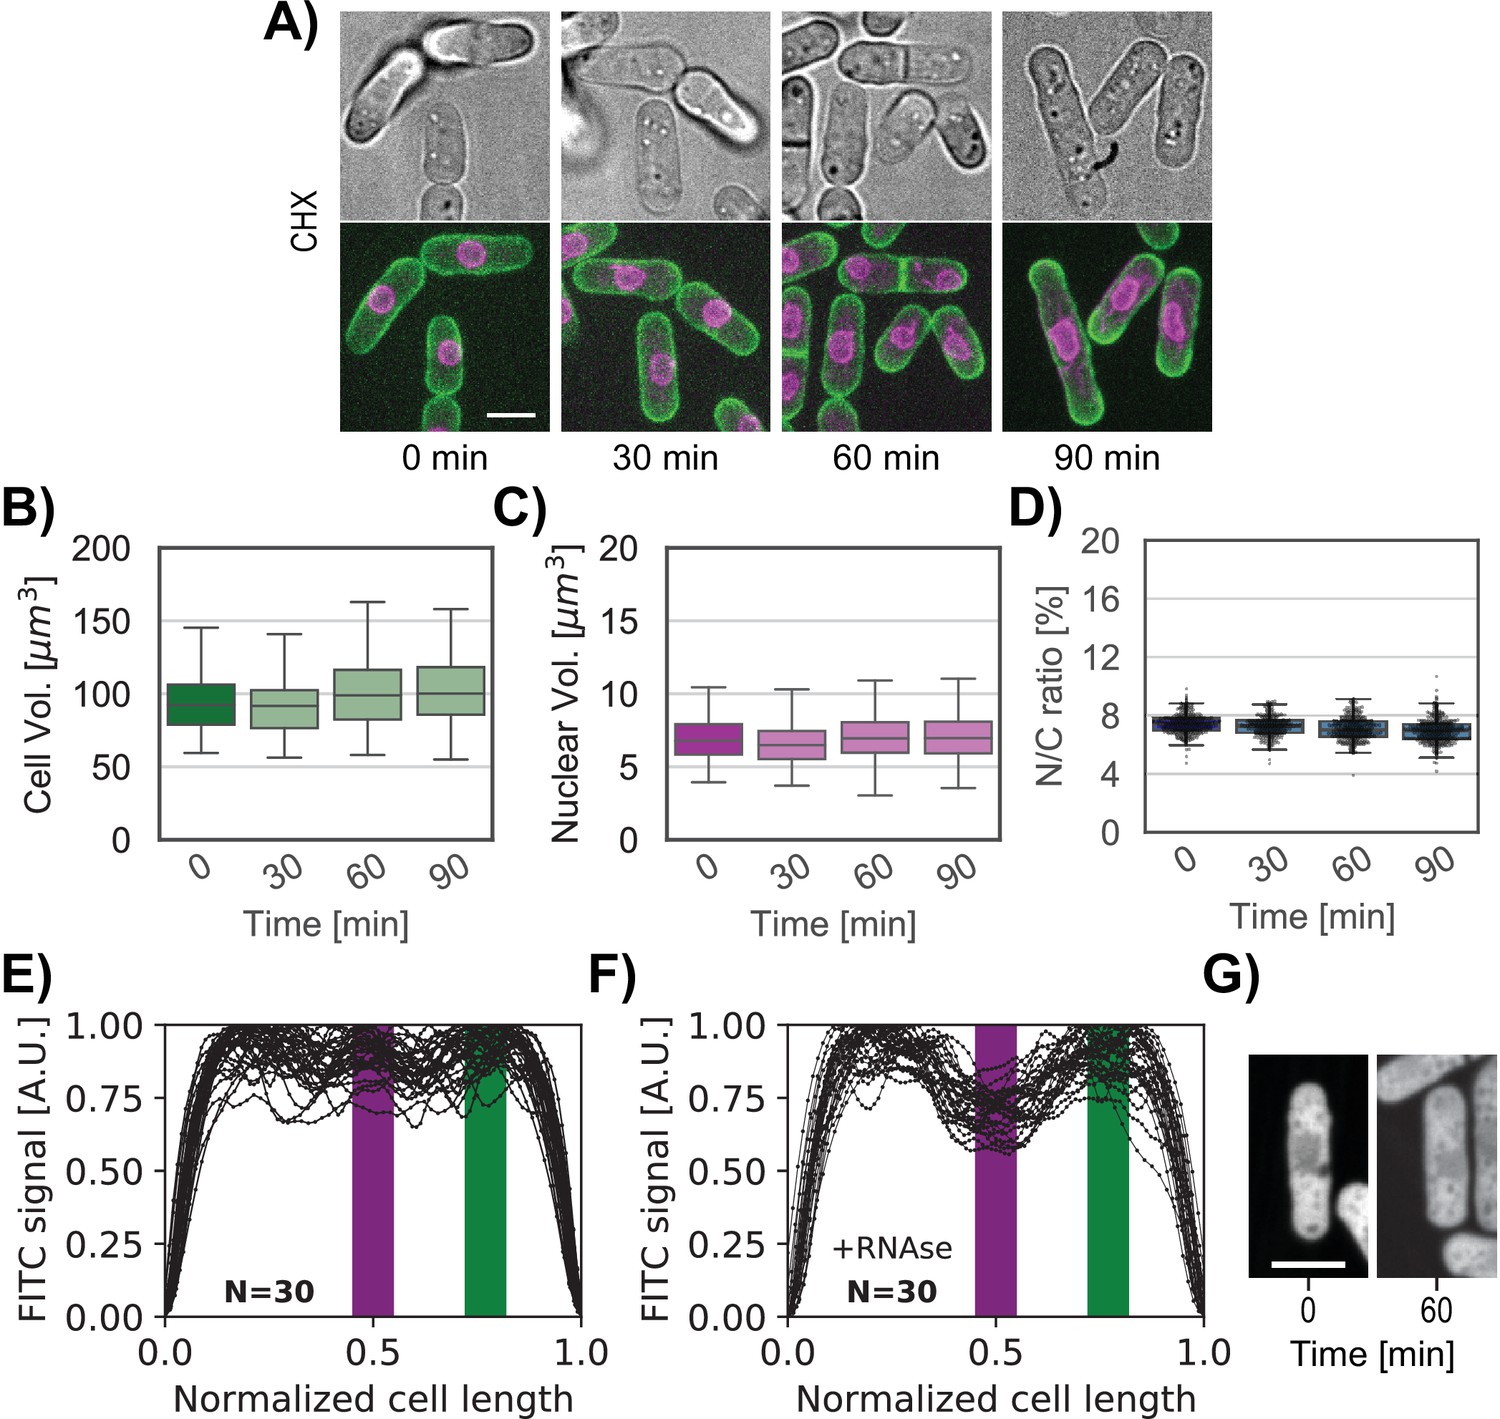
CHX treatment produces no detectable change in N/C ratio.
(A) Bright field (top) and max Z-projection (bottom) overlay of the plasma membrane (green) and nuclear membrane (purple) of whole cells treated with 50 mg/ml CHX over time. Cells were selected to have approximately the same size. (B–C) Whole-cell volume and nuclear volume of distinct populations of cells treated with CHX and initial condition. (D) N/C ratio of a population of cells treated with CHX (light blue) and initial condition (blue). N≥253 per time point. (E) Cells were stained with FITC dye to quantify protein and RNA distribution along the long cell axis of untreated cells, normalized by cell length. (F) As in (E) except cells were treated with RNAse for staining for total protein. (E–F) Purple and green boxes indicate the positions used to measure nuclear and cytoplasmic signals in Figure 5G–H. Only a subpopulation of cells was plotted. (G) Confocal middle plane image of cells stained with FITC for total protein, before (0 min) or after CHX treatment for 60 min. Scale bar = 5 µm.
-
Figure 6—figure supplement 1—source data 1
Whole-cell volume and nuclear volume of distinct populations of cells treated with CHX.
Related to Figure 6—figure supplement 1.
- https://cdn.elifesciences.org/articles/76075/elife-76075-fig6-figsupp1-data1-v2.xlsx
Figure 7 with 1 supplement
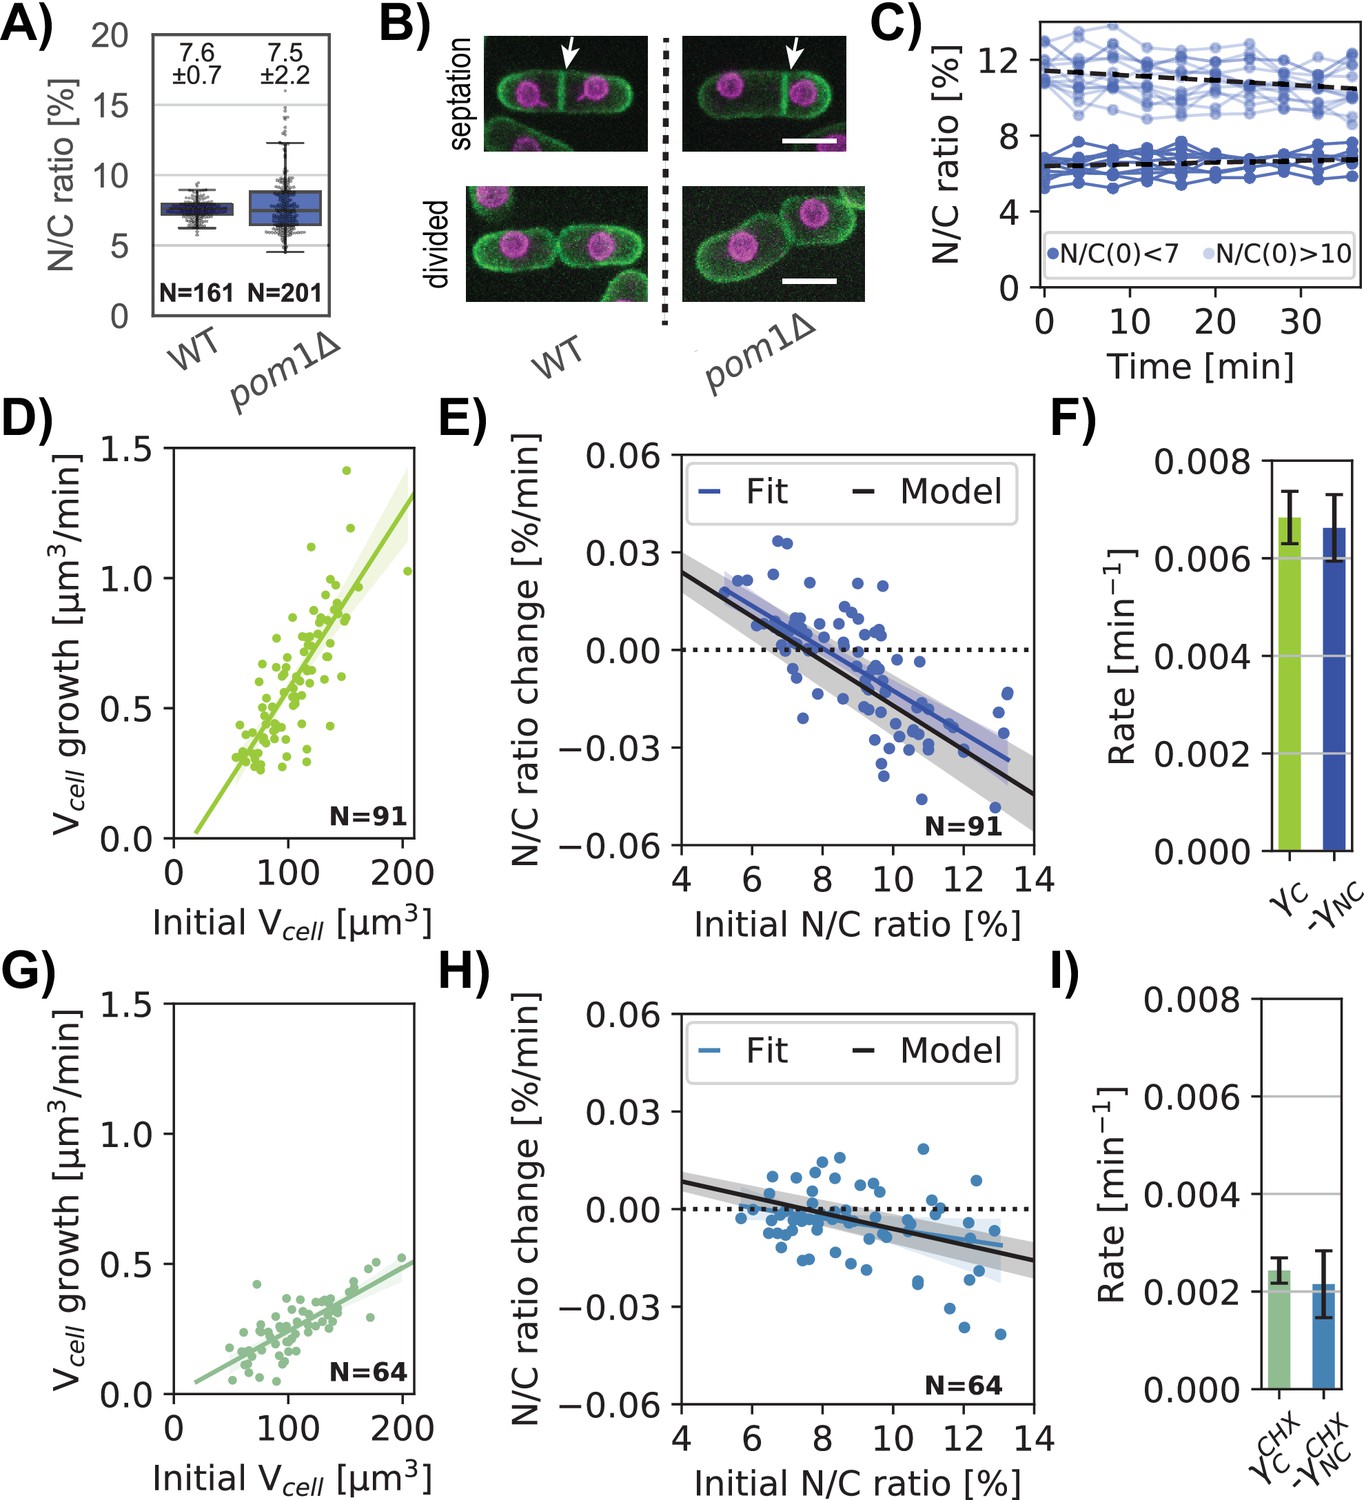
Homeostatic correction of aberrant N/C ratios is explained by a passive nuclear growth model.
(A) Asynchronous WT and pom1Δ whole cells N/C ratio (mean ±STD) in growth medium, from 1 biological replicate. (B) Z-sum projection overlay of the plasma membrane (green) and nuclear membrane (purple) of representative cells at septation (top) and divided (bottom) for WT (left) and pom1Δ (right). White arrow, septum location in the middle of WT cells and decentered for pom1Δ cells leading to asymmetric cell division. Scale bar = 5 µm. (C) N/C ratio over time for selected cells with low (light blue) or high (dark blue) initial N/C ratio. Dashed lines, linear regression for each cohort of cells. (D) Cellular growth rate as a function of a cell’s initial volume. Linear regression is shown in green with a slope γC. (D) N/C ratio change over time as a function of the initial N/C ratio. Experimental data (blue dots), linear fit (blue line), and predicted passive homeostasis N/C ratio behavior (black line) assuming N/C ratio = 7.5% at equilibrium from (A) and cell growth rate γC from (C). See also Figure 7—figure supplement 1. (F) Comparison of cell growth rate γC and the N/C ratio correction rate -γNC. (G–I) Same as D-F but in cells treated with 100 mg/ml CHX to decrease growth rate. (C–I) From two biological replicates.
-
Figure 7—source data 1
WT and pom1Δ whole cells N/C ratio, cell, and nuclear volumes.
Related to Figure 7A, Figure 7—figure supplement 1.
- https://cdn.elifesciences.org/articles/76075/elife-76075-fig7-data1-v2.xlsx
-
Figure 7—source data 2
Whole-cell volume, nuclear volume,N/C ratio and cellular growth rate of pom1Δ cells.
Related to Figure 7C–F, Figure 7—figure supplement 1.
- https://cdn.elifesciences.org/articles/76075/elife-76075-fig7-data2-v2.xlsx
-
Figure 7—source data 3
Whole-cell volume, nuclear volume, N/C ratio and cellular growth rate of pom1Δ cells treated with CHX.
Related to Figure 7G–I.
- https://cdn.elifesciences.org/articles/76075/elife-76075-fig7-data3-v2.xlsx
Figure 7—figure supplement 1
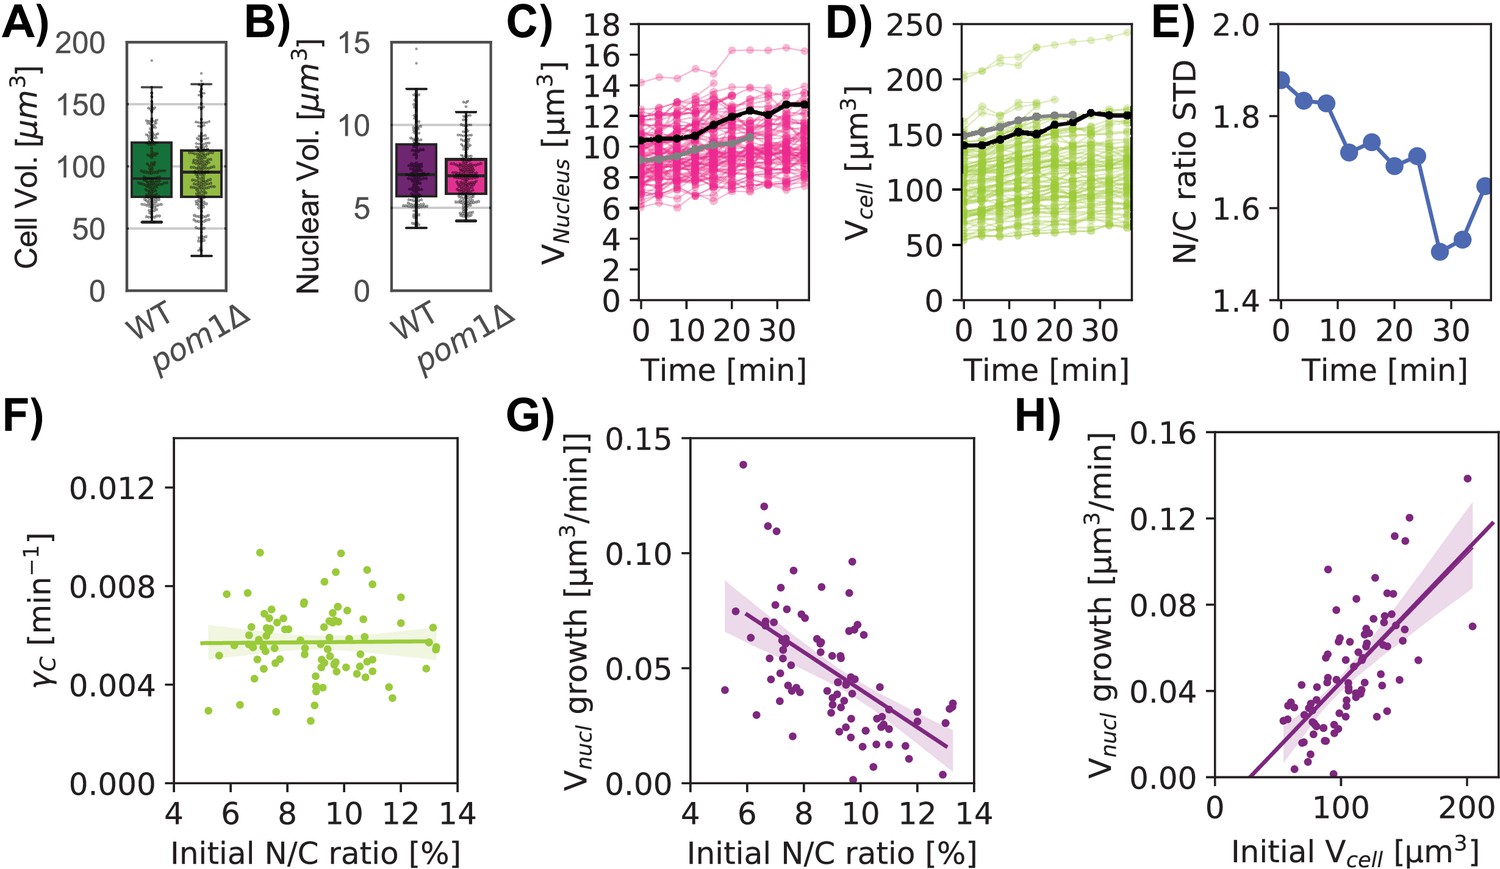
Quantitation of cellular and nuclear growth in pom1∆ mutant cells.
(A) Wildtype and pom1Δ whole-cell volumes used for Figure 7A. (B) Same as A for nuclear volumes of WT (purple) and pom1Δ (pink) cells. (C) Nuclear and (D) cell volume dynamics for pom1Δ cells. Gray and black lines show tracks corresponding to two selected cells. The gray track represents a cell that divided before the end of the experiment. (E) The standard deviation (STD) of the N/C ratio measured for 91 pom1Δ cells decreases over time. (F) Cellular growth rate γC is independent of the N/C ratio. (G) Nuclear growth rate as a function of the initial N/C ratio over time. Nuclei in cells with high N/C ratio grow slower than nuclei in cells with low N/C ratio. (H) Nuclear growth rate as a function of a cell’s initial volume follows the predicted behavior described in Equation 8. Linear regression is shown in purple. (C–H) n=91 pom1Δ cells.
Appendix 2—figure 1
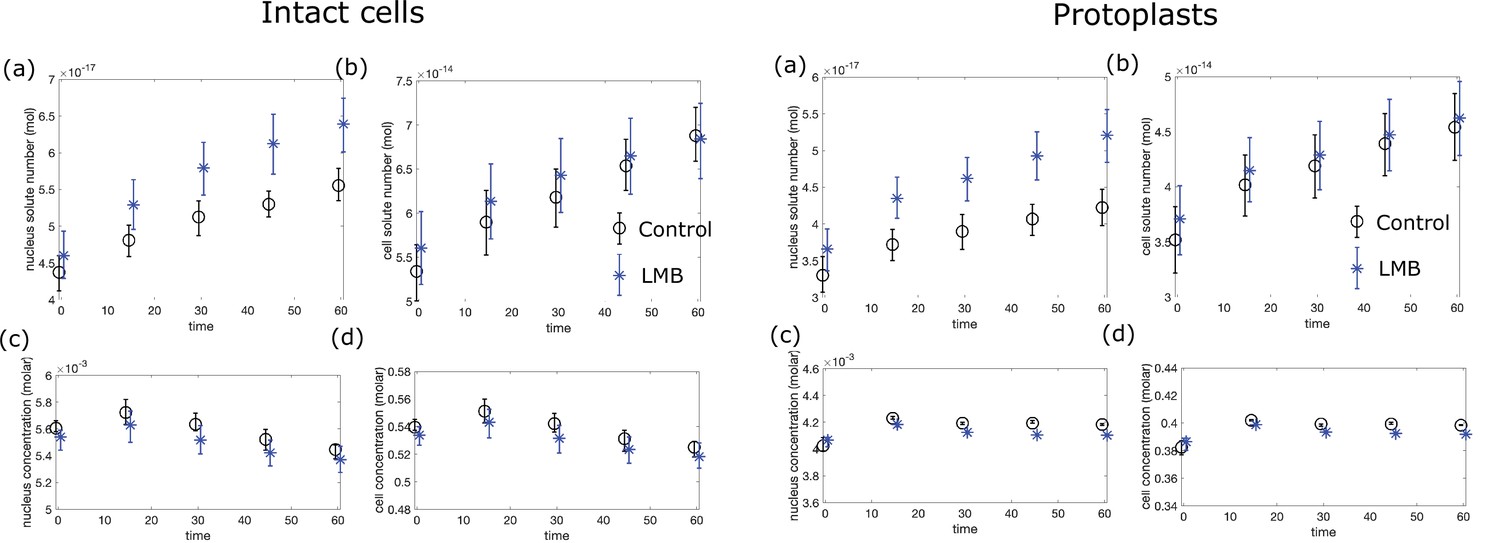
Left panel: intact cells, right panel protoplasts.
(a) Nuclear solute number (mol), (b) cell solute number (mol), (c) nuclear concentration (M), (d) cell concentration (M). The model predicts the increase in nuclear solute number in LMB experiments upon fitting to the measured cell and nuclear volumes.
Appendix 2—figure 2
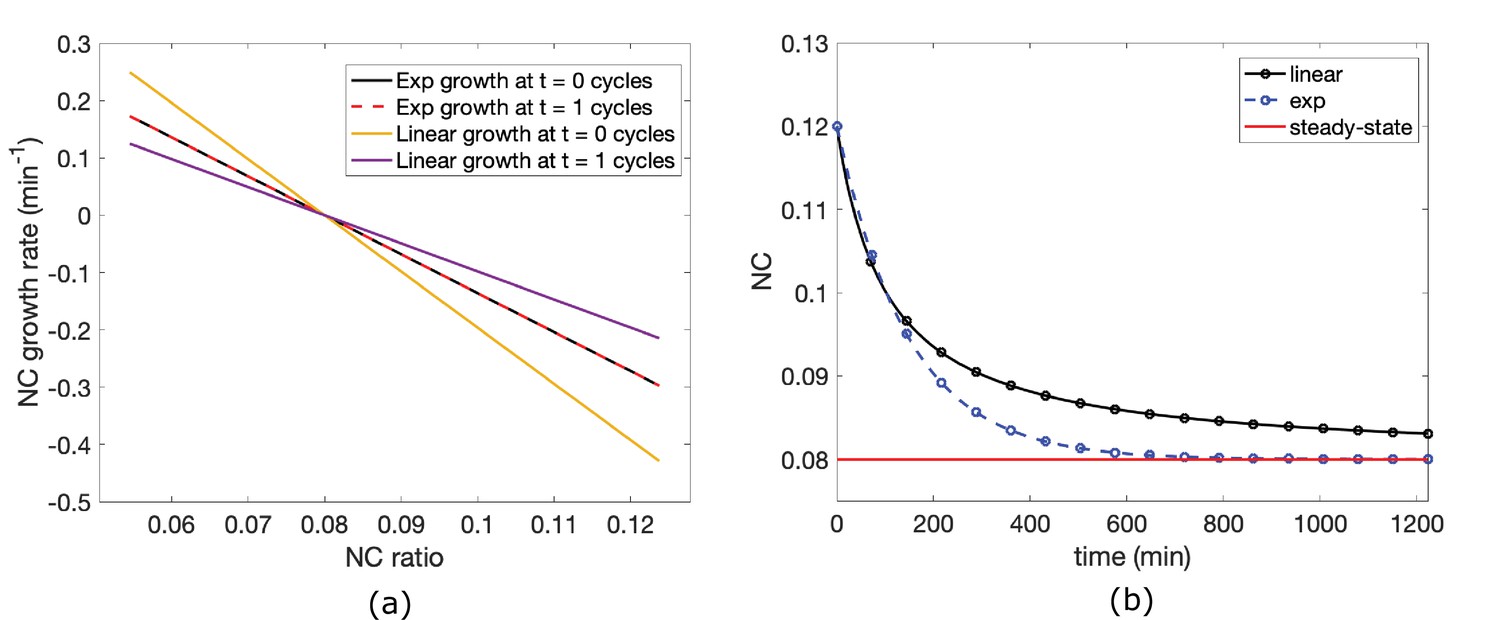
Homeostatic behavior predicted by the model in the case of linear and exponential cell growth.
(a) Exponential growth yields a cell cycle-independent homeostasis, (b) Exponential growth leads to a faster recovery of the steady-state N/C ratio in the case of mutants that are unable to divide.
Appendix 3—figure 1
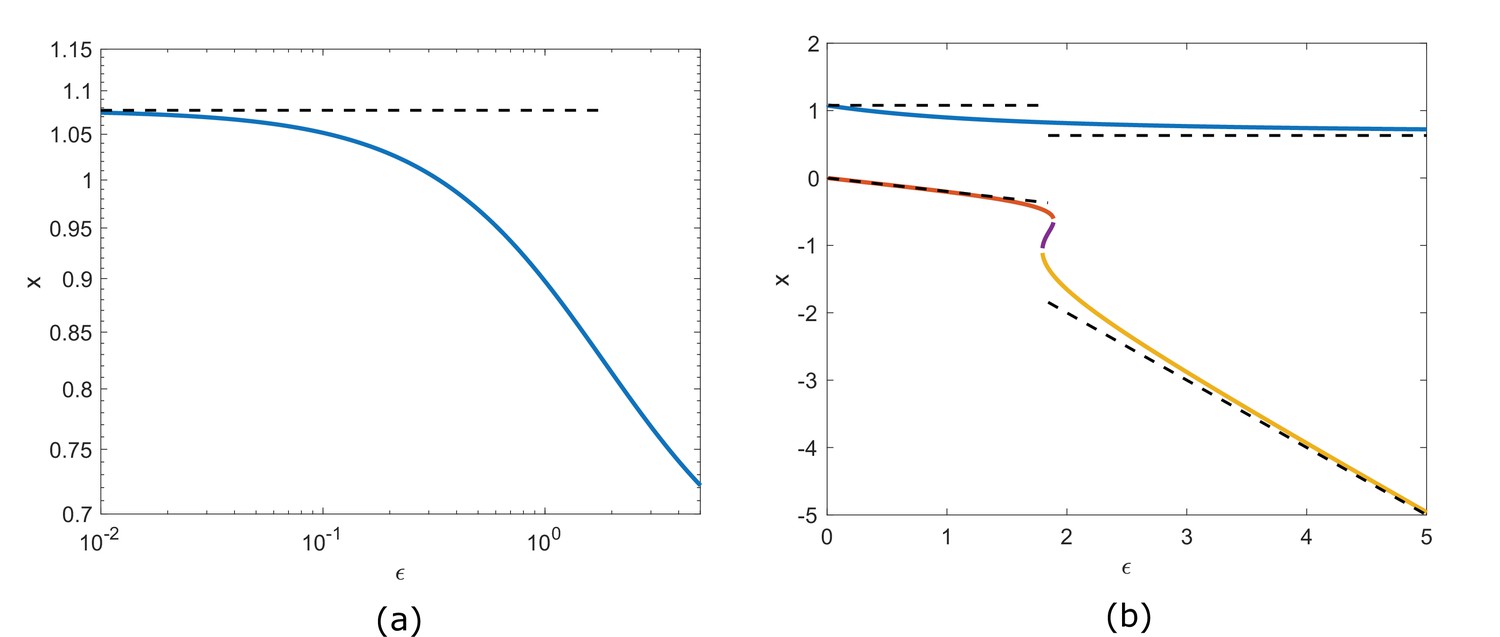
Limiting behaviors.
(a) Convergence to x1 in the small limit, (b) Full range of. ().
Appendix 3—figure 2
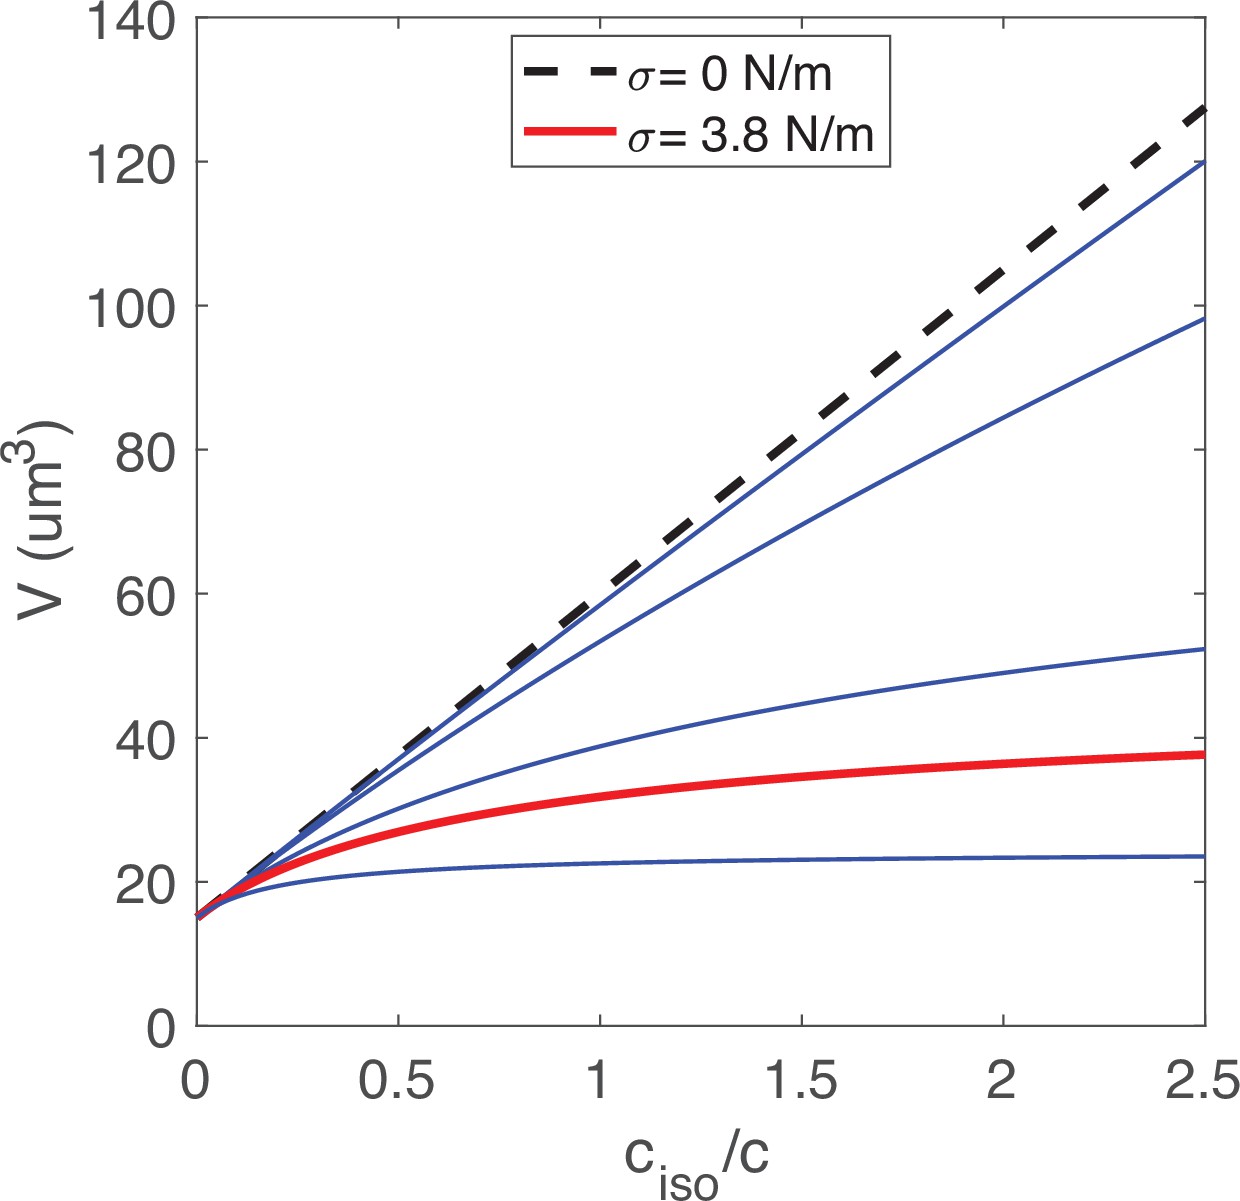
Boyle Van’t Hoff plots for different values of the surface tension .
The curve in red corresponds to the critical tension ≈ 3.8 N/m, whereas the dotted line corresponds to = 0.
Appendix 3—figure 3

Limiting behavior upon varying the outer tension in the limit of large inner tension .
Tables
Key resources table
| Reagent type (species) or resource | Designation | Source or reference | Identifiers | Additional information |
|---|---|---|---|---|
| Genetic reagent (Schizosacchoromyces pombe) | mCherry-Psy1, Ish1-GFP | This manuscript | FC3318 | h- ade6 <<mCherry-psy1 ish1-GFP:kanMX ura4-D18 |
| Genetic reagent (S. pombe) | gpd1 mutant, mCherry-Psy1, Ish1-GFP | This manuscript | FC3290 | h- ade6 <<mCherry-psy1 ish1-GFP:kanMX gpd1::hphMX6 ura4-D18 ade6- |
| Genetic reagent (S. pombe) | gpd1 mutant | This manuscript | FC3291 | h- gpd1::hphMX6 ade6-M216 leu1-32 ura4-D18 his3-D1 |
| Genetic reagent (S. pombe) | mCherry-Psy1, Cut11-GFP | This manuscript | FC3319 | h? cut11-GFP:ura4 +ade6:mCherry-psy1 ura4-D18 leu1-32 ade6-M210 |
| Genetic reagent (S. pombe) | gpd1 mutant, CytGEMs | This manuscript | FC3320 | h- gpd1::hphMX6 pREp41X-Pfv-Sapphire leu1-32 ade6- leu1-32 ura4-D18 his7-366 |
| Genetic reagent (S. pombe) | gpd1 mutant, NucGEMs | This manuscript | FC3321 | h- gpd1::hphMX6 pREp41X-NLS-Pfv-Sapphire leu1-32 ade6- leu1-32 ura4-D18 his7-366 |
| Genetic reagent (S. pombe) | CytGEMs | This manuscript | FC3289 | h- pREp41X-Pfv-Sapphire ade6-M216 leu1-32 ura4-D18 his3-D1 |
| Genetic reagent (S. pombe) | NucGEMs | This manuscript | FC3322 | h- pREp41X-NLS-Pfv-Sapphire leu1-32 ade6- leu1-32 ura4-D18 his7-366 |
| Genetic reagent (S. pombe) | pom1 mutant, mCherry-Psy1, Ish1-GFP | This manuscript | FC3323 | h- pom1::ura4 ade6 <<mCherry-psy1 ish1-GFP:kanMX |
| Genetic reagent (S. pombe) | Rpl3001-GFP | Chang Lab collection | FC3215 | h+rpl3001-GFP:kanR leu1-32 ura4-D18 ade6-210 |
| Genetic reagent (S. pombe) | Rpl2401-GFP | Chang Lab collection | FC3213 | h- rpl2401-GFP:kanR leu1-32 ura4-D18 ade6-216 |
| Genetic reagent (S. pombe) | Rps2-GFP | Chang Lab collection | FC3209 | h- rps2-GFP:kanR leu1-32 ura4-D18 ade6-210 |
| Genetic reagent (S. pombe) | 1XE2C, GFP-Psy1 | This manuscript | FC3324 | h+act1p:1XE2C:HygR leu2:GFP-psy1 leu1- ura4-D18 his7-366 |
| Chemical compound/drug | YES 225 Media | Sunrise Science Production | #2011 | |
| Chemical compound/drug | Edinburgh Minimum Media (EMM) | MP Biomedicals | #4110–32 | |
| Chemical compound/drug | Histidine | Sigma-Aldrich | #H8000 | |
| Chemical compound/drug | Uracil | Sigma-Aldrich | #U0750 | |
| Chemical compound/drug | Adenine | Sigma-Aldrich | #A9126 | |
| Chemical compound/drug | Thiamine | Sigma-Aldrich | #T4625 | |
| Chemical compound/drug | Lallzyme | Lallemand | #EL011-2240-15 | |
| Chemical compound/drug | Leptomycin B (LMB) | Alfa Aesar | #87081-35-4 | |
| Chemical compound/drug | Ethanol | Fisher BioReagents | #BP2818-500 | |
| Chemical compound/drug | Dimethyl sulfoxide (DMSO) | Fisher Scientific | #67-68-5 | |
| Chemical compound/drug | Cycloheximide (CHX) | Sigma-Aldrich | #C7698 | |
| Chemical compound/drug | Agarose | Invitrogen | #16500500 | |
| Chemical compound/drug | 4% formaldehyde (methanol-free) | Thermo Scientific | #28,906 | |
| Chemical compound/drug | RNAse | Thermo Scientific | #EN0531 | |
| Chemical compound/drug | Fluorescein isothiocyanate isomer I (FITC) | Sigma | #F7250 | |
| Software, algorithm | µManager v. 1.41 | Edelstein et al., 2010; Edelstein et al., 2014 | ||
| Software, algorithm | Matlab | Mathworks | R2018b | |
| Software, algorithm | Python | Drake Jr and Van Rossum, 1995 | 5.5.0 | |
| Software, algorithm | Prism | GraphPad | Version 9.3.1 | |
| Software, algorithm | FIJI ImageJ | Schindelin et al., 2012 | ||
| Other | µ-Slide VI 0.4 channel slide | Ibidi | #80,606 | microfluidic chambers |
| Other | µ-Slide VI 0.5 glass bottom channel slides | Ibidi | #80,607 | microfluidic chambers |
Appendix 1—table 1
Parameter values and definitions.
| Symbol | Definition | Value | Units | References |
|---|---|---|---|---|
| Parameters | ||||
| Solute number in cell (including ions) | – | mol | Estimated from Table 2-3 in Milo and Phillips, 2015 | |
| Solute number in cell (excluding ions) | – | mol | Estimated from p. 106 in Milo and Phillips, 2015 | |
| Solute number in nucleus (excluding ions) | – | mol | Fit | |
| Cell wall surface tension | 10 –20 | N/m | Minc et al., 2009, Atilgan et al., 2015 | |
| Cell membrane surface tension | N/m | Lemière et al., 2021 | ||
| Nuclear membrane surface tension | N/m | Estimate | ||
| Cell non-osmotic volume fraction | 0.25 | Main Text Figure 2(D) | ||
| Nucleus non-osmotic volume fraction | 0.25 | Main Text Figure 2(E) | ||
| Intact cell isotonic volume | 88 | µm3 | Figure 3—figure supplement 1 | |
| Intact nucleus isotonic volume | 6.7 | µm3 | Figure 3—figure supplement 1 | |
| Protoplast isotonic volume | 81 | µm3 | Figure 3—figure supplement 1 | |
| Protoplast nucleus isotonic volume | 6.6 | µm3 | Figure 3—figure supplement 1 | |
| Isotonic sorbitol concentration | 0 | M (mol/L) | Figure 2—figure supplement 2 | |
| Isotonic sorbitol concentration | 0.4 | M (mol/L) | Figure 2—figure supplement 2 | |
| Variables | ||||
| Cell volume | µm3 | |||
| Nuclear volume | µm3 | |||
| External osmolarity | M (mol/L) |
Additional files
Download links
A two-part list of links to download the article, or parts of the article, in various formats.
Downloads (link to download the article as PDF)
Open citations (links to open the citations from this article in various online reference manager services)
Cite this article (links to download the citations from this article in formats compatible with various reference manager tools)
Control of nuclear size by osmotic forces in Schizosaccharomyces pombe
eLife 11:e76075.
https://doi.org/10.7554/eLife.76075


