Dopamine D2Rs coordinate cue-evoked changes in striatal acetylcholine levels
- Department of Neuroscience, Columbia University, United States
- Department of Psychiatry, Columbia University, United States
- Division of Molecular Therapeutics, New York State Psychiatric Institute, United States
- Instituto de Investigaciones en Ingeniería Genética y Biología Molecular, Consejo Nacional de Investigaciones Científicas y Técnicas, and Departamento de Fisiología, Biología Molecular y Celular, Facultad de Ciencias Exactas y Naturales, Universidad de Buenos Aires, Argentina
- Department of Health Science and Technology, ETH Zurich, Switzerland
- Zurich Neuroscience Center, Winterthurerstrasse, Switzerland
- Department of Molecular Pharmacology and Therapeutics, Columbia University, United States
Figures
Figure 1 with 1 supplement
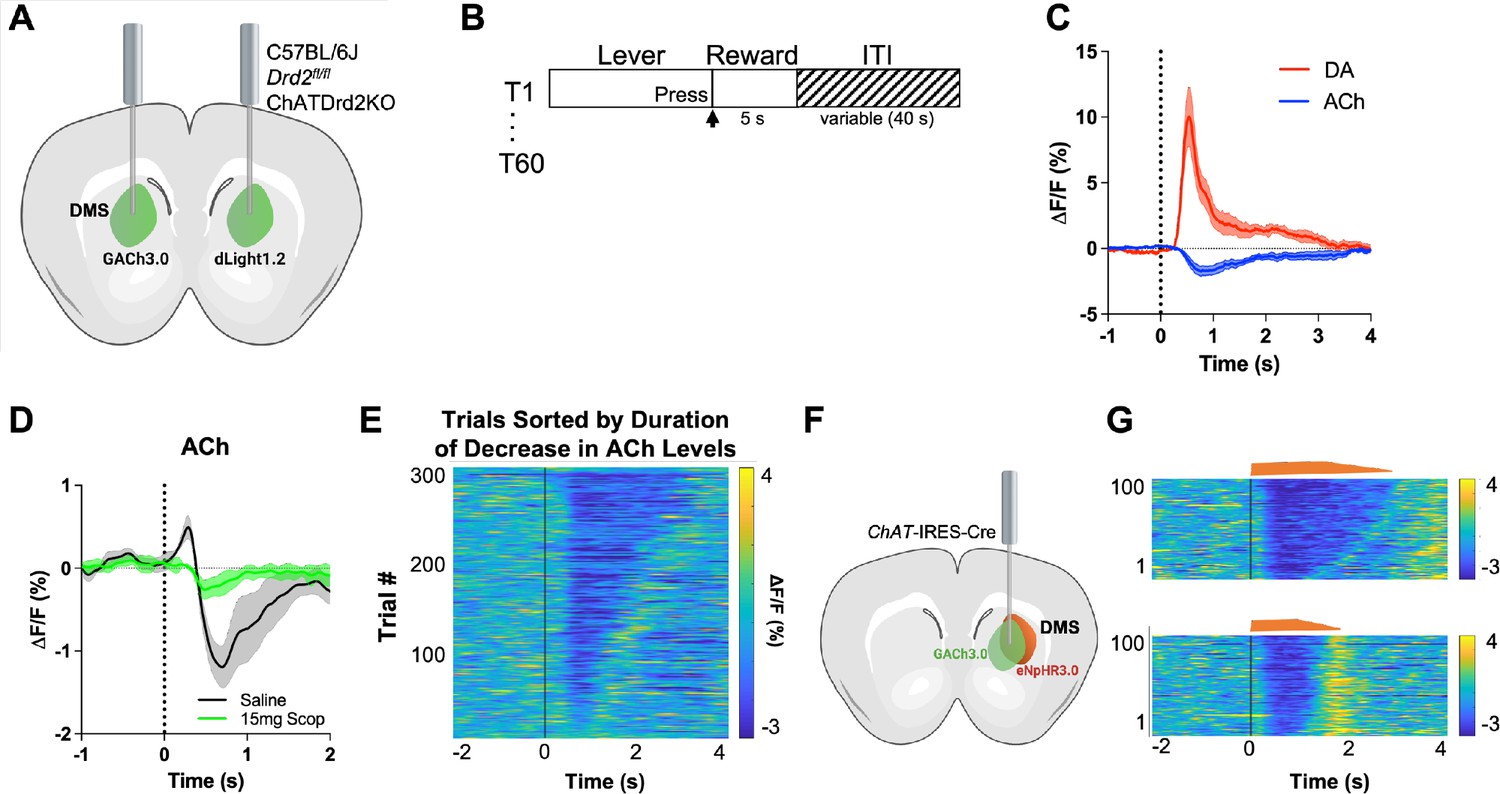
GACh3.0 reliably measures fast decreases in acetylcholine (ACh) during an instrumental task.
(A) Schematic of the surgery setup. All mice were injected with both biosensor viruses (GACh3.0 and dLight1.2) in separate hemispheres of the dorsal medial striatum (DMS) and counterbalanced across mice. Fiber photometry lenses were bilaterally implanted at the site of viral injection to simultaneously monitor ACh and dopamine (DA) in the same mouse. (B) Continuous reinforcement (CRF) task design. Mice were trained to press a lever to retrieve a milk reward for 60 trials/day with a variable intertrial interval (ITI) (40 s). (C) Changes in fluorescence (ΔF/F[%]) aligned to lever extension (time point = 0 s). DA levels (red) increased and ACh levels (blue) decreased, N=5 mice in trained mice. (D) 15 mg/kg of scopolamine (green), an mAChR antagonist, blunts the initial ACh peak and dip compared to saline (black) confirming that the GACh3.0 sensor is reporting changes in ACh levels. N=4 mice. (E) Heatmap of ACh responses aligned to lever extension (time = 0 s) and sorted by the duration of ACh decrease for 300 individual trials (60 trials in 5 mice). (F) Schematic of the surgery setup. ChAT-ires-Cre mice were co-injected with GACh3.0 and Cre-dependent halorhodopsin into the DMS and a fiber photometry lens was implanted at the site of viral injection. (G) Approximation of trials with short dips (bottom) and long dips (top) using the short and long optogenetic inhibition protocol (100 trials, 20 trials/5 mice).
Figure 1—figure supplement 1
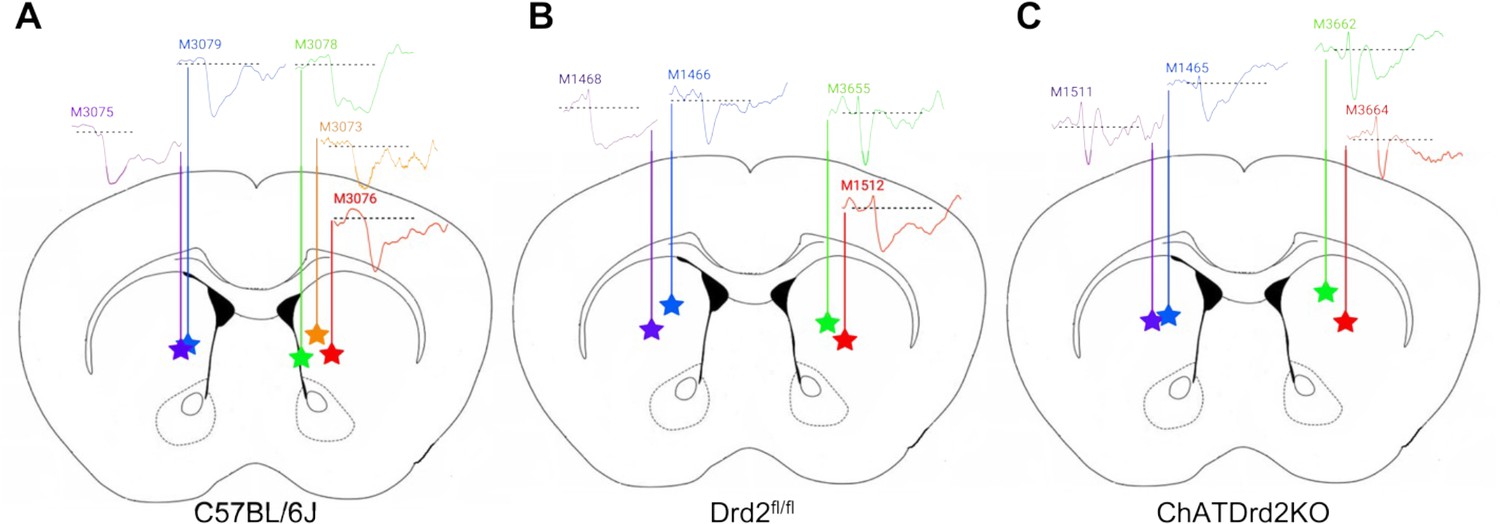
ACh levels in response to lever presentation at different recording location in the striatum.
Optical fiber location and initial ACh peak. Schematic of coronal section of the mouse striatum with optical fiber location and initial ACh peak in (A) C57BL/6J, N = 5 mice, (B) Drd2fl/fl control, N=4 mice and (C) ChATDrd2KO mice, N=4 mice. Color stars represent the bottom on the optical fiber with a connecting-colored line to individual mice and their ACh signal.
Figure 2
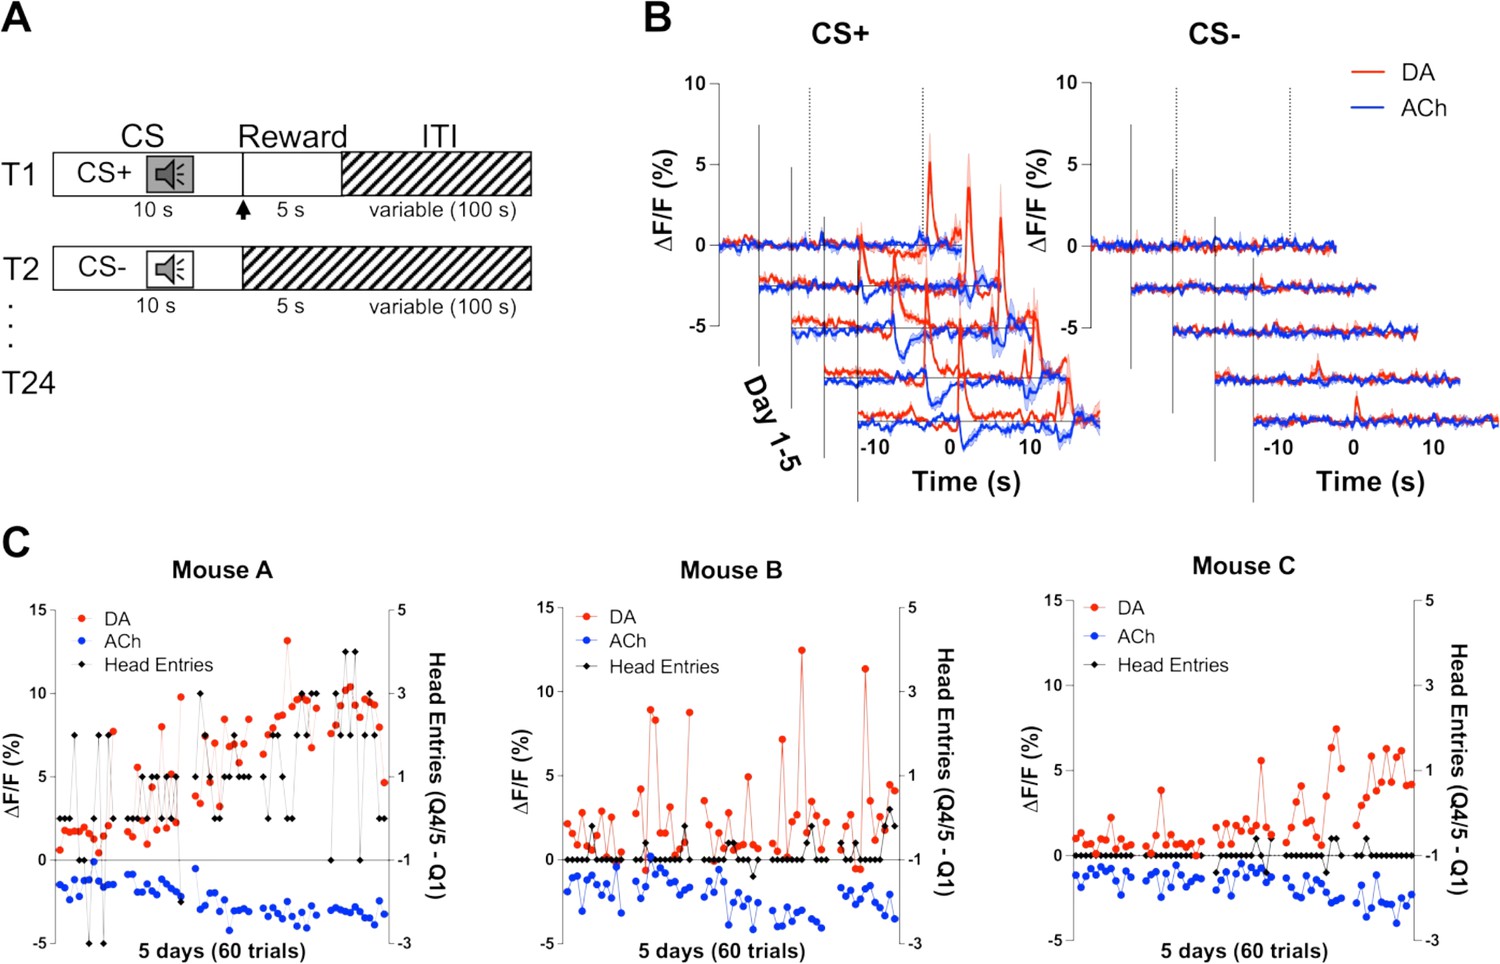
Co-development of dopamine (DA) and acetylcholine (ACh) signals to a reward-predicting cue.
(A) Pavlovian task design. Mice were trained on 24 (12 CS+, 12 CS−) trials/day for 5 days. Each trial starts with a 10 s tone (CS+ or CS−). At the end of the CS+ a dipper comes up presenting a milk food reward for 5 s. There is an intertrial interval (ITI) variable in length (100 s). (B) Changes in fluorescence (ΔF/F [%]) over 5 days of training for DA (red) and ACh (blue) aligned to CS+ (left) and CS− (right) onset. Signals were averaged over 12 CS+ and 12 CS− trials/day, N=3 mice. (C) Maximum change in DA peak (blue) and ACh dip (red) after CS+ onset over 5 days of training (60 trials) for mouse A (left). Anticipatory responding (black) is calculated as the difference in nose poking during the CS+ quintile with the maximum responses (Q4 or 5) and the first quintile. Correlations between DA and ACh maxima and behavioral responding: r=0.4, p<0.002 and r=–0.41, p<0.002 in mouse A, respectively. Correlation between DA and ACh signals: r=–0.7041, p<0.0001. We did not observe the same correlation between DA/ACh and anticipatory responses in mouse B (middle) or mouse C (right). Correlation between DA and ACh signals: mouse B (r=0.03997, p=0.7617) and mouse C (r=–0.6687, p<0.0001).
Figure 3 with 1 supplement
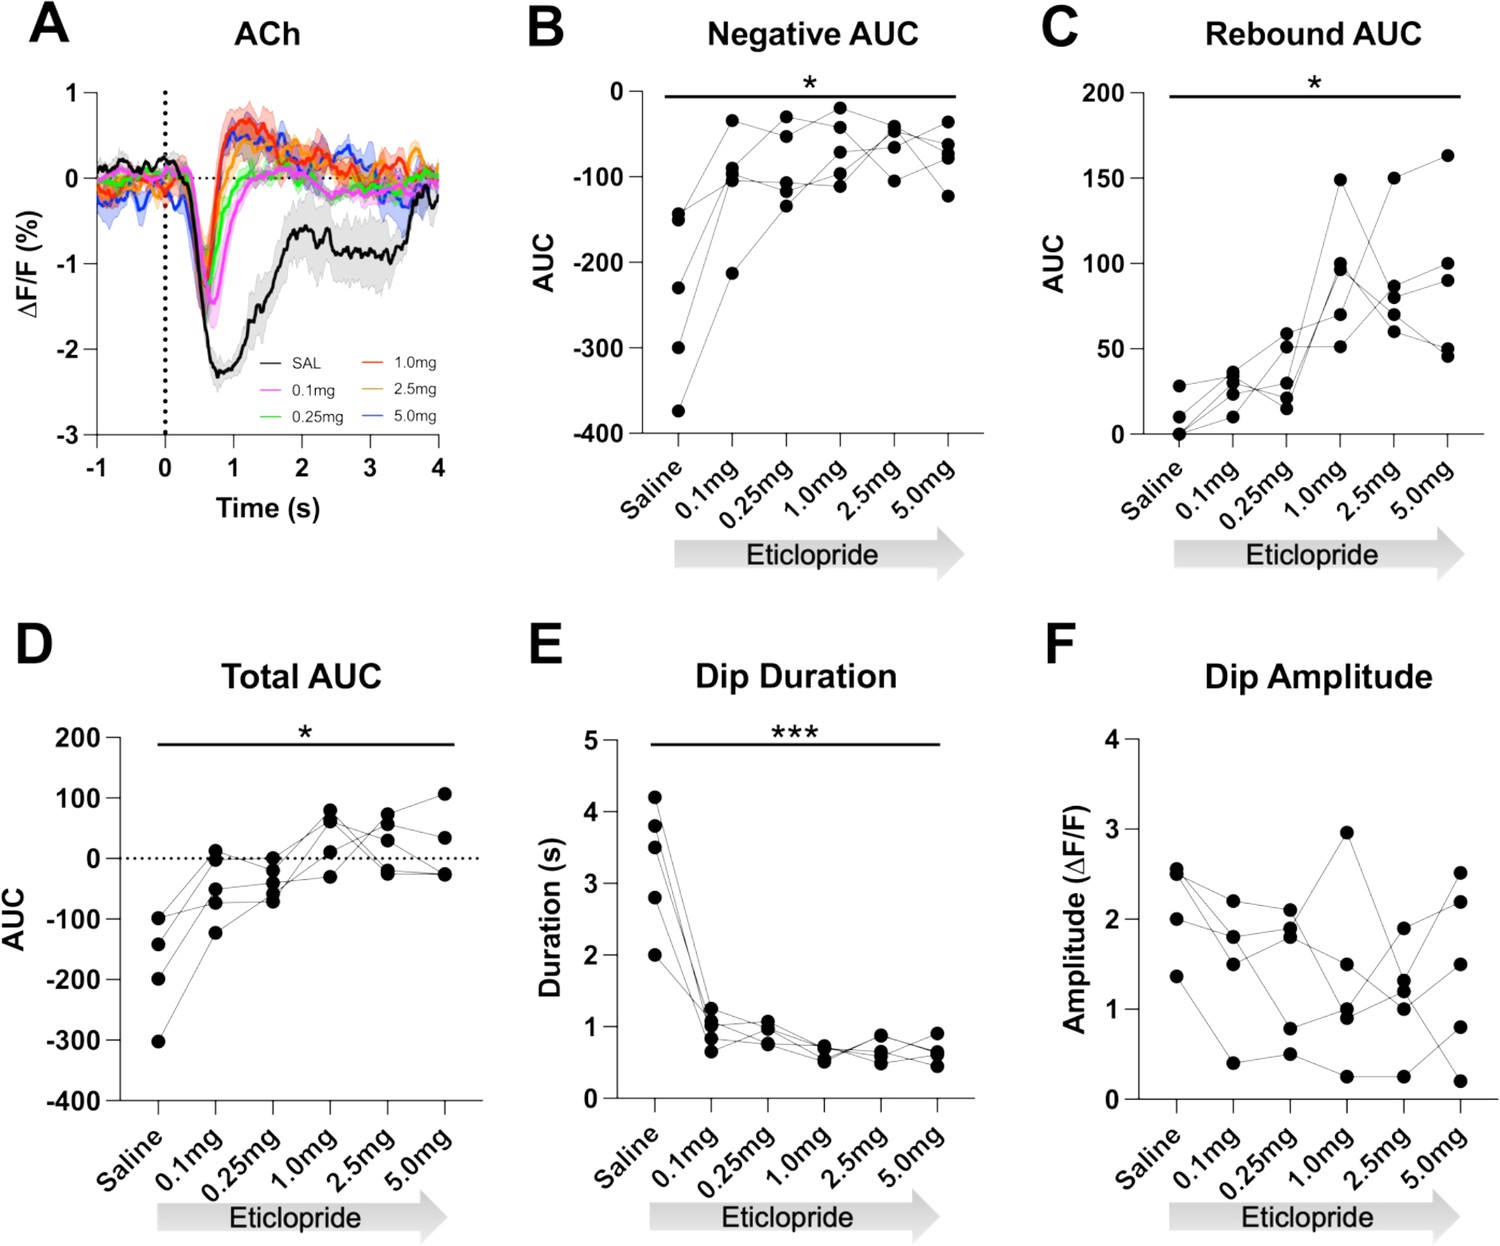
D2R antagonism decreases acetylcholine (ACh) dip duration and enhances rebound.
(A) Changes in ACh fluorescence (ΔF/F [%]) aligned to lever extension with saline (black) and increasing doses of eticlopride: 0.1 mg/kg (pink), 0.25 mg/kg (green), 1.0 mg/kg (red), 2.5 mg/kg (orange), and 5.0 mg/kg (blue). N=5 mice. (B) Negative area under the curve (AUC) is reduced by eticlopride in a dose-dependent manner (RM ANOVA: F(1.694, 6.777)=8.756, p=0.0150). (C) The rebound AUC is increased by eticlopride in a dose-dependent manner ( F(1.549, 6.197)=8.833, p=0.0181). (D) Total AUC is increased by eticlopride in a dose-dependent manner (F(1.612, 6.448)=8.724, p=0.0170). (E) Dip duration is decreased by eticlopride in a dose-dependent manner (F(1.392, 5.569)=36.37, p=0.0009). (F) The dip amplitude was not affected by eticlopride (F(2.063, 8.251)=1.864, p=0.2147).
Figure 3—figure supplement 1
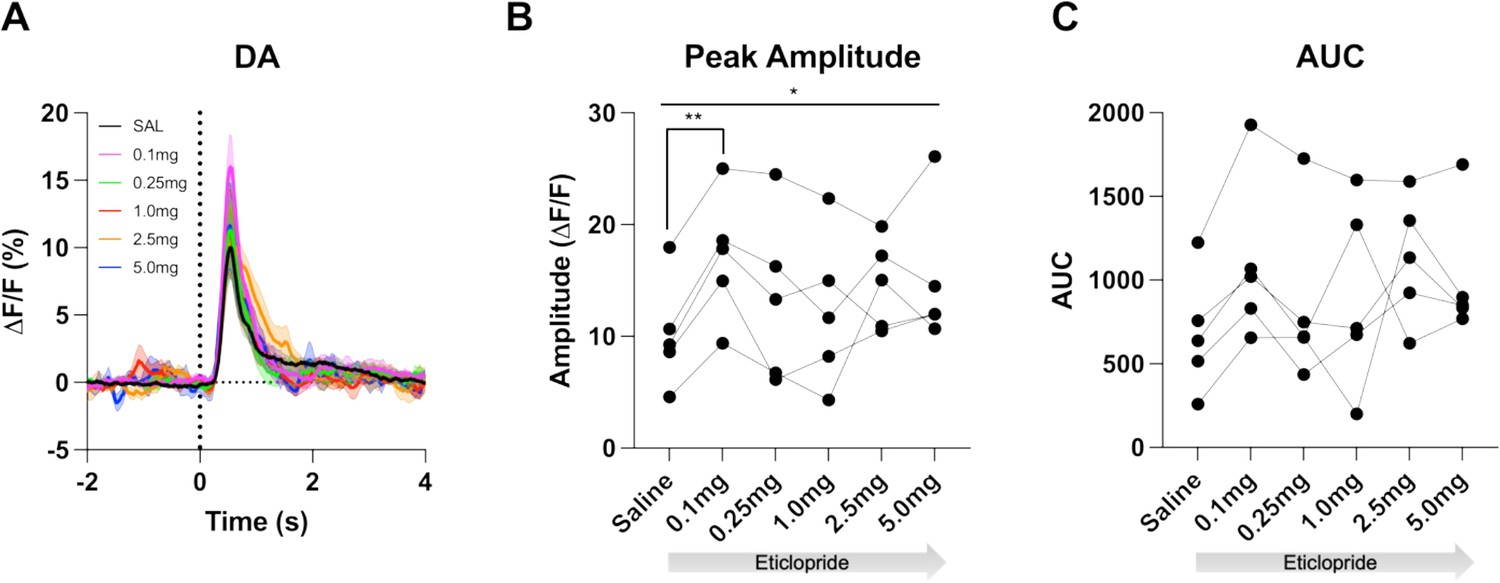
D2R antagonism increases cue-evoked DA release.
(A) Changes in DA fluorescence (ΔF/F [%]) aligned to lever extension with saline (black) and increasing doses of eticlopride: 0.1 mg/kg (pink), 0.25 mg/kg (green), 1.0 mg/kg (red), 2.5 mg/kg (orange) and 5.0 mg/kg (blue) in C57BL/6J mice. N = 5 mice. (B) Peak amplitude is increased by eticlopride in a dose-dependent manner (RM ANOVA: F(2.201, 8.805) = 4.268, p = 0.0480). The most prominent increase in peak amplitude is between saline and 0.1 mg/kg (p = 0.0069). (C) No overall effect of eticlopride on the AUC (F(1.440, 5.759) = 2.347, p = 0.1807).
Figure 4 with 1 supplement
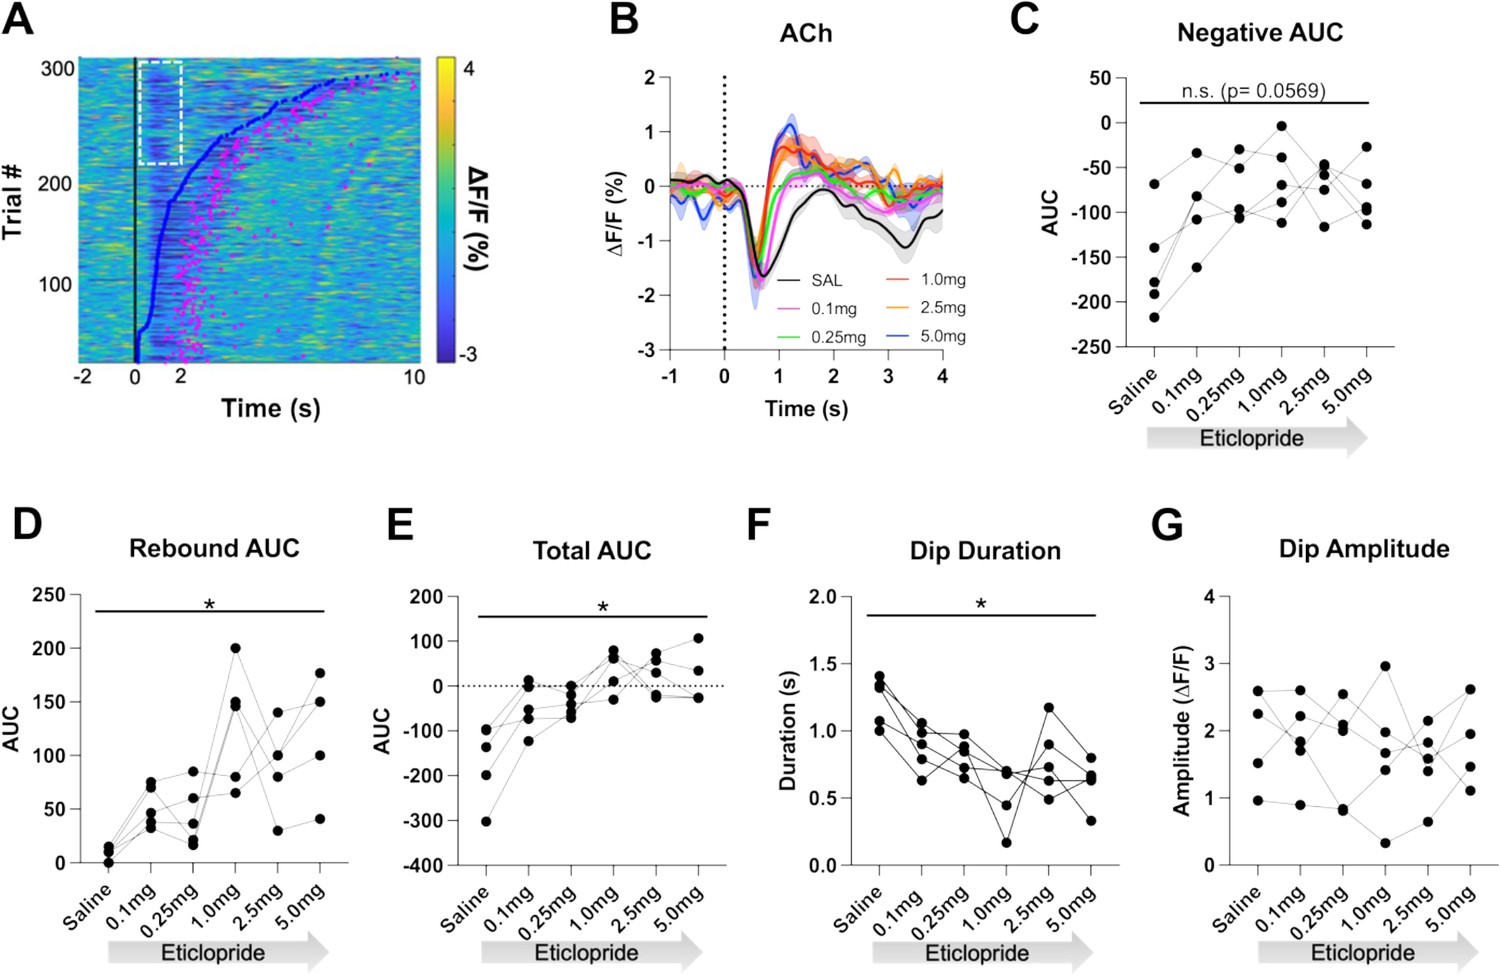
D2R antagonism shortens cue-evoked acetylcholine (ACh) dip and enhances rebound.
(A) Heatmap of ACh responses aligned to lever extension (time = 0 s) for 300 individual trials (60 trials in 5 mice) and sorted by response length (bottom). Blue dots show the lever press, and the pink dots show the head entry for each trial. White dashed box represents the cue-evoked ACh response to the lever extension where press latencies are >2 s. N = 5 mice. (B) Changes in ACh fluorescence (ΔF/F [%]) aligned to lever extension for only trials with press latencies >2 s with increasing doses of eticlopride. (C) Negative area under the curve (AUC) is reduced by eticlopride in a dose-dependent manner (RM ANOVA: F(2.237, 8.950)=3.911, p=0.0569). (D) Rebound AUC is enhanced by eticlopride in a dose-dependent manner (F(1.667, 6.668)=8.143, p=0.0184). (E) Total AUC was increased by eticlopride in a dose-dependent manner (F(1.597, 6.387)=8.542, p=0.0182). (F) Dip duration was significantly decreased by eticlopride in a dose-dependent manner (F(1.657, 6.628)=6.729, p=0.0284). (G) Eticlopride had no effect on the dip amplitude (F(2.722, 10.89)=0.5379, p=0.6503).
Figure 4—figure supplement 1
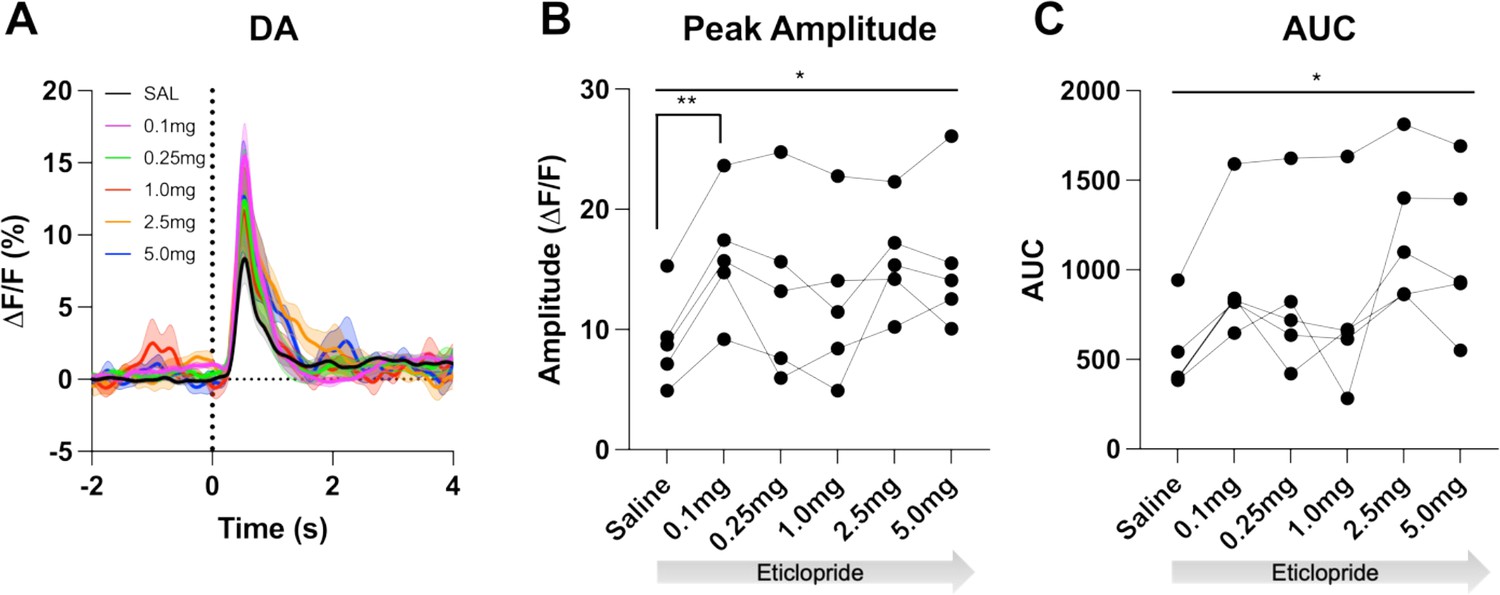
D2R antagonism enhances cue evoked DA release for trials with press latencies > 2s.
(A) Changes in DA fluorescence (ΔF/F (%)) aligned to lever extension for only trials with press latencies > 2 s with increasing doses of eticlopride in C57BL/6J mice. N=5 mice. (B) Peak amplitude of DA is increased by eticlopride in a dose-dependent manner (RM ANOVA: F(2.785, 11.14) = 5.804, p = 0.0133) with the most prominent increase between saline and 0.1 mg/kg (p = 0.0099). (C) DA AUC is increased by eticlopride in a dose-dependent manner (F(1.822, 7.288) = 6.872, p = 0.0244).
Figure 5
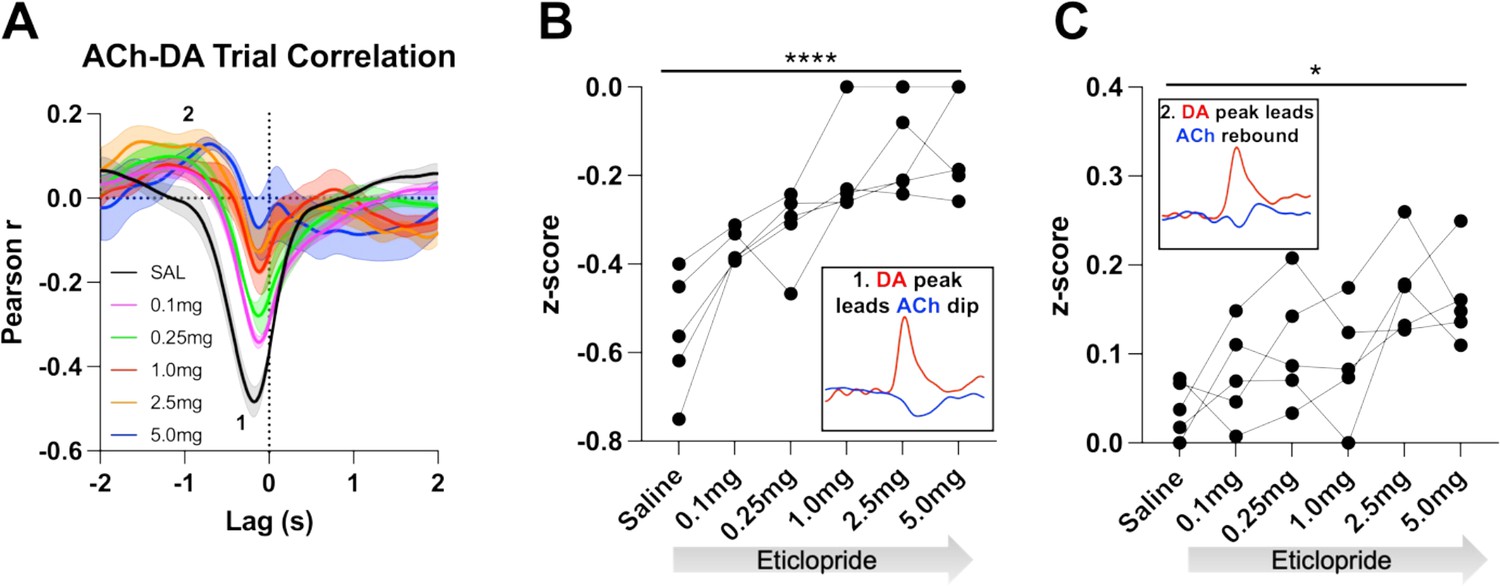
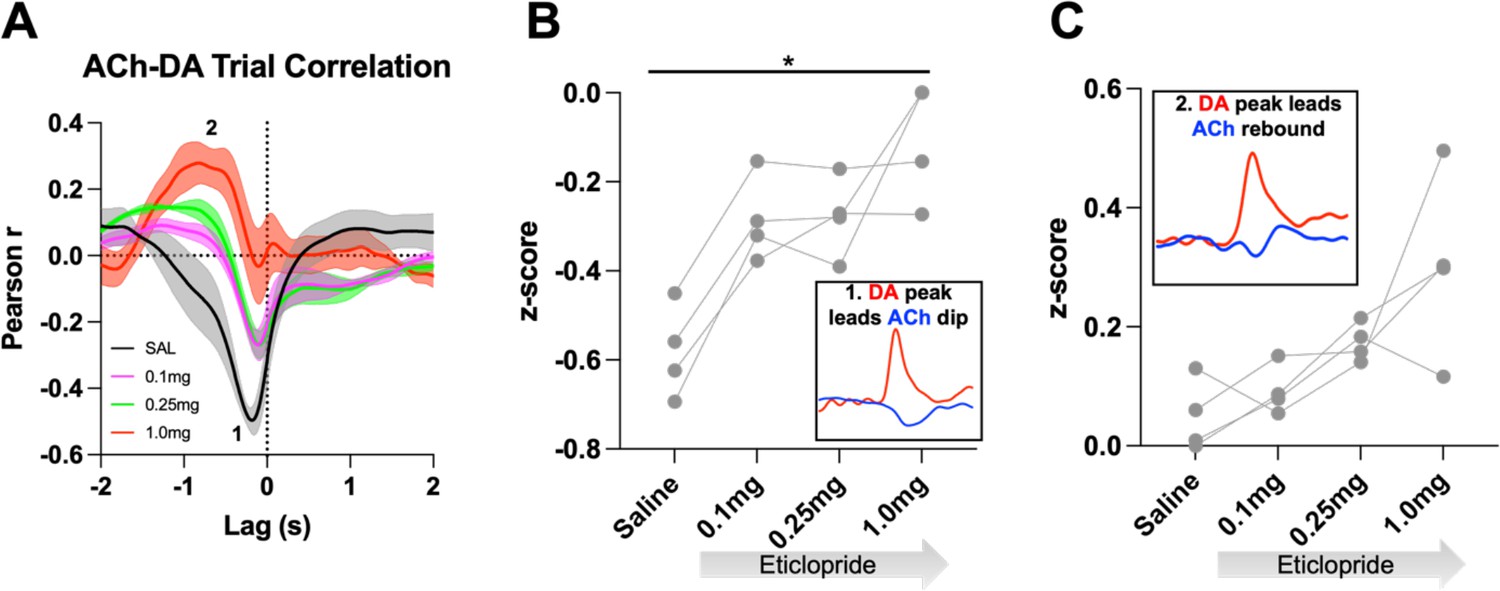
Task-dependent acetylcholine-dopamine (ACh-DA) interactions are altered by D2R antagonism at lever extension.
(A) Correlation between ACh and DA during continuous reinforcement (CRF) trials with increasing doses of eticlopride in 5 C57BL/6J mice. The ACh signal moved in front of or behind the DA signal to identify points of highest correlation. The first correlation is a negative correlation (1) with ACh lagging DA (Lag = –178.92 ± 14.38 ms) and the second correlation is a positive correlation (2) with ACh lagging DA (Lag = –1.5 ± 0.138 s). N=5 mice. (B) The negative correlation with the DA peak leading the ACh dip (inset) is significantly reduced dose dependently by eticlopride (RM ANOVA: F(2.596, 10.38)=18.67, p<0.0001). (C) The positive correlation with the DA peak leading the ACh rebound (inset) is enhanced by eticlopride in a dose-dependent manner (F(2.326, 9.303)=4.694, p=0.0352).
Figure 6
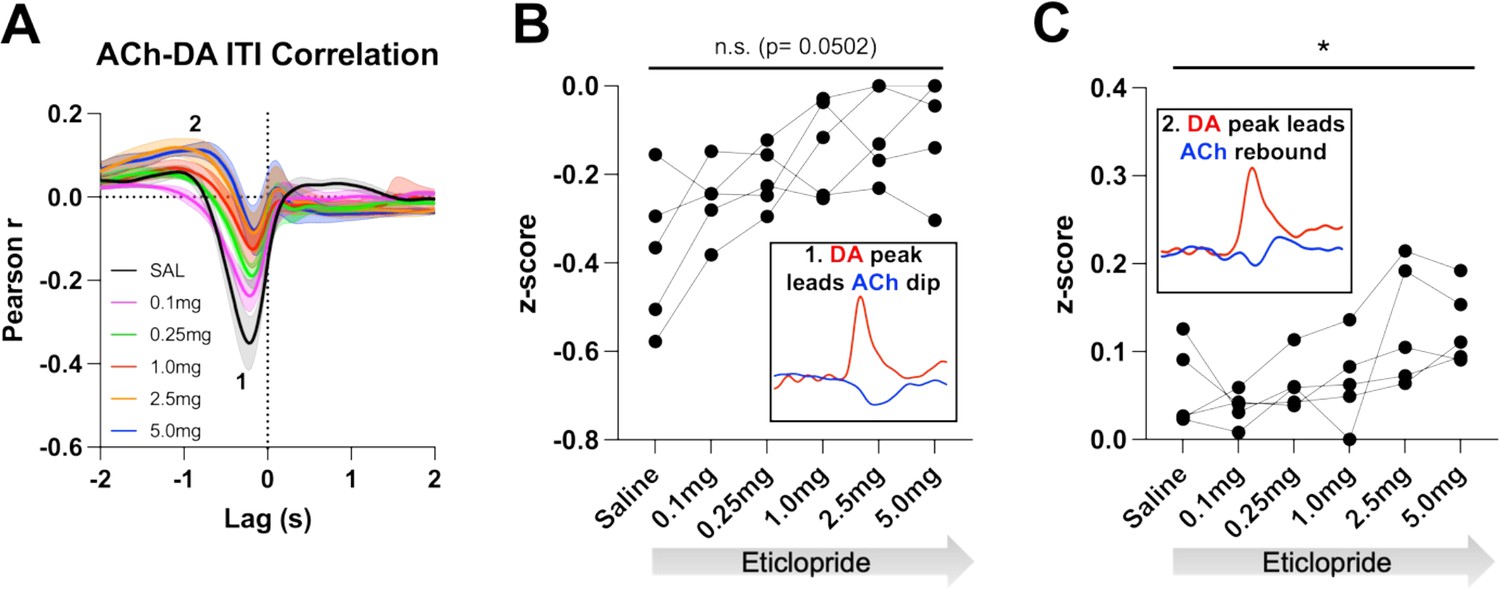
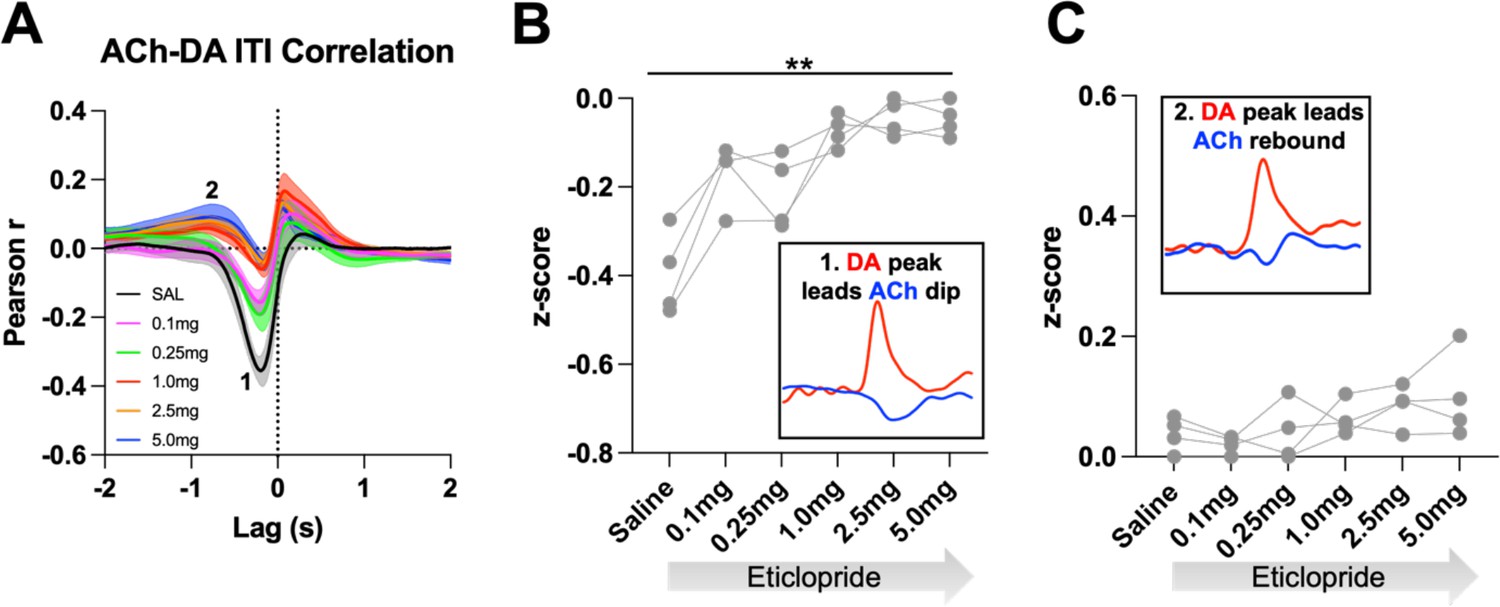
Acetylcholine-dopamine (ACh-DA) interactions are altered by D2R antagonism during the intertrial interval (ITI).
(A) Correlation between ACh and DA during the ITI with increasing doses of eticlopride in C57BL/6J mice. We observe the same two correlations during the ITI: a negative correlation (1) with ACh lagging DA (Lag = –212.34 ± 16.91 ms) and a positive correlation (2) with ACh lagging DA (Lag = –1.41 ± 0.19 s). N = 5 mice. (B) The negative correlation with the DA peak leading the ACh dip (inset) is decreased by eticlopride in a dose-dependent manner (RM ANOVA: F(1.850, 7.400)=4.689, p=0.0502). (C) The positive correlation with the DA peak leading the ACh rebound (inset) is increased dose dependently by eticlopride (F(2.129, 8.515)=4.877, p=0.0373).
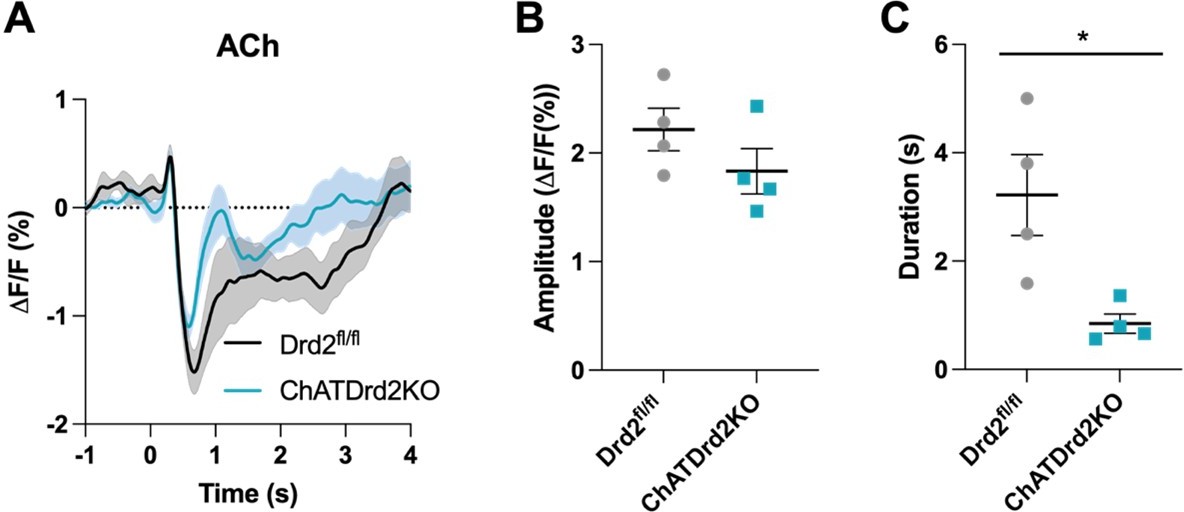
Figure 7 with 1 supplement
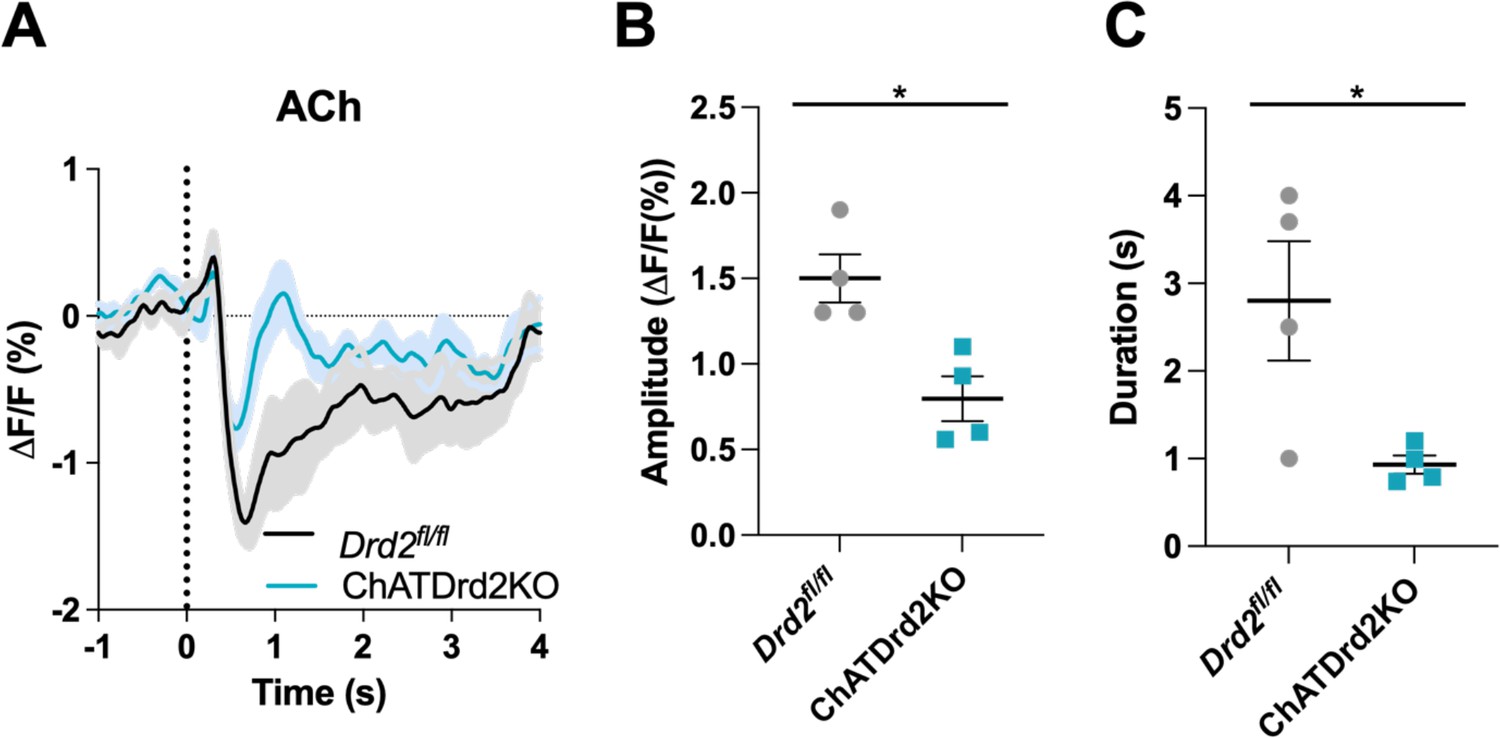
Selective D2R ablation from cholinergic interneurons (CINs) alters the cue-evoked acetylcholine (ACh) dip.
(A) Changes in ACh fluorescence (ΔF/F [%]) aligned to lever extension for only trials with press latencies >2 s for Drd2fl/fl control (black) and ChATDrd2KO (blue) mice, N=4 mice/genotype. (B) Dip amplitude is significantly smaller in ChATDrd2KO animals compared to controls (t-test: p=0.0107). (C) Dip duration is significantly shorter in ChATDrd2KO mice compared to Drd2fl/fl controls (p=0.0351).
Figure 7—figure supplement 1
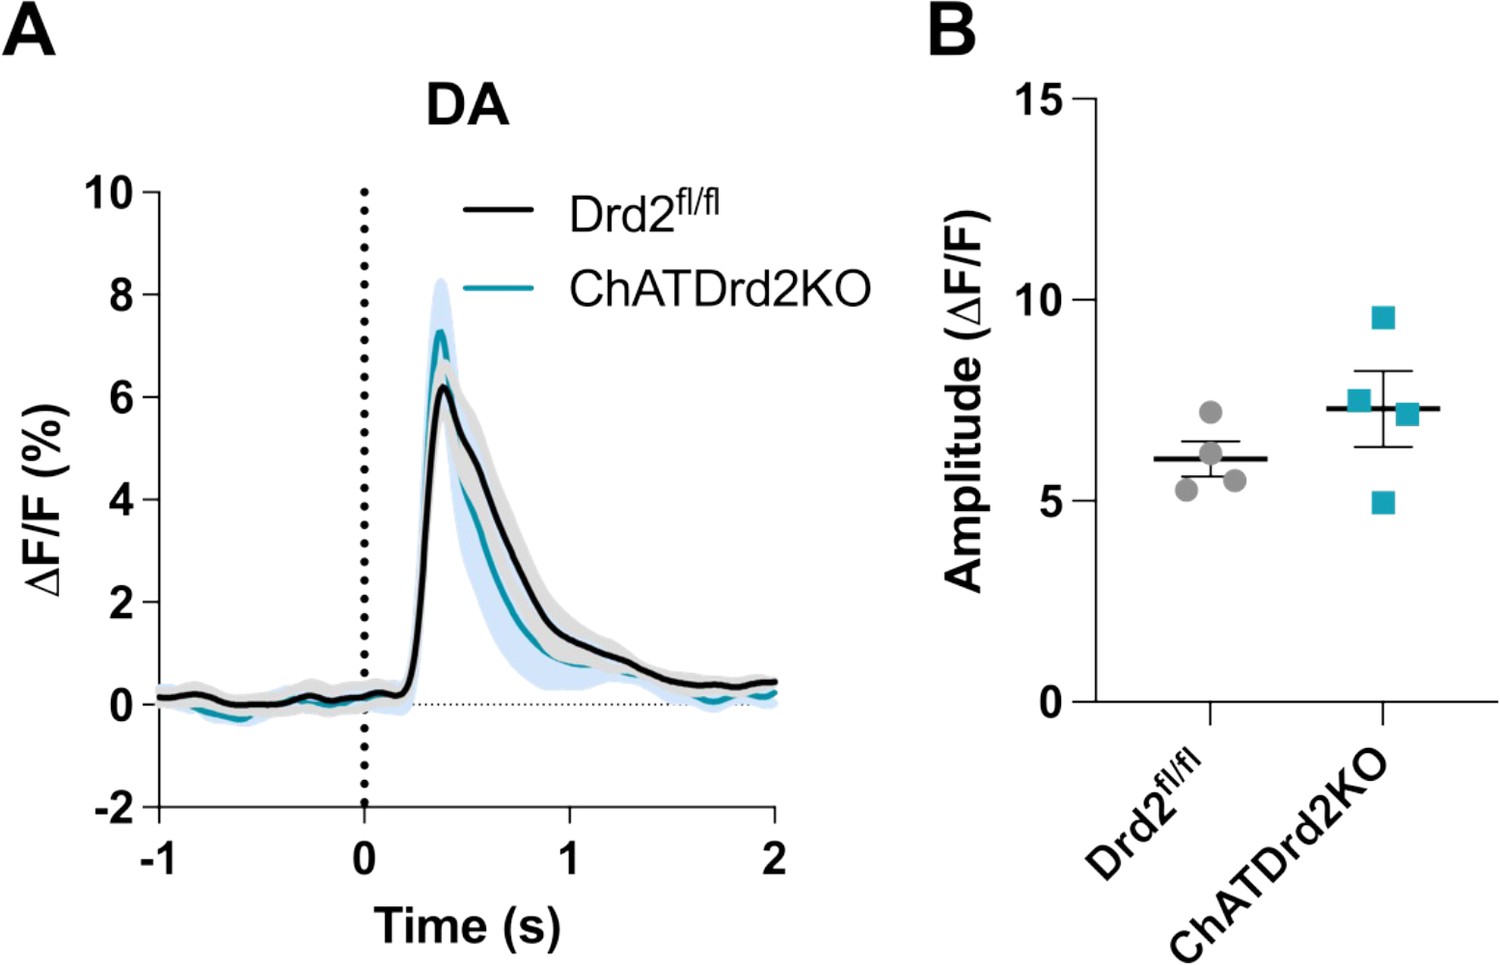
Selective D2R ablation from CINs does not alter cue-evoked DA release for trials with press latencies > 2 s.
(A) Changes in DA fluorescence (ΔF/F (%)) aligned to lever extension for only trials with press latencies > 2 s for Drd2fl/fl control (black) and ChATDrd2KO (blue) mice, N=4 mice/genotype. (B) The DA peak amplitude is comparable between ChATDrd2KO and Drd2fl/fl control mice (t-test: p = 0.2744).
Figure 8

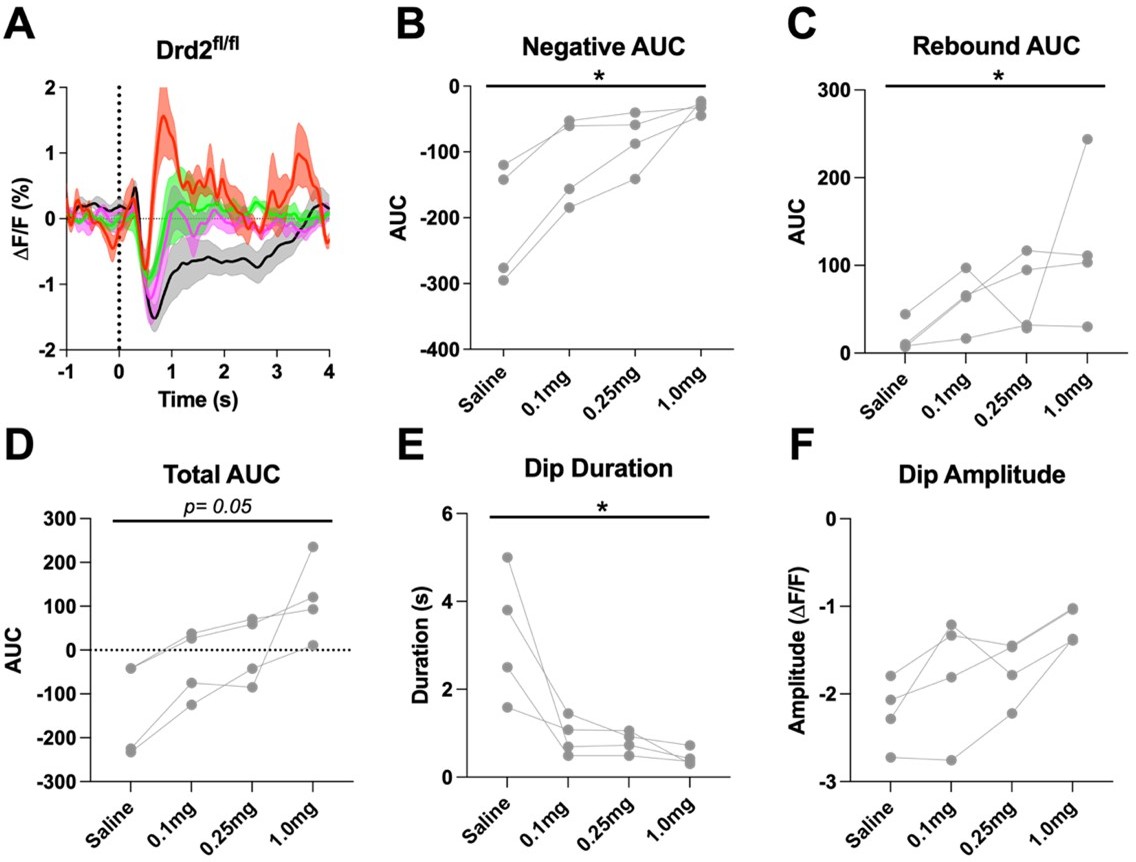
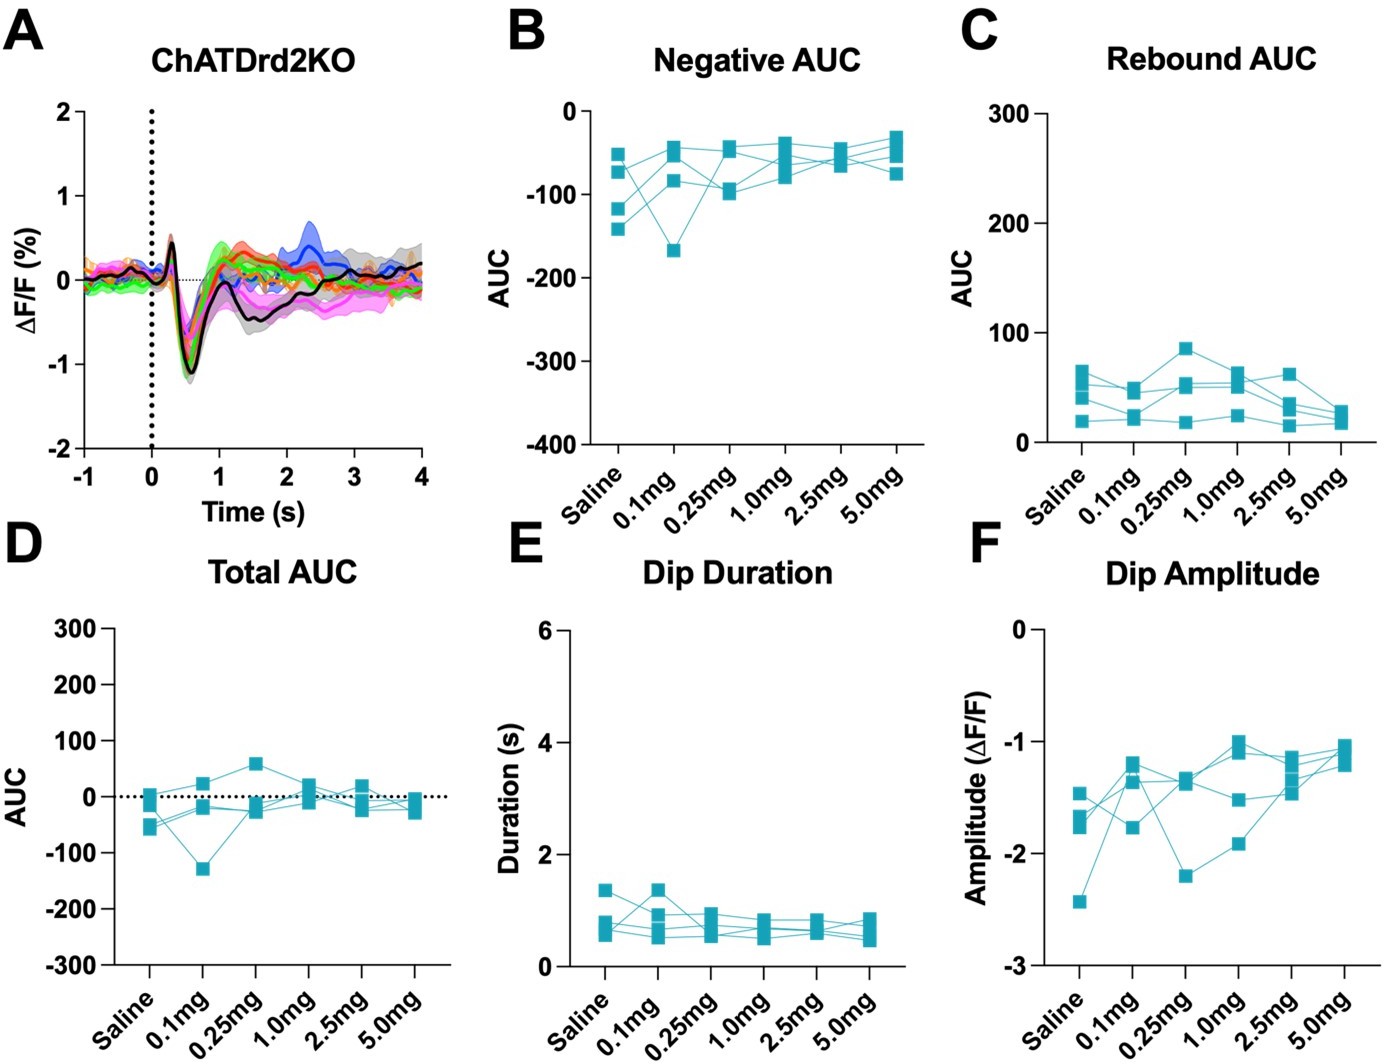
D2R antagonism does not alter the cue-evoked acetylcholine (ACh) dip in ChATDrd2KO mice.
(A) Changes in ACh fluorescence (ΔF/F [%]) aligned to lever extension for only trials with press latencies >2 s for Drd2fl/fl control mice with increasing doses of eticlopride. N = 4 mice (B) Negative area under the curve (AUC) is decreased by eticlopride in a dose-dependent manner (RM ANOVA: F(1.387, 4.160)=8.541, p=0.0381). (C) Rebound AUC is increased by eticlopride in a dose-dependent manner (F(1.642, 4.925)=10.21, p=0.0195). (D) Total AUC is increased dose dependently by eticlopride (F(1.525, 4.676)=23.14, p=0.0047). (E) Dip duration is decreased by eticlopride in a dose-dependent manner (F(1.664,4.992)=9.279, p=0.0226). (F) Dip amplitude is not affected by eticlopride (F(1.433, 4.300)=6.056, p=0.0606). (G) Changes in ACh fluorescence (ΔF/F [%]) aligned to lever extension for only trials with press latencies >2 s for ChATDrd2KO mice with increasing doses of eticlopride. N = 4 mice (H) Negative AUC is not affected by eticlopride (F(1.663, 4.990)=0.7919, p=0.4803). (I) Rebound AUC is not affected by eticlopride (F(1.706, 5.119)=2.857, p=0.1484). (J) Total AUC is not affected by eticlopride (F(1.844, 5.532)=1.079, p=0.3958). (K) Dip duration is not affected by eticlopride (F(1.848, 5.545)=0.4380, p=0.6516). (L) Dip amplitude is not affected by eticlopride (F(2.073, 6.219)=2.546, p=0.1551).
Figure 9 with 4 supplements
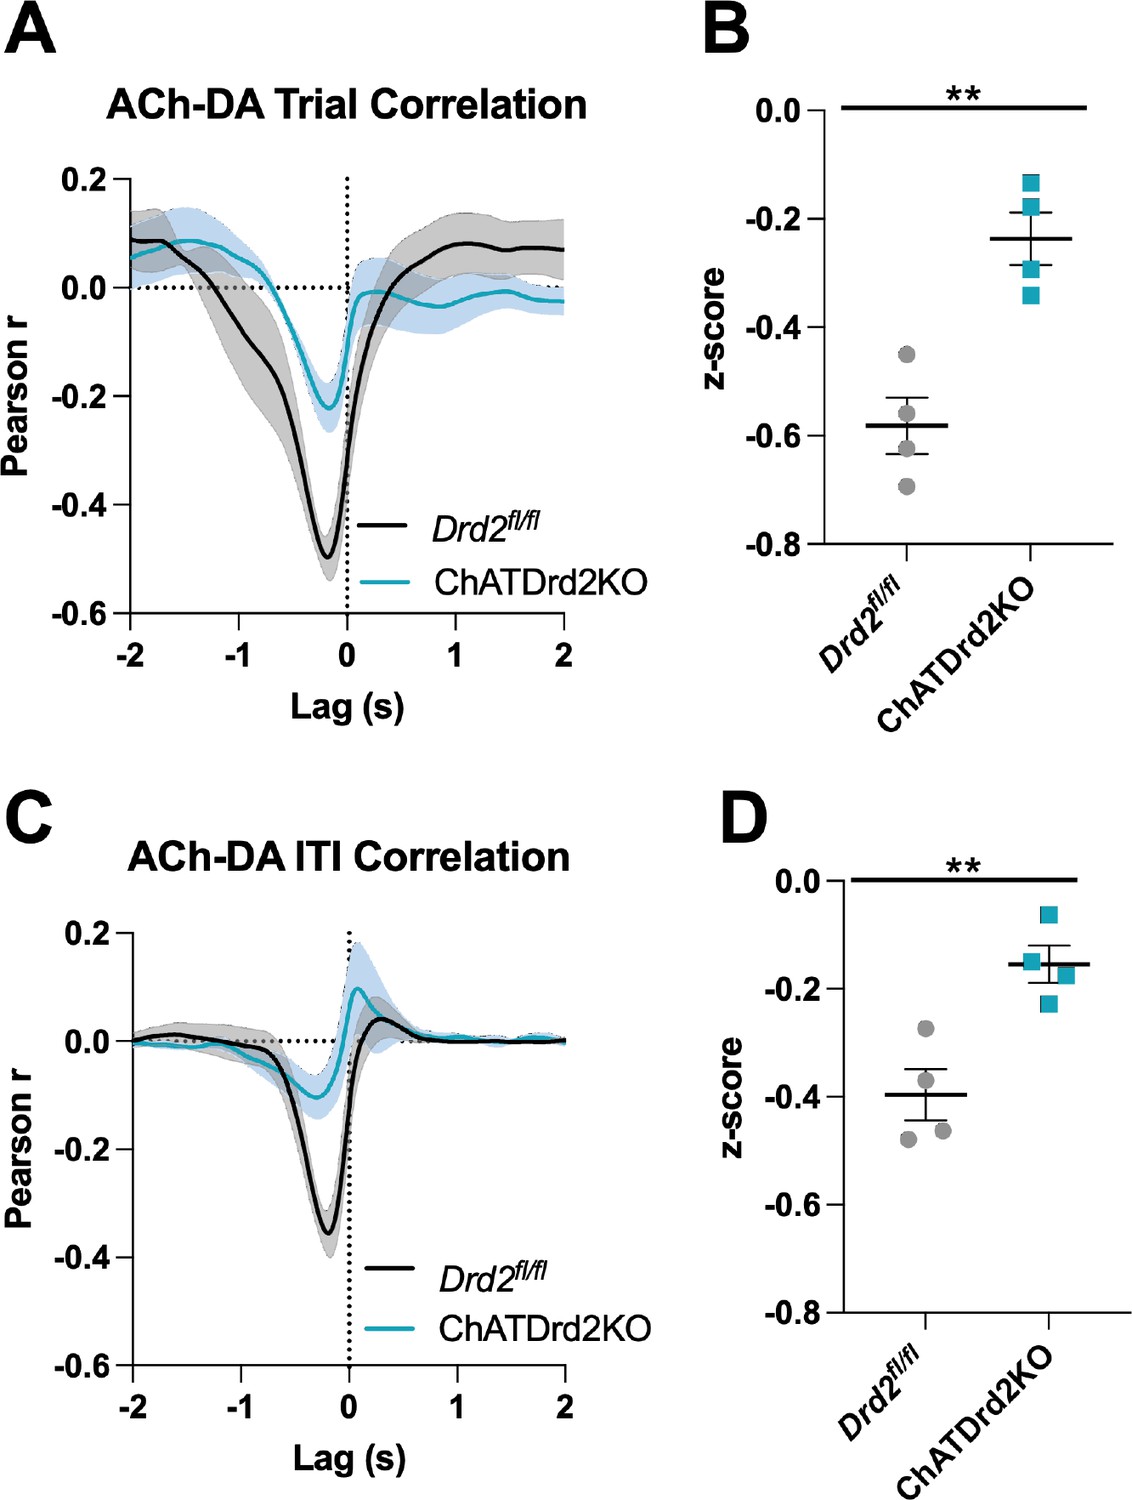
Acetylcholine-dopamine (ACh-DA) interactions are reduced in ChATDrd2KO mice.
(A) Task-evoked correlation between ACh and DA for Drd2fl/fl control (black) and ChATDrd2KO (blue) mice. N = 4 mice/genotype (B) The negative correlation with ACh lagging DA is significantly reduced in ChATDrd2KO mice compared to Drd2fl/fl controls (t-test: p=0.0028). (C) Correlation between ACh and DA during the intertrial interval (ITI) for Drd2fl/fl control (black) and ChATDrd2KO (blue) mice. (D) The negative correlation of ACh lagging DA is significantly reduced in ChATDrd2KO mice compared to Drd2fl/fl controls (p=0.0062).
Figure 9—figure supplement 1
D2R antagonism alters cue-evoked ACh-DA interactions at the lever extension.
(A) Correlation between ACh and DA during CRF trials with increasing doses of eticlopride in Drd2fl/fl control mice. The ACh signal moved in front of or behind the DA signal to identify points of highest correlation. The first correlation is a negative correlation (1) with ACh lagging DA (Lag = -167.12ms ±18.82 ms) and the second correlation is a positive correlation (2) with ACh lagging DA (Lag = -1.51 s ± 0.138 s) N = 4 mice (B) The negative correlation with the DA peak leading the ACh dip (inset) is decreased by eticlopride in a dose-dependent manner (RM ANOVA: F(1.172, 3.515) = 17.74, p = 0.0169). (C) The positive correlation with the DA peak leading the ACh rebound (inset) is increased by eticlopride in a dose-dependent manner (F(1.280, 3.840) = 6.728, p = 0.0604).
Figure 9—figure supplement 2
D2R antagonism alters ACh-DA interactions in Drd2fl/fl control mice during the ITI.
(A) Correlation between ACh and DA during the ITI with increasing doses of eticlopride in Drd2fl/fl control mice. The ACh signal moved in front of or behind the DA signal to identify points of highest correlation. The first correlation is a negative correlation (1) with ACh lagging DA (Lag = -213.81 ms ± 34.14 ms) and the second correlation is a positive correlation (2) with ACh lagging DA (Lag = -1.39 s ± 0.208 s) N = 4 mice. (B) The negative correlation with the DA peak leading the ACh dip (inset) is dose-dependently reduced by eticlopride (RM ANOVA: F(2.104, 6.043) = 18.73, p = 0.0026). (C) The positive correlation with the DA peak leading the ACh rebound (inset) is not significantly affected by eticlopride (F(1.276, 3.827) = 2.492, p = 0.1975).
Figure 9—figure supplement 3
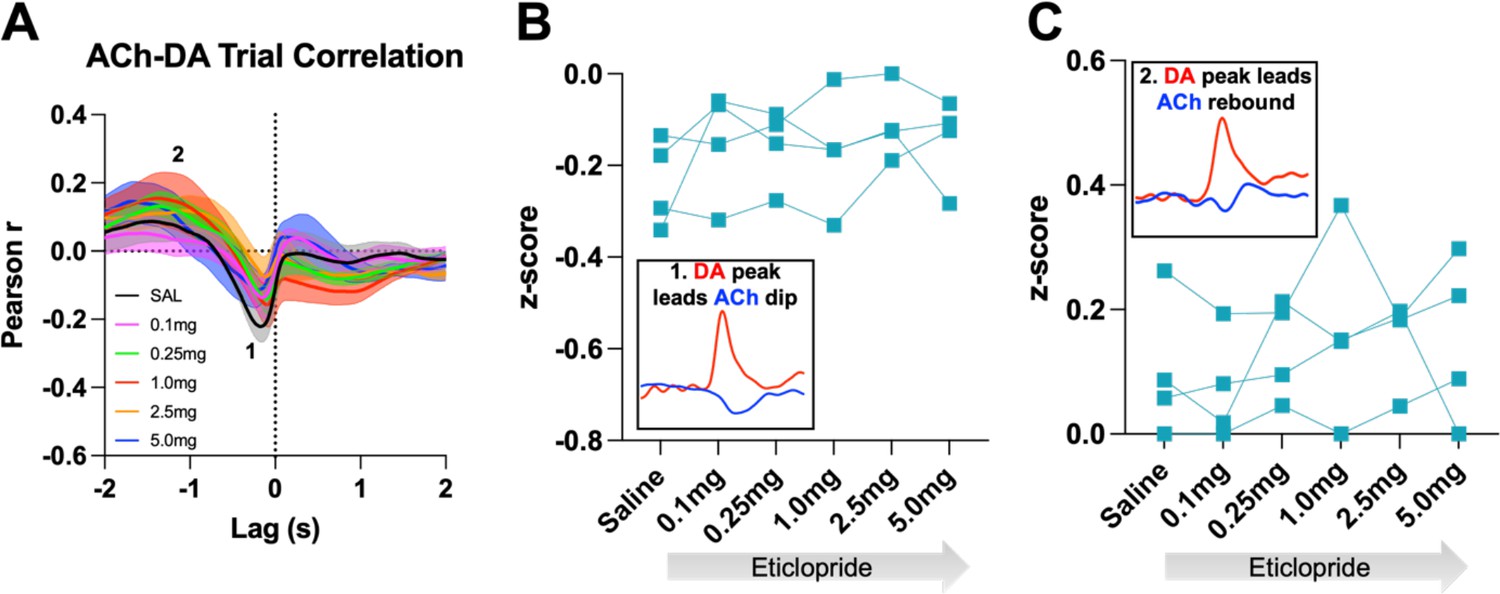
D2R antagonism does not alter cue evoked ACh-DA interactions in ChATDrd2KO mice at the lever extension.
(A) Correlation between ACh and DA during CRF trials with increasing doses of eticlopride in ChATDrd2KO mice. The ACh signal moved in front of or behind the DA signal to identify points of highest correlation. The first correlation is a negative correlation (1) with ACh lagging DA (Lag = -179.41 ms ± 30.66 ms) and the second correlation is a positive correlation (2) with ACh lagging DA (Lag = -1.635 s ± 0.174 s).N = 4 mice. (B) The negative correlation with the DA peak leading the ACh dip (inset) is not affected by eticlopride (RM ANOVA: F(1.704, 5.111) = 1.183, p = 0.3671). (C) The positive correlation with the DA peak leading the ACh rebound (inset) is not affected by eticlopride (F(2. 040, 6.120) = 0.9066, p = 0.4540).
Figure 9—figure supplement 4
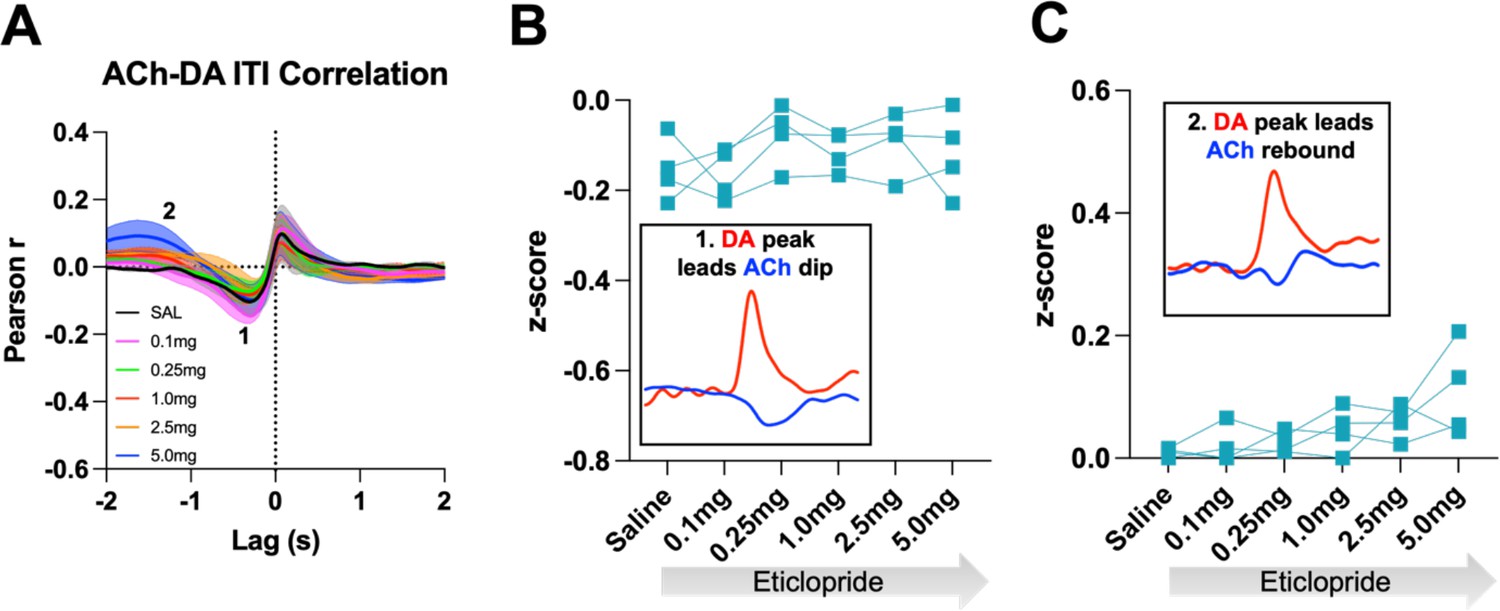
D2R antagonism does not alter general ACh-DA interactions in ChATDrd2KO mice during the ITI.
(A) Correlation between ACh and DA during CRF trials with increasing doses of eticlopride in ChATDrd2KO mice. The ACh signal moved in front of or behind the DA signal to identify points of highest correlation. The first correlation is a negative correlation (1) with ACh lagging DA (Lag = -282.62 ms ± 93.81 ms) and the second correlation is a positive correlation (2) with ACh lagging DA (Lag = -1.33 s ± 0.189 s) N = 4 mice. (B) The negative correlation with the DA peak leading the ACh dip (inset) is not affected by eticlopride (RM ANOVA: F(1.509, 4.526) = 1.357, p = 0.3294). (C) The positive correlation with the DA peak leading the ACh rebound (inset) is not affected by eticlopride (F(1.728, 5.183) = 4.808, p = 0.0686).
Figure 10 with 1 supplement
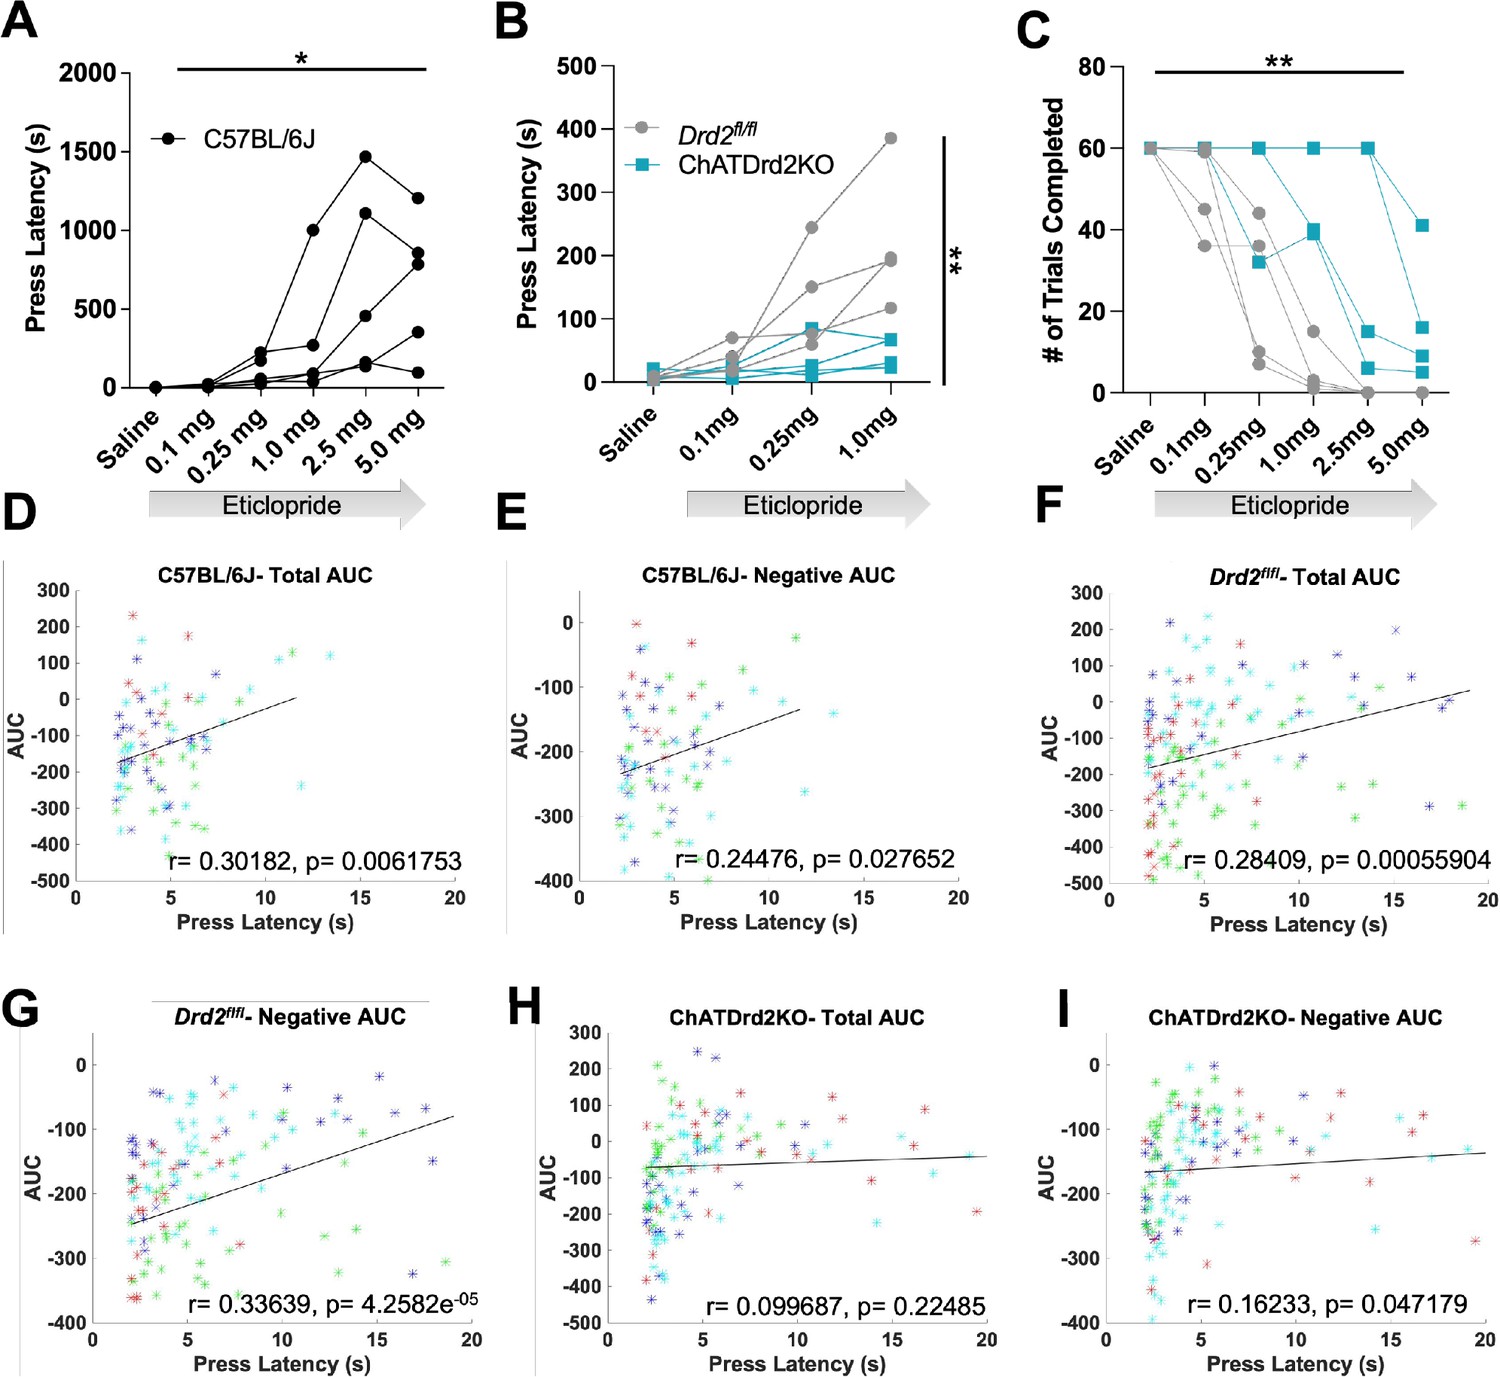
Behavioral responding correlates with acetylcholine (ACh) event size but is affected by D2R antagonism and ablation.
(A) Lever press latency is increased by eticlopride in a dose-dependent manner in C57BL/6J mice (RM ANOVA: F(1.383, 5.533)=6.369, p=0.0427). N = 5 mice (B) D2R antagonism does not increase lever press latency in ChATDrd2KO mice (blue squares) compared to Drd2fl/fl controls (gray circles) (F(3,18) = 5.664, p=0.0065, eticlopride × genotype). N = 4 mice/genotype (C) Eticlopride significantly increased the total # of trials completed in both ChatDrd2KO and Drd2fl/fl mice (genotype × dose effect: F(5,30) = 4.817), p=0.0024 (D) Total area under the curve (AUC) positively correlates with lever press latency in C57BL/6J mice (r=0.30182, p=0.0061753). (E) Negative AUC positively correlates with lever press latency in C57BL/6J mice (r=0.24476, p=0.027652). (F) Total AUC positively correlates with lever press latency in Drd2fl/fl control mice (r=0.28409, p=0.00055904). (G) Negative AUC positively correlates with lever press latency in Drd2fl/fl control mice (r=0.33639, p=4.2582e–05). (H) Total AUC does not correlate with lever press latency in ChATDrd2KO mice (r=0.099687, p=0.22485). (I) Negative AUC positively correlates with lever press latency in ChATDrd2KO mice (r=0.16233, p=0.047179).
Figure 10—figure supplement 1
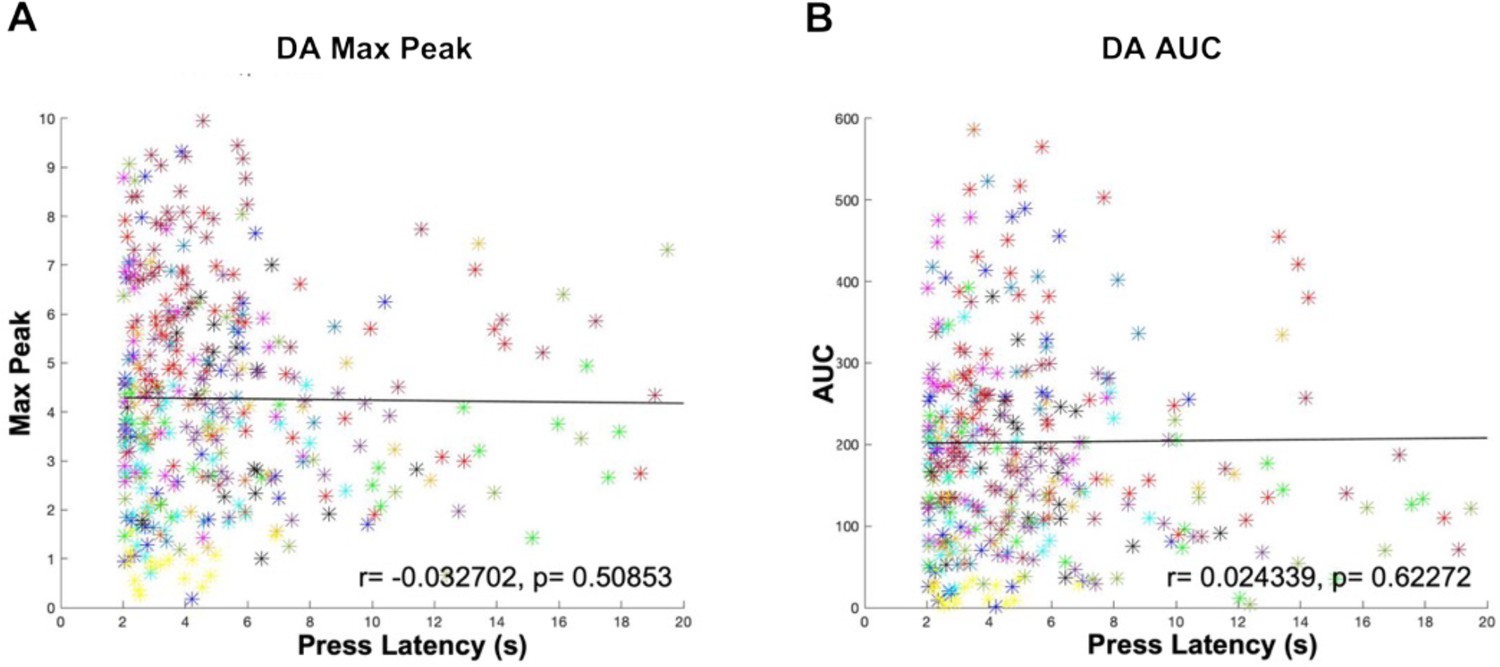
Press latency does not correlate with the size of the cue-evoked DA transient.
No correlation between the DA signal and press behavioral responding during the CRF task in all three groups (C57BL/6J, Drd2fl/fl, ChATDrd2KO) mice when comparing (A) DA max peak or (B) DA AUC and press latency.N = 13 mice.
Figure 11
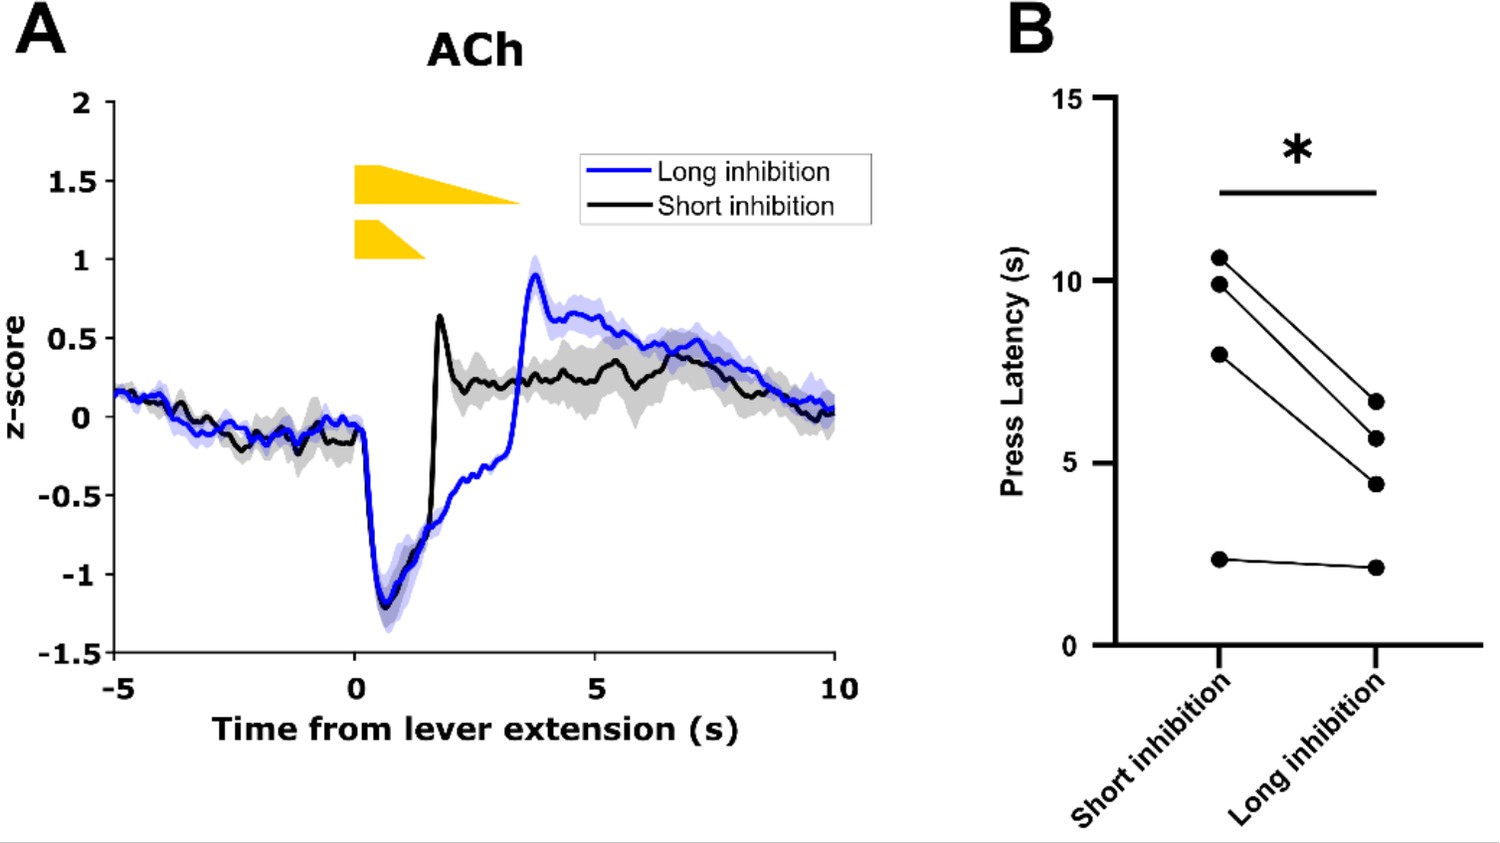
Acetylcholine (ACh) decrease duration regulates motivated behavior.
(A) Short inhibition and long inhibition of cholinergic interneurons (CINs) during lever extension in the continuous reinforcement (CRF) task, respectively, produces short and long duration decreases in ACh (N=3 mice, one mouse excluded due to lack of GACh3.0 signal). (B) Mice exhibited longer lever press latency on short inhibition trials compared to long inhibition trials (N=4 mice, t-test: p=0.049).
Author response image 1
Selective D2R ablation from CINs alters the cue evoked ACh pause when using all trials.
(A) Changes in ACh fluorescence (ΔF/F (%)) aligned to lever extension for all trials for control (black) and D2R KO (blue), N=4/ genotype. (B) There is no difference in the dip amplitude between Drd2fl/fl control and ChATDrd2KO mice (p = 0.2289). (C) The dip duration is significantly shorter in D2R KO animals compared to controls (p = 0.0213).
Author response image 2
D2R antagonism alters the cue evoked ACh dip in Drd2fl/fl control mice when using all trials (A) Changes in ACh fluorescence (ΔF/F (%)) aligned to lever extension for all trials with increasing doses of eticlopride.
(B) Negative AUC is decreased by eticlopride in a dose-dependent manner (F(1.236, 3.708) = 13.65, p = 0.0224). (C) Rebound AUC is increased by eticlopride in a dose-dependent manner (F(1.546, 4.639) = 8.457, p = 0.0312). (D) Total AUC is increased dose-dependently by eticlopride (F(1.122, 3.365) = 8.852, p = 0.0050). (E) Dip duration is decreased by eticlopride in a dose-dependent manner (F(1.080, 3.241) = 10.74, p = 0.0411). (F) Dip amplitude is not affected by eticlopride (F(1.135, 3.405) = 7.999, p = 0.0562).
Author response image 3
D2R antagonism does not the cue evoked ACh dip in ChATDrd2KO mice when using all trials (A) Changes in ACh fluorescence (ΔF/F (%)) aligned to lever extension for all trials with increasing doses of eticlopride.
(B) Negative AUC is not affected by eticlopride (F(1.404, 4.213) = 1.248, p = 0.3507). (C) Rebound AUC is not affected by eticlopride (F(2.414, 7.243) = 2.689, p = 0.1296). (D) Total AUC is not affected by eticlopride (F(1.844, 5.532) = 1.079, p = 0.3958). (E) Dip duration is not affected by eticlopride (F(1.701, 5.103) = 0.7879, p = 0.4835). (F) Dip amplitude is not affected by eticlopride (F(1.601, 4.803) = 3.232, p = 0.1316).
Author response image 4
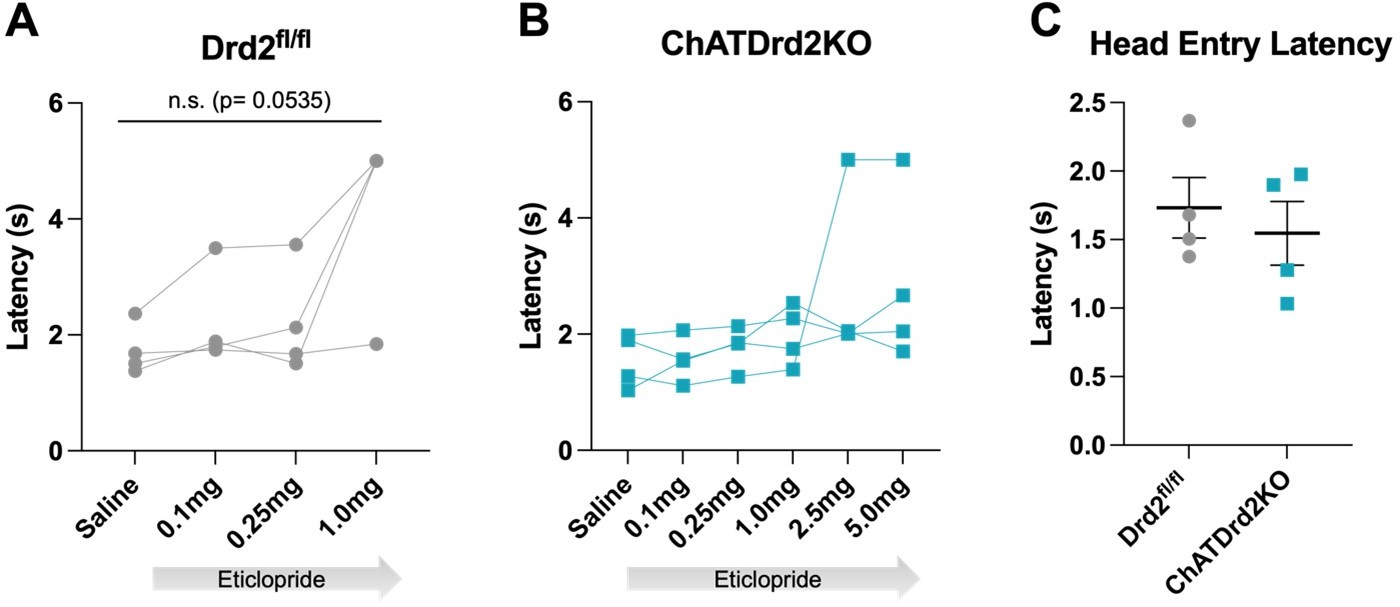
Head entry latency.
Latency to head entry for reward after lever press with increasing doses of eticlopride (A) Drd2fl/fl control mice (F(1.223, 3.670) = 7.677, p = 0.0535) or (B) ChatDrd2KO mice (F(1.106, 3.317) = 1.483, p = 0.3100) (C) No difference in head entry latency between Drd2fl/fl and ChATDrd2 KO mice at baseline (p = 0.5805).
Author response image 5
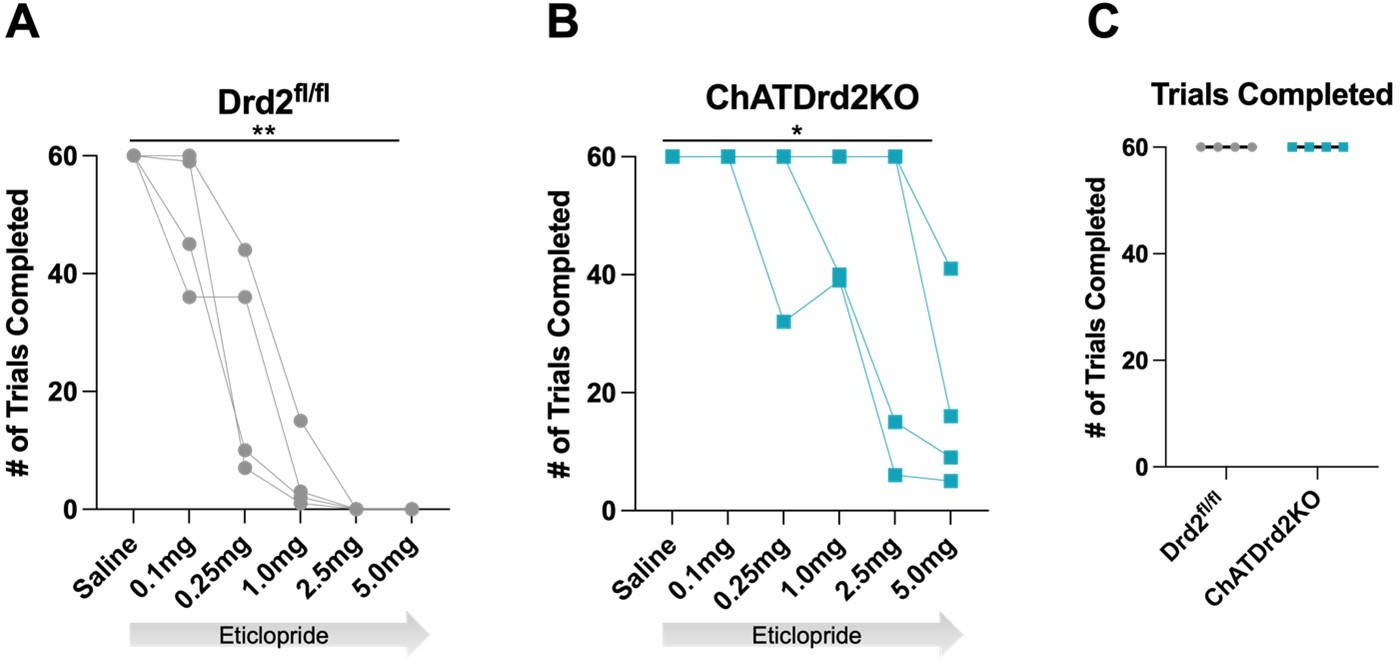
Trials Completed.
The total # of trials completed was significantly reduced by eticlopride in (A) Drd2fl/fl control mice (F(1.607, 4.820) = 35.14, p = 0.0015) or (B) ChatDrd2KO mice (F(1.649, 4.948) = 7.371 p = 0.0353) (C) No difference in the # of completed trials between Drd2fl/fl and ChATDrd2 KO mice at baseline.
Author response image 6

Genotype x dose effect of eticlopride between Drd2fl/fl and ChatDrd2KO mice.
(A) A trending but non-significant effect on the Negative AUC (Genotype x dose: F(3, 18) = 3.113, p = 0.0522). (B) A significant effect on the Rebound AUC (Genotype x dose: F(3,18) = 4.600, p=0.0147). (C) A significant effect on the Total AUC (Genotype x dose: F(3,18) = 8.106, p=0.0013). (D) A significant effect on the Dip Duration (Genotype x dose: F(3,18) = 10.41, p=0.0003). (E) No effect on the Dip Amplitude (Genotype x dose: F(3,18) = 1.611, p=0.2219).
Tables
Key resources table
| Reagent type (species) or resource | Designation | Source or reference | Identifiers | Additional information |
|---|---|---|---|---|
| Gene (Mus musculus) | C57BL/6J | JAX | Cat. #: 000664 | |
| Gene (Mus musculus) | ChAT-IRES-Cre | Rossi et al., 2011 | JAX stock Cat. #: 031661 | |
| Gene (Mus musculus) | Drd2fl/fl | Bello et al., 2011 | ||
| Genetic reagent (adeno-associated virus) | AA5-hSYN-dLight1.2 | Addgene | Cat. #: 111,068 | |
| Genetic reagent (adeno-associated virus) | AA5-hSYN-ACh3.0 | Addgene | Cat. #: 121,922 | |
| Genetic reagent (adeno-associated virus) | AAV5-EF1α-DIO- eNpHR3.0 | UNC Vector Core | Cat. #: 129,381 | |
| Chemical compound, drug | Eticlopride | Tocris | Cat. #: 1847 | 0.1, 0.25, 1.0, 2.5, 5.0 mg/kg |
| Chemical compound, drug | Scopolamine | Tocris | Cat. #: 1414 | 15 mg/kg |
| Software, algorithm | Analysis | Synapse | Tucker-Davis Technologies | |
| Software, algorithm | Analysis | MATLAB | MathWorks | DIO Link (Pavlovian): 10.6084 /m9.figshare.19586026 DIO Link (CRF): 0.6084 /m9.figshare.19586032 |
| Software, algorithm | Analysis | Prism 9 | GraphPad |
Additional files
Download links
A two-part list of links to download the article, or parts of the article, in various formats.
Downloads (link to download the article as PDF)
Open citations (links to open the citations from this article in various online reference manager services)
Cite this article (links to download the citations from this article in formats compatible with various reference manager tools)
Dopamine D2Rs coordinate cue-evoked changes in striatal acetylcholine levels
eLife 11:e76111.
https://doi.org/10.7554/eLife.76111


