Neural dynamics of causal inference in the macaque frontoparietal circuit
- Institute of Neuroscience, Key Laboratory of Primate Neurobiology, CAS Center for Excellence in Brain Science and Intelligence Technology, Chinese Academy of Sciences, China
- University of Chinese Academy of Sciences, China
Figures
Figure 1 with 2 supplements
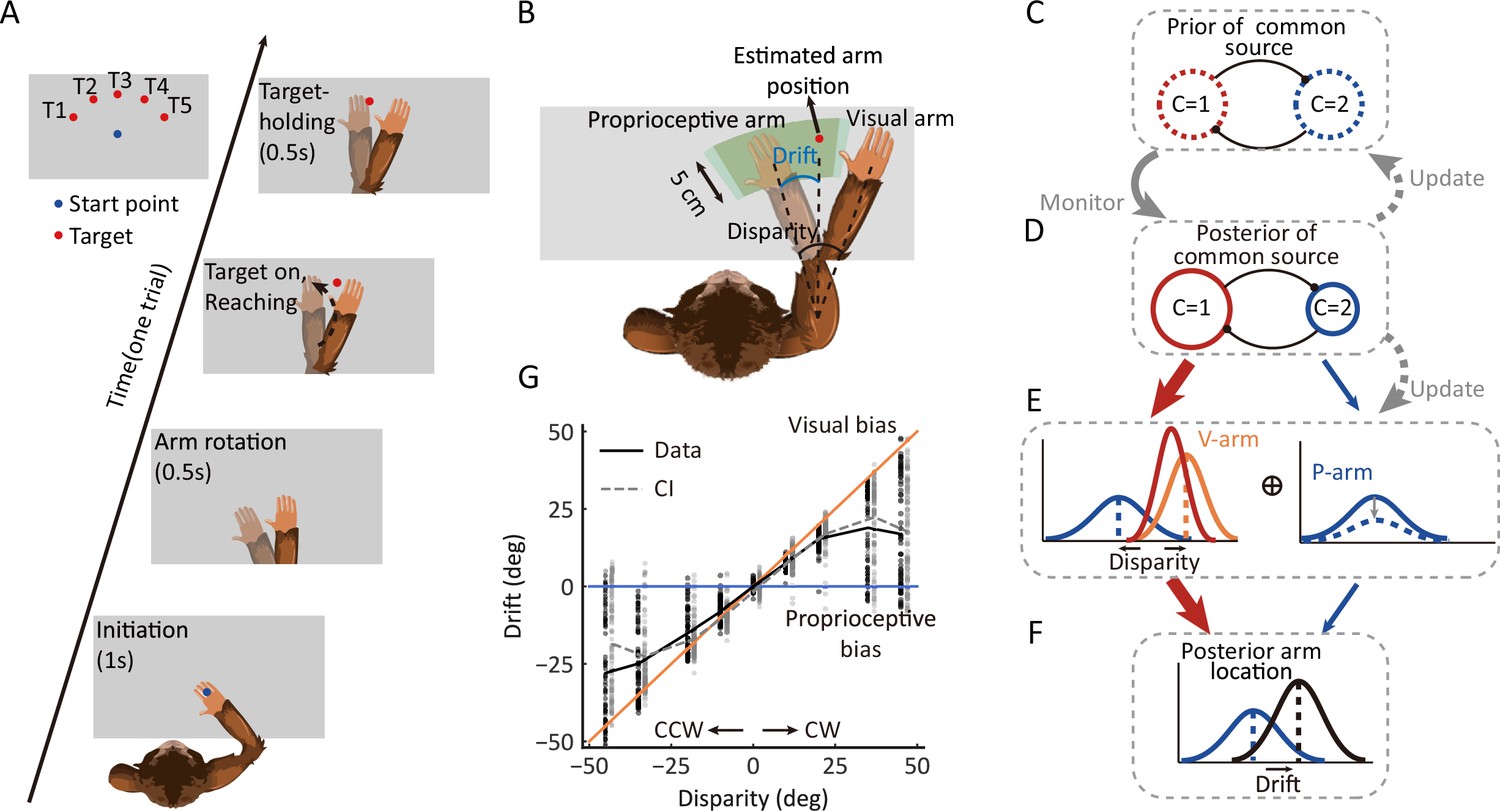
Behavioral task, the dynamic hierarchical causal inference model, and proprioceptive drift results.
(A) Overview of the behavioral task. The monkey was instructed to hold its proprioceptive arm over the starting position (blue dot) to initiate one trial. After the virtual visual arm rotation, a virtual red dot was presented, and the monkey was required to place its proprioceptive arm on the target and hold it to get a reward. (B) Schematic drawing of reward area, proprioceptive drift, and the different types of arms (proprioceptive and virtual/visual). Here, proprioceptive drift was defined as the rotated degree from the proprioceptive arm position to the estimated arm position (the same as the target location) measured from the shoulder. The reward area is defined by the green area, which ensures the monkey performed the task rationally and without visual feedback (see animal training in Materials and methods). (C–F) Schematic drawing of the dynamic hierarchical causal inference model. V-arm, visual arm signal; P-arm, proprioceptive arm signal; C=1: both V-arm and P-arm come from a common source; C=2: V-arm and P-arm come from different sources. (G) Example behavioral results from one session of one monkey (also see Figure 1—figure supplement 1 and Figure 1—figure supplement 2). CCW, counterclockwise; CW, clockwise. The black line represents raw data. The gray line represents the Bayesian causal inference (BCI) model fitting result. The black dots represent experimental trials and the gray dots represent simulated trials by the BCI model.
-
Figure 1—source code 1
Related to Figure 1G.
- https://cdn.elifesciences.org/articles/76145/elife-76145-fig1-code1-v2.zip
-
Figure 1—source data 1
Related to Figure 1G.
- https://cdn.elifesciences.org/articles/76145/elife-76145-fig1-data1-v2.zip
Figure 1—figure supplement 1
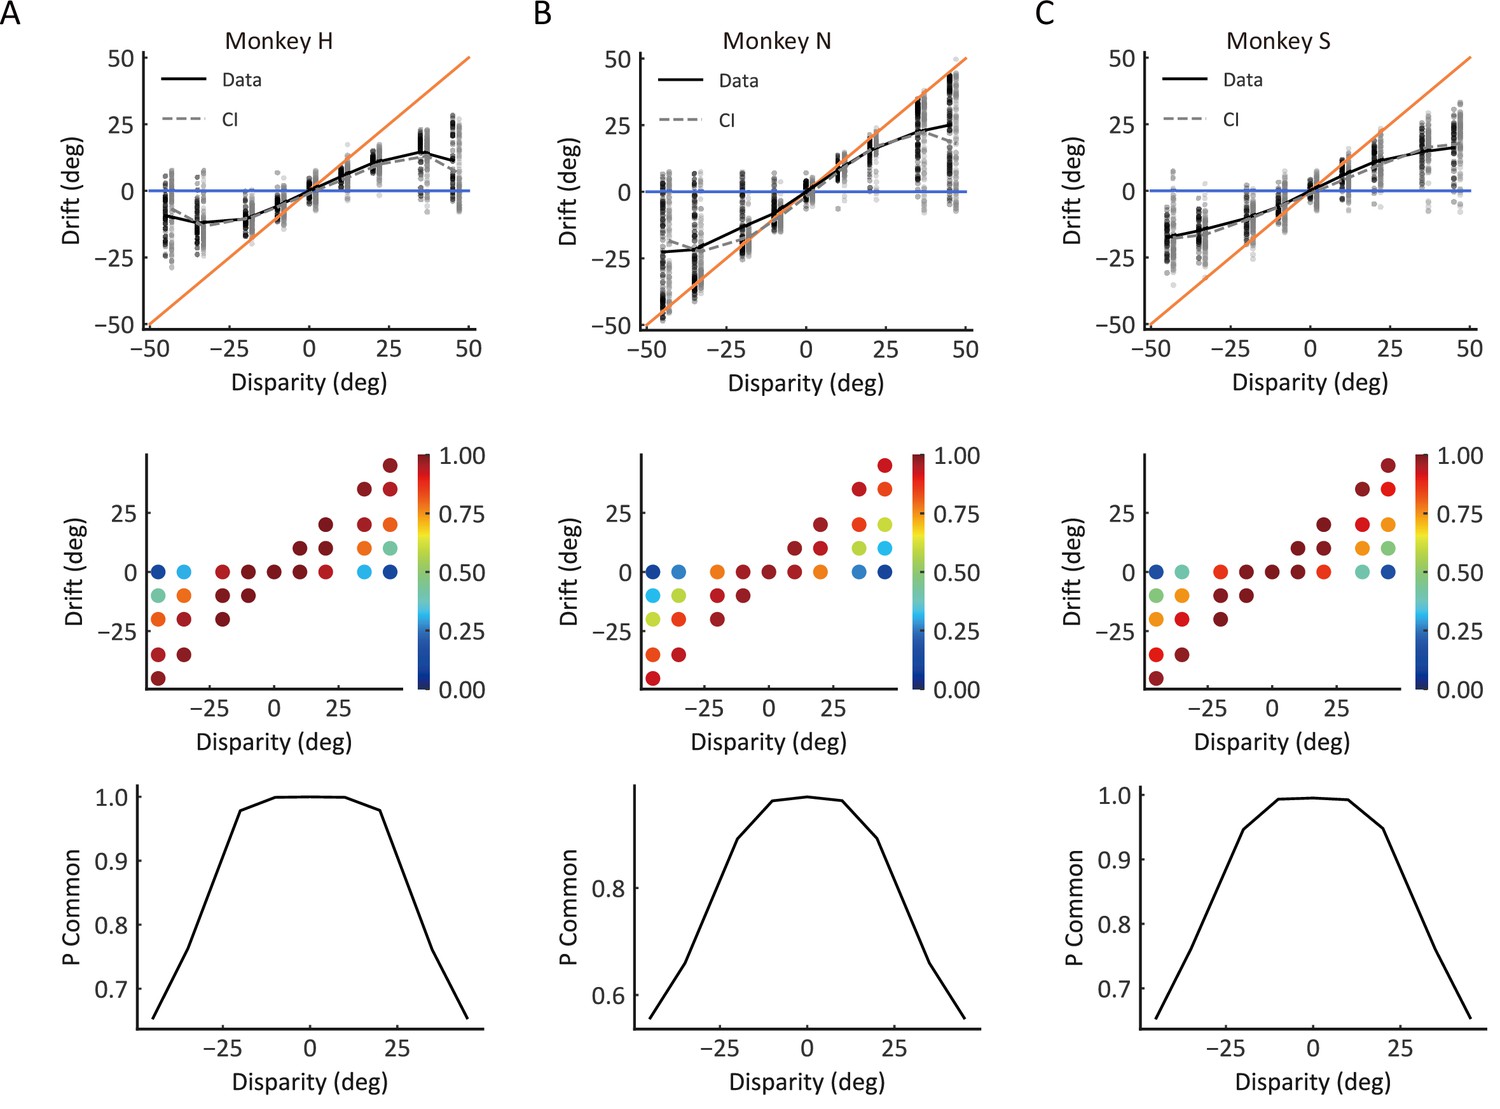
Behavior performance and causal inference model predict results in individual monkeys.
(A) The pattern of drift is consistent across all three monkeys (black lines and dots), and the predictions of the causal inference model (gray lines and dots) characterized the monkeys’ behavior data. Each dot represents a single trial, and lines represent the average result. The blue and orange solid lines represent the visual and proprioceptive bias, respectively. (B) Model prediction of the posterior probability of a common source (Pcom). Each dot represents the averaged Pcom in a cluster grouped by the disparity and drift based on the monkey’s behavior. (C) Average Pcom as the function of disparity. The black lines represent the average Pcom of each monkey.
Figure 1—figure supplement 2
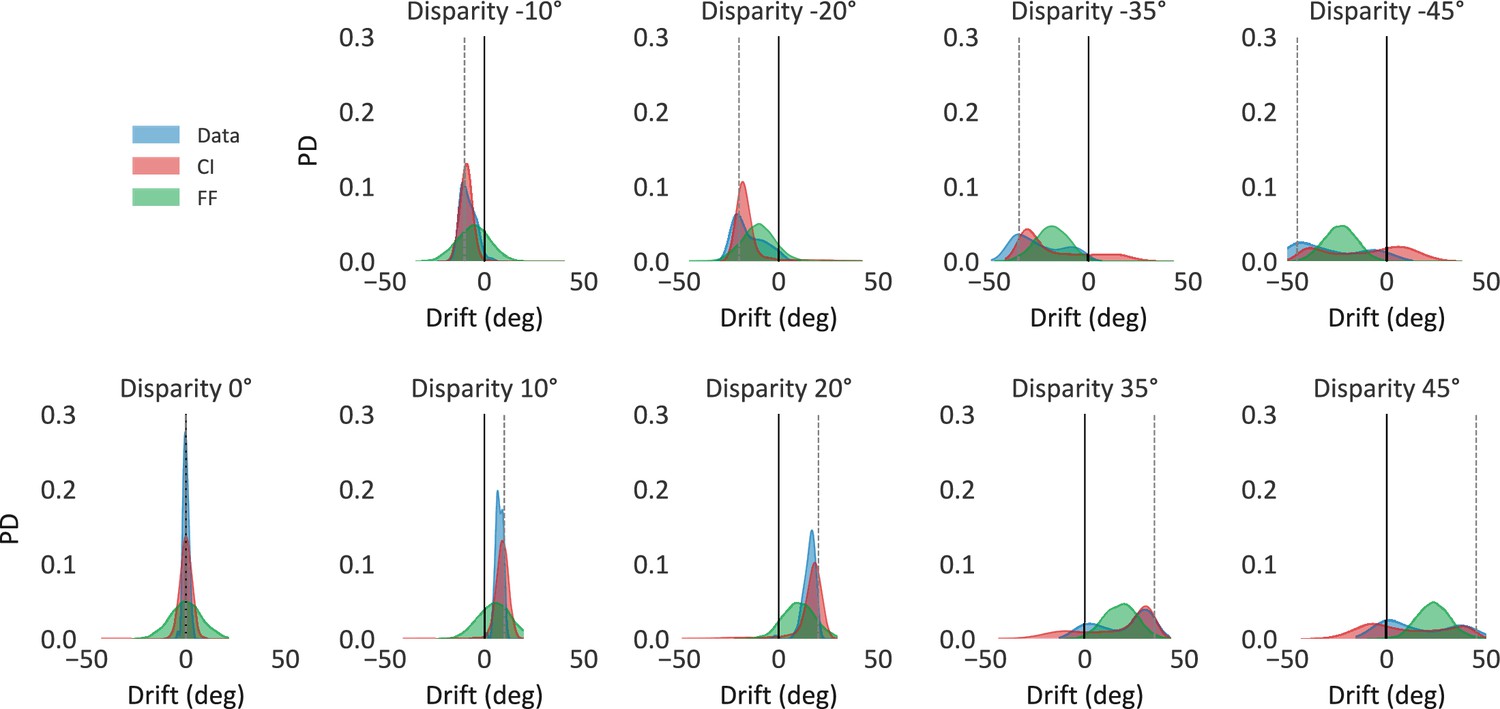
Histograms of behavior and model-simulated results in an example session.
The predictions of the causal inference model (red histograms) significantly better characterized monkeys’ behavior data (blue histograms) than the predictions of the forced-fusion (optimal integration) model (green histograms). The details of model comparisons are shown in Supplementary file 1. Data distributions were plotted using an example session. Model results were generated from 5000 trials per disparity and were plotted the distribution using all these simulated trials. Vertical black solid and dotted gray lines indicate the normalized pure proprioceptive and pure visual bias, respectively. CI: causal inference; FF: forced-fusion.
Figure 2 with 2 supplements
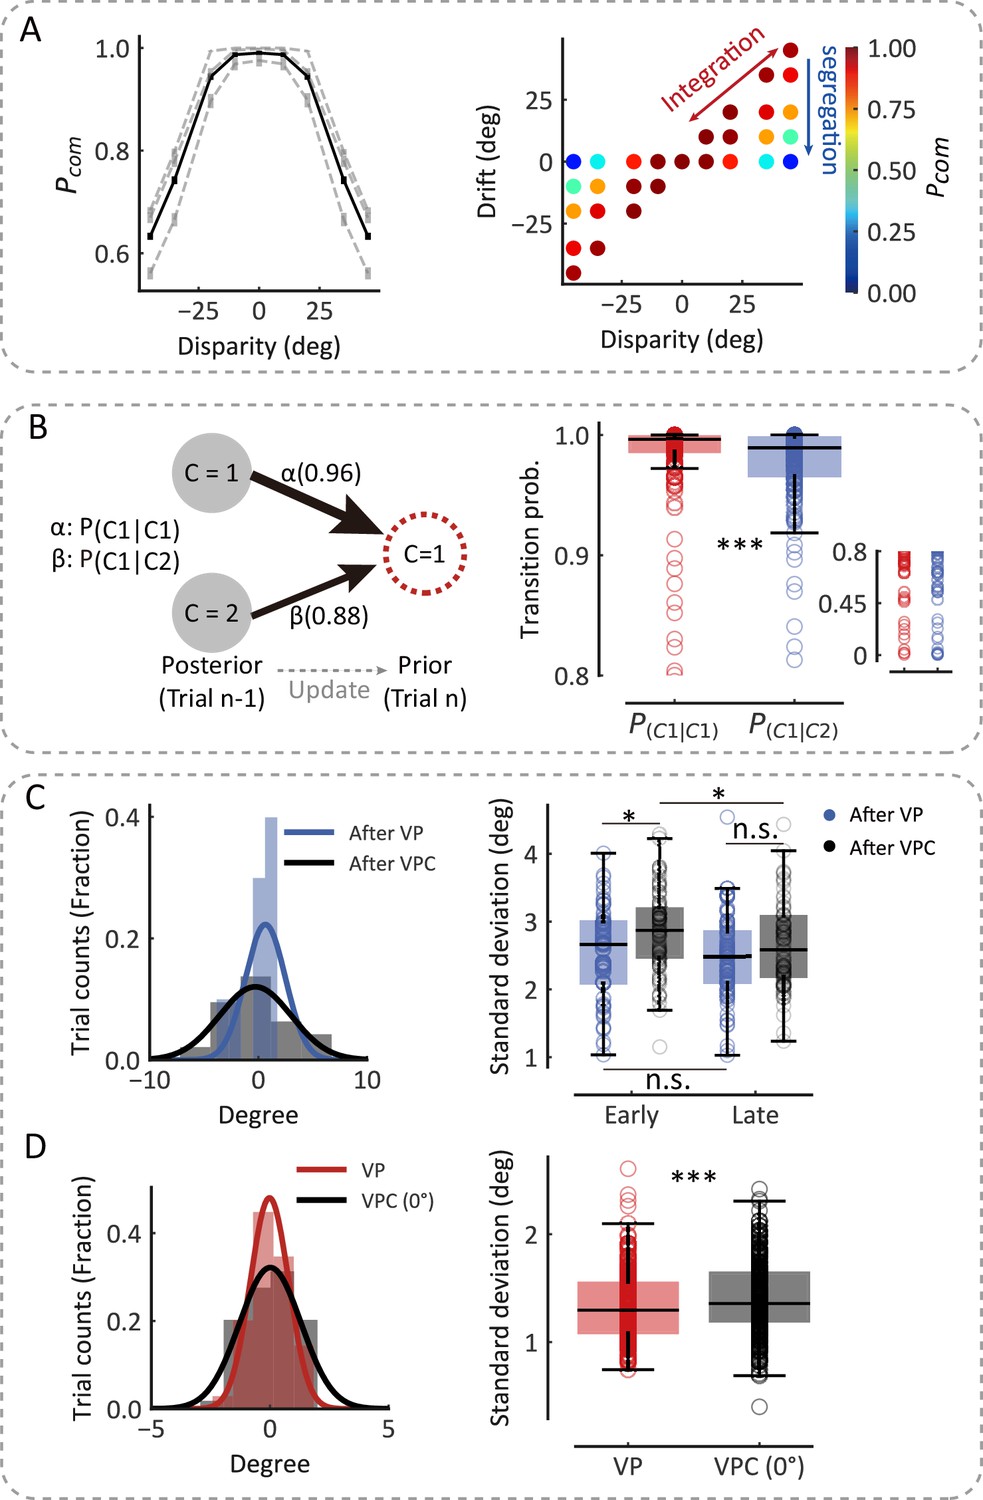
The causal inference model predicts the dynamic updating of monkey behavior.
(A) Left: The average Pcom as a function of disparity. The black line represents the average Pcom across monkeys. The dashed lines represent the average Pcoms across sessions of three monkeys separately. Error bars indicate standard errors of the means (SEMs). Right: Model prediction of the Pcom. Each point represents the average Pcom in each cluster grouped by specific disparity and proprioceptive drift according to the clustering of disparity and drift (see Materials and methods). (B) The transition probability from the previous trial’s Pcom to the current trial’s Pprior. Left: The transition probability of an example session. Right: The transition probabilities across all sessions from three monkeys (Wilcoxon signed-rank test, W=6996.0, df = 242, p<0.001, rrb = 0.52). Each circle represents a behavior session. The most right insert scatter represents a single session’s transition probability. (C) After-trial effect of sensory updating. Left: The distribution of arm locations in P blocks after visual-proprioceptive (VP) and VP conflict (VPC) tasks in an example session. The solid lines represent fitted Gaussian distributions. Right: The standard deviations of drift in P blocks after VP and VPC tasks across all sessions from three monkeys in early trials (Wilcoxon signed-rank test, W=851.0, df = 72, p=0.012, false-discovery rate [FDR] corrected, see Materials and methods, rrb = 0.38) and in latter trials (W=1024.0, df = 72, p=0.073, FDR corrected, rrb = 0.24). The uncertainty of P trials after the VPC task in the early part of the session was significantly larger than that in the later part (W=917.0, df = 72, p=0.035, FDR corrected, rrb = 0.29); this is not the case for P trials after the VP task (W=1086.0, df = 72, p=0.15, FDR corrected, rrb = 0.20). (D) Within-trial effect of sensory updating. Left: The distribution of arm locations in VP and VPC (0°) tasks. The solid lines represent fitted Gaussian distributions. Right: The standard deviation of drift in VPC (0°) trials was significantly higher than that in VP trials (Wilcoxon signed-rank test, W=10,035.0, df = 237, p<0.001, rrb = 0.29). In (C) and (D), each circle represents a behavior session. The effect sizes (rrb) were performed using the rank-biserial correlation (Kerby, 2014). *p<0.05; ***p<0.001; n.s., not significant.
-
Figure 2—source code 1
Related to Figure 2A-D.
- https://cdn.elifesciences.org/articles/76145/elife-76145-fig2-code1-v2.zip
-
Figure 2—source data 1
Related to Figure 2A–D.
- https://cdn.elifesciences.org/articles/76145/elife-76145-fig2-data1-v2.zip
Figure 2—figure supplement 1
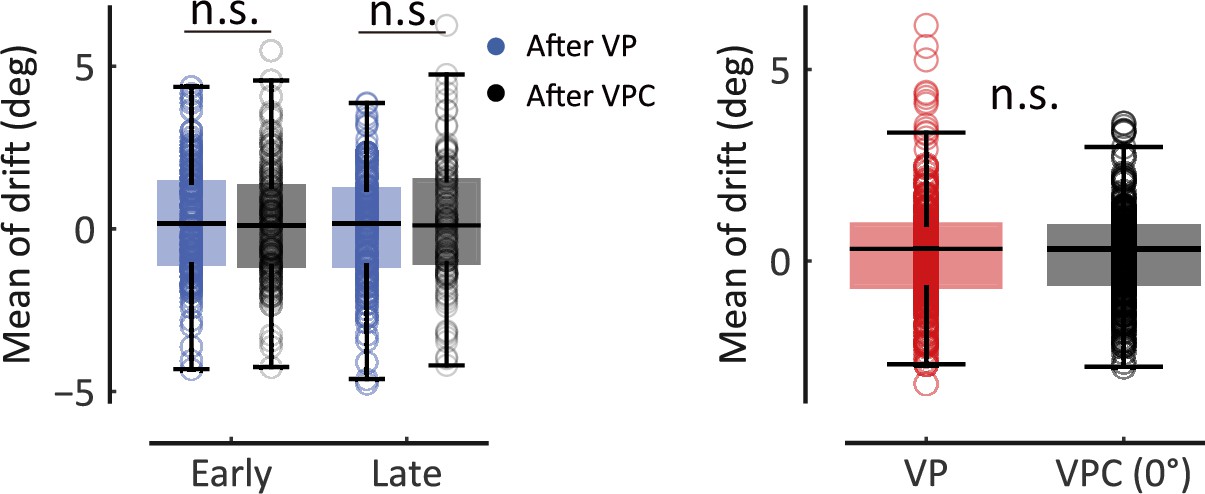
Sensory updating is not reflected in the mean of drift.
Left: Mean drift in P blocks after visual-proprioceptive (VP) and VP conflict (VPC) tasks. The boxes represent the means of drift in VP and VPC (0°) tasks across all sessions of all monkeys in the early part of the sessions (Wilcoxon signed-rank test, W=3591.0, df = 127, r=0.13, p=0.37, false-discovery rate [FDR] corrected) and the late part of the sessions (W=3749.0, df = 127, r=0.092, p=0.37, FDR corrected). Right: Mean of drift in VPC (0°) trials was not significantly different from that in VP trials (Wilcoxon signed-rank test, W=13,668.0, df = 242, r=0.078, p=0.29). Each circle represents a behavior session. The effect sizes (r) were performed using the rank-biserial correlation. n.s., not significant.
Figure 2—figure supplement 2
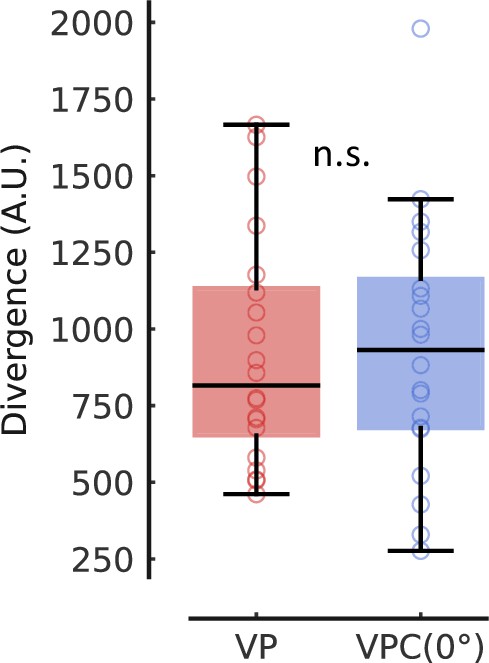
No significant difference of the divergence of eye fixation positions between visual-proprioceptive (VP) and VP conflict (VPC) (0°) tasks (see Materials and Methods, Wilcoxon signed-rank test, W=98.0, df = 19, p=0.81).
n.s., not significant.
Figure 3 with 3 supplements
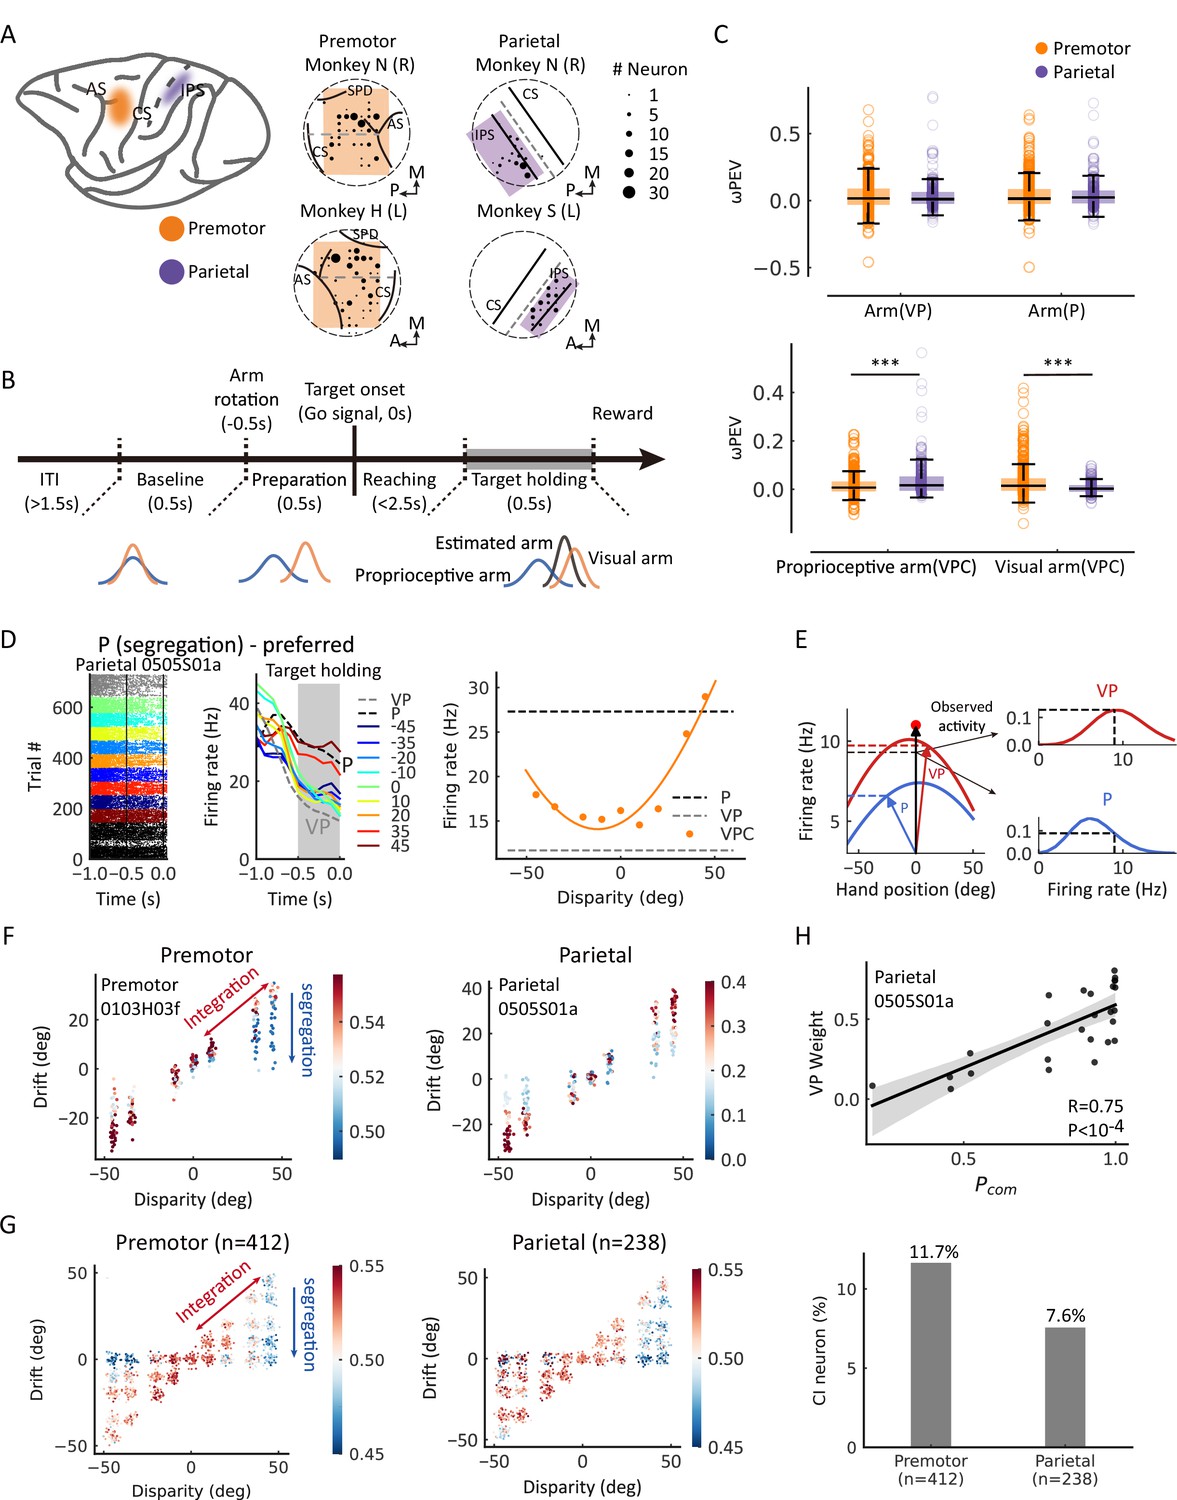
Casual inference neurons in premotor and parietal cortices.
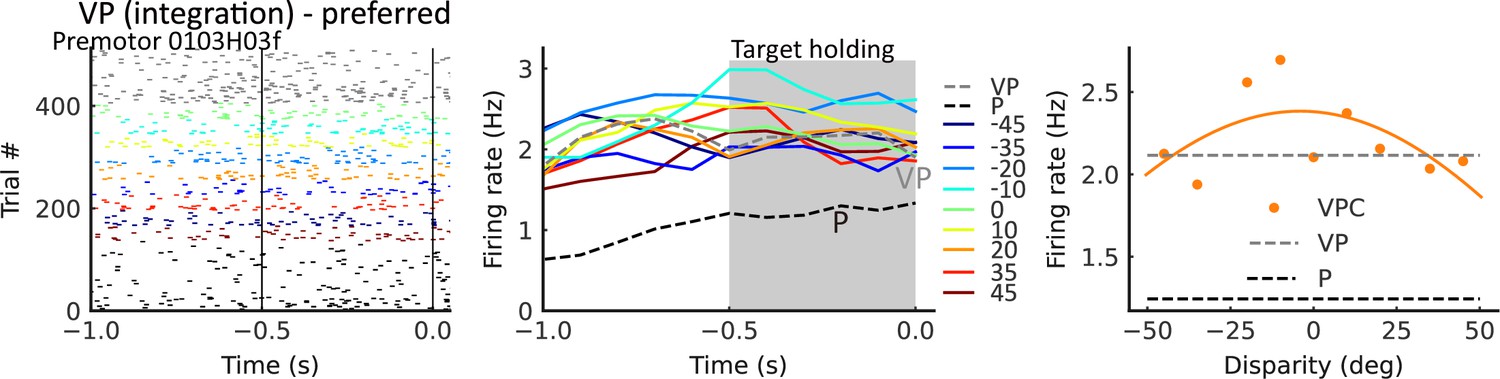
(A) Recording sites. Left: Two regions of interest were recorded through single electrodes in macaque monkeys. Middle and right: Specific recording sites in three monkeys. AS, arcuate sulcus; CS, central sulcus; IPS, intraparietal sulcus; SPD, superior precentral dimple. L, left hemisphere; R, right hemisphere; A, anterior; P, posterior; M, medial. The straight dash gray line separated the dorsal and ventral part of the premotor cortex in the middle panel. The straight dash gray line indicates the middle of IPS and CS. The circular dash lines indicate the recording chambers. (B) Temporal structure of a single trial for the visual-proprioceptive conflict (VPC) task. (C) Neural information of arm locations in premotor and parietal cortices. Upper: No significant difference between the brain regions for the neural information of VP arm (Wilcoxon rank-sum test, W=0.64, dfpremotor = 411, dfparietal = 237, p=0.52, false-discovery rate [FDR] corrected, rrb = 0.030) and P arm (W=0.51, dfpremotor = 411, dfparietal = 237, p=0.52, FDR corrected, rrb = 0.031), respectively. Bottom: There were significant differences between the brain regions for both the neural information of proprioceptive arm (Wilcoxon rank-sum test, W=–3.92, dfpremotor = 411, dfparietal = 237, p<0.001, FDR corrected, rrb = 0.18) and visual arm (W=6.34, dfpremotor = 411, dfparietal = 237, p<0.001, FDR corrected, rrb = 0.30) in VPC task, respectively. Both brain regions conveyed significant information about the arm location in the three tasks (premotor: VP arm, Wilcoxon signed-rank test, W = 27,712.0, df = 474, p<0.001, FDR corrected, rrb = 0.35; P arm, W = 25,614.0, df = 411, p<0.001, FDR corrected, rrb = 0.40; proprioceptive arm (VPC), W=22,316.0, df = 411, p<0.001, FDR corrected, rrb = 0.48; visual arm (VPC), W=14,874.0, df = 411, p<0.001, FDR corrected, rrb = 0.65. Parietal: VP arm, W=9466.0, df = 237, p<0.001, FDR corrected, rrb = 0.33; P arm, W=7414.0, df = 237, p<0.001, FDR corrected, rrb = 0.48; proprioceptive arm (VPC), W=3745.0, df = 237, p<0.001, FDR corrected, rrb = 0.74; visual arm (VPC), W=10,138.0, df = 237, p<0.001, FDR corrected, rrb = 0.29). Each circle indicates a neuron. The effect sizes (rrb) were performed using the rank-biserial correlation. (D) Raster plots and mean firing rates from an example neuron in the parietal cortex that exhibited responses varied with visual disparity, showing the preference for the P task during the target-holding period (gray zones). The yellow curve was fitted with a von Mises distribution. (E) Schematic drawing of VP weight analysis (see Materials and methods) in one example trial for the VPC task. In brief, we first mapped the tuning curves of arm position in VP (left red curve) and P (left blue curve) tasks as integration and segregation templates, respectively. Then, during the VPC task, for a single trial, we mapped the visual and proprioceptive arm position onto the these templates to get the probabilities of integration and segregation. Then, we normalized the probability to get the VP weight. (F) Two examples of causal inference neurons in premotor and parietal cortices during the target-holding period (the same neurons shown in Figure 3—figure supplement 2 and (D), respectively). Each point represents one single trial, and the color represents the value of VP weight. The color bar represents VP weight, larger values indicate higher VP weights (higher probability of integration). (G) Population causal inference patterns in two brain regions. Each point was a pseudo-trial that was generated through bootstrapping, and the color represents the value of VP weight. (H) An example neuron in the parietal cortex shows the causal inference pattern defined by a significant positive correlation between VP weight and Pcom (Pearson correlation). Each point represents the average Pcom and VP weight in a cluster from the behavioral Pcom pattern. The solid line was fitted with linear regression, and the shaded area indicates the 95% confidence interval. The bar plot represents the fraction of causal inference neurons in the premotor cortex and parietal cortex. ***p<0.001.
-
Figure 3—source code 1
Related to Figure 3C, D, F, G and H.
- https://cdn.elifesciences.org/articles/76145/elife-76145-fig3-code1-v2.zip
-
Figure 3—source data 1
Related to Figure 3C, D, F, G and H.
- https://cdn.elifesciences.org/articles/76145/elife-76145-fig3-data1-v2.zip
Figure 3—figure supplement 1
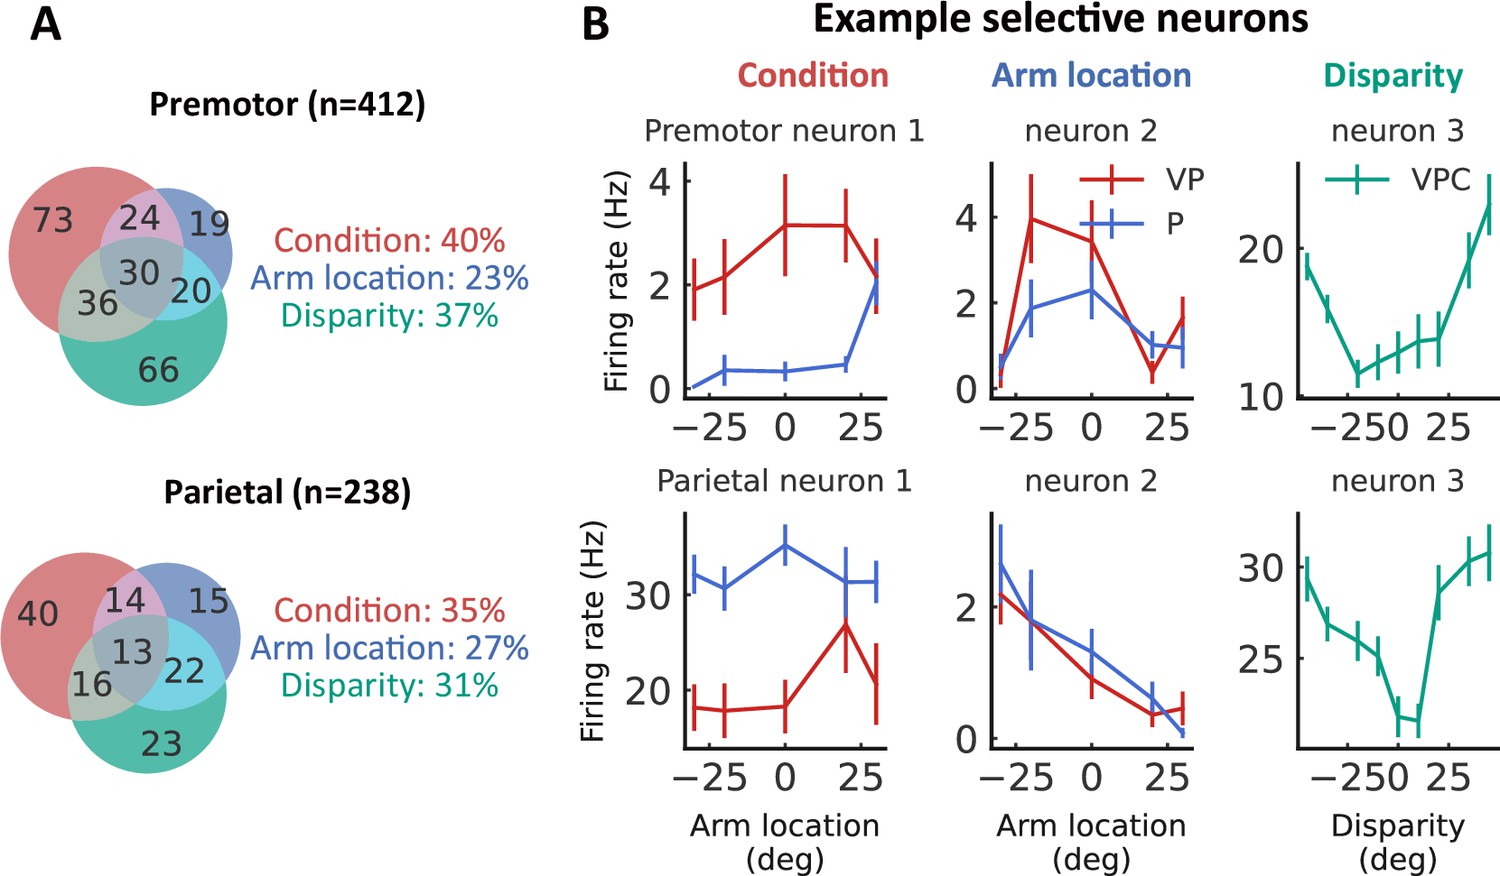
Heterogeneity in the responses of neurons to task components in the premotor and parietal cortices.
(A) The fraction of selective neurons in the premotor and parietal cortices (ANOVA, main effect, p<0.05). Red: selective to condition; blue: selective to arm location; green: selective to the visual disparity. The number in the circular means how many neurons are significantly selective to task components. (B) Example neurons selective to the the condition (left panel), the arm location (middle panel), or the disparity (right panel). The upper row shows the premotor neurons; the low row means parietal neurons. The error bar indicates the SEM.
Figure 3—figure supplement 2
Left and middle: Raster plots and mean firing rates from an example neuron in the premotor cortex that exhibited responses varied with visual disparity that preferred to the P task during the target-holding period (gray zones).
Right: Mean activity during the target-holding period. The yellow curve was fitted with a von Mises distribution.
Figure 3—figure supplement 3
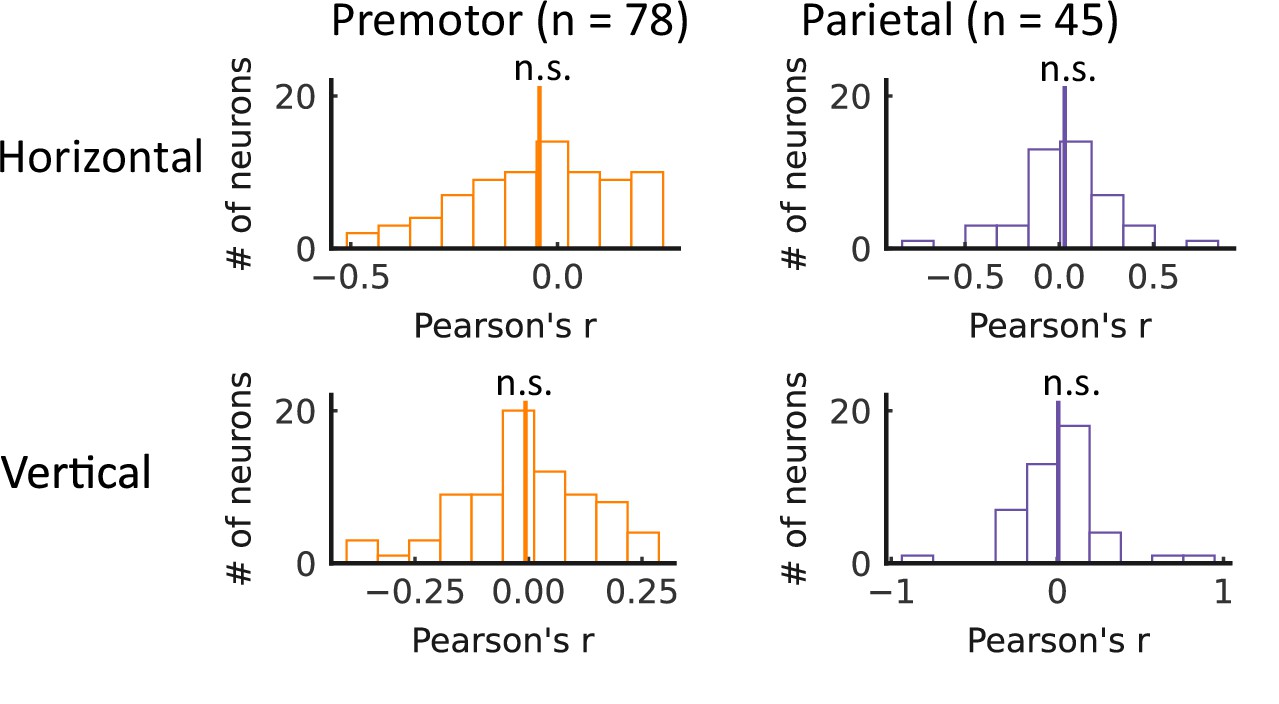
Histograms of Pearson correlation coefficients between eye fixation position and visual-proprioceptive (VP) weight.
The correlation coefficients of both regions (premotor and parietal cortices) at both directions (horizontal and vertical) are not significantly different from 0 (Wilcoxon signed-rank test, premotor (horizontal): W=1217.0, df = 77, p=0.11; premotor (vertical): W=1506.0, df = 77, p=0.86; parietal (horizontal): W=435.0, df = 44, p=0.35; parietal (vertical): W=503.0, df = 44, p=0.87).
Figure 4 with 3 supplements
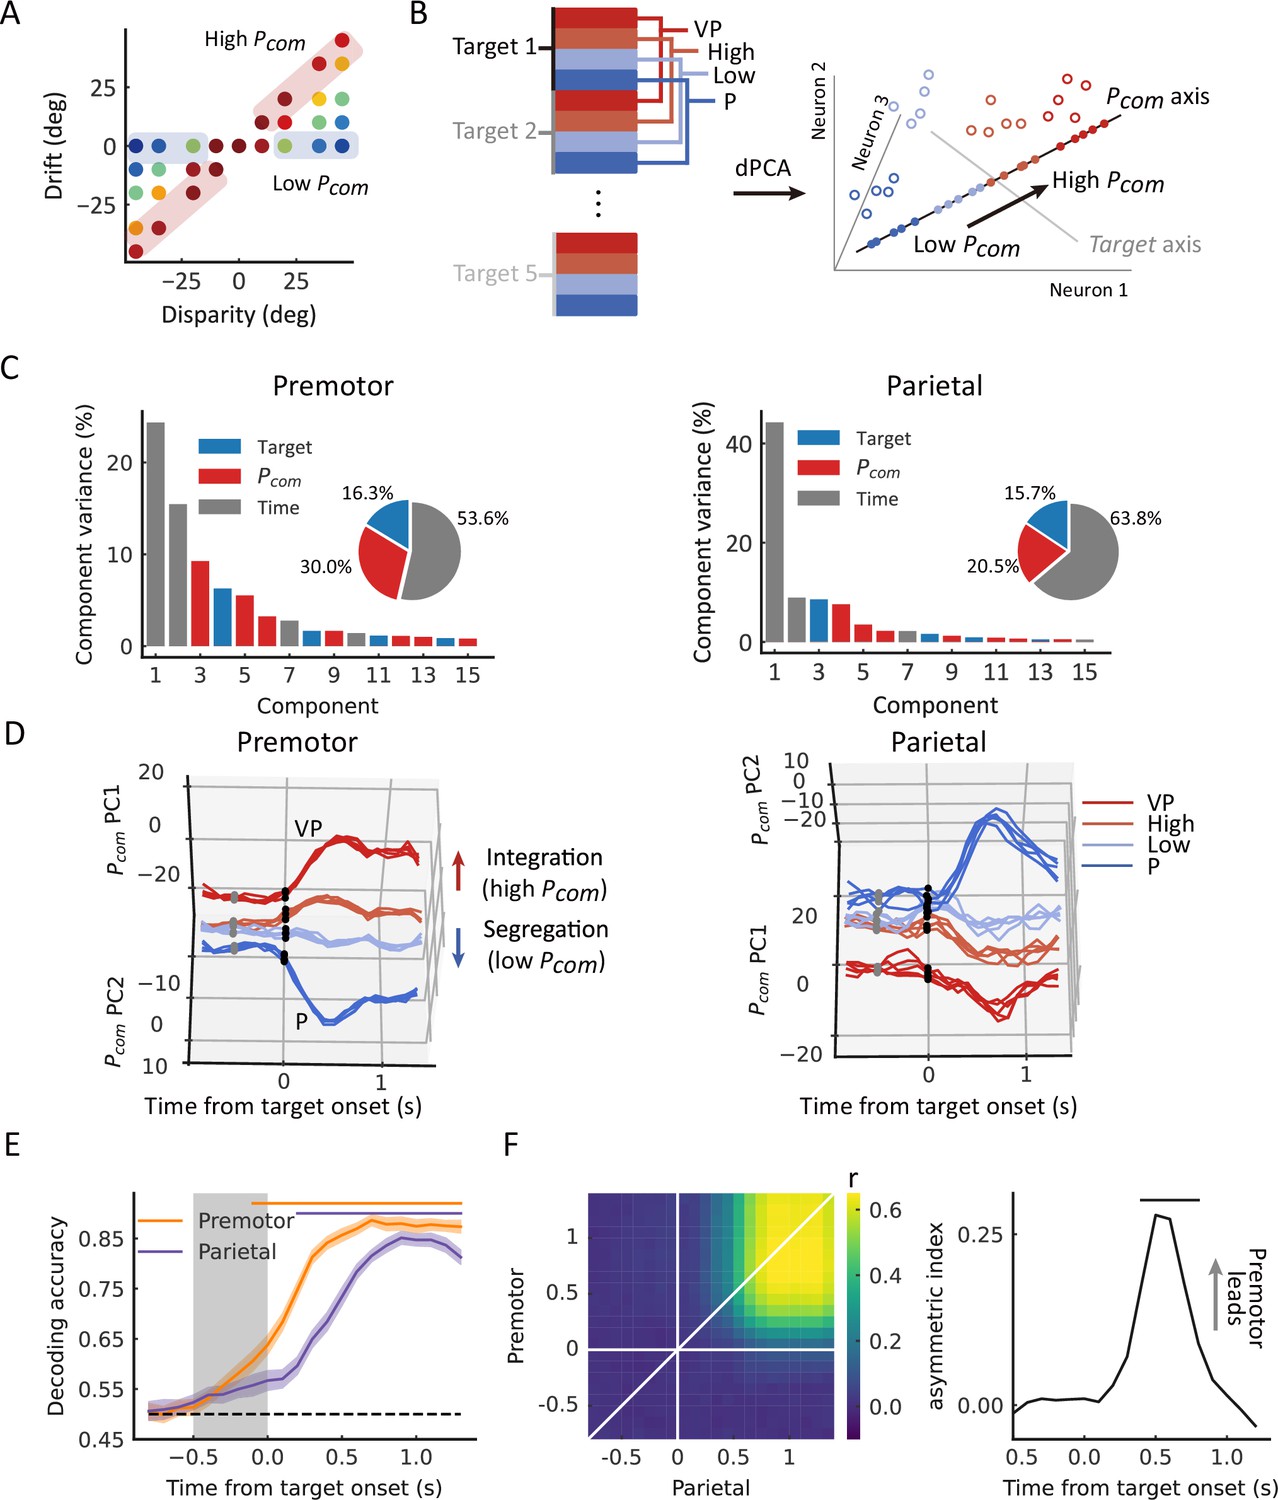
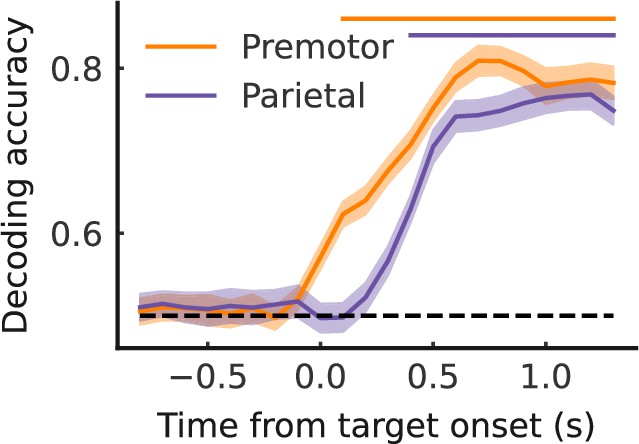
Dynamic population decoding of Pcom.
(A) Schematic drawing of the high Pcom group (top third of trials) and the low Pcom group (bottom third of trials) based on the relative drift (drift/disparity). (B) Schematic drawing of the demixed principal component analysis (dPCA). All trials of each neuron were grouped into 20 classes (5 targets × 4 conditions, including visual-proprioceptive (VP) and P tasks and high and low groups in the VP conflict [VPC] task). The marginalization matrix was generated by averaging all trials in each class. (C) dPCA decomposes population activity into a set of components given the task parameters of interest. (D) Temporal evolution of dPCA components of Pcom. The gray points represent the disparity onset; the black points represent the target onset. (E) Population decoding of Pcom. The decoding accuracy was plotted as a function of time. The gray shaded area represents the preparation period. The horizontal dashed black line represents the chance level. The horizontal solid-colored bars at the top represent the time of significant decoding accuracy (cluster-based permutation test, p<0.05). Shaded areas indicate 95% confidence intervals. (F) Joint peri-event canonical correlation (jPECC) results averaged across all sessions. Left: x-axis represents the time of parietal from target onset; y-axis: defines the time of premotor from target onset. The color bar represents the cross-validated correlation coefficient. Right: Lead-lag interactions as a function of time relative to target onset. The horizontal black bar represents the time of significant jPECC asymmetry index versus shuffled data (cluster-based permutation test, p<0.05).
-
Figure 4—source code 1
Related to Figure 4C–F.
- https://cdn.elifesciences.org/articles/76145/elife-76145-fig4-code1-v2.zip
-
Figure 4—source data 1
Related to Figure 4C–F.
- https://cdn.elifesciences.org/articles/76145/elife-76145-fig4-data1-v2.zip
Figure 4—figure supplement 1
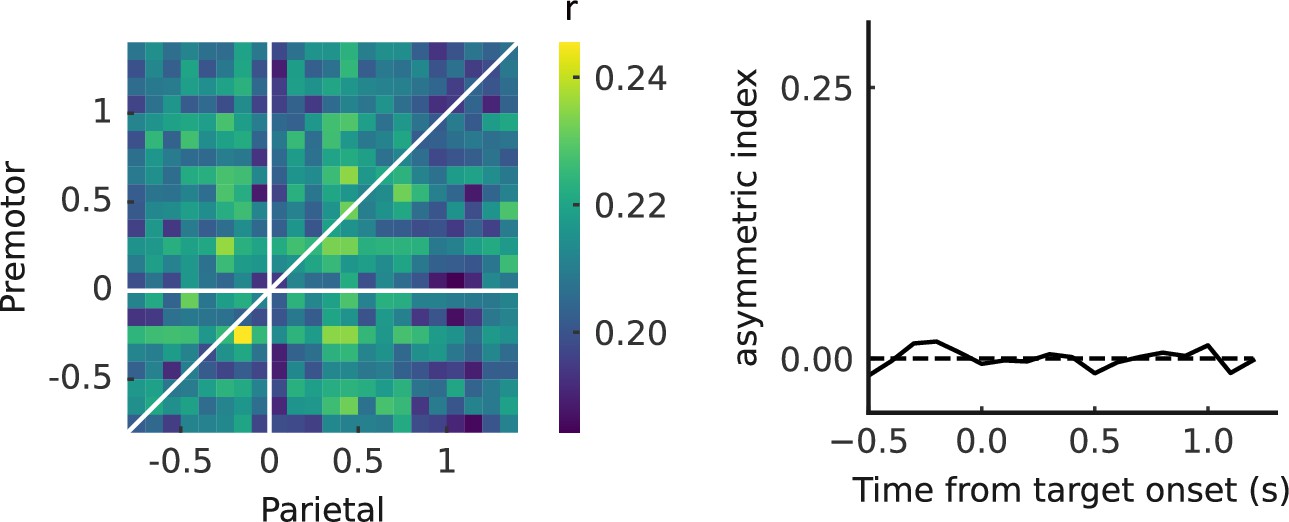
Joint peri-event canonical correlation (jPECC) analysis with shuffled temporal alignment trials.
To determine whether correlations occur with a temporal offset between premotor and parietal cortices after shuffling the trials’ alignment. Left: Cross-validated correlation coefficient between premotor and parietal cortices. The trial’s temporal alignment was shuffled to determine whether correlations occur with a temporal offset between the paired brain regions. Right: The black line represents the lead-lag interactions as a function of time relative to target onset, and the gray dashed line represents the chance level (chance level = 0).
Figure 4—figure supplement 2
Population decoding of Pcom in the premotor and parietal cortices from Monkey N.
The decoding accuracy was plotted as a function of time. The horizontal dashed black line represents the chance level. The horizontal solid colored bars at the top represent the time of significant decoding accuracy (cluster-based permutation test, p<0.05). Shaded areas indicate 95% confidence intervals.
Figure 4—figure supplement 3
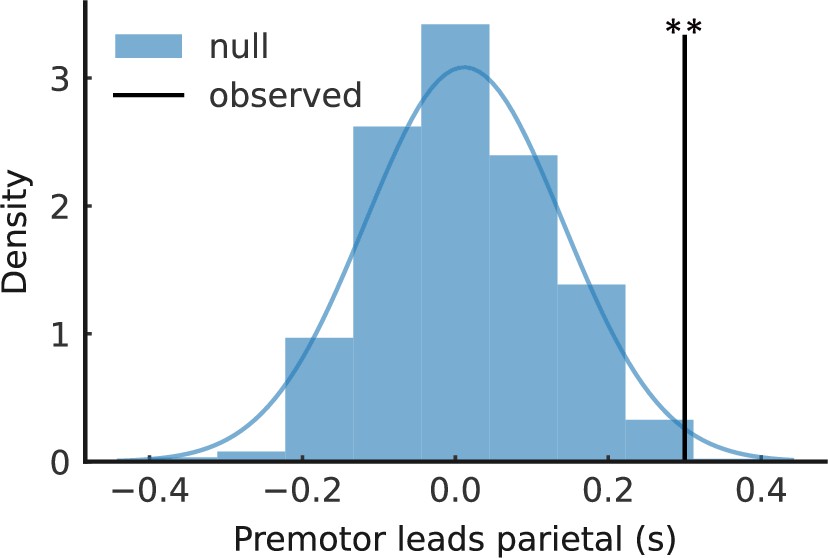
The Pcom information occurred significantly earlier in the premotor cortex than in the parietal cortex.
The null distribution of time lags (blue bar) was generated by a corresponding number of neurons randomly exchanged 1000 times between paired regions and their significance was determined by permutation tests of the observed time lags (black line) of the original data and the null distribution (see Materials and methods). The blue curve was fitted with a Gaussian distribution. **p<0.01, permutation test.
Figure 5 with 2 supplements
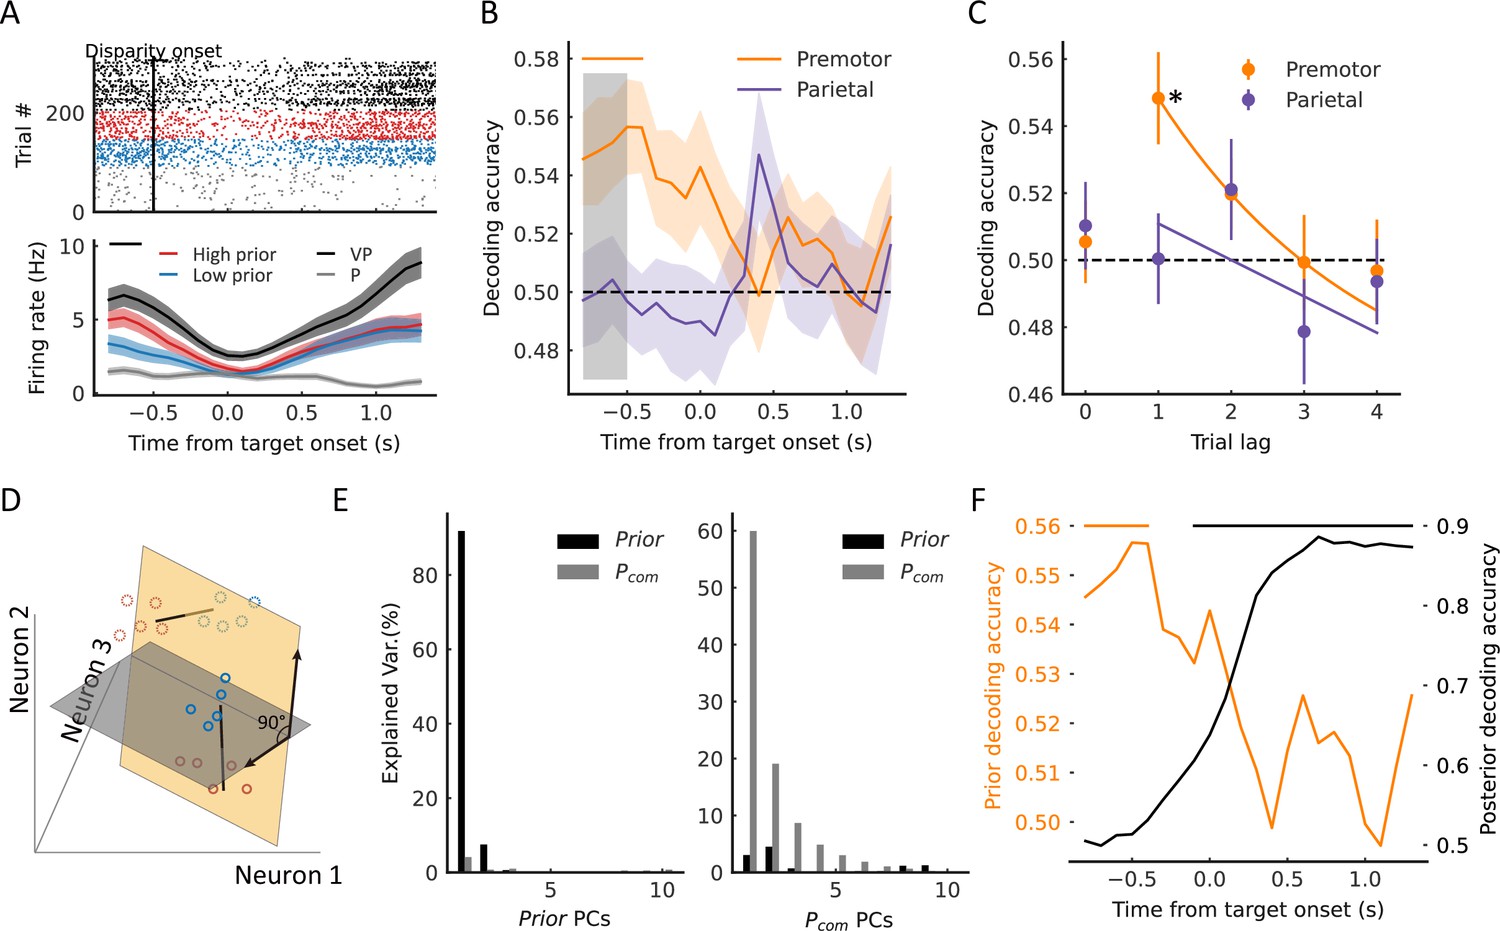
Premotor neurons encode prior information (previous trial’s Pcom) during the baseline period.
(A) Example neuron in the premotor cortex showing selectivity to prior information during the baseline period. The trials in the raster plot were sorted by the Pcom in the previous trial and grouped into high (red dots) and low (blue dots) groups. Bottom: temporal evolution of the average firing rate of ‘high prior’ and ‘low prior’ groups. The black horizontal line at the top represents the time window with a significant difference (two-sided t-test, t=2.36, p=0.019). Shaded areas indicate SEMs. (B) Dynamic population decoding of prior information (nth–1 trial). The gray shaded window represents the baseline period. The horizontal solid colored bar at the top represents the time with significant decoding accuracy with a cluster-based permutation test (p<0.05). Shaded areas indicate 95% confidence intervals. The horizontal dashed black line represents the chance level. (C) Decoding accuracy of prior trials (nth−1 to nth−4). Lag 0 represents the decoding of Pcom in the current (nth) trial. The horizontal dashed black line represents the chance level (permutation test, p<0.001). The solid lines were fitted with exponential functions. Error bars indicate 95% confidence intervals. (D) Schematic drawing of orthogonal subspaces of Pprior and Pcom. The solid-line circles represent Pcom and dotted circles represent Pprior. Red represents high Pcom, blue represents low Pcom. (E) Left: Percentage of baseline-period (Pprior) data variance (black bars, explained variance: about 99.63%) and target-holding period data variance (gray bars, explained variance: about 8.34%) explained by the top 10 prior PCs. Right: Percentage of baseline-period (Pprior) data variance (black bars, explained variance: about 11.30%) and target-holding (Pcom) period data variance (gray bars, explained variance: about 99.99%) explained by the top 10 Pcom PCs. (F) Premotor encoded prior information during the baseline period quickly decreased after the disparity onset while the Pcom information emerged. The orange line represents the population decoding accuracy of Pprior (nth–1 trial). The black line represents the population decoding accuracy of Pcom. The orange and black horizontal solid-colored bars at the top represent the time with significant decoding accuracy with a cluster-based permutation test (p<0.05) for prior information and Pcom information, respectively. *p<0.05.
-
Figure 5—source code 1
Related to Figure 5A–F.
- https://cdn.elifesciences.org/articles/76145/elife-76145-fig5-code1-v2.zip
-
Figure 5—source data 1
Related to Figure 5A–F.
- https://cdn.elifesciences.org/articles/76145/elife-76145-fig5-data1-v2.zip
Figure 5—figure supplement 1
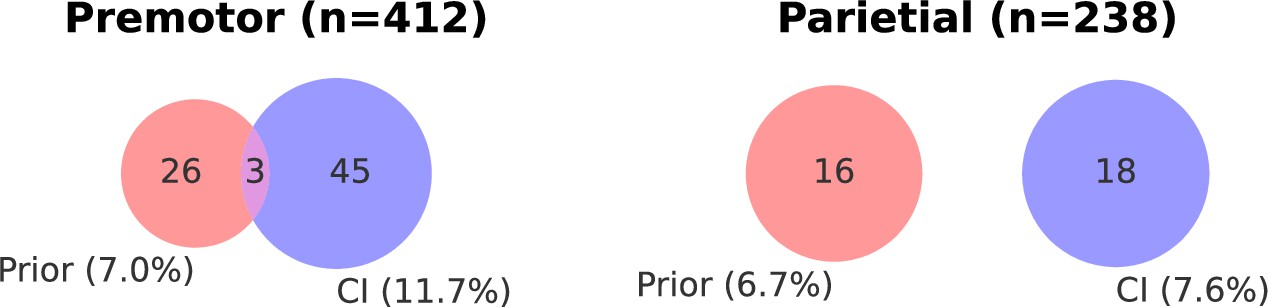
Percentage of prior selective neurons and causal inference (CI) neurons.
Red, the number of pure prior selective neurons; blue, the number of pure CI neurons; purple, the number of dual selective neurons.
Figure 5—figure supplement 2
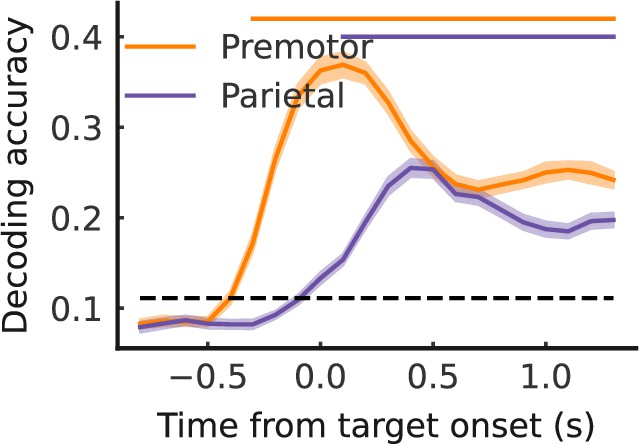
Population decoding of disparity.
The decoding accuracy was plotted as a function of time. The gray shaded area represents the preparation period. The horizontal dashed black line represents the chance level. The horizontal solid colored bars at the top represent the time of significant decoding accuracy (cluster-based permutation test, p<0.05). Shaded areas indicate 95% confidence intervals.
Figure 6 with 1 supplement

Representation of arm location is updated in the parietal cortex.
(A) Left: The difference of ωPEV between visual-proprioceptive (VP) and VP conflict (VPC) (0°) tasks for an example neuron in the parietal cortex. Right: Snapshot of the arm location tuning for VP and VPC (0°) tasks at the time point showed in the left panel (peak delta ωPEV). At the given time point of this neuron, there is no significant main effect for condition (two-way ANOVA, condition VP and VPC (0°)×hand location; condition, F(1,154)=1.450, p=0.23), but for hand location (F(4,154)=6.736, p<0.001). The solid curves were fitted with von Mises distributions. (B) Dynamic average ωPEV for VP and VPC (0°) tasks. The horizontal bar at the top represents the time bins in which the ωPEV for the VPC (0°) task was significantly lower than that for the VP task (cluster-based permutation test, p<0.05). (C) Dynamic population decoding of arm locations. The horizontal bar at the top represents the time bins in which the decoding accuracy for the VPC (0°) task was significantly lower than that for the VP task (cluster-based permutation test, p<0.05). Shaded areas indicate 95% confidence intervals. The horizontal dashed black lines represent the chance level.
-
Figure 6—source code 1
Related to Figure 6A–C.
- https://cdn.elifesciences.org/articles/76145/elife-76145-fig6-code1-v2.zip
-
Figure 6—source data 1
Related to Figure 6A–C.
- https://cdn.elifesciences.org/articles/76145/elife-76145-fig6-data1-v2.zip
Figure 6—figure supplement 1
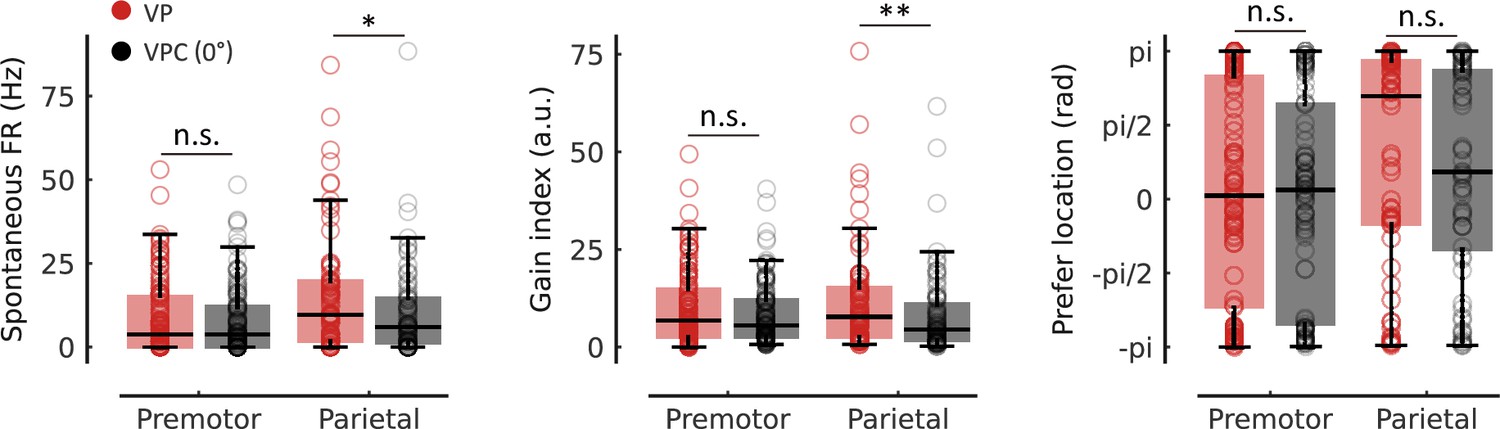
The comparisons of tuning curve parameters between the visual-proprioceptive (VP) and VP conflict (VPC) (0°) tasks.
Left: The spontaneous firing rates during VP task were higher than that during VPC (0°) task in the parietal cortex (parietal, W=646.0, df = 63, p=0.017, false-discovery rate [FDR] corrected, rrb = 0.38) but not in the premotor cortex (W=2090.0, df = 92, p=0.71, FDR corrected, rrb = 0.044). Middle: The gain index during VP task was higher than that during VPC (0°) task in the parietal cortex (parietal, W=539.0, df = 63, p=0.0016, FDR corrected, rrb = 0.48) but not the premotor cortex (W=1767.0, df = 92, p=0.11, FDR corrected, rrb = 0.19). Right: The preferred arm location was not significantly changed in the premotor and parietal cortices (premotor, W=1964.0, df = 92, p=0.50, FDR corrected, rrb = 0.081; parietal, W=897.0, df = 63, p=0.50, FDR corrected, rrb = 0.14). Pair-wise comparisons were performed using Wilcoxon signed rank test. Effect sizes (rrb) were performed using the rank-biserial correlation. *p<0.05; **p<0.01.
Author response image 1
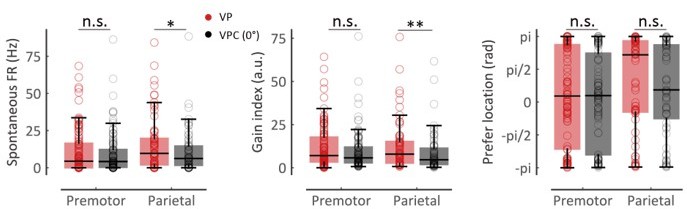
The comparisons of tuning curve parameters between the VP and VPC (0°) tasks. Left: The spontaneous firing rates during VP task were higher than that during VPC (0°) task in parietal cortex (parietal, W = 641.0, df = 62, rrb = 0.36, p = 0.012) but not in the premotor cortex (W = 2,350.0, df = 99, rrb = 0.069, p = 0.55). Middle: The gain index during VP task were higher than that during VPC (0°) task in parietal cortex (parietal, W = 535.0, df = 62, rrb = 0.47, p = 0.0012) but not premotor cortex (W = 2,017.0, df = 99, rrb = 0.20, p = 0.081). Right: The preferred arm location was not significantly changed in the premotor and parietal cortex (premotor, W = 2,334.0, df = 99, rrb = 0.056, p = 0.62; parietal, W = 852.0, df = 62, rrb = 0.15, p = 0.29). Pair-wise comparisons were performed using Wilcoxon signed rank test. Effect sizes (rrb) were performed using the rank-biserial correlation.
Author response image 2
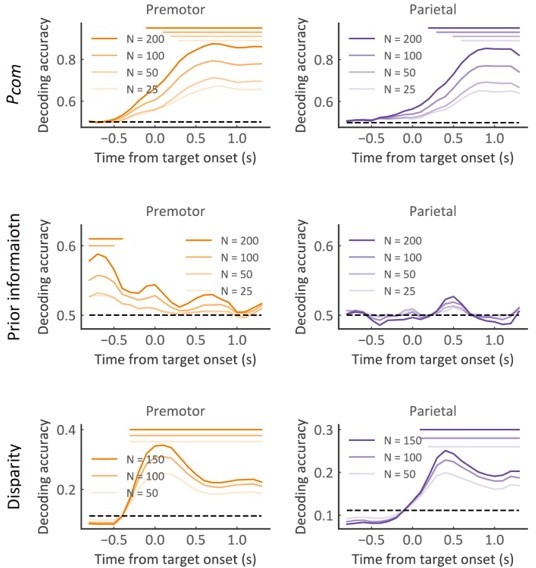
Population decoding of Pcom (upper panel), Pprior (middle panel), and Disparity (bottom panel) with different neuron numbers in the premotor (left panel) and parietal (right panel) cortex, respectively.
The horizontal dashed black line represents the chance level. The horizontal solid bars at the top represent the time of significant decoding accuracy (cluster-based permutation test, p < 0.05). Different color shades represent different numbers of neurons used for decoding.
Author response image 3

Population decoding of arm locations with different neuron numbers in the premotor and parietal cortex, respectively.
The horizontal dashed black line represents the chance level. The flat bar at the top represents the time bins in which the decoding accuracy for the VPC (0°) task was significantly lower than that for the VP task (cluster-based permutation test, p < 0.05). N: number of neurons used for decoding.
Author response image 4
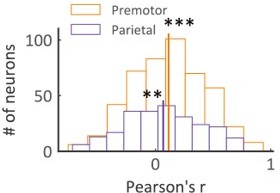
Histogram of Pearson correlation coefficients between VP weight and Pcom.
The correlation coefficients of both regions are significantly larger than 0 (two-sided one-sample t-test, Premotor: t474 = 7.88, Cohen’s d = 0.36, p < 0.001; Parietal: t237 = 3.16, Cohen’s d = 0.21, p < 0.01). ** p < 0.01; *** p < 0.001.
Author response image 5

Population decoding of Pcom (upper panel), Pprior (middle panel), and Disparity (bottom panel) with different neuron numbers of premotor (left panel) and parietal (right panel).
The horizontal dashed black line represents the chance level. The horizontal solid bars at the top represent the time of significant decoding accuracy (cluster-based permutation test, p < 0.05). Different color shades represent different numbers of neurons used for decoding.
Author response image 6
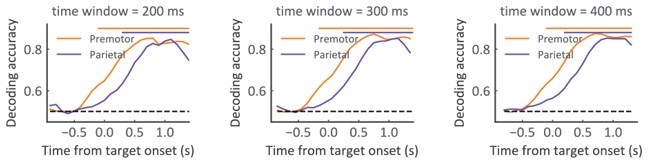
Population decoding of Pcom with various smoothing window sizes (200, 300, and 400 ms), respectively.
The horizontal dashed black line represents the chance level. The horizontal solid bars at the top represent the time of significant decoding accuracy (cluster-based permutation test, p < 0.05).
Author response image 7
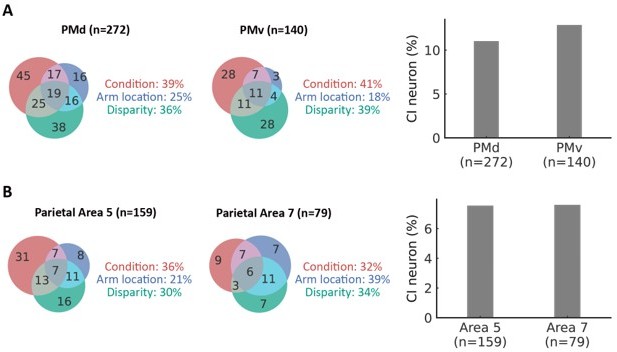
(A) Left and middle: the fraction of selective neurons in the dorsal premotor (PMd) cortex and the ventral premotor (PMv) cortex (ANOVA, main effect, p < 0.05).
There was no significant difference between the fraction of selective neurons in PMd and PMv (Pearson's chi-square test, χ2 = 0.013, df = 2, p = 0.99). Right, the fraction of causal inference neurons in the dorsal premotor cortex and ventral premotor cortex. There was no significant difference between the fraction of causal inference neurons in PMd and PMv (χ2 = 0.15, df = 1, p = 0.70). (B) Left and middle: the fraction of selective neurons in the parietal Area 5 cortex and Area 7 cortices (ANOVA, main effect, p < 0.05). There was no significant difference between the fraction of selective neurons in parietal Area 5 and Area 7 cortices (Pearson's chi-square test, χ2 = 0.047, df = 2, p = 0.98). Right, the fraction of causal inference neurons in the parietal Area 5 cortex and the parietal Area 7 cortex. There was no significant difference between the fraction of causal inference neurons in parietal Area 5 and Area 7 (χ2 = 1.023×10⁻³⁰, df = 1, p = 1).
Author response image 8
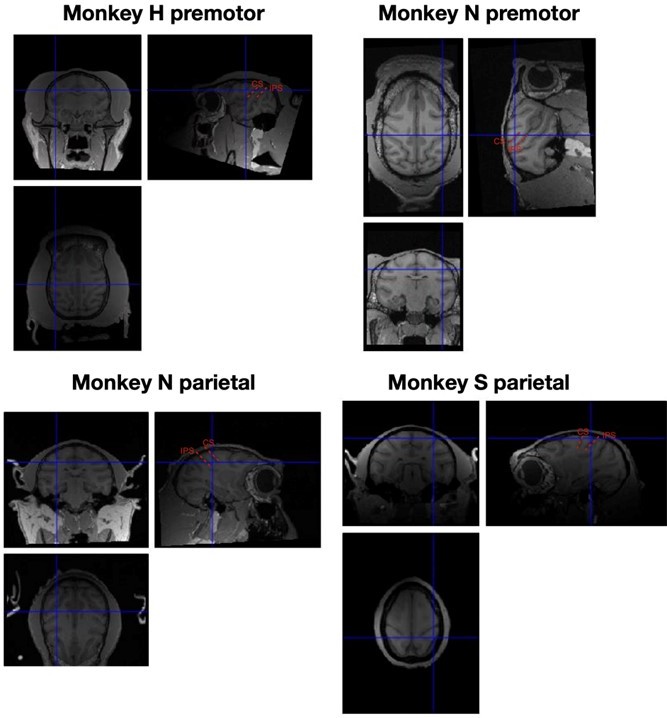
The centers of implanting recording chambers in MRIs for individual monkeys.
CS, central sulcus; IPS, intraparietal sulcus. Note that the recording locations of monkey N’s premotor and parietal cortices are from different structural magnetic resonance images.
Tables
Author response table 1
Model parameters and fitting evaluations of two models for monkeys.
| subject | Causal inference (model averaging) | Forced fusion | |||||||||
|---|---|---|---|---|---|---|---|---|---|---|---|
| relBICgroup | EP | R2 | σP | σV | Prior | relBICgroup | EP | R2 | σP | σV | |
| Monkey H | 0 | 1 | 0.96±0.0017 | 7.72±0.14 | 5.83±0.090 | 0.999±0.0004 | 329.52 | 0 | 0.93±0.0039 | 9.87±0.24 | 9.02±0.23 |
| Monkey N | 0 | 1 | 0.93±0.0080 | 9.56±0.16 | 4.93±0.15 | 0.86±0.026 | 812.34 | 0 | 0.37±0.36 | 11.34±0.10 | 10.46±0.13 |
| Monkey S | 0 | 1 | 0.96±0.0022 | 8.98±0.14 | 5.72±0.22 | 0.98±0.012 | 290.04 | 0 | 0.94±0.0027 | 10.10±0.14 | 8.34±0.17 |
| subject | Full segregation (proprioceptive only) | Full segregation (visual only) | |||||||||
| relBICgroup | EP | R2 | σP | relBICgroup | EP | R2 | σV | ||||
| Monkey H | 1876.10 | 0 | 0.44±0.026 | 14.43±0.15 | 1677.04 | 0 | 0.58±0.019 | 14.51±0.091 | |||
| Monkey N | 1902.82 | 0 | 0.53±0.018 | 14.76±0.070 | 1739.40 | 0 | 0.51±0.078 | 14.38±0.095 | |||
| Monkey S | 1937.32 | 0 | 0.39±0.040 | 14.72±0.066 | 1440.47 | 0 | 0.71±0.016 | 12.75±0.28 |
Additional files
-
Transparent reporting form
- https://cdn.elifesciences.org/articles/76145/elife-76145-transrepform1-v2.pdf
-
Supplementary file 1
Model parameters and fitting evaluations of four models for monkeys.
- https://cdn.elifesciences.org/articles/76145/elife-76145-supp1-v2.docx
Download links
A two-part list of links to download the article, or parts of the article, in various formats.
Downloads (link to download the article as PDF)
Open citations (links to open the citations from this article in various online reference manager services)
Cite this article (links to download the citations from this article in formats compatible with various reference manager tools)
Neural dynamics of causal inference in the macaque frontoparietal circuit
eLife 11:e76145.
https://doi.org/10.7554/eLife.76145


