Arl15 upregulates the TGFβ family signaling by promoting the assembly of the Smad-complex
- School of Biological Sciences, Nanyang Technological University, Singapore
- A*STAR Skin Research Labs (A*SRL), Agency for Science, Technology and Research, Singapore
Figures
Figure 1 with 1 supplement
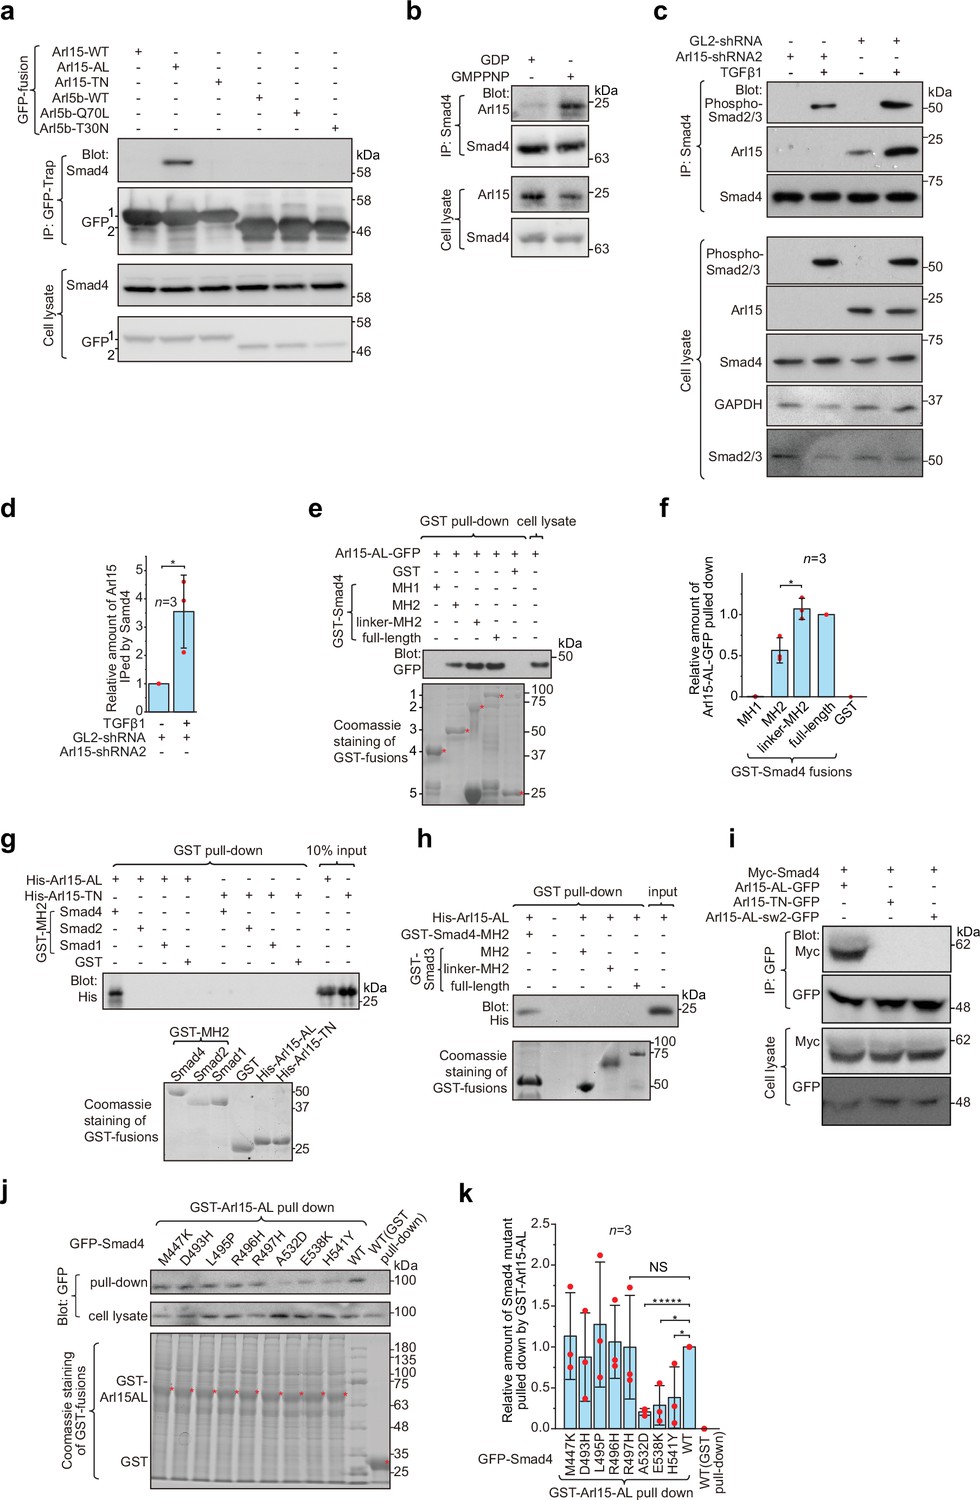
Arl15-GTP interacts with Smad4.
(a) The GTP-mutant form of Arl15 specifically immunoprecipitated endogenous Smad4. HEK293T cell lysates transiently expressing C-terminally GFP-tagged small G proteins were incubated with GFP-Trap beads, and immunoprecipitates were immunoblotted against Smad4 and GFP. 1 and 2 indicate Arl15-(WT, AL, or TN)-GFP and Arl5b-(WT, Q70L, or T30N)-GFP bands, respectively. Arl5b serves as a negative control. IP, immunoprecipitation. (b) Endogenous Smad4 immunoprecipitated Arl15 in the presence of GMPPNP, but not GDP. HEK293T cell lysates were incubated with anti-Smad4 antibody in the presence of 1 µM GMPPNP or GDP, and immunoprecipitates were immunoblotted against Arl15 and Smad4. (c, d) TGFβ1 stimulates the interaction between Smad4 and Arl15, and Arl15 promotes the interaction between Smad4 and phospho-Smad2/3. In (c), HEK293T cells subjected to Arl15 or control knockdown were serum-starved for 4 hr followed by further serum starvation or 5 ng/ml TGFβ1 treatment for 20 hr. Cell lysates were incubated with anti-Smad4 antibody, and immunoprecipitates were immunoblotted against indicated antibodies. GAPDH, glyceraldehyde 3-phosphate dehydrogenase. Under the control knockdown, the relative amount of Arl15 immunoprecipitated by Smad4 was quantified in (d). To calculate the relative amount of Arl15 immunoprecipitated by Smad4, the band intensity of immunoprecipitated Arl15 is divided by that of corresponding Smad4 and cell lysate Arl15, and the resulting value is further normalized by that of starvation. (e, f) The Smad4-MH2 domain specifically pulled down the GTP-mutant form of Arl15. In (e), bead-immobilized GST-fusions of Smad4 fragments were incubated with HEK293T cell lysate expressing Arl15-AL-GFP, and pull-downs were immunoblotted against GFP. 1, GST-Smad4; 2, GST-Smad4-linker-MH2; 3, GST-Smad4-MH2; 4, GST-Smad4-MH1; and 5, GST. * indicates specific band. The immunoblot is quantified in (f), in which the relative amount of Arl15-AL-GFP pulled down is calculated as the ratio of the intensity of the pull-down band to that of the cell lysate input band. (g, h) The MH2 domain of Smad4, but not that of Smad1, 2, and 3, directly interacts with the GTP-mutant form of Arl15. Bead-immobilized GST-fusions of MH2 domains were incubated with purified His-tagged Arl15-AL or TN, and pull-downs were immunoblotted against His-Tag. (i) The switch-II region of Arl15 is required for its interaction with Smad4. HEK293T cell lysates expressing indicated proteins were incubated with GFP antibody, and immunoprecipitates were immunoblotted against Myc-tag and GFP. In Arl15-AL-sw2-GFP, the switch-II region of Arl15-AL-GFP is replaced by that of Arl5b. (j, k) Cancer missense mutations in the MH2 domain of Smad4 can compromise Arl15-Smad4 interaction. In (j), HEK293T cell lysates expressing indicated GFP-Smad4 mutants were incubated with bead-immobilized GST-Arl15-AL, and pull-downs were immunoblotted for GFP. The result was quantified in (k). The relative amount of Smad4 mutant pulled down by GST-Arl15-AL is calculated by dividing the band intensity of GFP-Smad4 in pull-down by that in cell lysate, and the resulting value is further normalized by that of GFP-Smad4-WT. In (e, g, h, and j), the loading of fusion proteins was shown by Coomassie staining. In (d, f, and k), error bar, mean ± SD of n=3 experiments. p values are from the t-test (unpaired and two-tailed). NS, not significant (p>0.05). *, p≤0.05; *****, p≤0.000005. Red dot, individual data point. Molecular weights (in kDa) are labeled in all immunoblots.
-
Figure 1—source data 1
Uncropped gel and blot images for Figure 1.
Chemiluminescence images are unboxed; black box, the cropped region shown in the corresponding figures; blue box, the white light image of pre-stained molecular weight marker bands (for immunoblots acquired by the CCD camera). Molecular weight (kDa) is labeled in all blots. For immunoblots acquired by film, molecular weight markers were manually traced.
- https://cdn.elifesciences.org/articles/76146/elife-76146-fig1-data1-v2.pdf
-
Figure 1—source data 2
Numerical data for graphs in Figure 1d, f and k.
- https://cdn.elifesciences.org/articles/76146/elife-76146-fig1-data2-v2.xlsx
-
Figure 1—source data 3
List of positive hits from our yeast two-hybrid screening.
The human kidney cDNA library (prey) was screened by Arl15-AL (bait). The table list all protein-coding clones from the screen.
- https://cdn.elifesciences.org/articles/76146/elife-76146-fig1-data3-v2.docx
-
Figure 1—source data 4
List of SMAD4 missense cancer mutations that are tested in GST-Arl15-AL pull-down assay (Figure 1j and k).
Mutation information is from COSMIC. In the column ‘type of cancer identified’, the number of samples with the mutation is indicated in parenthesis. ‘Count’ displays the total number of samples with the mutation.
- https://cdn.elifesciences.org/articles/76146/elife-76146-fig1-data4-v2.docx
Figure 1—figure supplement 1
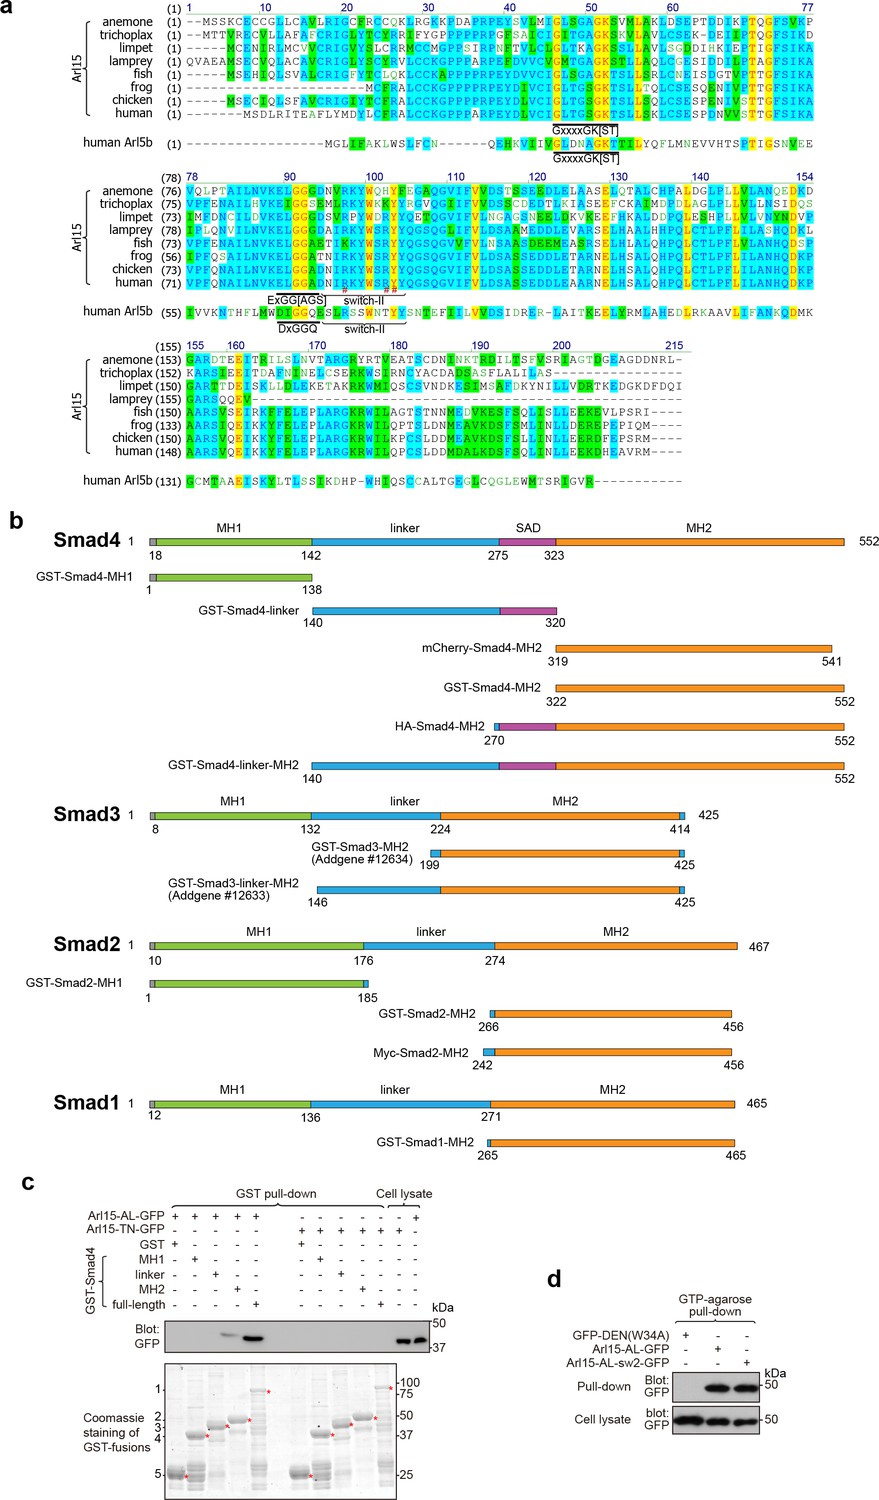
Multiple sequence alignment of Arl15.
(a) Multiple sequence alignment of metazoan Arl15 orthologues and human Arl5b. The conserved G1 (GxxxxGK[ST]) and G3 (ExGG[AGS]) motifs (DxGGQ for Arl5b) are underlined, and the switch-II region is marked. In human Arl15 sequence, R90, R95, and Y96 are indicated by #. The following UniProt sequences of Arl15 were used: anemone, A7SYP3; trichoplax, B3RRR0; limpet, V4BVB7; lamprey, S4R642; fish, A5PMK4; chicken, F1NMW9; frog, F6WKV0; human, Q9NXU5. The Uniprot ID of human Arl5b is Q96KC2. (b) Schematic diagrams showing the domain organization of Smad1, 2, 3, and 4 constructs. Numbers indicate corresponding amino acid positions in the full-length protein sequence. SAD, Smad4 activation domain. (c) The linker region of Smad4 does not interact with the GTP-mutant form of Arl15. Bead-immobilized GST-fusions of Smad4 fragments were incubated with HEK293T cell lysate expressing Arl15-AL-GFP or Arl15-TN-GFP, and pull-downs were immunoblotted against GFP. Loading of GST-fusions is shown below by Coomassie staining. 1, GST-Smad4; 2, GST-Smad4-MH2; 3, GST-Smad4-linker; 4, GST-Smad4-MH1; 5, GST. * indicates specific band. (d) Arl15 switch-II mutant, Arl15-AL-sw2-GFP, can bind to GTP. HEK293T cells lysates expressing indicated GFP-tagged proteins were incubated with the GTP-agarose, and pull-downs were immunoblotted against GFP. GFP-DEN(W34A), which is not a G protein, serves as a negative control. In (c and d), molecular weights (in kDa) are labeled in all immunoblots.
-
Figure 1—figure supplement 1—source data 1
Uncropped gel and blot images for Figure 1—figure supplement 1.
The organization of the figure is similar to that of Figure 1—source data 1.
- https://cdn.elifesciences.org/articles/76146/elife-76146-fig1-figsupp1-data1-v2.pdf
Figure 2 with 1 supplement
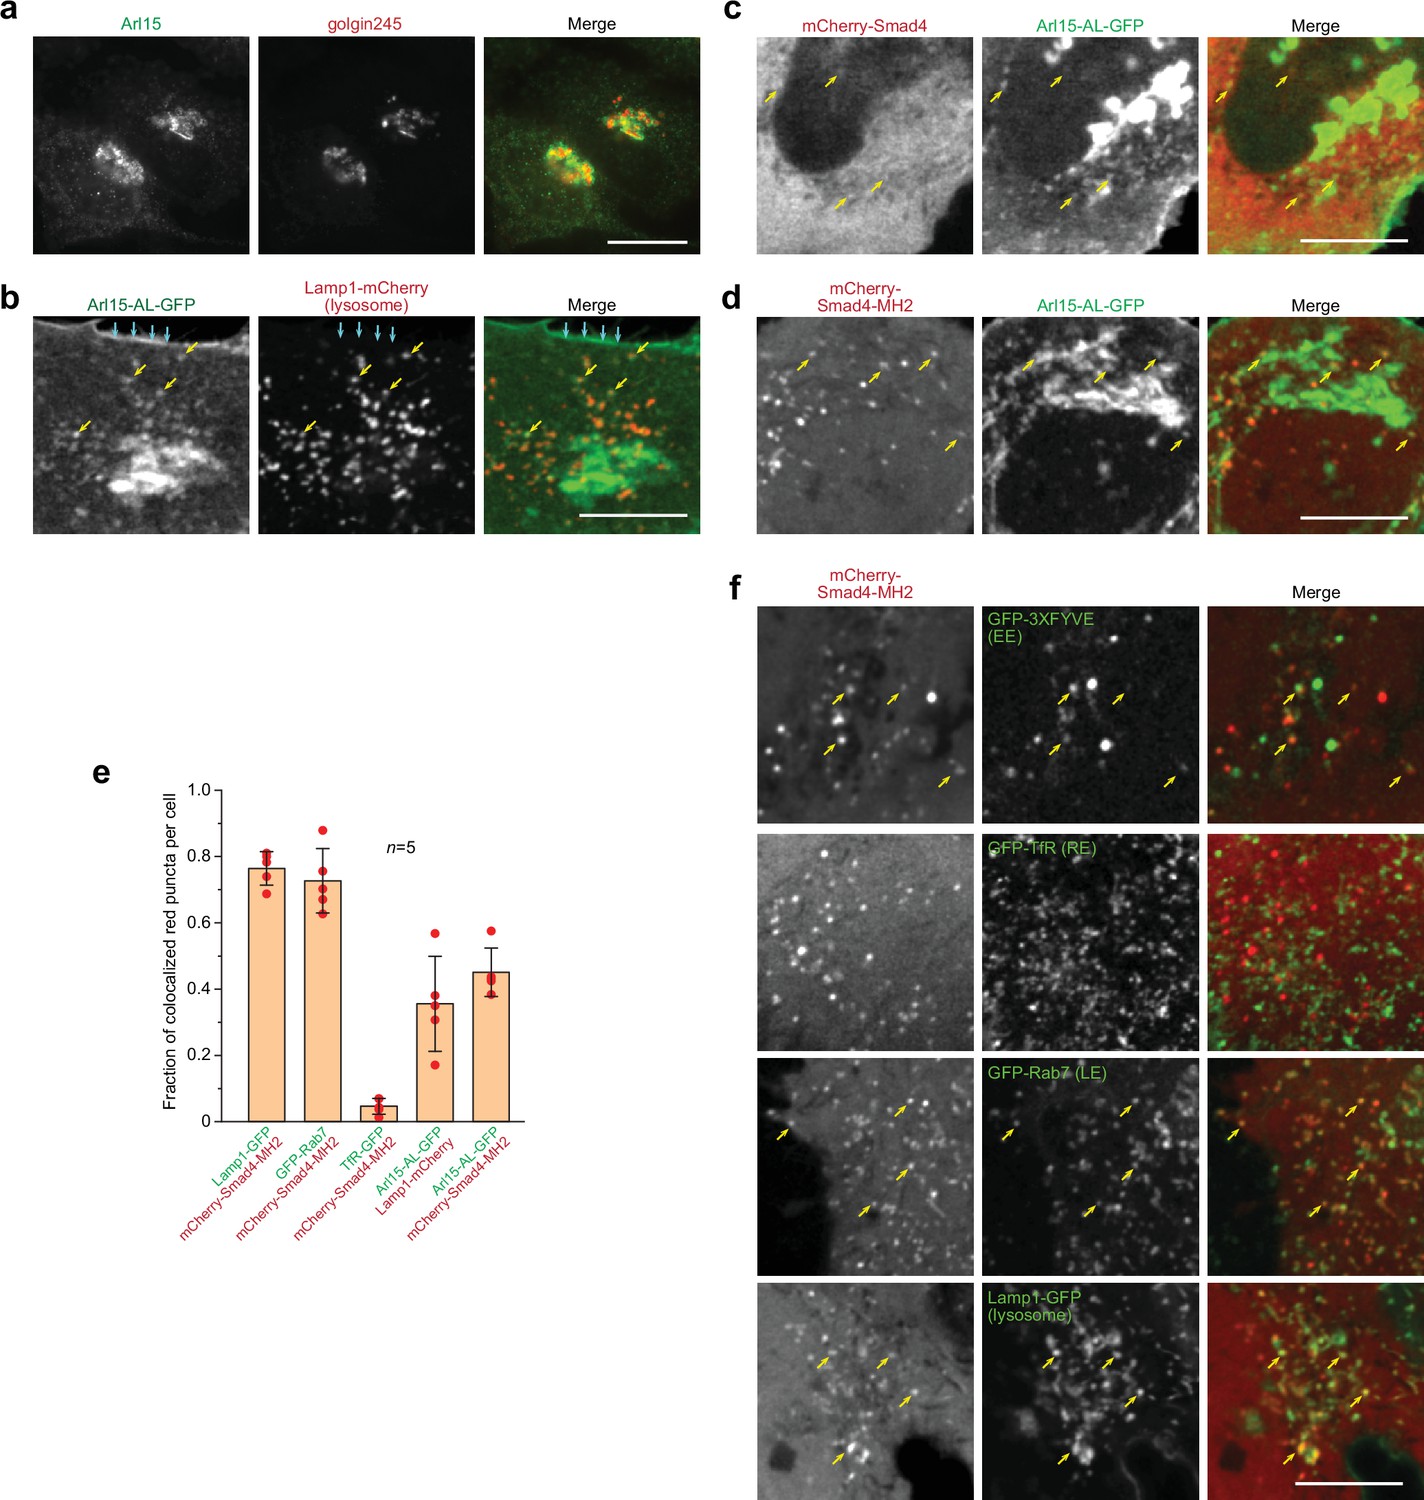
Smad4 colocalizes with the GTP-mutant form of Arl15 at the endolysosome.
HeLa cells under the normal culture condition were used. (a, b) Arl15 localizes to the Golgi and endolysosome. In (a), Arl15 localizes to the Golgi. Endogenous Arl15 and golgin245 (a Golgi marker) were stained by immunofluorescence in HeLa cells. Images were acquired by a wide-field microscope. In (b), Arl15-AL-GFP localizes to the PM and endolysosome. Live HeLa cells transiently co-expressing Arl15-AL-GFP and Lamp1-mCherry were imaged under a confocal microscope. Yellow arrows, colocalized puncta; cyan arrows, PM. (c, d) Smad4-MH2 displays better colocalization with the GTP-mutant form of Arl15 than full-length Smad4 at the endolysosome. Live HeLa cells co-expressing indicated mCherry and GFP-tagged proteins were imaged under a confocal microscope. Note that they colocalize at the endolysosome but not the Golgi. (e) Quantitative colocalization between Smad4-MH2 and various endolysosome markers. n=5 cells were imaged, and all red puncta (mCherry-Smad4-MH2 or Lamp1-mCherry) within each image were examined. Fractions of red puncta that visually colocalize with green puncta were calculated and plotted. Error bar, mean ± SD (n=5 cells). Red dot, individual data point. (f) Smad4-MH2 localizes to the EE, LE, and lysosome but not the RE. Live HeLa cells co-expressing indicated mCherry and GFP-tagged proteins were imaged under the confocal microscope. GFP-tagged 3×FYVE, TfR, Rab7, and Lamp1 are markers for the EE, RE, LE, and lysosome, respectively. Yellow arrows indicate colocalization. Scale bar, 10 µm.
-
Figure 2—source data 1
Numerical data for the graph in Figure 2e.
- https://cdn.elifesciences.org/articles/76146/elife-76146-fig2-data1-v2.xlsx
Figure 2—figure supplement 1
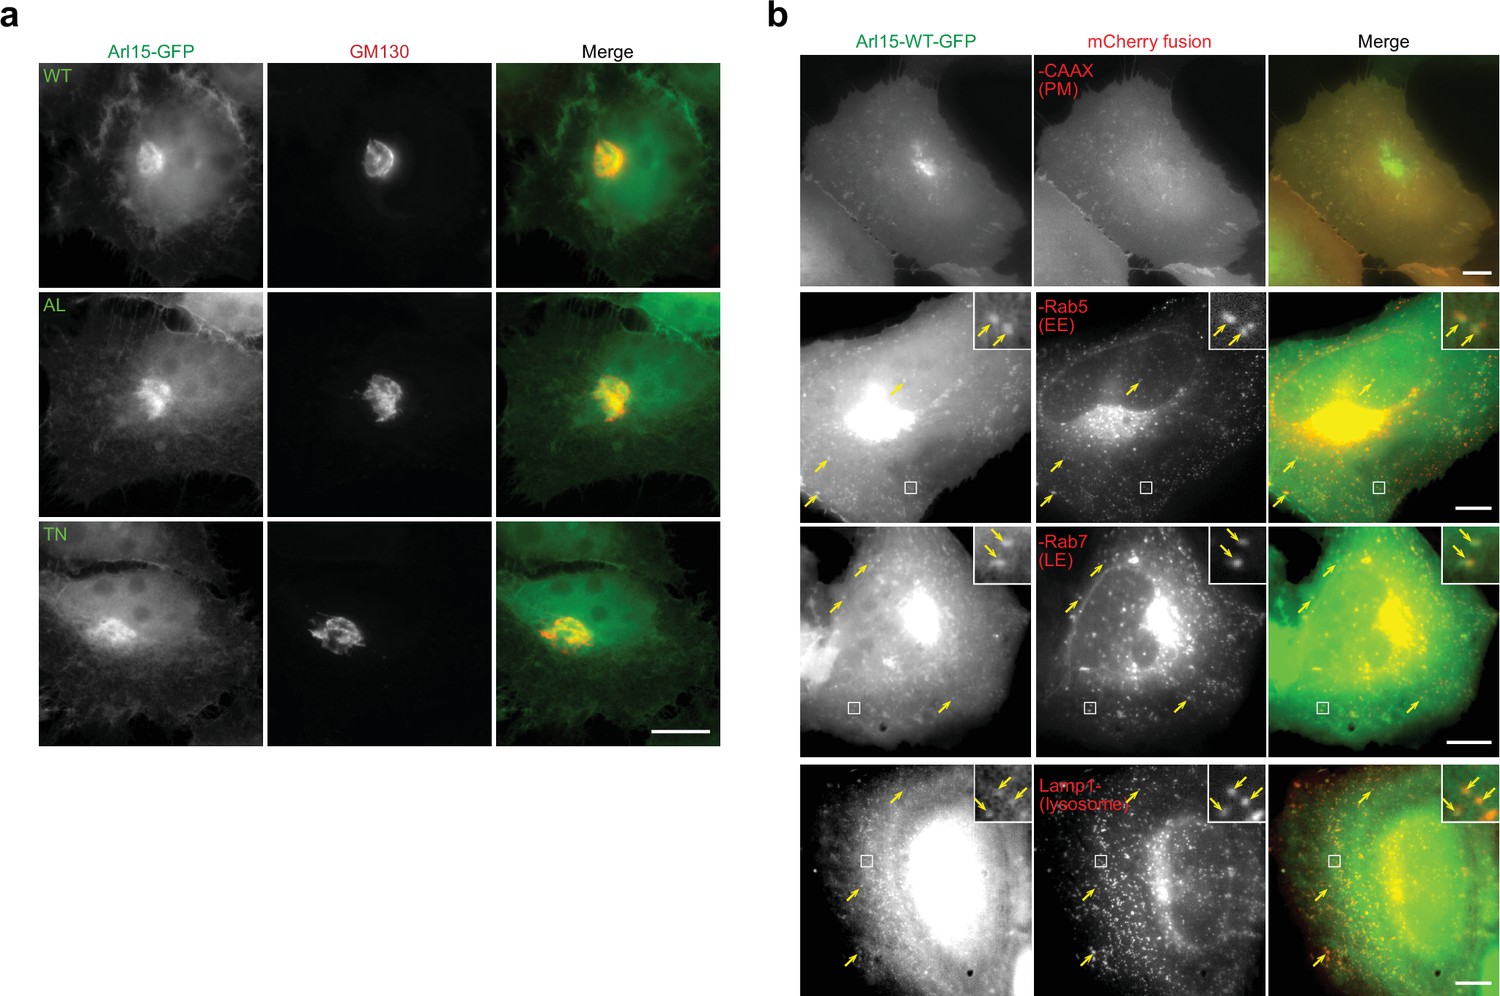
C-terminally GFP-tagged Arl15 localizes to the Golgi, PM, EE, LE, and lysosome.
(a) Arl15-WT, AL, and TN mutants localize to the Golgi. HeLa cells transiently expressing Arl15-(WT, AL, or TN)-GFP were immunostained for endogenous GM130. (c) Arl15-WT-GFP can be detected at the PM (mCherry-CAAX), EE (mCherry-Rab5), LE (mCherry-Rab7), and lysosome (Lamp1-mCherry). HeLa cells transiently co-expressing Arl15-WT-GFP and indicated mCherry-tagged organelle marker were imaged live. Boxed regions are enlarged in the upper right corners to show colocalization. Arrows indicate colocalization. All images were acquired by a wide-field microscope. Scale bar, 10 µm.
Figure 3 with 1 supplement
Arl15-GTP indirectly interacts with R-Smads via Smad4.
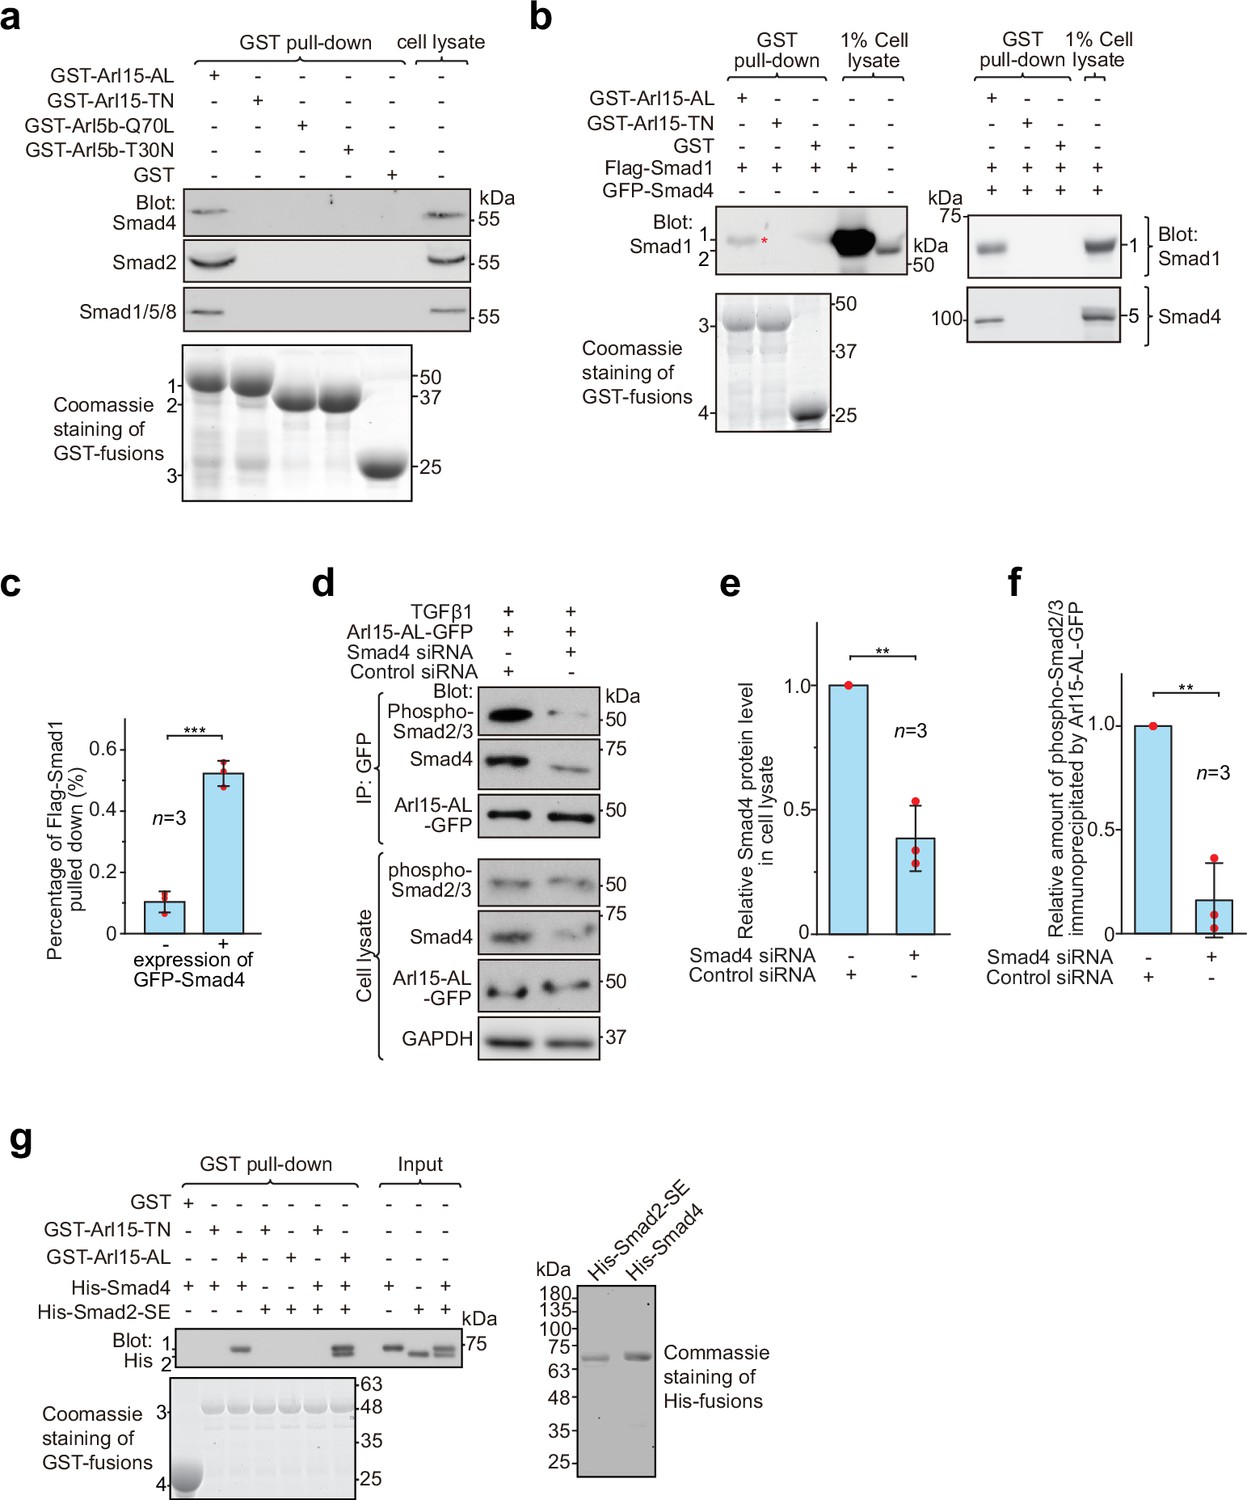
HEK293T cells under the normal culture condition were used unless specified. (a) The GTP-mutant form of Arl15 specifically pulled down endogenous R-Smads in addition to Smad4. Bead-immobilized GST-fusion proteins were incubated with the cell lysate, and pull-downs and the cell lysate were immunoblotted against indicated Smads. 1, 2, and 3 indicate GST-Arl15 (AL or TN), GST-Arl5b (Q70L or T30N), and GST band. Arl5b serves as a negative control. (b, c) The GTP-mutant form of Arl15 pulled down more exogenously expressed Smad1 when Smad4 was co-expressed. In (b), bead-immobilized GST-fusion proteins were incubated with cell lysates expressing indicated proteins, and pull-downs and the cell lysates were immunoblotted against Smad1 and 4. 1, Flag-Smad1; 2, endogenous Smad1/5/8; 3, GST-Arl15 (AL or TN); 4, GST; 5, GFP-Smad4; *, the weak band of Flag-Smad1 that was pulled down without co-expression of Smad4. The percentage of Flag-Smad1 pulled down, calculated as the ratio of the intensity of the pull-down band to that of the corresponding 1% cell lysate input band, is plotted in (c). (d, e, f) The GTP-mutant form of Arl15 immunoprecipitated much less endogenous phospho-Smad2/3 upon Smad4 depletion. In (d), cells subjected to siRNA-mediated knockdown were transiently transfected to express Arl15-AL-GFP. After cells were treated with 5 ng/ml TGFβ1 for 20 hr, cell lysates were incubated with the anti-GFP antibody, and immunoprecipitated proteins were blotted together with cell lysates for indicated proteins. IP, immunoprecipitation. The quantification of blots is shown in (e, f). To calculate the relative Smad4 protein level in cell lysate, the band intensity of Smad4 in cell lysate is normalized by that of corresponding GAPDH, and the resulting value is further normalized by that of the control knockdown. To calculate the relative amount of phospho-Smad2/3 immunoprecipitated by Arl15-AL-GFP, the band intensity of immunoprecipitated phospho-Smad2/3 is normalized by that of corresponding Arl15-AL-GFP and cell lysate phospho-Smad2/3, and the resulting value is further normalized by that of the control knockdown. In (c, e, and f), error bar, mean ± SD of n=3 experiments. p values are from the t-test (unpaired and two-tailed). **, p≤0.005; ***, p≤0.0005. Red dot, individual data point. (g) Arl15-GTP, Smad4 and Smad2 can assemble into a complex. Bead-immobilized GST-fusion proteins were incubated with indicated purified His-tagged Smads, and pull-downs were immunoblotted against His-tag. 1, His-Smad4; 2, His-Smad2-SE; 3, GST-Arl15 (AL or TN); 4, GST. The loading of fusion proteins is shown by Coomassie staining in (a, b, and g). Molecular weights (in kDa) are labeled in all immunoblots and gels.
-
Figure 3—source data 1
Uncropped gel and blot images for Figure 3.
The organization of the figure is similar to that of Figure 1—source data 1.
- https://cdn.elifesciences.org/articles/76146/elife-76146-fig3-data1-v2.pdf
-
Figure 3—source data 2
Numerical data for graphs in Figure 3c, e and f.
- https://cdn.elifesciences.org/articles/76146/elife-76146-fig3-data2-v2.xlsx
Figure 3—figure supplement 1
Arl15-GTP indirectly interacts with Smad2 via Smad4.
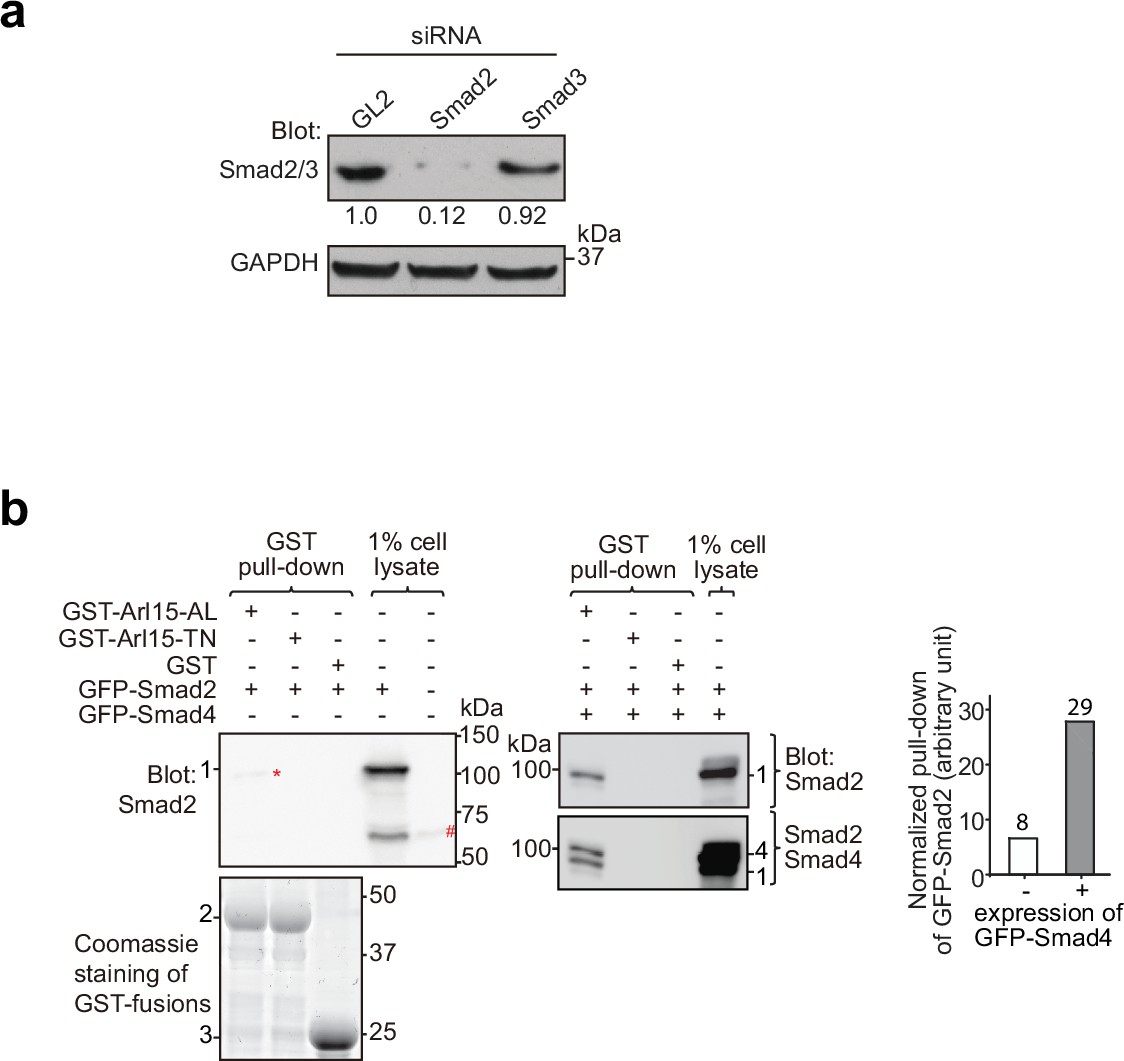
HEK293T cells under the normal culture condition were used. (a) The anti-Smad2/3 mAb primarily detects endogenous Smad2 in HEK293T cells. Cells were subjected to GL2, Smad2, or Smad3 siRNA knockdown, and the resulting cell lysates were blotted for indicated proteins. Ratios of the intensity of Smad2/3 band to that of GAPDH band are displayed below. (b) The GTP-mutant form of Arl15 pulls down more exogenously expressed Smad2 when Smad4 was co-expressed. Bead-immobilized GST-fusion proteins were incubated with cell lysates expressing indicated proteins, and pull-downs and 1% cell lysate inputs were immunoblotted against Smad2 (anti-Smad2/3 mAb) and Smad4. In the middle panel, the same blot was sequentially blotted for Smad2 (upper blot) followed by Smad4 (lower blot). 1, GFP-Smad2; 2, GST-Arl15 (AL or TN); 3, GST; 4, GFP-Smad4; #, endogenous Smad2; *, the weak band of GFP-Smad2 that was pulled down without co-expression of Smad4. The normalized pull-down of GFP-Smad2, calculated by the ratio of the intensity of the pull-down band to that of 1% cell lysate input band, is plotted in the right panel. Loading of fusion proteins is shown by Coomassie staining. Molecular weights (in kDa) are labeled in immunoblots and gels.
-
Figure 3—figure supplement 1—source data 1
Uncropped gel and blot images for Figure 3—figure supplement 1.
The organization of the figure is similar to that of Figure 1—source data 1.
- https://cdn.elifesciences.org/articles/76146/elife-76146-fig3-figsupp1-data1-v2.pdf
Figure 4 with 1 supplement
Arl15-GTP opens Smad4 and promotes assembly of the Smad-complex.
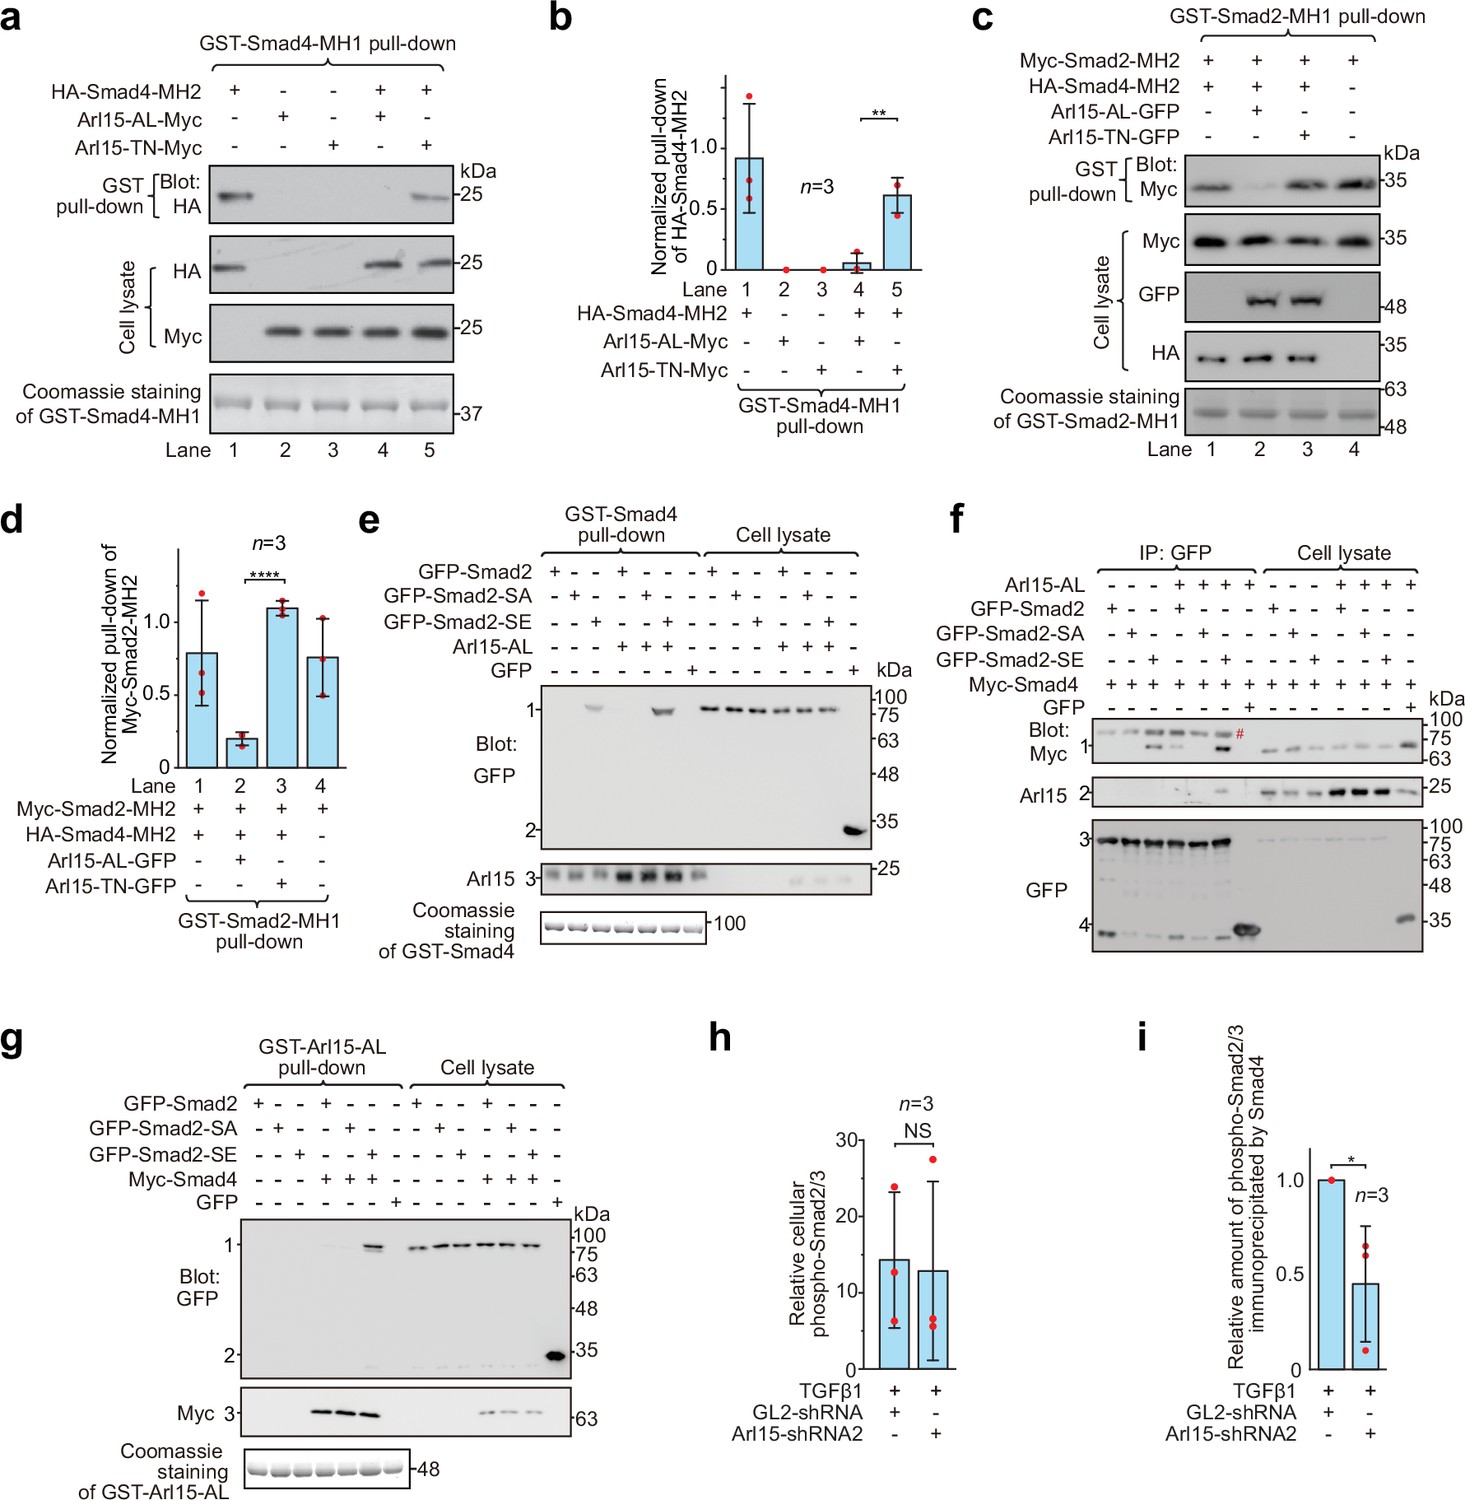
HEK293T cells under the normal culture condition were used. (a) The GTP-mutant form of Arl15 opens Smad4 by inhibiting the intramolecular interaction between the MH1 and MH2 domain of Smad4. Bead-immobilized GST-Smad4-MH1 was incubated with the cell lysates expressing indicated proteins, and pull-downs and the cell lysates were immunoblotted against HA or Myc-tag. (b) The normalized pull-down of HA-Smad4-MH2 for assays conducted in (a). The ratio of the intensity of the pull-down to that of the corresponding cell lysate band was calculated and plotted. (c) Arl15-GTP increases the intermolecular interaction between the Smad4-MH2 and Smad2-MH2 domain. Bead-immobilized GST-Smad2-MH1 domain was incubated with the cell lysates expressing indicated proteins, and pull-downs and the cell lysates were immunoblotted against indicated tags. (d) The normalized pull-down of Myc-Smad2-MH2 for assays conducted in (c). Quantification was the same as in (b). (e, f) Arl15-GTP promotes the interaction between Smad4 and phosphomimetic mutant of Smad2, Smad2-SE. In (e), bead-immobilized GST-Smad4 was incubated with the cell lysates expressing indicated proteins, and pull-downs and the cell lysates were immunoblotted against indicated tags or protein. 1, GFP-Smad2 (WT, SA or SE); 2, GFP; 3, endogenous Arl15 or overexpressed Arl15-AL. In (f), the cell lysates expressing indicated proteins were incubated with anti-GFP antibody, and the immunoprecipitates and the cell lysates were immunoblotted against indicated tags or protein. 1, Myc-Smad4; 2, endogenous Arl15 or overexpressed Arl15-AL; 3, GFP-Smad2 (WT, SA or SE); 4, GFP; #, non-specific band. (g) Arl15-GTP, Smad4, and Smad2-SE can assemble into a complex. Bead-immobilized GST-Arl15-AL was incubated with the cell lysates expressing indicated proteins, and pull-downs and the cell lysates were blotted. 1, GFP-Smad2 (WT, SA or SE); 2, GFP; 3, Myc-Smad4. In (a,c,e and g), loading of GST-fusion proteins is shown by Coomassie staining. Molecular weights (in kDa) are labeled in all immunoblots. (h, i) Quantification plots of Figure 1C, showing that Arl15 promotes the interaction between Smad4 and phospho-Smad2/3. In (h), to calculate the relative cellular phospho-Smad2/3, the band intensity of cell lysate phospho-Smad2/3 is normalized by that of corresponding GAPDH. In (i), to calculate the relative amount of phospho-Smad2/3 immunoprecipitated by Smad4, the band intensity of immunoprecipitated phospho-Smad2/3 is normalized by that of corresponding Smad4 and cell lysate phospho-Smad2/3, and the resulting value is further normalized by that of control knockdown. In (b, d, h, and i), error bar, mean ± SD of n=3 experiments. p values are from the t-test (unpaired and two-tailed). NS, not significant (p>0.05); *, p≤0.05; **, p≤0.005; ****, p≤0.00005. Red dot, individual data point.
-
Figure 4—source data 1
Uncropped gel and blot images for Figure 4.
The organization of the figure is similar to that of Figure 1—source data 1.
- https://cdn.elifesciences.org/articles/76146/elife-76146-fig4-data1-v2.pdf
-
Figure 4—source data 2
Numerical data for graphs in Figure 4b, d, h and i.
- https://cdn.elifesciences.org/articles/76146/elife-76146-fig4-data2-v2.xlsx
Figure 4—figure supplement 1
Arl15-GTP promotes the interaction between Smad4 and phosphomimetic mutant of Smad1, Smad1-SE.
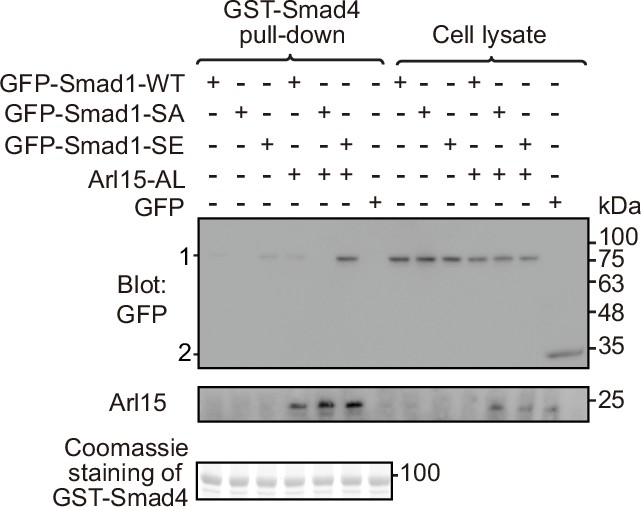
HEK293T cells were cultured under normal condition. Bead-immobilized GST-Smad4 was incubated with cell lysates expressing indicated proteins, and pull-downs and the cell lysates were immunoblotted for GFP or Arl15. 1 and 2 indicate GFP-Smad1 (WT, SA, or SE) and GFP bands, respectively. Loading of fusion proteins is shown by Coomassie staining. Molecular weights (in kDa) are labeled in the immunoblot.
-
Figure 4—figure supplement 1—source data 1
Uncropped gel and blot images for Figure 4—figure supplement 1.
The organization of the figure is similar to that of Figure 1—source data 1.
- https://cdn.elifesciences.org/articles/76146/elife-76146-fig4-figsupp1-data1-v2.pdf
Figure 5 with 1 supplement
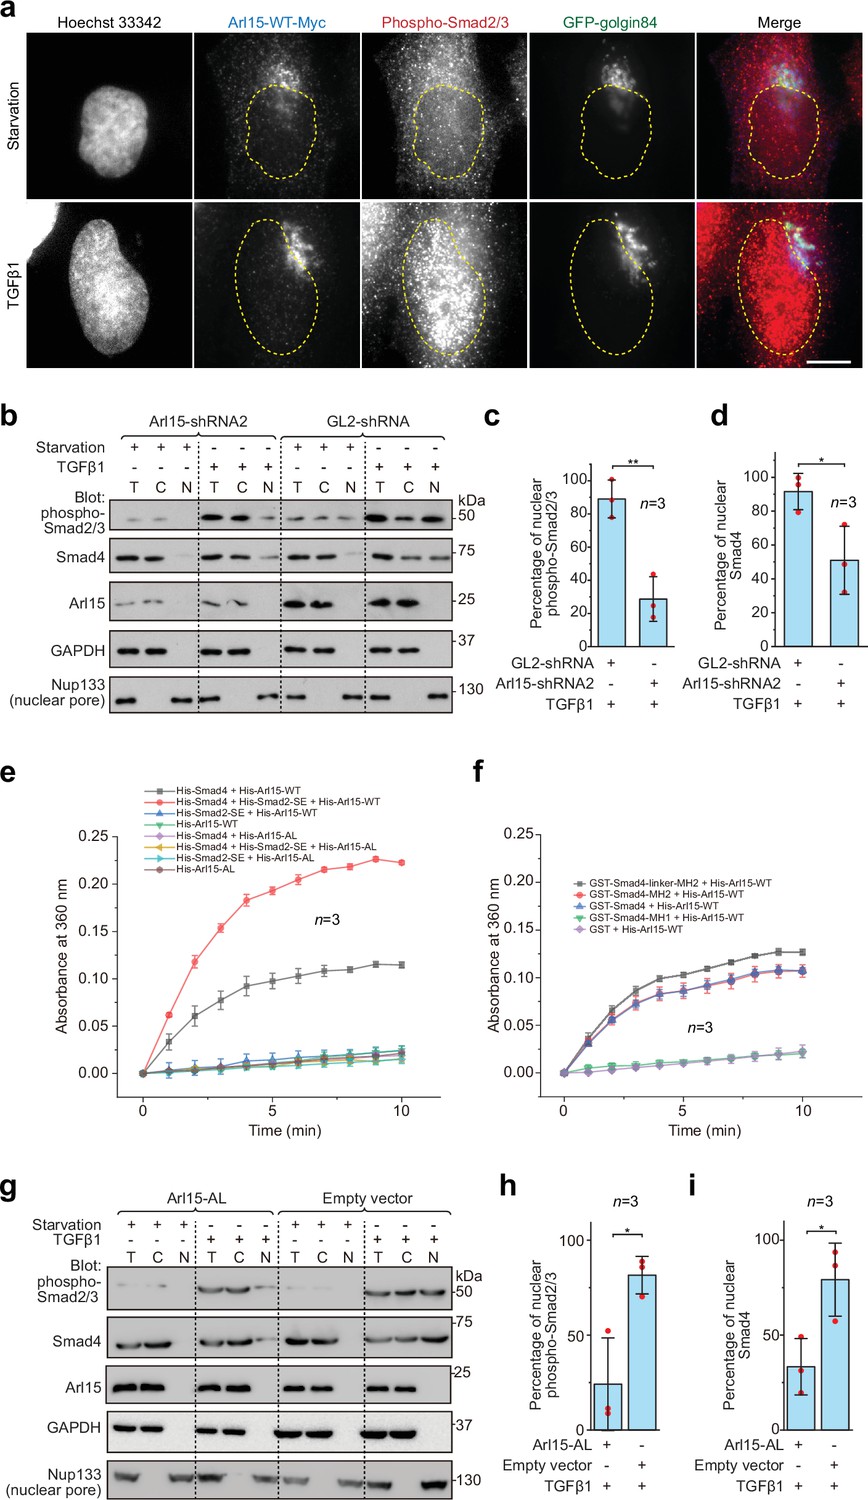
The Smad-complex functions as a GAP to inactivate and dissociate Arl15 before translocating to the nucleus.
(a–d) Under the TGFβ1 treatment, phospho-Smad2/3, but not Arl15, translocated to the nucleus. In (a), serum-starved HeLa cells expressing GFP-golgin84 (a Golgi marker) and Arl15-WT-Myc were either further serum-starved or treated with 10 ng/ml TGFβ1 for 1 hr. Cells were stained for DNA (Hoechst 33342) and endogenous phospho-Smad2/3. The dotted line indicates the contour of the nucleus. Scale bar, 10 µm. In (b), HeLa cells were subjected to Arl15 or control knockdown. After being serum-starved for 4 hr, cells were either further serum-starved or treated with 10 ng/ml TGFβ1 for 1 hr. Total cell lysate (T) and cytosol (C) and nuclear (N) fractions were immunoblotted against indicated proteins. Molecular weights (in kDa) are labeled in immunoblots. Immunoblots were quantified in (c and d). In (c), the band intensity of phospho-Smad2/3 is first normalized by that of corresponding Nup133. To calculate the percentage of nuclear phospho-Smad2/3, the normalized nuclear phospho-Smad2/3 is divided by that of total cell lysate. In (d), the percentage of nuclear Smad4 is calculated as in (c). Red dot, individual data point. (e) Phospho-Smad2 (Smad2-SE) promotes the GAP activity of Smad4 toward Arl15. 40 µM GTP-loaded His-Arl15-WT or AL was incubated with 0.4 µM indicated His-Smads at 22 °C. Released inorganic phosphate was enzymatically converted and continuously monitored by absorbance at 360 nm. The absorbance was plotted against time. (f) The Smad4-MH2 domain possesses the GAP activity toward Arl15. The experiment was conducted as in (e). GST-fused Smad4 fragments were used. In (c, d, e, and f), error bar, mean ± SD of n=3 experiments. (g, h, i) Overexpression of GTP-form mutant of Arl15, Arl15-AL, inhibitsTGFβ1-stimulated nuclear translocation of phospho-Smad2/3 and Smad4. HeLa cells transiently expressing Arl15-AL or empty vector control (pCI-neo) were serum-starved for 4 hr followed by further starvation or 5 ng/ml TGFβ1 treatment for 20 hr. Nuclear fractionation, immunoblotting, and subsequent quantification are similar to (b–d).
-
Figure 5—source data 1
Uncropped gel and blot images for Figure 5.
The organization of the figure is similar to that of Figure 1—source data 1.
- https://cdn.elifesciences.org/articles/76146/elife-76146-fig5-data1-v2.pdf
-
Figure 5—source data 2
Numerical data for graphs in Figure 5c, d, e, h and i.
- https://cdn.elifesciences.org/articles/76146/elife-76146-fig5-data2-v2.xlsx
Figure 5—figure supplement 1
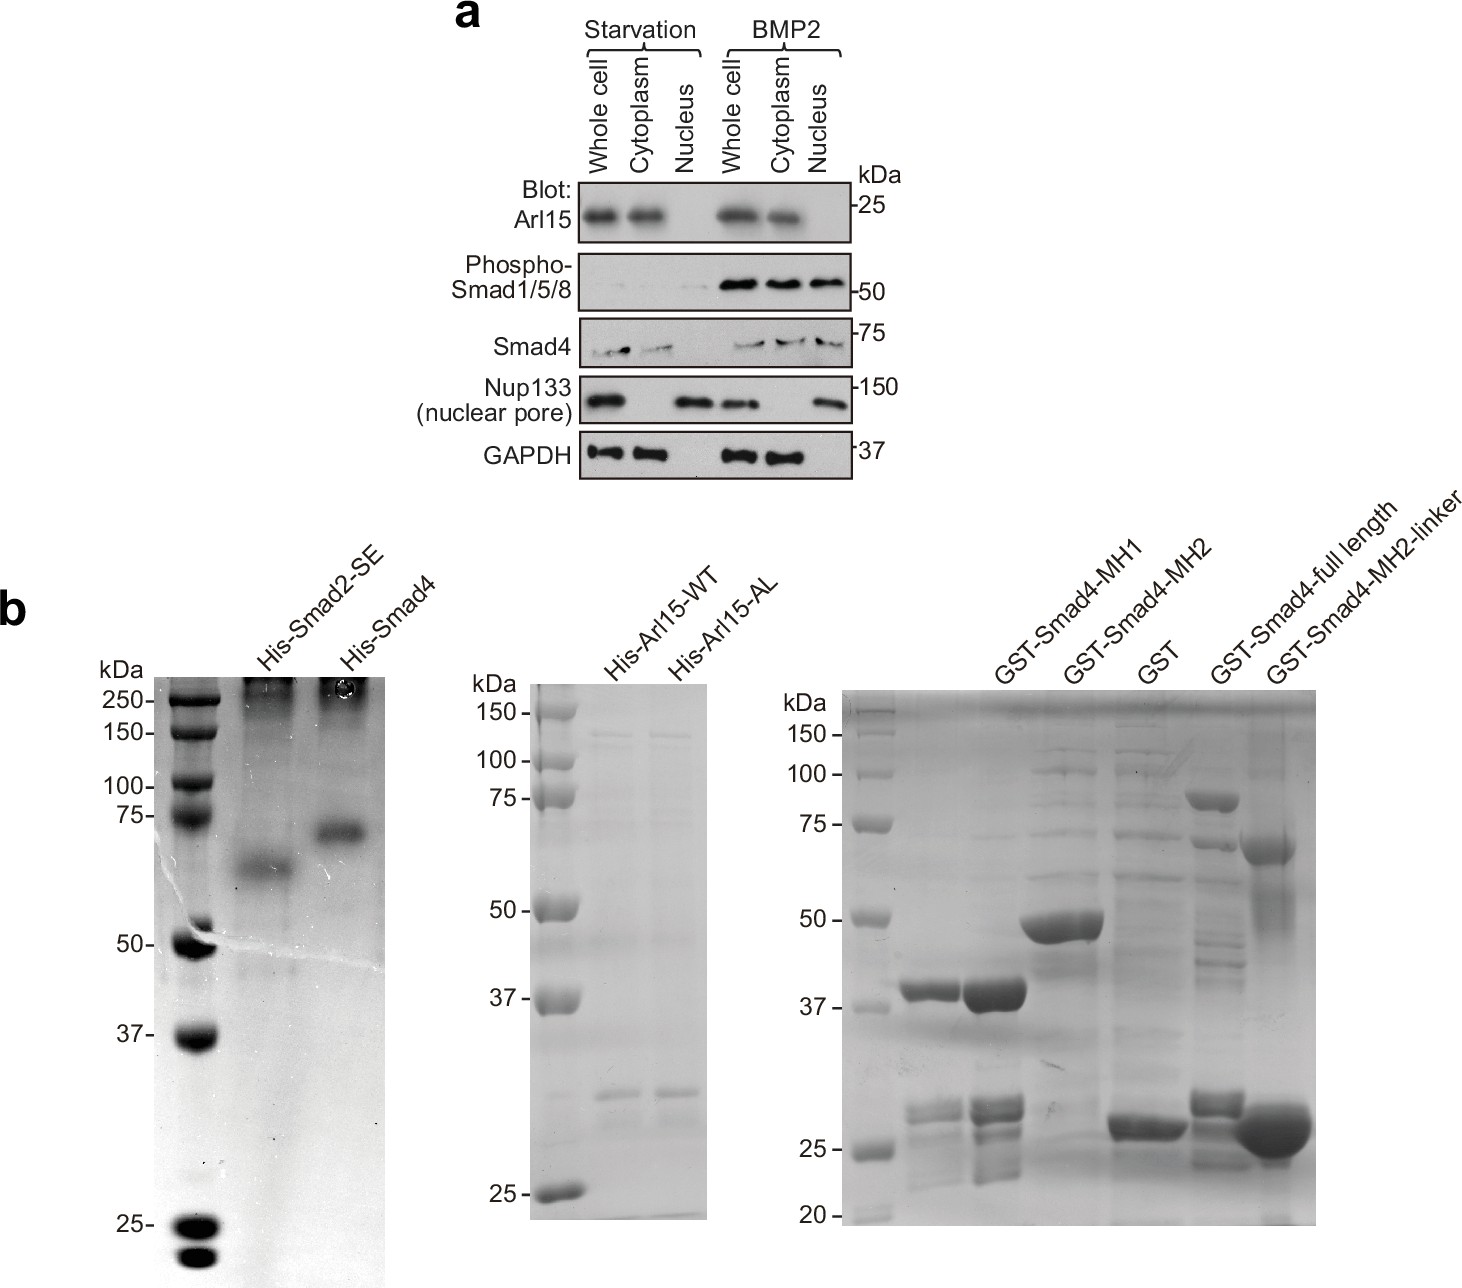
Nucleus translocation of phospho-Smad1/5/8 and Coomassie gels of purified proteins used in GAP assays.
(a) Under the BMP2 treatment, phospho-Smad1/5/8, but not Arl15, translocates to the nucleus. As described in Figure 5b, serum-starved HeLa cells were either further serum-starved or treated with 100 ng/ml BMP2 for 4 hr. Total cell lysate and nuclear and cytosol fractions were subjected to immunoblotting against indicated proteins. (b) Coomassie gels of purified proteins used in the GAP assay described in Figure 5e and f. Molecular weights (in kDa) are labeled in all immunoblots and gels.
-
Figure 5—figure supplement 1—source data 1
Uncropped gel and blot images for Figure 5—figure supplement 1.
The organization of the figure is similar to that of Figure 1—source data 1.
- https://cdn.elifesciences.org/articles/76146/elife-76146-fig5-figsupp1-data1-v2.pdf
Figure 6 with 1 supplement
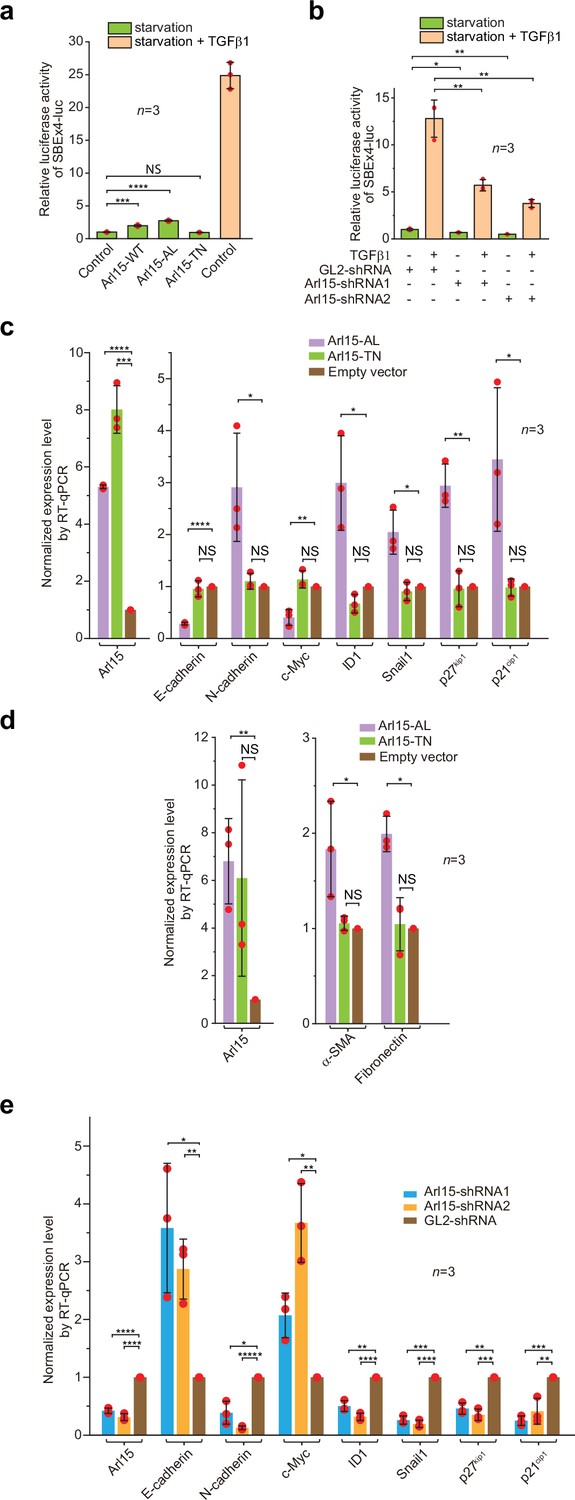
Arl15-GTP is a positive and essential regulator for the full activity of TGFβ family signaling pathway.
(a) Arl15 can positively regulate the TGFβ signaling pathway since overexpressed Arl15-WT and AL, but not TN, promotes the transcription of SBE ×4 luc reporter under starvation. HeLa cells co-expressing the SBE ×4-driven firefly luciferase and SV40-driven renilla luciferase together with indicated Arl15 mutant or pBluescript SK vector DNA (control) were serum-starved for 24 hr. For TGFβ1 induction, control cells were serum-starved for 4 hr followed by 5 ng/ml TGFβ1 treatment for 20 hr. Dual-luciferase assays were performed, and relative luciferase activities were subsequently acquired and normalized. (b) Arl15 is essential for efficient TGFβ1 signaling since its depletion reduces TGFβ1-stimulated transcription of SBE ×4 luc reporter. After lentivirus-mediated knockdown of Arl15, HeLa cells co-expressing the dual-luciferase described in (a) were serum-starved for 4 hr followed by either further starvation or 5 ng/ml TGFβ1 (starvation +TGFβ1) treatment for 20 hr. Relative luciferase activities were subsequently acquired and normalized. GL2 is a non-targeting control shRNA. (c, d) Overexpression of Arl15-AL, but not TN, promotes the transcription of N-cadherin, ID1, Snail1, p27kip1, p21cip1, α-SMA, and Fibronectin and suppresses the transcription of E-cadherin and c-Myc. MCF7 cells were subjected to lentivirus-transduced overexpression of Arl15-AL or TN followed by starvation for 16 hr. Transcripts of indicated genes were quantified by RT-qPCR and normalized by control (empty vector). (e) Opposite to overexpression, depletion of Arl15 suppresses TGFβ1-induced transcription of N-cadherin, ID1, Snail1, p27kip1, and p21cip1, and promotes the transcription of E-cadherin and c-Myc. After lentivirus-transduced knockdown of Arl15, MCF7 cells were subjected to 5 ng/ml TGFβ1 treatment for 72 hr. Transcripts of indicated genes were quantified and normalized as in (c). Error bar, mean ± SD of n=3 experiments. p values were from the t-test (unpaired and two-tailed). NS, not significant (p>0.05); *, p≤0.05; **, p≤0.005; ***, p≤0.0005; ****, p≤0.00005; *****, p≤0.000005. Red dot, individual data point.
-
Figure 6—source data 1
Numerical data for graphs in Figure 6a–e.
- https://cdn.elifesciences.org/articles/76146/elife-76146-fig6-data1-v2.xlsx
Figure 6—figure supplement 1
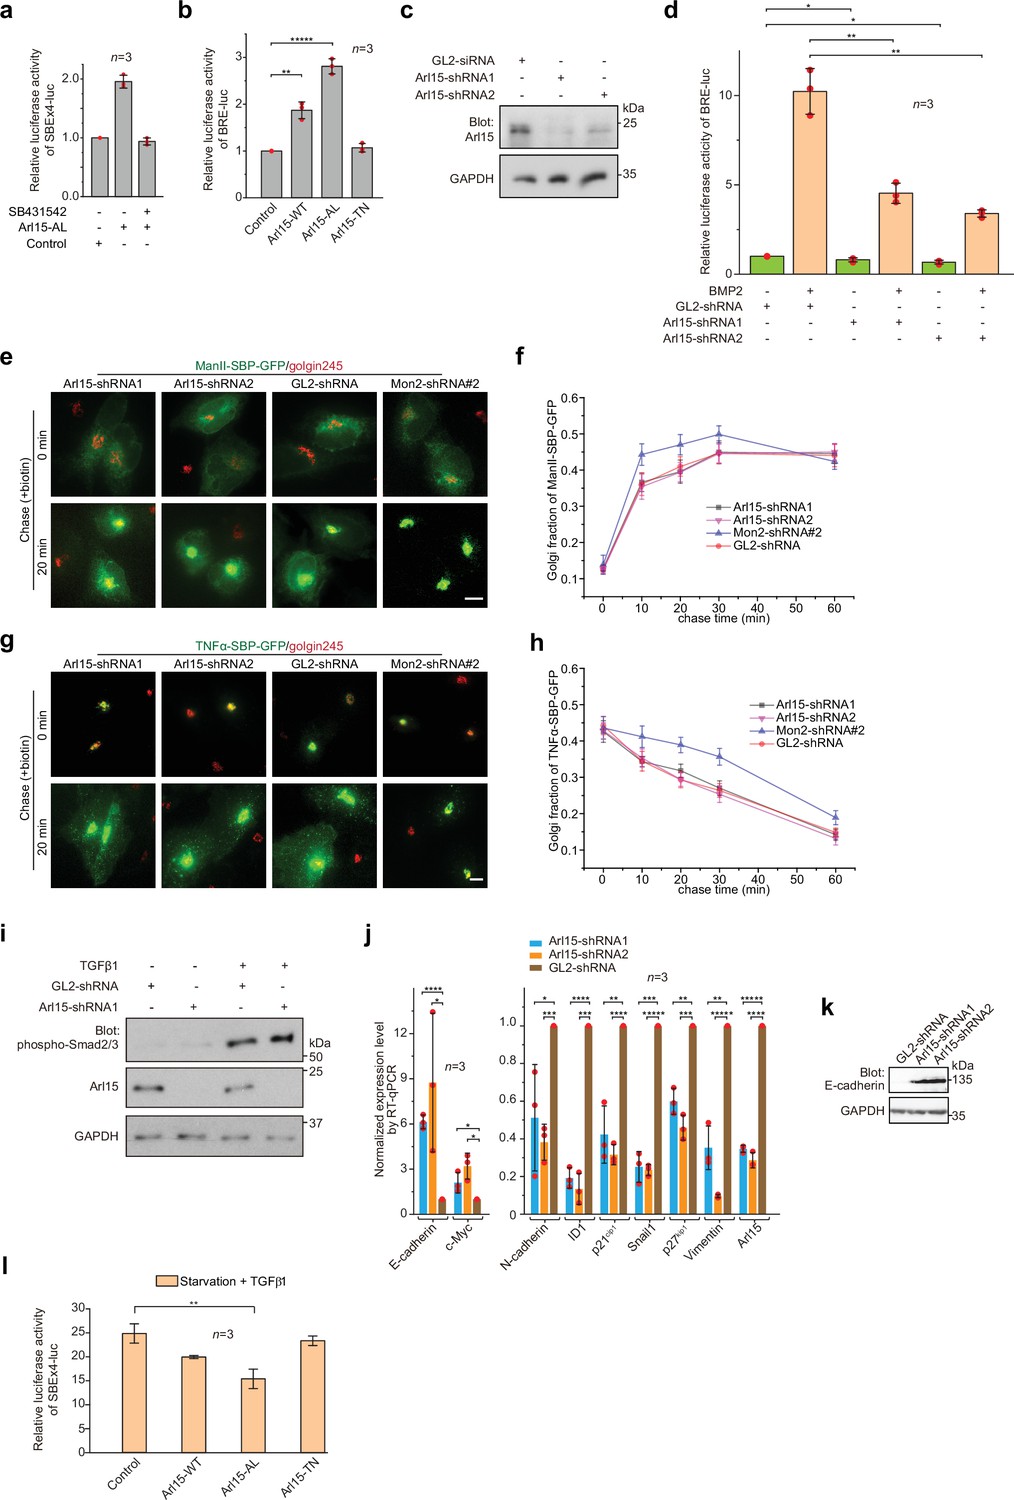
Arl15 promotes the TGFβ family signaling pathway.
(a) The Arl15-AL-induced transcription of SBE ×4 luc requires the kinase activity of the TGFβ type I receptor. HeLa cells co-expressing SBE ×4-driven firefly luciferase and SV40-driven renilla luciferase together with Arl15-AL or pBluescript SK vector DNA (control) were serum-starved for 4 hr followed by 20 hr treatment with starvation medium with or without 2 μM SB431542. The relative luciferase activities were subsequently acquired and normalized. (b) Arl15 positively regulates the BMP signaling pathway since overexpression of Arl15-WT or AL, but not TN, promotes the transcription of BRE-luc reporter. HeLa cells co-expressing BRE-driven firefly luciferase and SV40-driven renilla luciferase together with indicated Arl15 mutant, or pBluescript SK vector DNA (control) were serum-starved for 24 hr. The relative luciferase activities were subsequently acquired and normalized. (c) Endogenous Arl15 can be depleted by lentivirus-transduced shRNA knockdown. HeLa cells were lysed after lentivirus-transduced knockdown using indicated shRNA, and the resulting cell lysates were immunoblotted for Arl15 and GAPDH. (d) Arl15 is essential for efficient BMP signaling since its depletion reduces BMP2-stimulated transcription of BRE-luc reporter. After lentivirus-transduced knockdown of Arl15, HeLa cells expressing the dual-luciferase as described in (b) were serum-starved for 4 hr followed by 20 hr treatment with starvation medium supplemented with or without 100 ng/ml BMP2. The relative luciferase activities were subsequently acquired and normalized. (e, f) The ER-to-Golgi transport of ManII does not require Arl15. In (e), after lentivirus-transduced knockdown of Arl15, HeLa cells transiently expressing RUSH reporter ManII-SBP-GFP were subjected to biotin treatment to chase ManII-SBP-GFP along the ER-to-Golgi pathway (see Materials and methods). Golgi fractions were plotted in (f). (g,h) The Golgi export of TNFα does not require Arl15. In (g), after lentivirus-transduced knockdown of Arl15, HeLa cells transiently expressing RUSH reporter TNFα-SBP-GFP were incubated at 20 °C in the presence of biotin to accumulate TNFα-SBP-GFP at the Golgi. Cells were subsequently incubated at 37 °C to chase the reporter to exit the Golgi. The Golgi fractions were plotted in (h). Mon2 knockdown (Mon2 siRNA#2) serves as a control as it can accelerate the ER-to-Golgi transport and delay the Golgi export of secretory cargos. Scale bar, 10 µm. Error bar, mean ± SEM of n≥30 cells. (i) Arl15 is not required for TGFβ1-stimulated phosphorylation of Smad2/3. After lentivirus-transduced knockdown of Arl15, HeLa cells were serum-starved for 4 h followed by 20 hr treatment with starvation medium supplemented with or without 5 ng/ml TGFβ1. Cell lysates were subsequently immunoblotted for indicated proteins. (j) Depletion of Arl15 counteracts TGFβ1-induced transcriptions – it downregulates the transcription of N-cadherin, ID1, Snail1, vimentin, p27kip1, and p21cip1, and upregulates the transcription of E-cadherin and c-Myc. After lentivirus-transduced knockdown of Arl15, MDA-MB-231 cells were subjected to 16 hr starvation followed by 5 ng/ml TGFβ1 treatment for 4 hr. Transcripts of indicated genes were quantified and normalized as in Figure 6e. (k) Depletion of Arl15 upregulates the expression of E-cadherin in MDA-MB-231 cells. Knockdown was conducted as in (j). Cell lysates were immunoblotted for E-cadherin and GAPDH. In (c, i, and k) molecular weights (in kDa) are labeled in immunoblots. (l) Arl15-AL inhibits TGFβ1-induced transcription of SBE ×4 luc. The experiment was conducted as described in Figure 6a, except that all cells were treated with 5 ng/ml TGFβ1. In (a, b, d, j, and l) error bar, mean ± SD of n=3 experiments. p values were from the t-test (unpaired and two-tailed). NS, not significant (p>0.05); *, p≤0.05; **, p≤0.005; ***, p≤0.0005; ****, p≤0.00005; *****, p≤0.000005. Red dot, individual data point.
-
Figure 6—figure supplement 1—source data 1
Uncropped gel and blot images for Figure 6—figure supplement 1.
The organization of the figure is similar to that of Figure 1—source data 1.
- https://cdn.elifesciences.org/articles/76146/elife-76146-fig6-figsupp1-data1-v2.pdf
-
Figure 6—figure supplement 1—source data 2
Numerical data for graphs in Figure 6—figure supplement 1a, b, d, f, h and j.
- https://cdn.elifesciences.org/articles/76146/elife-76146-fig6-figsupp1-data2-v2.xlsx
Figure 7 with 1 supplement
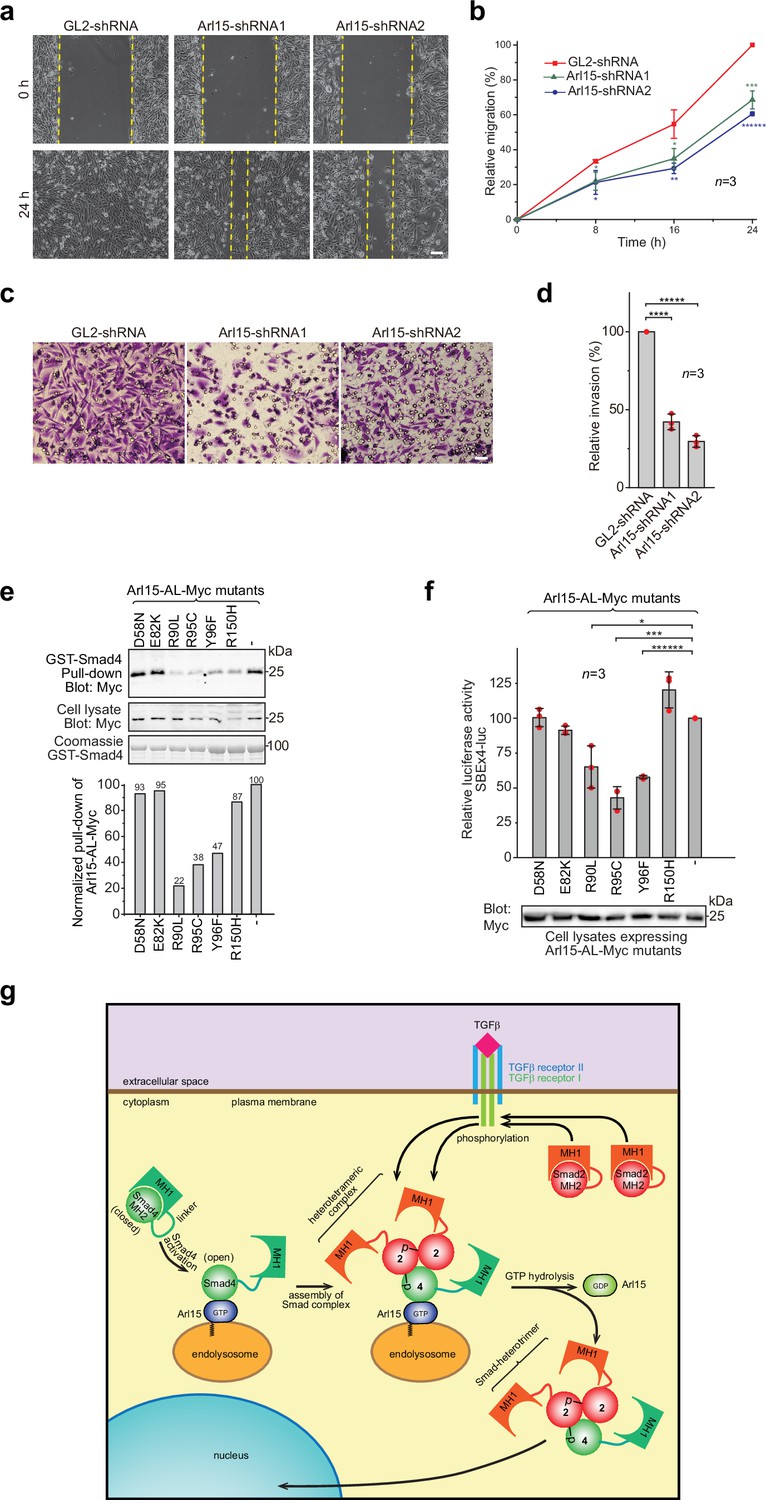
Implication of Arl15 in tumorigenesis by in vitro assays and mutation analysis, and our working model on how Arl15 regulates the TGFβ family signaling pathway.
(a, b) Arl15 is required for the efficient in vitro migration of MDA-MB-231 cells. MDA-MB-231 cells were subjected to lentivirus-transduced knockdown using indicated shRNA. When cells reached confluency, a strip of cells was scraped off, and the resulting gap was live-imaged to monitor the migration of cells. The percentage of the relative migration (see Materials and methods) is plotted in (b). (c,d) Arl15 is required for the efficient in vitro invasion and migration of MDA-MB-231 cells. MDA-MB-231 cells were subjected to lentivirus-transduced knockdown using indicated shRNA and were subsequently placed into cell culture filter chambers with basement matrix. Cells that invaded through the matrix and migrated to the lower surface of the filter were stained in (c). In (d), the relative invasion was calculated as described in Materials and methods. Scale bar, 100 µm. (e, f) Arl15 missense mutations identified from cancer patients compromise Arl15-Smad4 interaction and TGFβ signaling. In (e), ead-immobilized GST-Smad4 was incubated with HeLa cell lysates expressing Arl15-AL-Myc harboring indicated mutation, and pull-downs and the cell lysates were immunoblotted against Myc-tag. The normalized pull-down of Arl15-AL-Myc is shown below, and it is calculated as the ratio of the pull-down band intensity to the corresponding cell lysate band intensity. Loading of fusion proteins is shown by Coomassie staining. In (f), HeLa cells were co-transfected to express the dual-luciferase and Arl15-AL-Myc with indicated mutation. After 20 hr starvation, cells were subjected to the dual-luciferase assay and Western blot analysis for Myc-tag. In (b, d, and f), error bar, mean ± SD of n=3 experiments. p values were from the t-test (unpaired and two-tailed). *, p≤0.05; **, p≤0.005; ***, p≤0.0005; ******, p≤0.0000005. Red dot, individual data point. Molecular weights (in kDa) are labeled in all immunoblots. (g) A working model illustrating the molecular mechanism on how Arl15 regulates the TGFβ family signaling pathway. Smad2 is used as an example of the R-Smad. 2, Smad2; 4, Smad4; p, phosphate group at Smad2. See text for details.
-
Figure 7—source data 1
Uncropped gel and blot images for Figure 7.
The organization of the figure is similar to that of Figure 1—source data 1.
- https://cdn.elifesciences.org/articles/76146/elife-76146-fig7-data1-v2.pdf
-
Figure 7—source data 2
Numerical data for graphs in Figure 7b, d and f.
- https://cdn.elifesciences.org/articles/76146/elife-76146-fig7-data2-v2.xlsx
-
Figure 7—source data 3
List of ARL15 missense cancer mutations that are tested in GST-Smad4 pull-down assay (Figure 7e and f).
Mutation information is from COSMIC. In the column “type of cancer identified”, the number of samples with the mutation is indicated in parenthesis. “Count” displays the total number of samples with the mutation.
- https://cdn.elifesciences.org/articles/76146/elife-76146-fig7-data3-v2.docx
-
Figure 7—source data 4
List of ARL15 frameshift and nonsense mutations from COSMIC.
In the column ‘type of cancer identified’, the number of samples with the mutation is indicated in parenthesis. ‘Count’ displays the total number of samples with the mutation.
- https://cdn.elifesciences.org/articles/76146/elife-76146-fig7-data4-v2.docx
Figure 7—figure supplement 1
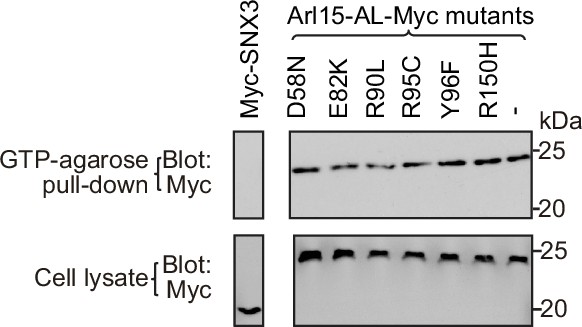
Arl15 missense mutations identified in cancer patients do not affect the GTP-binding of Arl15-AL.
The figure corresponds to Figure 7e and f. HEK293T cell lysates transiently expressing indicated Myc-tagged proteins were incubated with the GTP-agarose, and pull-downs were immunoblotted against Myc-tag. Myc-SNX3, which is not a G protein, serves as a negative control. Molecular weights (in kDa) are labeled. Bots in the same row are from the same gel blot.
-
Figure 7—figure supplement 1—source data 1
Uncropped gel and blot images for Figure 7—figure supplement 1.
The organization of the figure is similar to that of Figure 1—source data 1.
- https://cdn.elifesciences.org/articles/76146/elife-76146-fig7-figsupp1-data1-v2.pdf
Additional files
-
Supplementary file 1
List of DNA plasmids used in this study.
- https://cdn.elifesciences.org/articles/76146/elife-76146-supp1-v2.xlsx
-
Transparent reporting form
- https://cdn.elifesciences.org/articles/76146/elife-76146-transrepform1-v2.docx
Download links
A two-part list of links to download the article, or parts of the article, in various formats.
Downloads (link to download the article as PDF)
Open citations (links to open the citations from this article in various online reference manager services)
Cite this article (links to download the citations from this article in formats compatible with various reference manager tools)
Arl15 upregulates the TGFβ family signaling by promoting the assembly of the Smad-complex
eLife 11:e76146.
https://doi.org/10.7554/eLife.76146


