Complex pattern of facial remapping in somatosensory cortex following congenital but not acquired hand loss
- WIN Centre, University of Oxford, United Kingdom
- Institute of Cognitive Neuroscience, University College London, United Kingdom
- Medical Research Council Cognition and Brain Sciences Unit (CBU), University of Cambridge, United Kingdom
- Department of Psychosis Studies, Institute of Psychiatry, Psychology & Neuroscience, King's College London, United Kingdom
- Wellcome Trust Centre for Neuroimaging, University College London, United Kingdom
- Queen Mary’s Hospital, United Kingdom
Figures
Figure 1

Group-level activity maps for each facial movement versus rest.
Group average activity for the forehead (red), nose (yellow), lips (blue) and tongue (green) movements, contrasted to rest, in the (A) deprived/non-dominant and (B) intact/dominant hemisphere of controls (n=22), amputees (n=17), and one-handers (n=21). All clusters were created using a threshold-free cluster enhancement procedure with a sensorimotor pre-threshold mask (defined using the Harvard Cortical Atlas; outlined in darker grey), and thresholded at p<0.01. The hand and face regions of interest (ROIs) are outlined in purple and orange respectively, and the central sulcus is denoted with a white arrow.
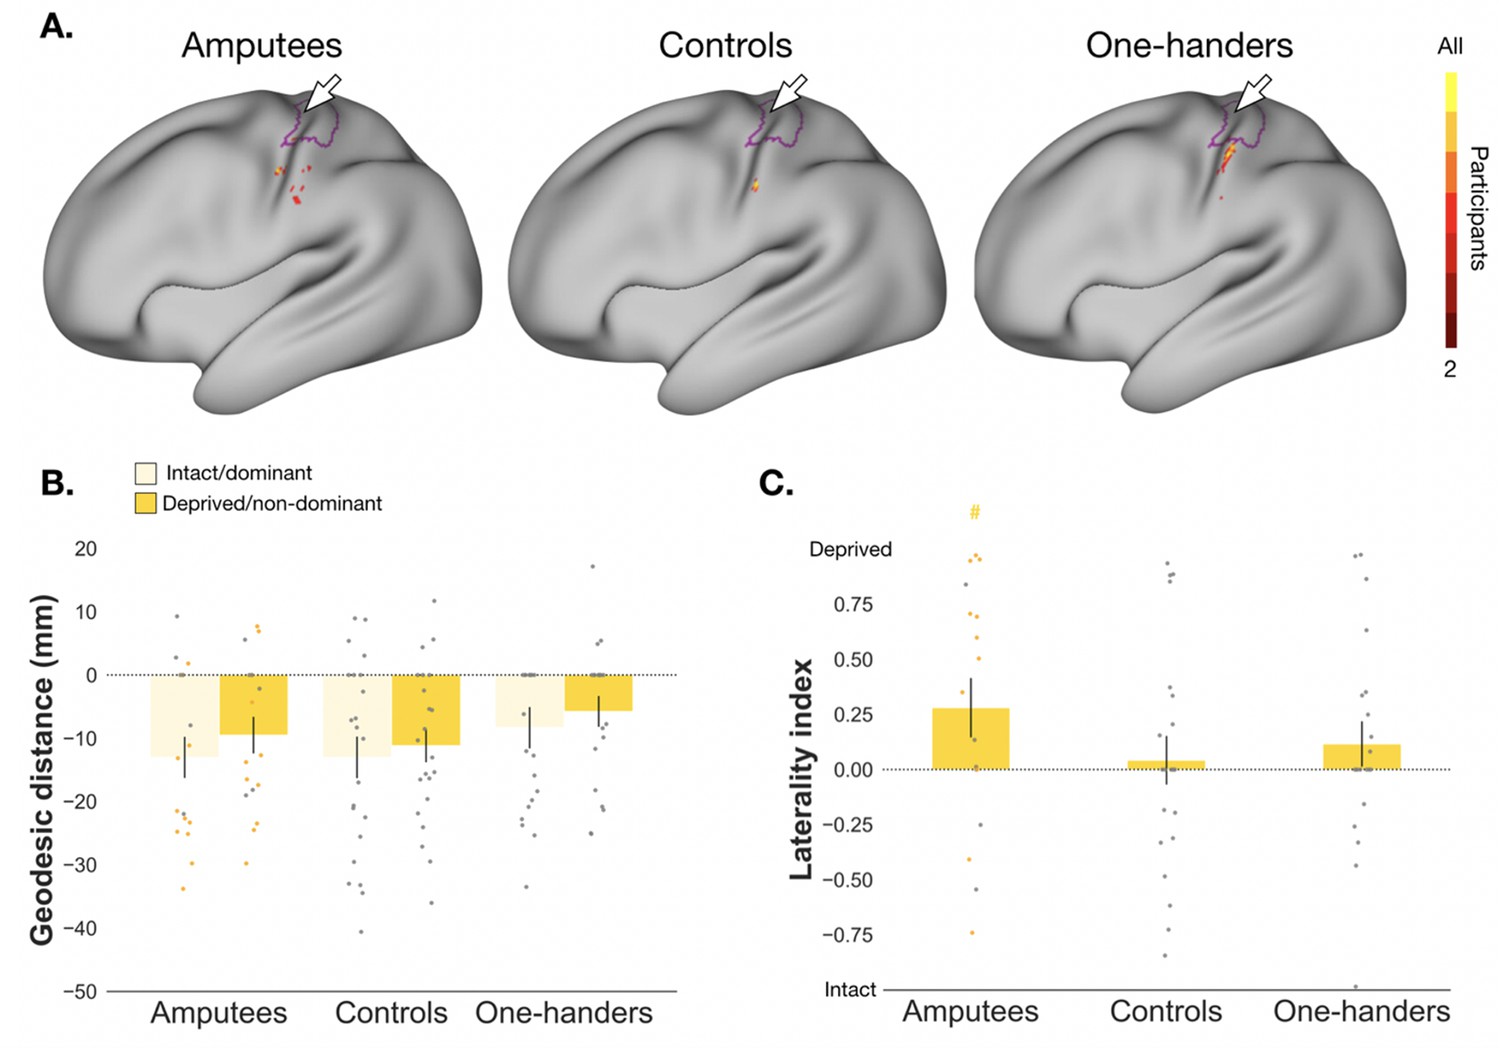
Figure 2
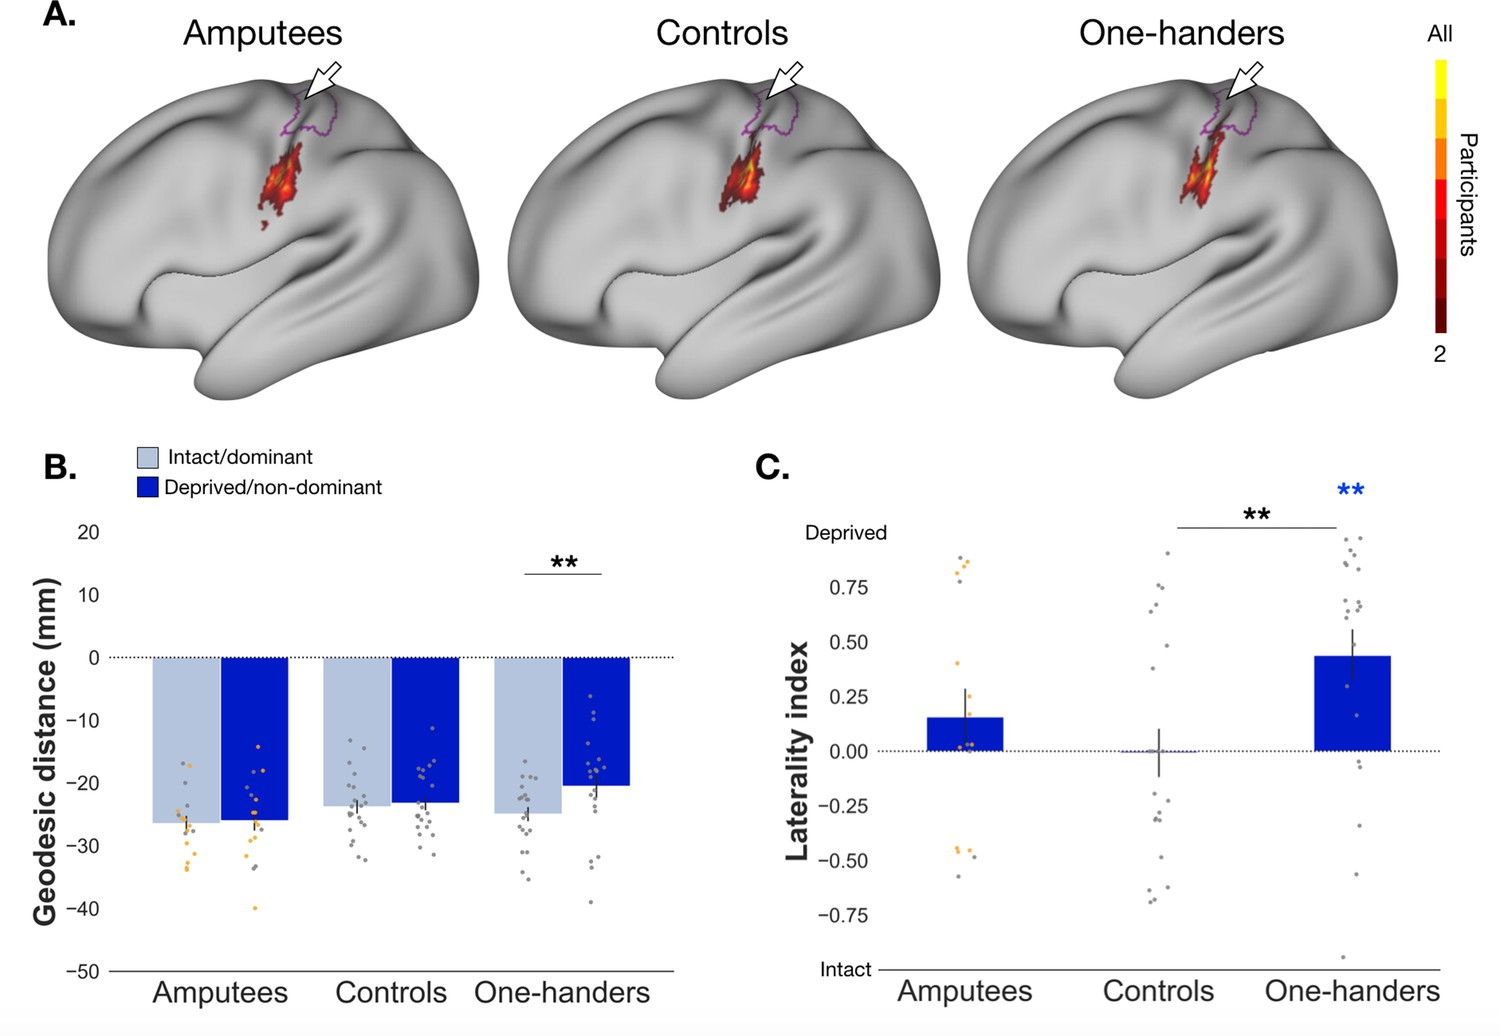
Characterisation of lip (re)mapping in the primary somatosensory cortex.
(A) Group-level consistency map for the lips clusters resulting from the individual winner-takes-all maps in the S1 ROI (defined by combining the hand and face areas). The colour gradient represents participant agreement for the lips ‘winning’ that particular voxel, relative to other face movements. Please note that the individual-participant winner-takes-all maps are minimally thresholded, and thus produce an inherently different spatial distribution relative to the group contrast maps presented in Figure 1. The hand ROI is outlined in purple and central sulcus denoted by the white arrow. (B) Cortical geodesic distances from the lip CoG to the anatomical landmark (~1 cm lateral to the hand knob) are plotted for amputees (n=17), controls (n=22), and one-handers (n=21). Distances in the intact/dominant hemisphere are plotted in light blue, and distances in the deprived/non-dominant hemisphere are plotted in darker blue (in amputees and one-handers/controls, respectively). Positive distances indicate the lips CoG is located medial to the anatomical landmark, and negative distances indicate the lips CoG is located lateral to that landmark. The anatomical landmark itself equates to a geodesic distance of zero. For main effects of comparison between amputees and one-handers versus controls, see Figure 2—source data 1–2. (C) Laterality indices for the proportion of surface area coverage of the lips in the hand ROI for all groups (amputees, controls and one-handers). Positive values indicate greater surface area coverage in the deprived/non-dominant hemisphere relative to the intact/dominant hemisphere (in amputees and one-handers/controls, respectively), and negative values reflect greater surface area coverage in the intact/dominant hemisphere relative to the deprived/non-dominant hemisphere. Standard error bars and all individual data-points are plotted in grey and uncorrected for brain size. Amputees with PLP (yes/no) are plotted in orange. ** p<0.01; coloured asterisk’s indicate values are significantly different from zero.
-
Figure 2—source data 1
Main effects and interaction for comparison of geodesic distances between amputees and controls for the lips.
- https://cdn.elifesciences.org/articles/76158/elife-76158-fig2-data1-v2.docx
-
Figure 2—source data 2
Main effects and interaction for comparison of geodesic distances of the lips between one-handers and controls.
- https://cdn.elifesciences.org/articles/76158/elife-76158-fig2-data2-v2.docx
-
Figure 2—source data 3
Raw data for cortical geodesic distances of the lips for amputees, controls, and one-handers.
- https://cdn.elifesciences.org/articles/76158/elife-76158-fig2-data3-v2.xlsx
-
Figure 2—source data 4
Raw data for laterality indices of the lips for amputees, controls, and one-handers.
- https://cdn.elifesciences.org/articles/76158/elife-76158-fig2-data4-v2.xlsx
Figure 3
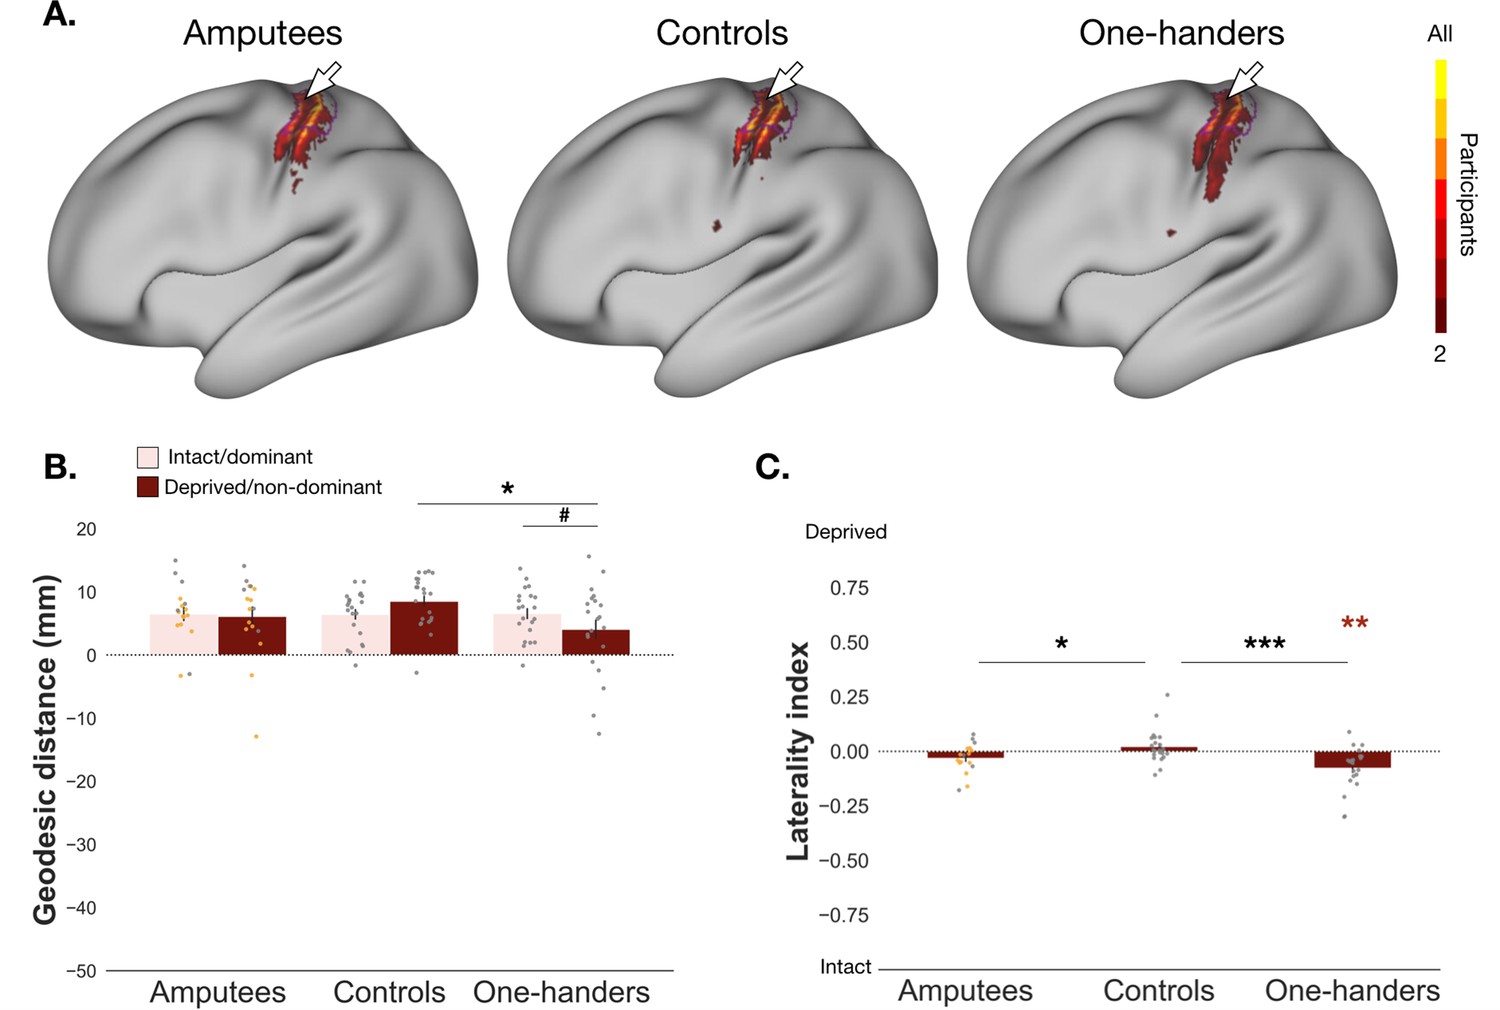
Characterisation of forehead (re)mapping in the primary somatosensory cortex.
All annotations are as in Figure 2. For main effects of cortical geodesic distance comparison between amputees and one-handers versus controls, see Figure 3—source data 1–2. Distances in the intact/dominant hemisphere are plotted in pink and deprived/non-dominant hemisphere in red. (B) # p<0.05; * p<0.025 (corrected alpha); (C) * p<0.05; ** p<0.01; *** p<0.001; coloured asterisk’s indicate values are significantly different from zero.
-
Figure 3—source data 1
Main effects and interaction for comparison of geodesic distances between amputees and controls for the forehead.
- https://cdn.elifesciences.org/articles/76158/elife-76158-fig3-data1-v2.docx
-
Figure 3—source data 2
Main effects and interaction for comparison of geodesic distances between one-handers and controls for the forehead.
- https://cdn.elifesciences.org/articles/76158/elife-76158-fig3-data2-v2.docx
-
Figure 3—source data 3
Raw data for cortical geodesic distances of the forehead for amputees, controls, and one-handers.
- https://cdn.elifesciences.org/articles/76158/elife-76158-fig3-data3-v2.xlsx
-
Figure 3—source data 4
Raw data for laterality indices of the forehead for amputees, controls, and one-handers.
- https://cdn.elifesciences.org/articles/76158/elife-76158-fig3-data4-v2.xlsx
Figure 4

Characterisation of tongue (re)mapping in the primary somatosensory cortex.
Distances in the intact hemisphere are plotted in light green and distances in the deprived hemisphere in dark green. For main effects of cortical geodesic distance comparison between amputees and one-handers versus controls, see Figure 4—source data 1–2. (B) * p<0.025 (corrected alpha); *** p<0.001; (C) # p<0.1; * p<0.05; coloured asterisk’s indicate values are significantly different from zero. All other annotations are as in Figure 2.
-
Figure 4—source data 1
Main effects and interaction for comparison of geodesic distances between amputees and controls for the tongue.
- https://cdn.elifesciences.org/articles/76158/elife-76158-fig4-data1-v2.docx
-
Figure 4—source data 2
Main effects and interaction for comparison of geodesic distances between one-handers and controls for the tongue.
- https://cdn.elifesciences.org/articles/76158/elife-76158-fig4-data2-v2.docx
-
Figure 4—source data 3
Raw data for cortical geodesic distances of the tongue for amputees, controls, and one-handers.
- https://cdn.elifesciences.org/articles/76158/elife-76158-fig4-data3-v2.xlsx
-
Figure 4—source data 4
Raw data for laterality indices of the tongue for amputees, controls, and one-handers.
- https://cdn.elifesciences.org/articles/76158/elife-76158-fig4-data4-v2.xlsx
Figure 5 with 2 supplements
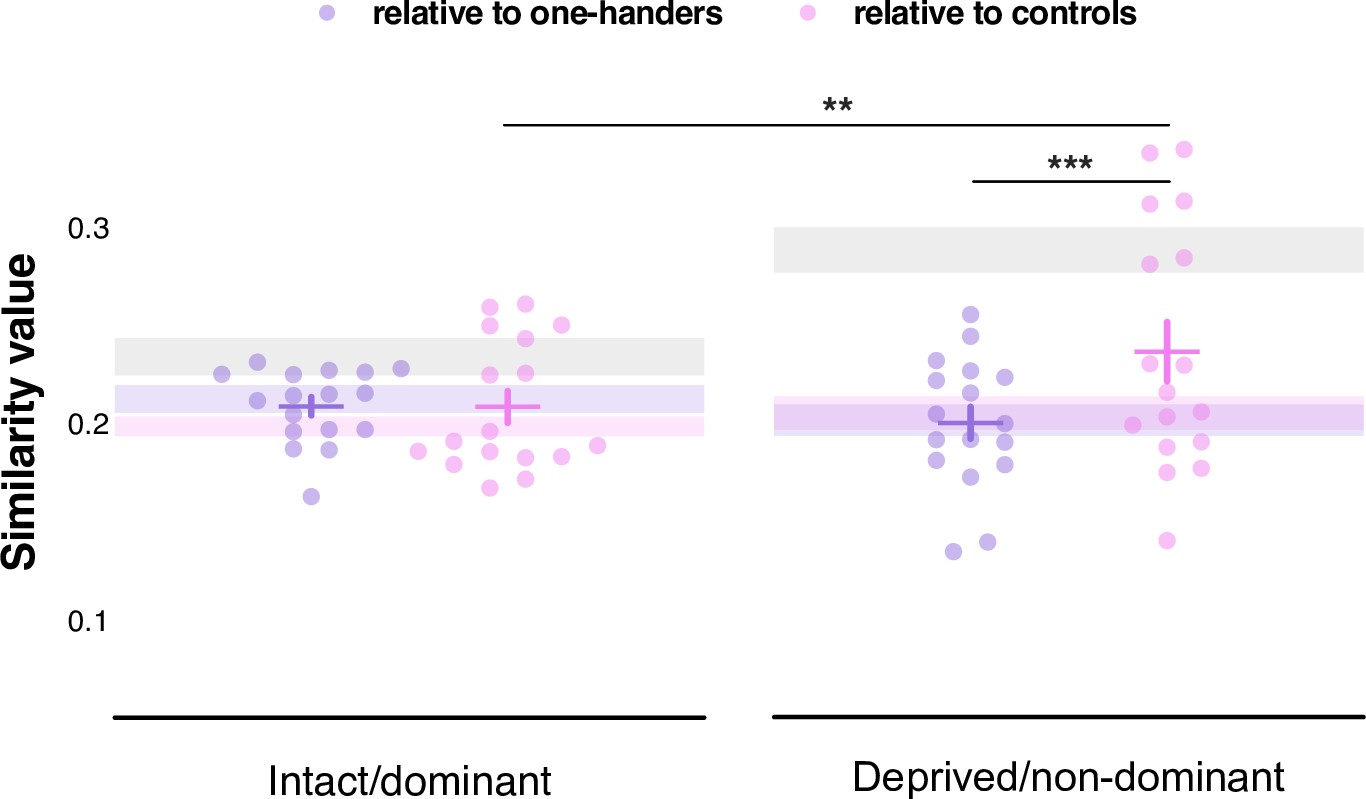
Jaccard similarity analysis comparing the winner-takes-all maps of amputees to the maps of controls and one-handers respectively.
Similarity values indicate greater (towards 1) or reduced (towards 0) similarity between amputees’ winner-takes-all maps (n=17) and those of controls (n=22; pink dots) or one-handers (n=21; purple dots), respectively. Results indicated significantly increased similarity to controls in the deprived hemisphere compared to one-handers’ maps in the deprived hemisphere or to controls’ maps in the intact hemisphere. For main effects and interaction, see Figure 5—source data 1. Means are plotted by the crosses, with standard error of the mean plotted along with individual data points. ** p<0.01, *** p<0.001. For reference, the intervals corresponding to the average intra-group similarities (+/-standard error) are represented by bands in the background (controls in grey, amputees in pink, and one-handers in purple). See Figure 5—figure supplements 1–2 for follow-up Jaccard analyses.
-
Figure 5—source data 1
Results from the linear mixed model comparing Jaccard similarity values of amputees’ maps relative to the ones of one-handers and controls respectively.
- https://cdn.elifesciences.org/articles/76158/elife-76158-fig5-data1-v2.docx
-
Figure 5—source data 2
Jaccard similarity values of amputees’ maps relative to the ones of one-handers and controls, respectively.
- https://cdn.elifesciences.org/articles/76158/elife-76158-fig5-data2-v2.xlsx
Figure 5—figure supplement 1
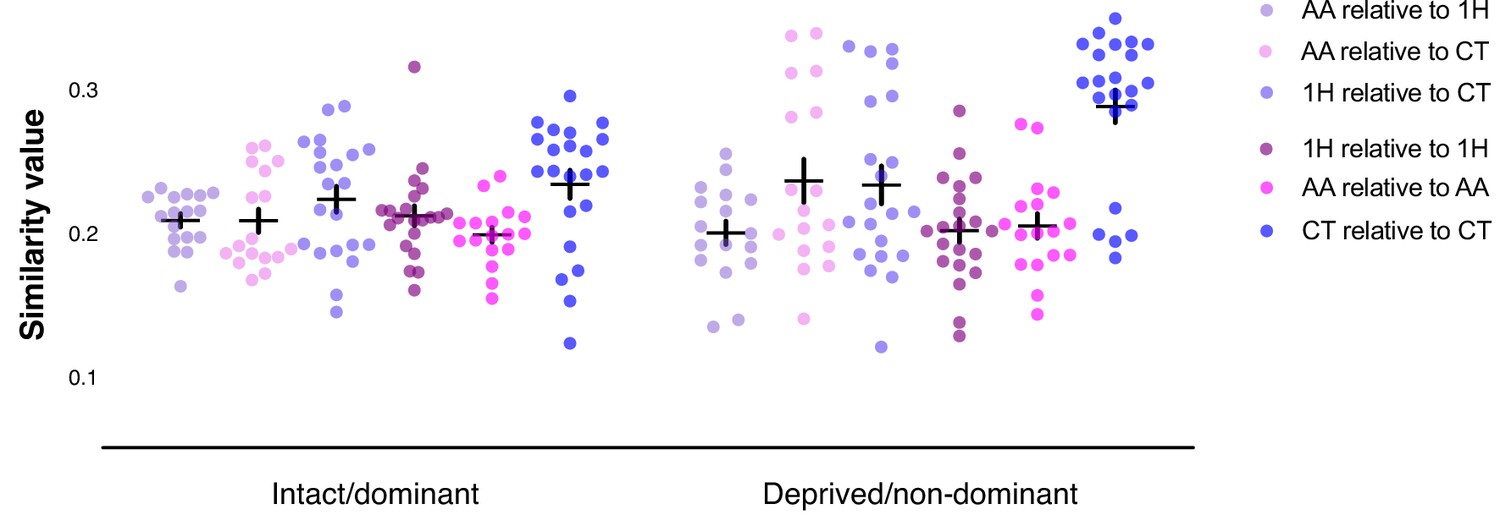
Jaccard similarity analysis comparing winner-takes-all maps both within- and across-groups.
All annotations are as in Figure 5. Each colour corresponds either to an inter-group comparison (lighter colours) or to an intra-group comparison (darker colours). See the legend for group comparisons.
Figure 5—figure supplement 2
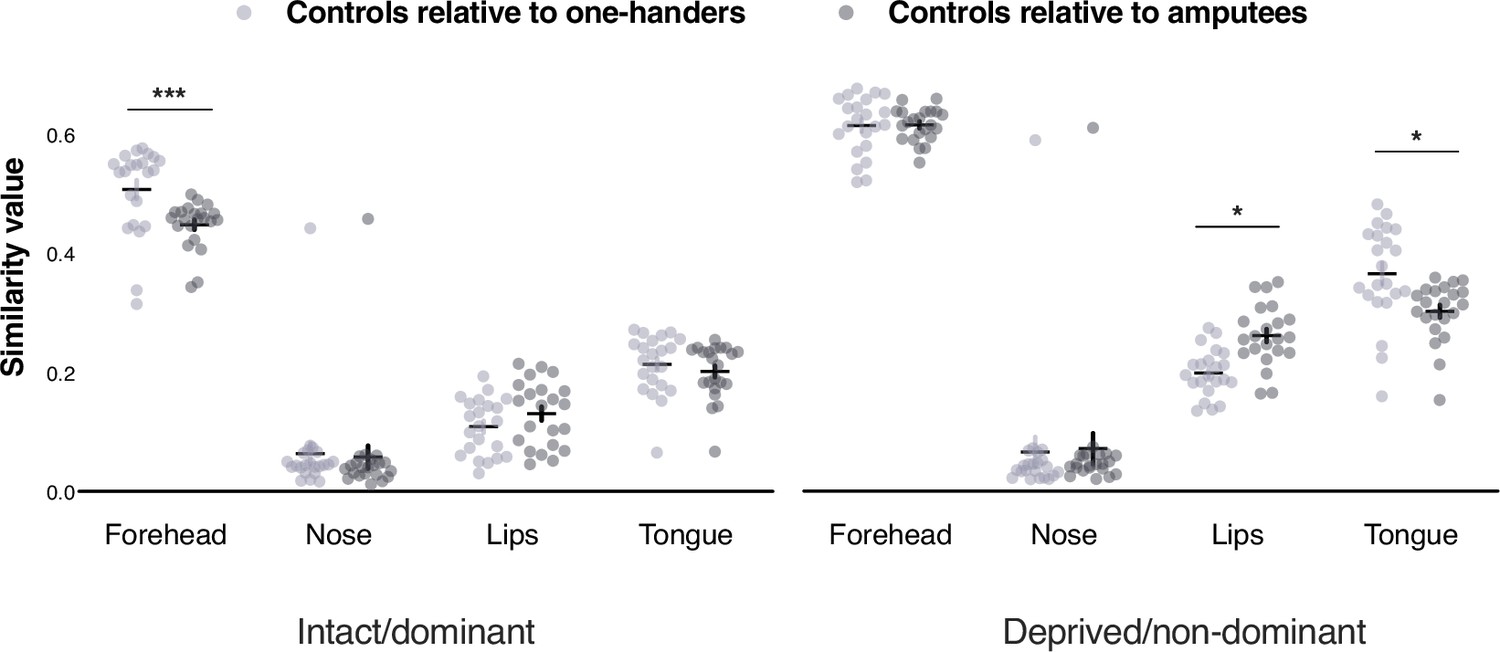
Jaccard similarity analysis comparing the winner-takes-all maps of controls to amputees and one-handers respectively.
All annotations are as in Figure 5. Similarity values indicate greater (towards 1) or reduced (towards 0) similarity between controls’ winner-takes-all maps (n=22) and those of one-handers (n=21; light grey dots) or amputees (n=17; dark grey dots) respectively. * p<0.006 (corrected alpha), *** p<0.001. Note that similar results were obtained (if anything stronger) when excluding the outlier (for the nose).
Figure 6 with 1 supplement
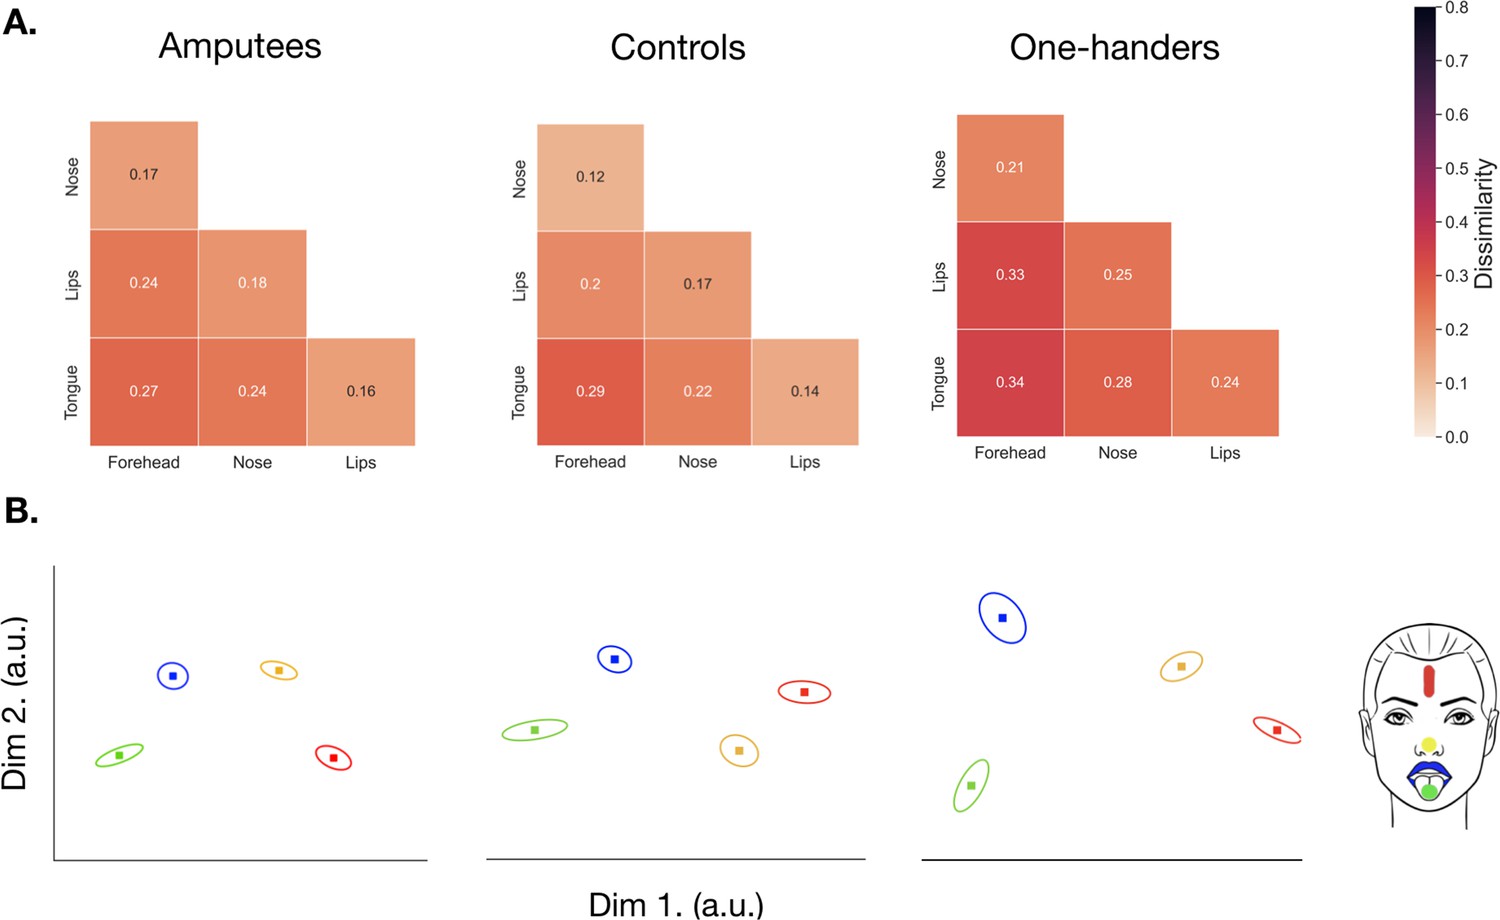
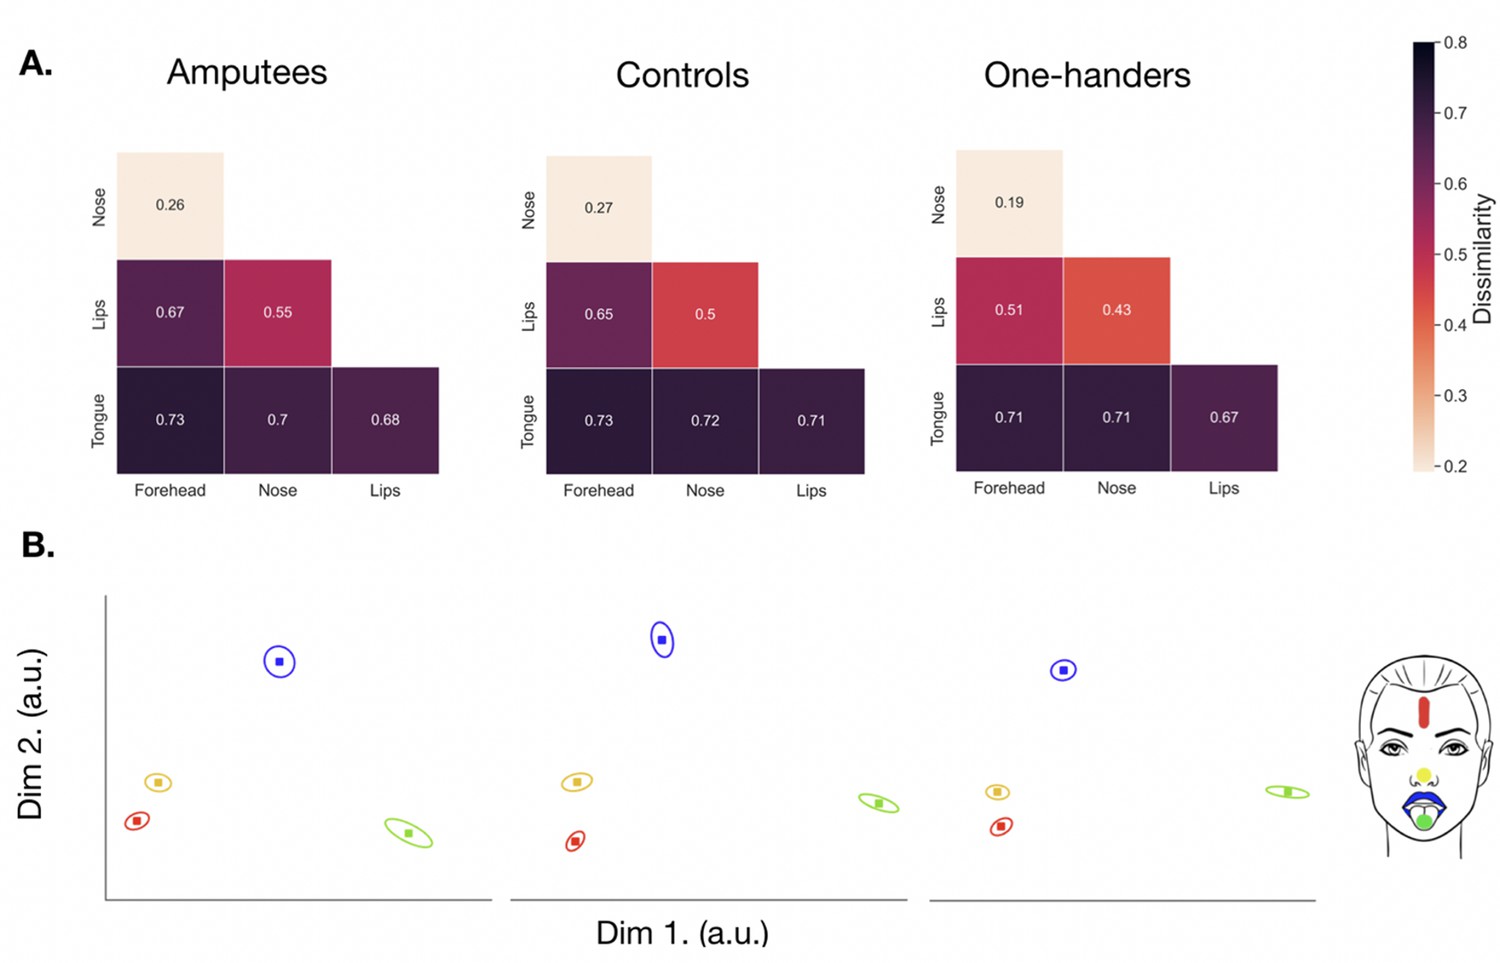
Representational Similarity Analysis (RSA) in the deprived/non-dominant hand area across all groups.
(A) Representational Dissimilarity Matrices (RDMs) for amputees (n=17), controls (n=22), and one-handers (n=21). Greater dissimilarity between activity patterns for the chosen pairwise comparison indicates more information for that facial part within the hand area. Smaller dissimilarity values of facial activity patterns indicate a reduced ability to discriminate between the chosen movements in the hand area. (B) Multi-dimensional scaling plots for each group, which projects the RDM distances into a lower dimensional space. Here, the distances between each marker reflects the dissimilarity, with more similar activity patterns represented closer together, and more distinct activity patterns positioned further away. Forehead movements are plotted in red, with the nose in yellow, lips blue and tongue green, and the standard error is plotted around each data point. Please note, a different scale was used compared to the face ROI (Figure 7). For main effects and interaction for face-face pairwise distances in hand ROI see Figure 6—source data 1. For a similar analysis in M1 see Figure 6—figure supplement 1 and Figure 6—source data 2.
-
Figure 6—source data 1
Results from the linear mixed model used to explore differences in face-face pairwise distances in the hand ROI for amputees, one-handers, and controls.
- https://cdn.elifesciences.org/articles/76158/elife-76158-fig6-data1-v2.docx
-
Figure 6—source data 2
Results from the linear mixed model used to explore differences in face-face pairwise distances in the M1 hand ROI for amputees, one-handers, and controls.
- https://cdn.elifesciences.org/articles/76158/elife-76158-fig6-data2-v2.docx
-
Figure 6—source data 3
Multivariate distances for face-face pairs in the hand region-of-interest for amputees, one-handers, and controls.
- https://cdn.elifesciences.org/articles/76158/elife-76158-fig6-data3-v2.xlsx
-
Figure 6—source data 4
Multivariate distances for face-face pairs in the hand region-of-interest for amputees, one-handers, and controls in M1.
- https://cdn.elifesciences.org/articles/76158/elife-76158-fig6-data4-v2.xlsx
Figure 6—figure supplement 1
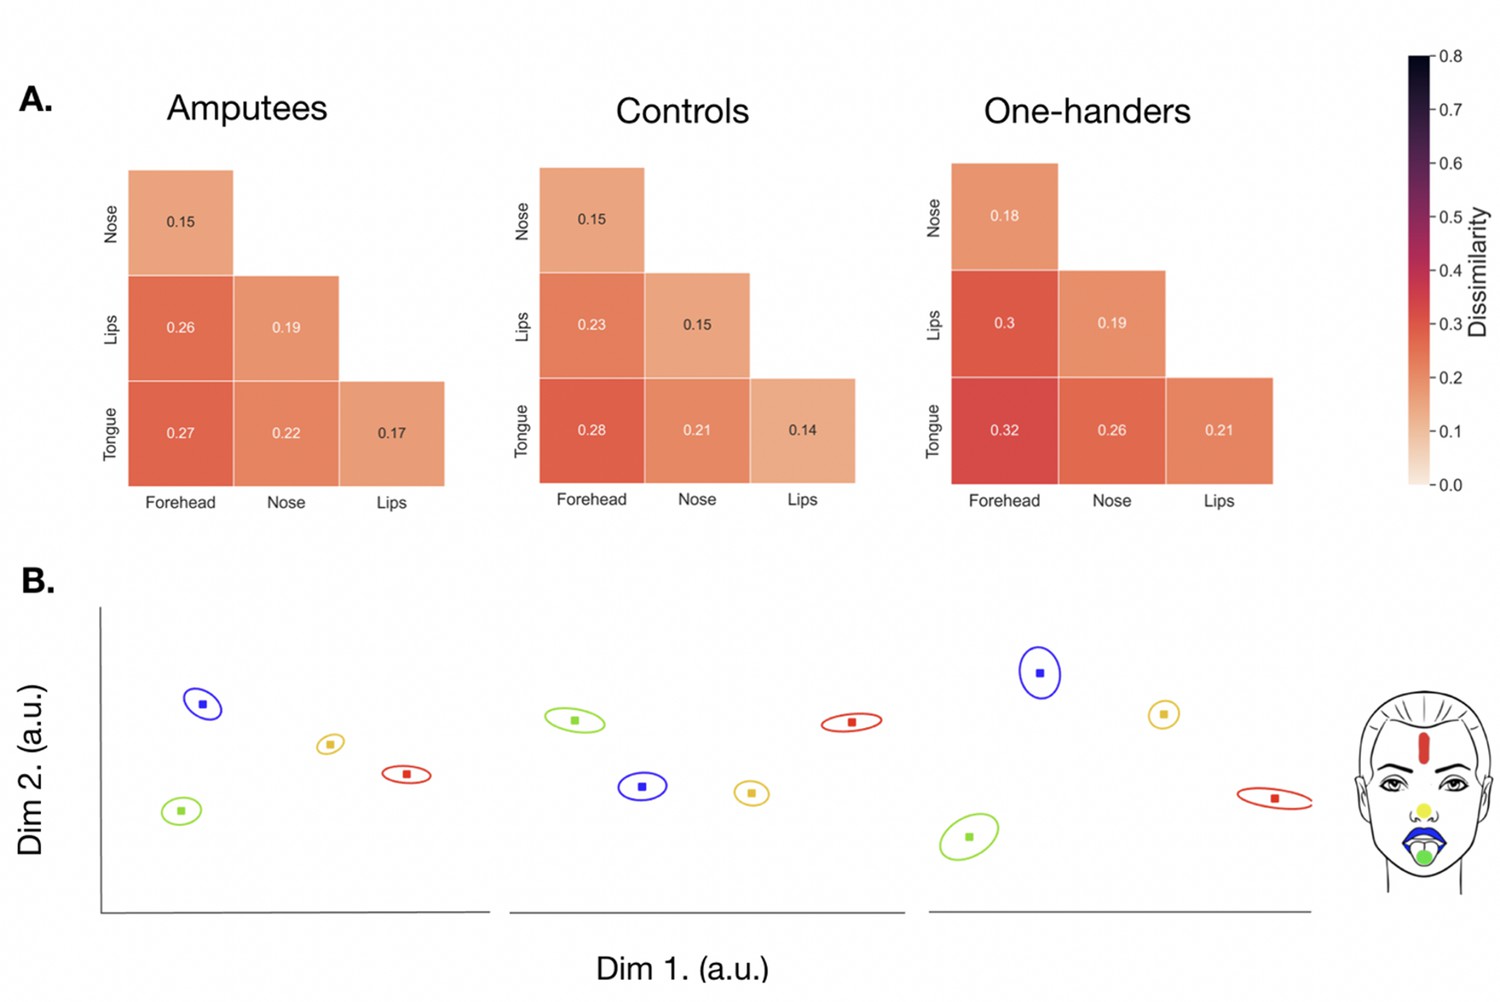
Representational Similarity Analysis (RSA) in the primary motor cortices deprived/non-dominant hand area across all groups.
(A) Representational Dissimilarity Matrices (RDMs) for amputees (n=17), controls (n=22), and one-handers (n=21). Results are similar to that in S1 (group x hemisphere interaction: F(2,627.0)=7.553, p<0.001), with significantly greater dissimilarity between facial-part representations in the deprived hemisphere of amputees (M=0.214; SE = 0.0193; t(627.0)=3.9633, p<0.001) and one-handers (M=0.243; SE = 0.0170; t(627.0)=3.8525, p<0.001), when compared to their respective intact hemisphere (amputees: M=0.157; SE = 0.0193; one-handers: M=0.193; SE = 0.0170; corrected alpha = 0.0125; uncorrected p-values reported). When comparing to controls non-dominant hemisphere (M=0.192; SE = 0.0163), we did not find any significant differences in both one-handers (t(77.4)=2.1656, p=0.033) and amputees (t(75.9)=0.8371, p=0.405). (B) Multi-dimensional scaling plots for each group, which projects the RDM distances into a lower dimensional space. All annotations are as denoted in Figure 6B.
Figure 7 with 1 supplement
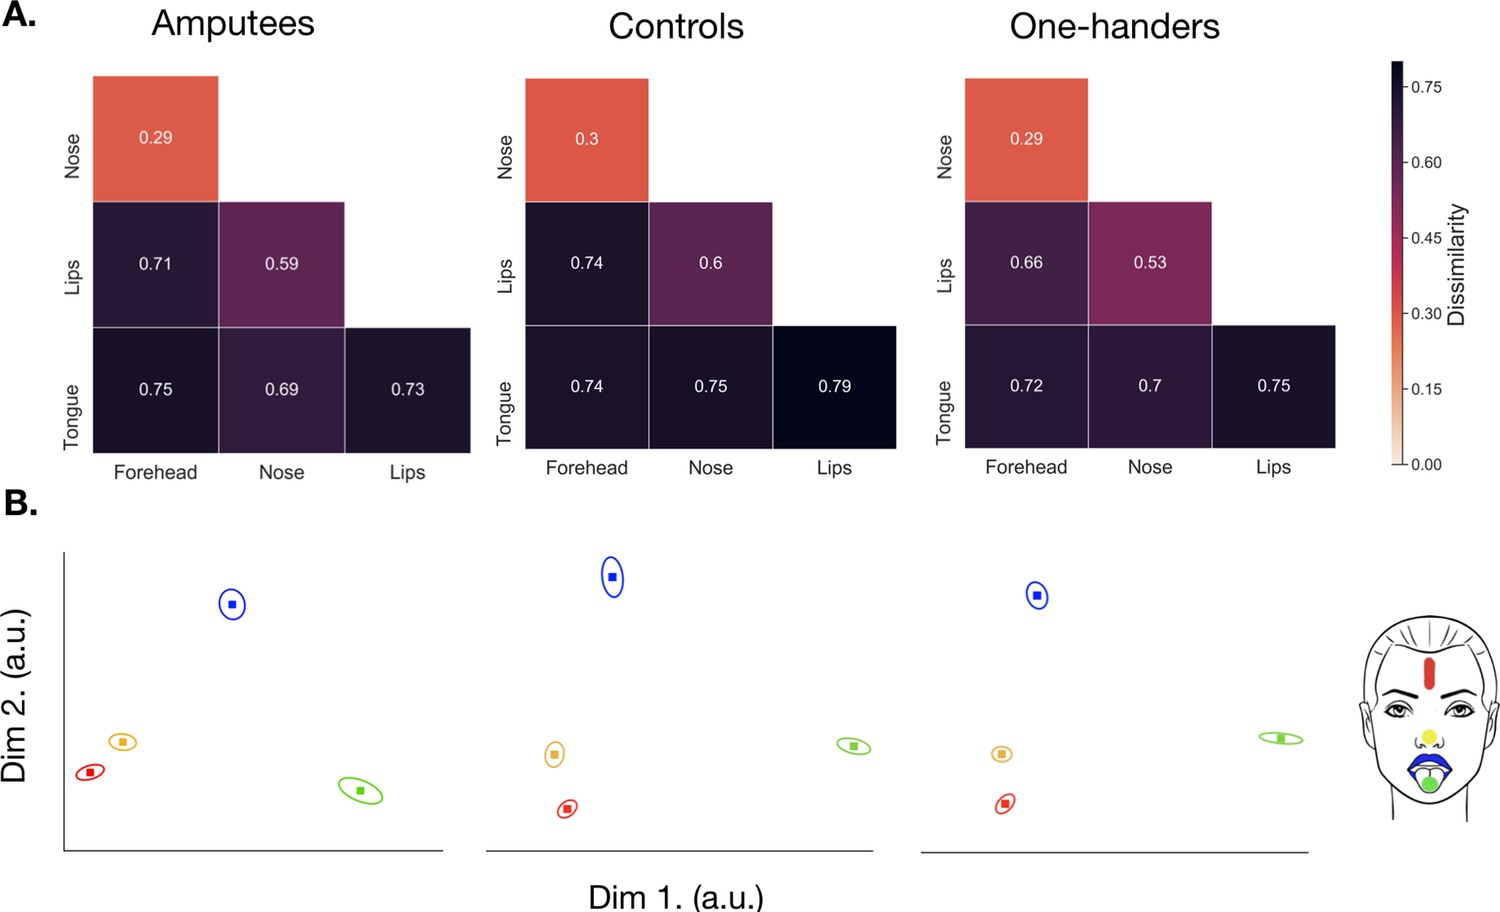
Representational Similarity Analysis (RSA) in the deprived/non-dominant face area across all groups.
All annotations are as in Figure 6. For main effects and interaction for face-face pairwise distances in face ROI see Figure 7—source data 1. For a similar analysis in M1 see Figure 7—figure supplement 1 and Figure 7—source data 2.
-
Figure 7—source data 1
Results from the linear mixed model used to explore differences in face-face pairwise distances in the face ROI for amputees, one-handers, and controls.
- https://cdn.elifesciences.org/articles/76158/elife-76158-fig7-data1-v2.docx
-
Figure 7—source data 2
Results from the linear mixed model used to explore differences in face-face pairwise distances in the M1 face ROI for amputees, one-handers, and controls.
- https://cdn.elifesciences.org/articles/76158/elife-76158-fig7-data2-v2.docx
-
Figure 7—source data 3
Multivariate distances for face-face pairs in the face region-of-interest for amputees, one-handers, and controls.
- https://cdn.elifesciences.org/articles/76158/elife-76158-fig7-data3-v2.xlsx
-
Figure 7—source data 4
Multivariate distances for face-face pairs in the face region-of-interest for amputees, one-handers and controls in M1.
- https://cdn.elifesciences.org/articles/76158/elife-76158-fig7-data4-v2.xlsx
Figure 7—figure supplement 1
Representational Similarity Analysis (RSA) in the primary motor cortices deprived/non-dominant face area across all groups.
(A) Representational Dissimilarity Matrices (RDMs) for amputees (n=17), controls (n=22) and one-handers (n=21). Results are similar to that in S1 with a non-significant group x hemisphere x face-face interaction (F(10,627.0)=0.2969, p=0.982; controlled for age). However, we did find a significant group x hemisphere interaction (F(2,627.0)=4.3429, p=0.013), arising from lower facial information content in the intact (M=0.557; SE = 0.0305) compared to the deprived (M=0.597; SE = 0.0305) face ROI in amputees, but this difference did not survive our correction for multiple comparisons (t(627.0)=2.22199, p=0.027; corrected alpha = 0.0125; trend defined as p<0.025; uncorrected p-values reported). Between-hemisphere differences were non-significant when looking at the one-hander group (deprived: M=0.536; SE = 0.0268; intact: M=0.567; SE = 0.0268; t(627.0)=−1.93153, p=0.054). Non-significant differences were also found when comparing the deprived face ROI in amputees (t(67.2)=−0.00525, p=0.996) and one-handers (t(68.0)=−1.64705, p=0.104) to the controls non-dominant hemisphere (M=0.597; SE = 0.0257). We also found a significant group x face-face (F(10,627.0)=0.1934, p=0.038) interaction suggesting that the information content for each movement (regardless of hemisphere) differed across groups. This interaction arose from significantly smaller forehead-lips distances for one-handers compared to controls (t(125)=-2.625, p=0.010), but this effect did not survive correction for multiple comparisons (corrected alpha = 0.004). (B) All annotations are as denoted in Figure 7B.
Figure 8
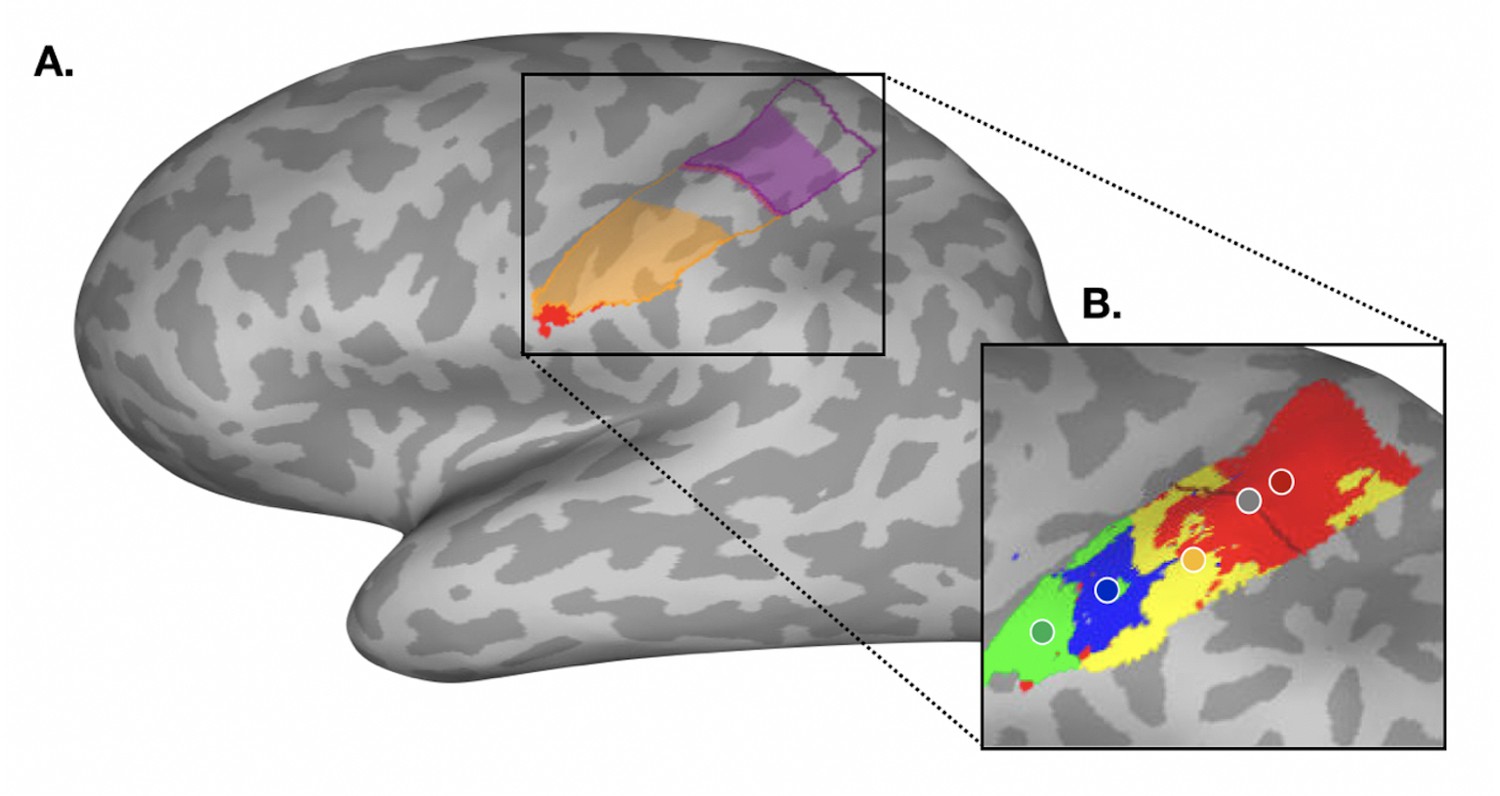
Regions of interest and winner-takes-all analysis in the primary somatosensory cortex for an example participant.
(A) Regions of interest (ROIs) used for univariate analyses are outlined in purple for the hand, and in orange for the face. Shaded areas of each region of interest denote the trimmed ROIs used for multivariate analyses. ROI overlap with the secondary somatosensory cortex (S2) is highlighted in red, and was removed from the face ROI in order to minimise somatotopic contribution from that region. (B) A typical winner-takes-all map from an example participant, with forehead activity in red, nose activity in yelllow, lip activity in blue, and tongue activity in green. The centre-of-gravity for each movement is denoted by a coloured dot outlined in white. The anatomical landmark (used as an anchor for the CoG analysis) is outlined in black, with the midpoint denoted by a grey dot. Cortical geodesic distances were measured from each facial parts CoG to the anatomical landmark midpoint.
Appendix 1—figure 1
Nose remapping in amputees and one-handers in the primary somatosensory cortex.
Distances in the intact hemisphere are plotted in light yellow and distances in the deprived hemisphere in dark yellow. All other annotations are as in Figure 2. # P<.1.
Appendix 1—figure 2
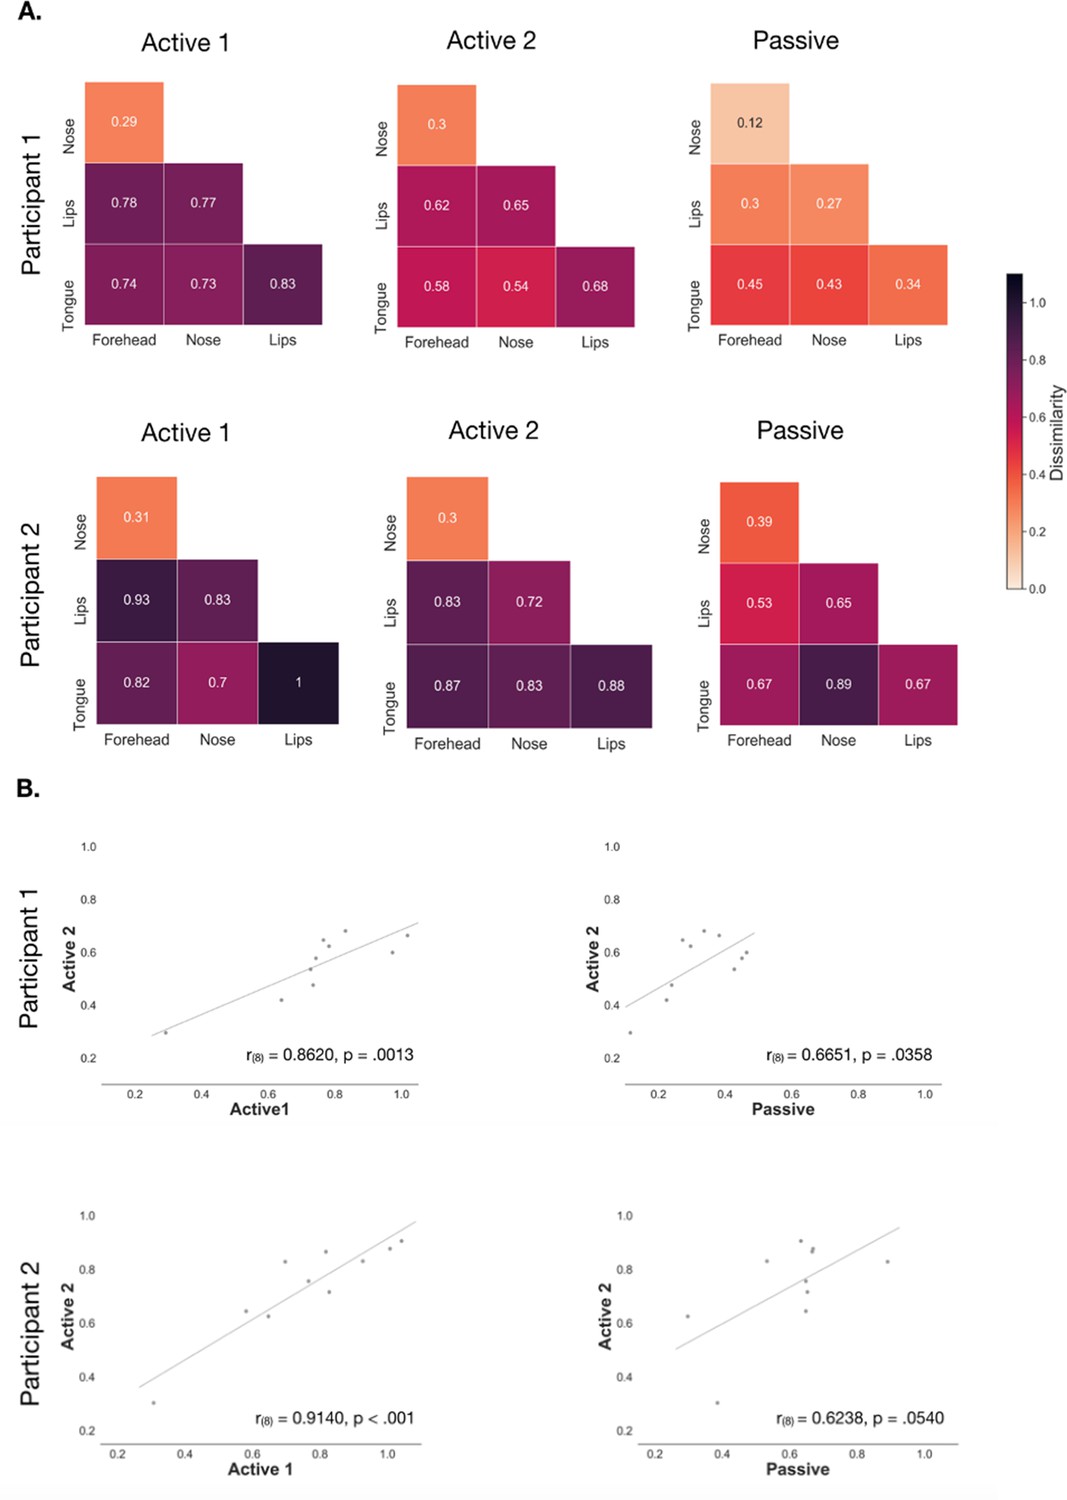
Comparison of active versus passive stimulation of the face for two control participants in the non-dominant hemisphere.
(A–B) Representational Dissimilarity Matrices (RDMs) for two control participants in the face region of interest (see Methods; Multivariate representational analysis) who completed two active motor paradigm (see Methods; Functional MRI sensorimotor task) sessions ~12 months apart and one passive session (see Supplementary Methods; Validation using passive stimulation). Greater dissimilarity between activity patterns for the pairwise comparison indicates an increased ability to discriminate between the two facial movements/stimulations in the face region, that is there is a greater amount of facial information content. Smaller dissimilarity values indicated a reduced ability to discriminate between the two face parts. (C–D) Pearson’s correlations examining the relationship between face-face and face-thumb dissimilarity values for both the first and second active motor paradigm sessions, and the second active session and passive paradigm.
Appendix 1—figure 3
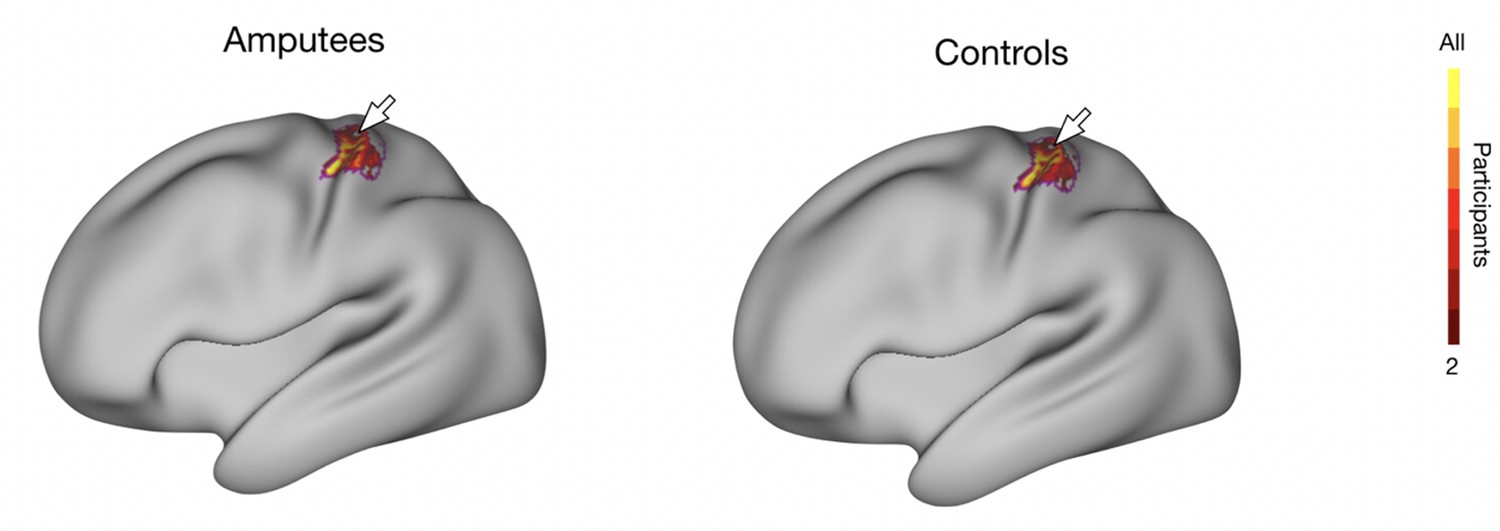
Phantom and non-dominant thumb representation in the deprived hemisphere of amputees and controls.
Group-level consistency map for the phantom/non-dominant thumb in the hand ROI for amputees (n=17) and controls (n=22). Note the percentage of surface area coverage of the deprived/non-dominant hand ROI was not significantly different for the phantom (M=69.448%; SE = 3.752%) compared to the non-dominant thumb of controls (M=63.989%; SE = 3.594%; U=225.000, p=0.292, d=0.203, BF10=0.579). The colour gradient represents participant agreement for maximally activating that particular voxel, relative to the face movements (winner-takes-all approach). The hand ROI is outlined in purple and central sulcus denoted by the white arrow.
Appendix 1—figure 4
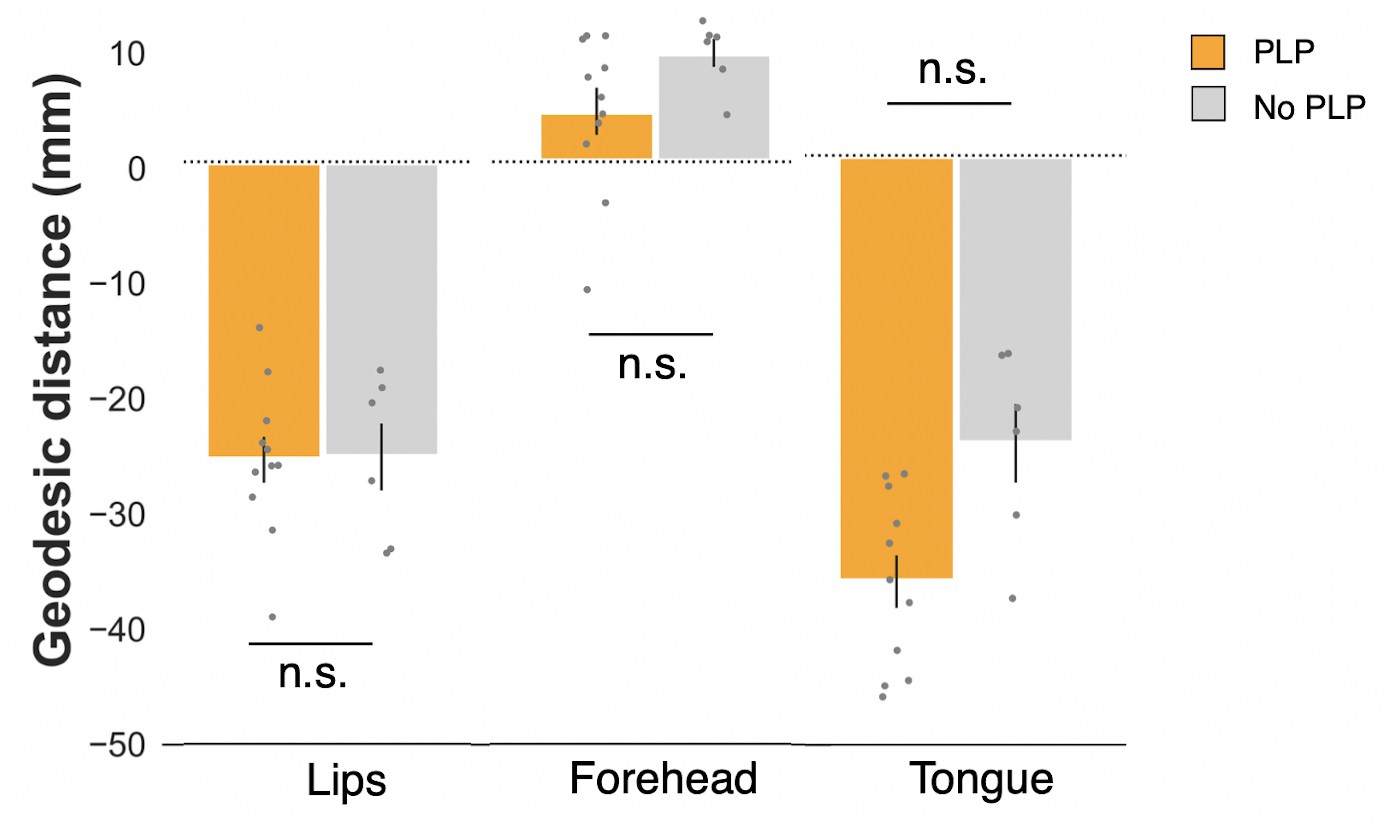
Comparison of cortical distances in the deprived hemisphere of amputees.
Cortical (geodesic) distances were compared between amputees who reported the presence of PLP (n=11; orange) and amputees without PLP (n=6; grey) using a one-tailed Mann-Whitney test. Non-significant differences were found for the lips (t(15)=-0.068, p=0.527, d=−0.035, BF10=0.414), forehead (t(15)=-1.720, p=0.947, d=−0.873, BF10=0.203) and tongue (t(15)=-3.018, p=0.996, d=−1.532, BF10=0.156). Contrary to popular theories of brain plasticity and phantom limb pain (PLP; see Introduction), these results demonstrate that individuals with PLP do not exhibit greater instances of cortical remapping in the deprived hemisphere of the tested facial parts (including both the traditional marker of plasticity – the lips – and the cortical neighbour – the forehead).
Author response image 1
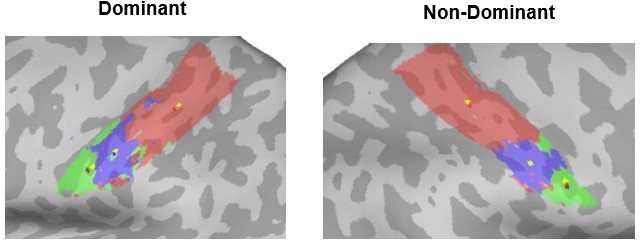
Centre-of-gravity calculation, weighted and unweighted by cluster size, in an example control participant.
Here the winner-takes-all output for each facial movement (forehead=red, lips=blue, tongue=green) was used to calculate the centre-of-gravity (CoG) at the individual-level in both the dominant (left-hand side) and non-dominant (right-hand side) hemisphere, weighted by cluster size (forehead CoG=red, lip CoG=dark blue, tongue CoG=dark red), compared to an unweighted calculation (denoted by yellow dots within each movements’ winner-takes-all output).
Author response image 2
Author response image 3
Tables
Table 1
Demographic details for amputees (A01-17) and congenital one-handers (C01-21).
Level of limb deficiency is as follows: 1=limb loss above elbow (transhumeral), 2=limb loss below elbow (transradial); L=left, R=right; PLS & PLP frequency: 0=no sensation or pain, 1=once or less per month, 2=several times per month, 3=once a week, 4=daily, 5=all the time. *PLP intensity rating was on average. PLS = phantom limb sensations; PLP = phantom limb pain.
| Participants | Age | Gender | Handedness (prior to amputation for amputees) | Affected limb | Level of limb deficiency | Years since amputation | PLS intensity | PLS frequency | Chronic PLS | PLP intensity | PLP frequency | Chronic PLP | Cause of amputation |
|---|---|---|---|---|---|---|---|---|---|---|---|---|---|
| AA01 | 60 | M | R | R | 2 | 43 | 100 | 5 | 100 | 60 | 5 | 60 | Trauma |
| AA02 | 34 | M | R | R | 1 | 3 | 50 | 2.5 | 14.6 | 70* | 2 | 17.5* | Trauma |
| AA03 | 58 | M | R | R | 1 | 33 | 90 | 5 | 90 | 100 | 1 | 20 | Trauma |
| AA04 | 59 | M | R | L | 2 | 16 | 40 | 1 | 8 | 0 | 1 | 0 | Trauma |
| AA05 | 54 | M | A | L | 1 | 36 | 100 | 5 | 100 | 80 | 4 | 40 | Trauma |
| AA06 | 47 | F | R | L | 2 | 18 | 80 | 4 | 40 | 0 | 0 | 0 | Electrocution |
| AA08 | 40 | F | R | R | 1 | 10 | 40 | 3 | 13.3 | 0 | 0 | 0 | Trauma |
| AA09 | 47 | M | R | R | 2 | 5 | 70 | 4 | 35 | 10 | 4 | 5 | Trauma |
| AA10 | 53 | M | R | L | 2 | 34 | 20 | 0 | 0 | 0 | 0 | 0 | Trauma |
| AA11 | 56 | F | L | L | 1 | 12 | 90 | 5 | 90 | 80 | 5 | 80 | Tumour |
| AA12 | 66 | M | R | R | 1 | 38 | 60 | 5 | 60 | 0 | 0 | 0 | Trauma |
| AA13 | 65 | F | L | L | 1 | 10 | 90 | 5 | 90 | 80 | 4 | 40 | Trauma |
| AA14 | 66 | M | R | L | 1 | 35 | 80 | 2 | 20 | 100 | 2 | 25 | Trauma |
| AA16 | 64 | M | R | R | 1 | 18 | 75 | 5 | 75 | 65 | 5 | 65 | Trauma |
| AA17 | 65 | M | R | R | 1 | 8 | 70 | 5 | 70 | 0 | 0 | 0 | Trauma |
| AA18 | 48 | M | R | R | 1 | 23 | 85 | 5 | 85 | 65 | 5 | 65 | Trauma |
| AA19 | 31 | M | R | L | 2 | 14 | 30 | 5 | 30 | 25 | 1 | 5 | Trauma |
| CA01 | 32 | F | R | L | 2 | ||||||||
| CA02 | 32 | F | R | L | 2 | ||||||||
| CA03 | 35 | M | R | L | 2 | ||||||||
| CA04 | 48 | M | R | L | 2 | ||||||||
| CA05 | 22 | F | L | R | 2 | ||||||||
| CA06 | 54 | F | R | L | 2 | ||||||||
| CA07 | 56 | F | L | R | 2 | ||||||||
| CA08 | 53 | M | R | L | 1 | ||||||||
| CA09 | 54 | F | R | L | 2 | ||||||||
| CA10 | 58 | M | L | R | 2 | ||||||||
| CA11 | 22 | M | R | L | 2 | ||||||||
| CA12 | 30 | F | R | L | 2 | ||||||||
| CA13 | 24 | M | L | R | 2 | ||||||||
| CA14 | 33 | F | L | R | 2 | ||||||||
| CA15 | 39 | F | L | R | 2 | ||||||||
| CA16 | 55 | F | R | L | 2 | ||||||||
| CA17 | 67 | F | L | R | 2 | ||||||||
| CA18 | 30 | F | L | R | 2 | ||||||||
| CA19 | 43 | M | R | L | 2 | ||||||||
| CA20 | 63 | M | R | L | 2 | ||||||||
| CA21 | 46 | F | R | L | 2 |
Additional files
Download links
A two-part list of links to download the article, or parts of the article, in various formats.
Downloads (link to download the article as PDF)
Open citations (links to open the citations from this article in various online reference manager services)
Cite this article (links to download the citations from this article in formats compatible with various reference manager tools)
Complex pattern of facial remapping in somatosensory cortex following congenital but not acquired hand loss
eLife 11:e76158.
https://doi.org/10.7554/eLife.76158


