The giant staphylococcal protein Embp facilitates colonization of surfaces through Velcro-like attachment to fibrillated fibronectin
- Interdisciplinary Nanoscience Center (iNANO), Aarhus University, Denmark
- Institute for Medical Microbiology, Virology and Hygiene, University Medical Centre Hamburg-Eppendorf, Germany
- Department of Chemistry, Aarhus University, Denmark
- Van ‘t Hoff Institute of Molecular Sciences, University of Amsterdam, Netherlands
- Department of Biology, Aarhus University, Denmark
Figures
Figure 1
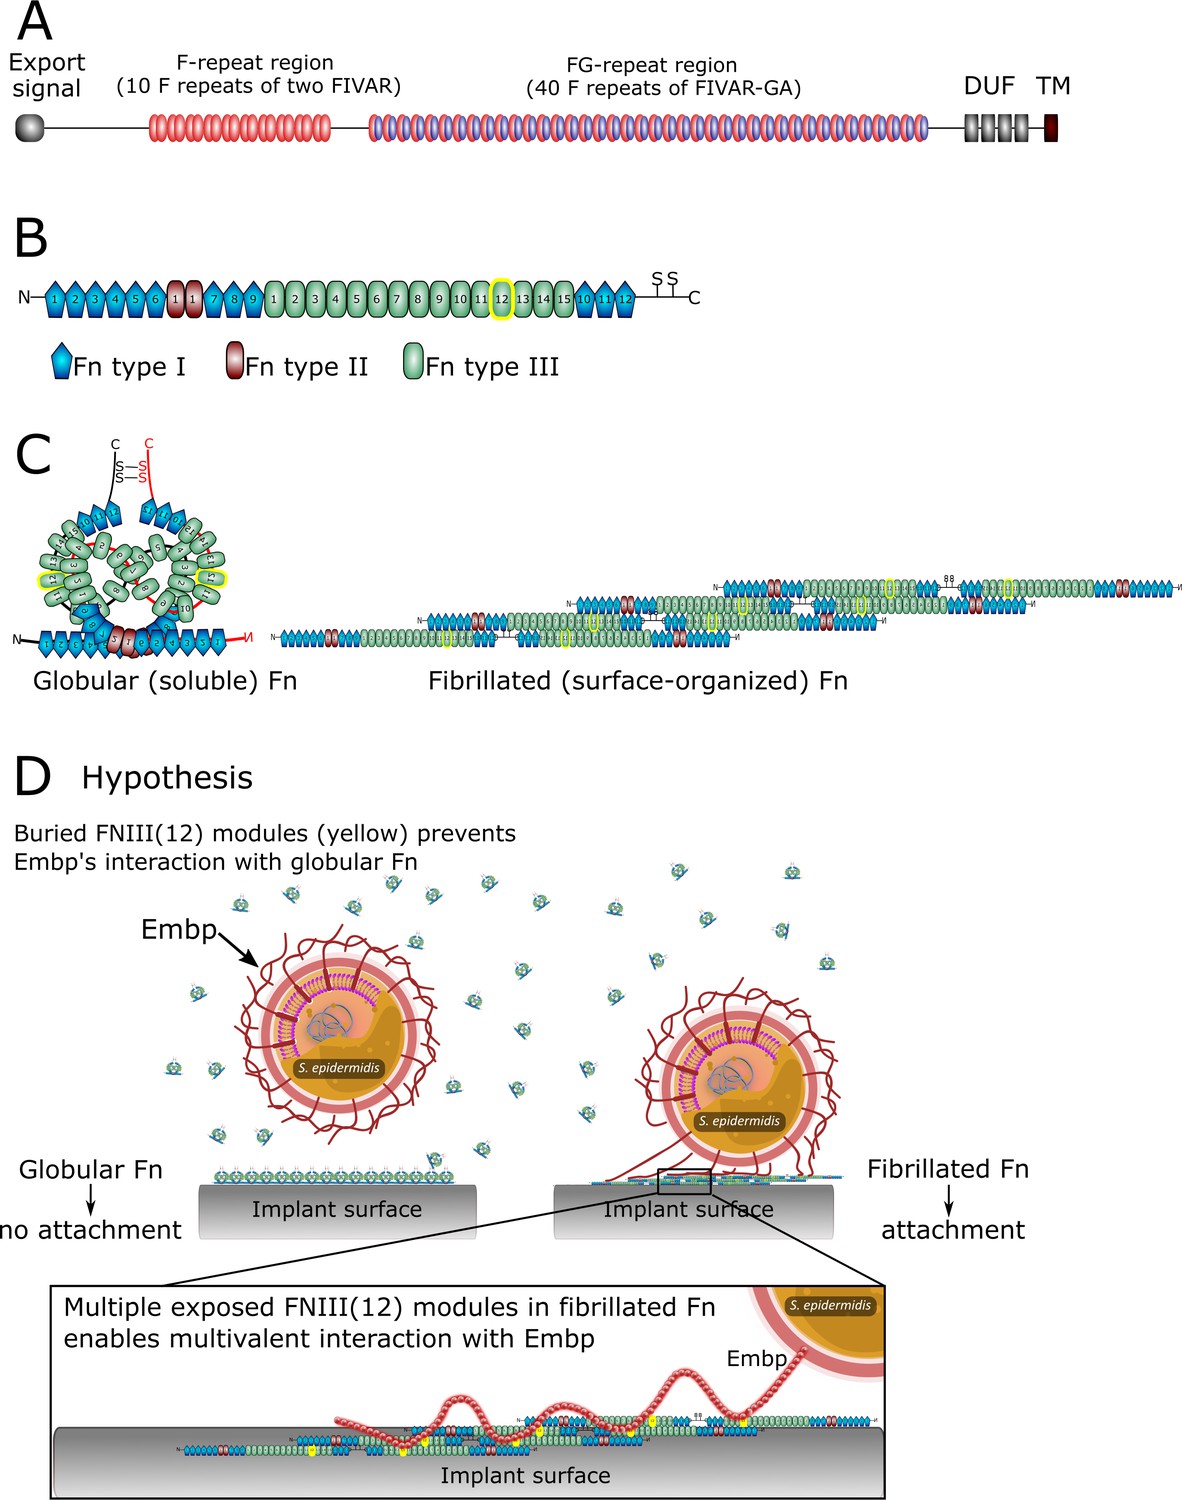
The structure of extracellular matrix-binding protein Embp (A), its ligand fibronectin (B and C), and our hypothesis of selective binding of Embp to the fibrillated form of fibronectin via a multivalent interaction (D).
(A) Embp consists of 50 fibronectin (Fn)-binding repeats (10 F-repeats and 40 FG-repeats). (B) The structure of Fn. Embp binds to FN12 of the Fn type III (highlighted in yellow). (C) Representation of globular and fibrillated Fn. Fn is a dimer held together by two disulfide brides, and interactions between FN(III)11–14 on one Fn and FN(III)1–4 on the other Fn. In fibrillated Fn, these domains are exposed. (D) Hypothesis for Embp’s interaction with Fn on surfaces and in solution. (A) has been adapted from Figure 1 in Büttner et al., 2020. (B) has been adapted from Figure 4A in Büttner et al., 2020.
Figure 2 with 1 supplement

Soluble fibronectin (Fn) does not bind to extracellular matrix-binding protein (Embp).
Interaction of soluble Fn with Staphylococcus epidermidis 1585Pxyl/tet embp overexpressing Embp or Staphylococcus carnosus TM300 expressing recombinant Embp (5F- or 9 FG-repeats) was detected by fluorescence microscopy. Staphylococcus aureus was used as positive control. Bacteria were stained with SYTO 9 (depicted as red), and Fn bound to the cell surface was detected by immunolabeling, using anti-Fn mouse IgG primary antibody, and anti-mouse IgG conjugated with Alexa Fluor 635 as secondary antibody (depicted as green). Top panel shows overlay of bacteria (red) and Fn (green). Bottom panel shows Fn only (green). Scale bar = 10 μm.
-
Figure 2—source data 1
Zip file containing original confocal laser scanning microscopy (CLSM) images for Figure 2.
- https://cdn.elifesciences.org/articles/76164/elife-76164-fig2-data1-v2.zip
Figure 2—figure supplement 1
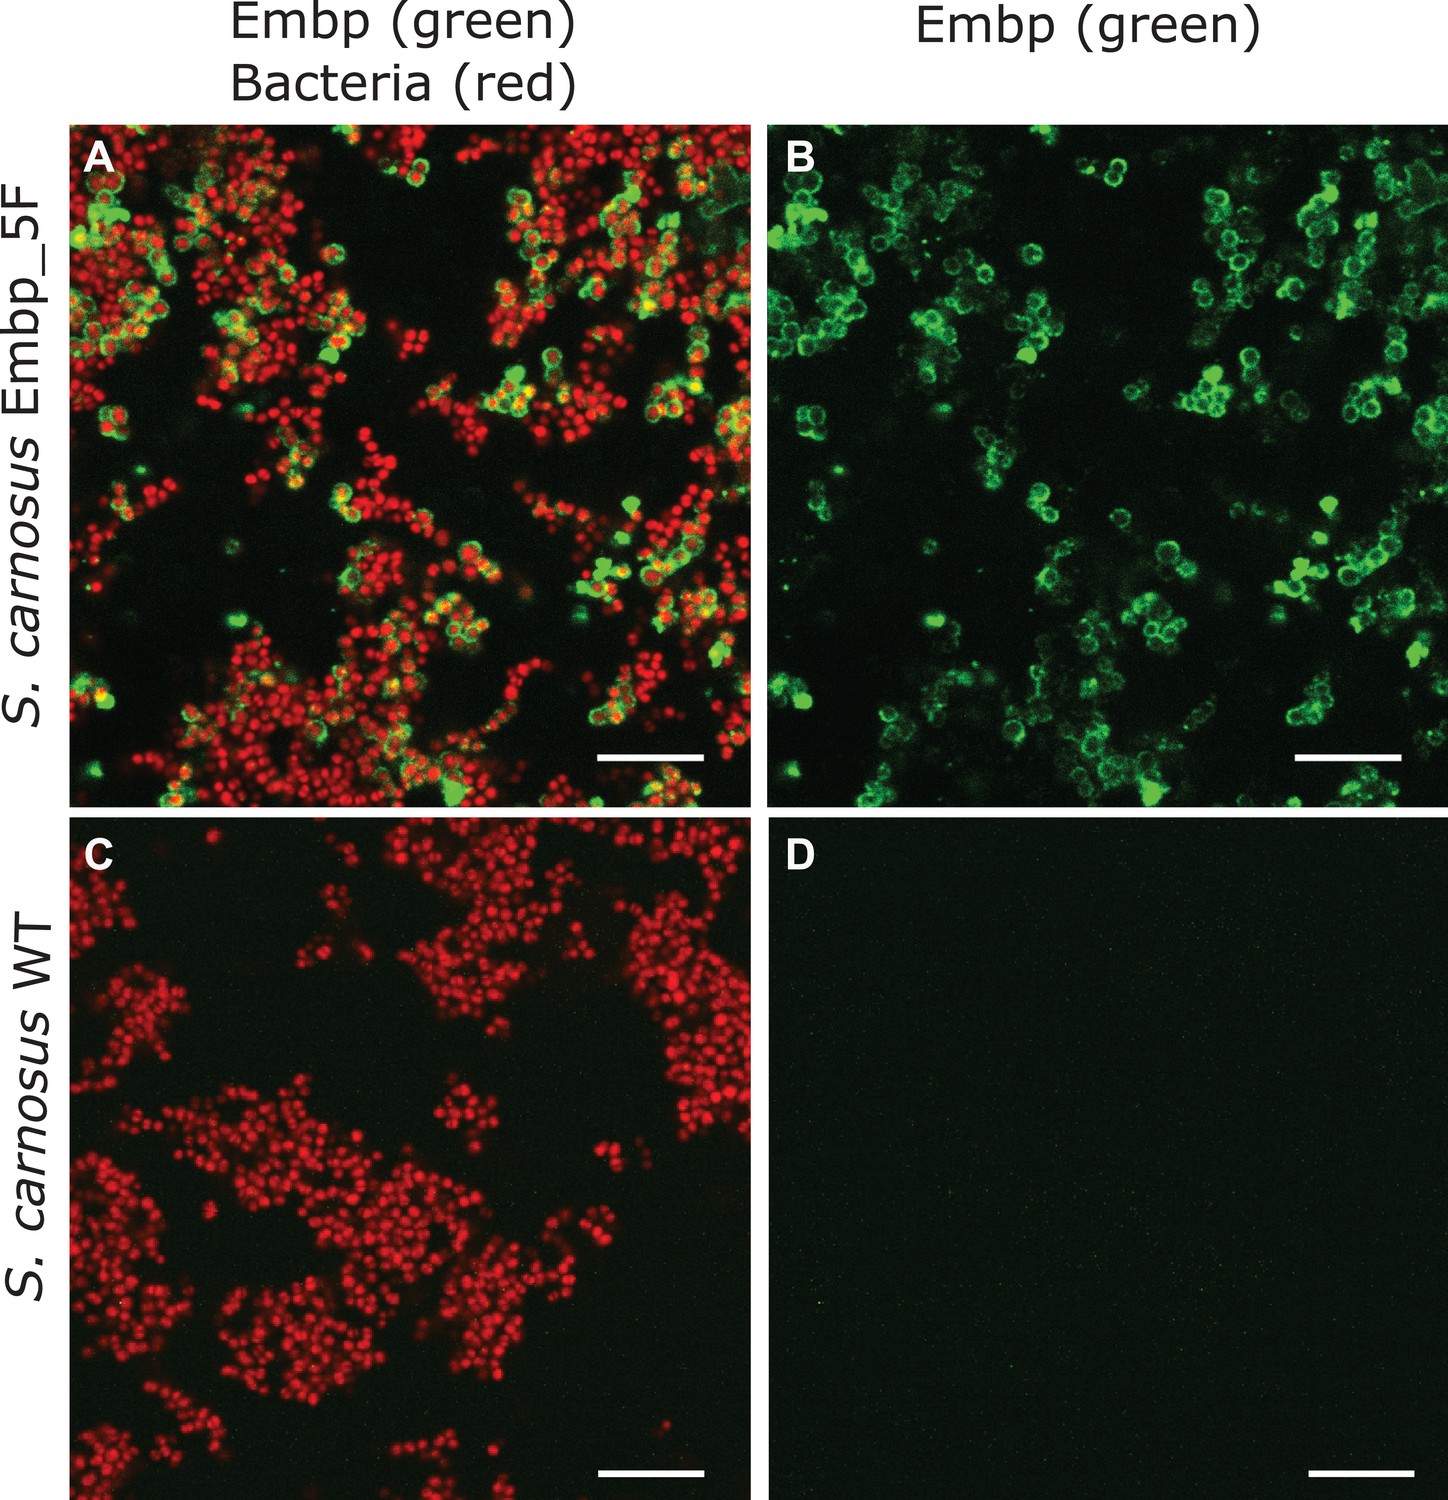
Verification of extracellular matrix-binding protein (Embp) fractions on the surface of Staphylococcus carnosus expressing 5F-repeats.
Bacteria were stained with SYTO 9 (red), and recombinant Embp was labeled with anti-Embp antibodies followed by anti-rabbit secondary IgG conjugated with Alexa Fluor 635 (green). Scale bar = 10 μm. (A) Overlay of bacteria (red) and Embp (green), (B) Embp only (green) of S. carnosus 5F. (C) Overlay of bacteria (red) and Embp (green), (D) Embp only (green) of S. carnosus wildtype (negative control).
-
Figure 2—figure supplement 1—source data 1
Zip file containing original confocal laser scanning microscopy (CLSM) images for Figure 2—figure supplement 1.
- https://cdn.elifesciences.org/articles/76164/elife-76164-fig2-figsupp1-data1-v2.zip
Figure 3 with 5 supplements
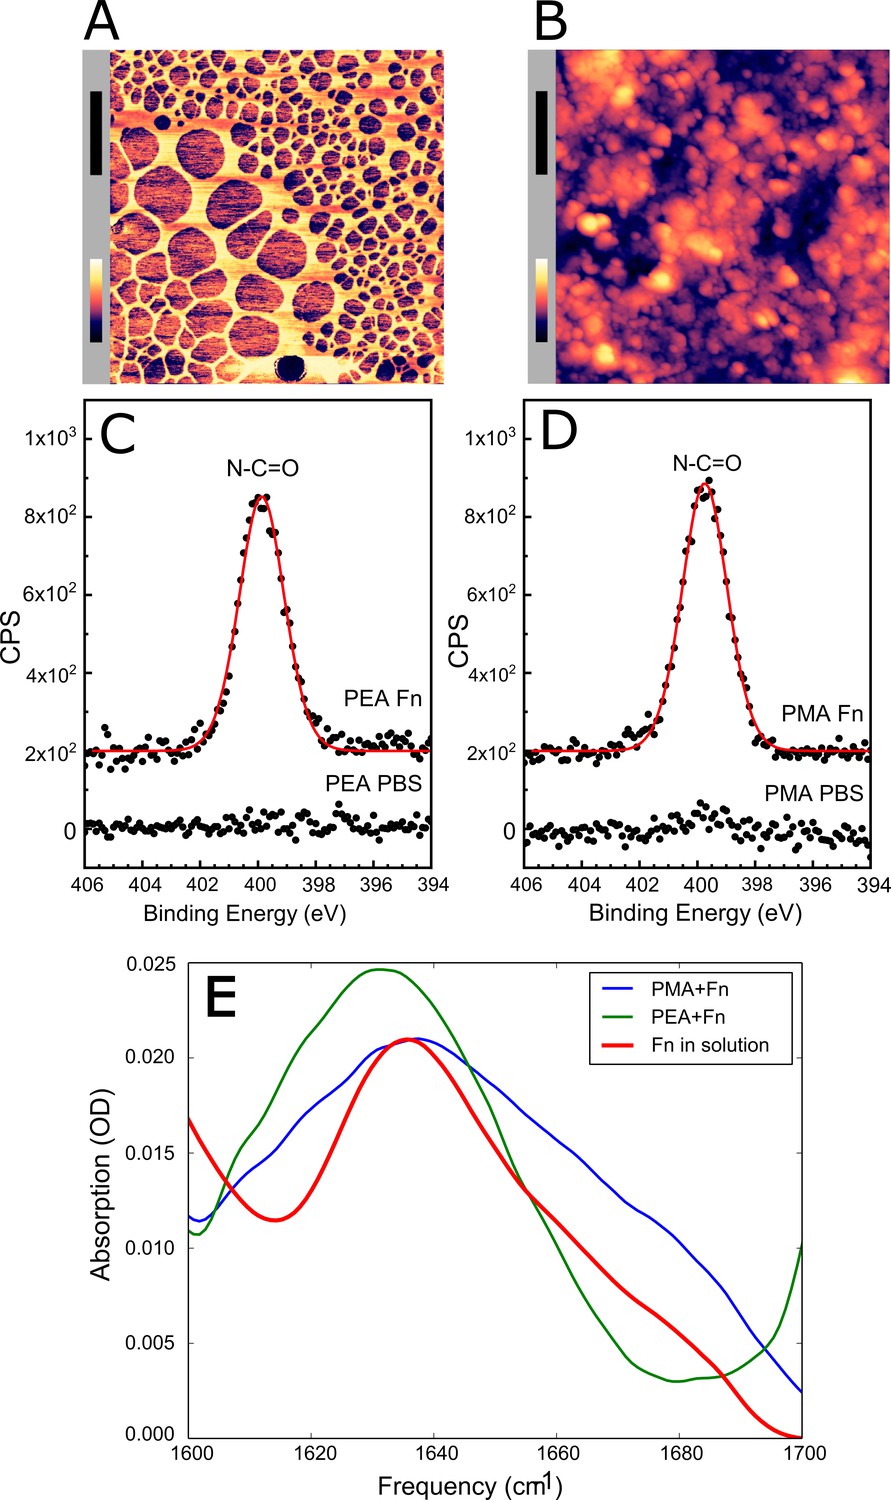
Adsorbed fibronectin (Fn) remains globular on poly(methyl acrylate) (PMA) and fibrillates on poly(ethyl acrylate) (PEA)-coated surfaces.
Atomic force microscopy (AFM) imaging shows the structure of adsorbed Fn on (A) PEA and (B) PMA (xy-scale bar (black)=500 nm, height scale bar (color)=115 nm). X-ray photoelectron spectroscopy (XPS) analysis of the samples shows similar chemical composition of Fn adsorbed to (C) PEA and (D) PMA, indicating that two polymer surfaces are both covered by Fn. (E) Fourier transform infrared (FTIR) spectral shape and intensity confirms that Fn adsorbed to PMA is similar to Fn in solution.
-
Figure 3—source data 1
Zip file containing original and processed atomic force microscopy (AFM) images for Figure 3A and B.
- https://cdn.elifesciences.org/articles/76164/elife-76164-fig3-data1-v2.zip
Figure 3—figure supplement 1
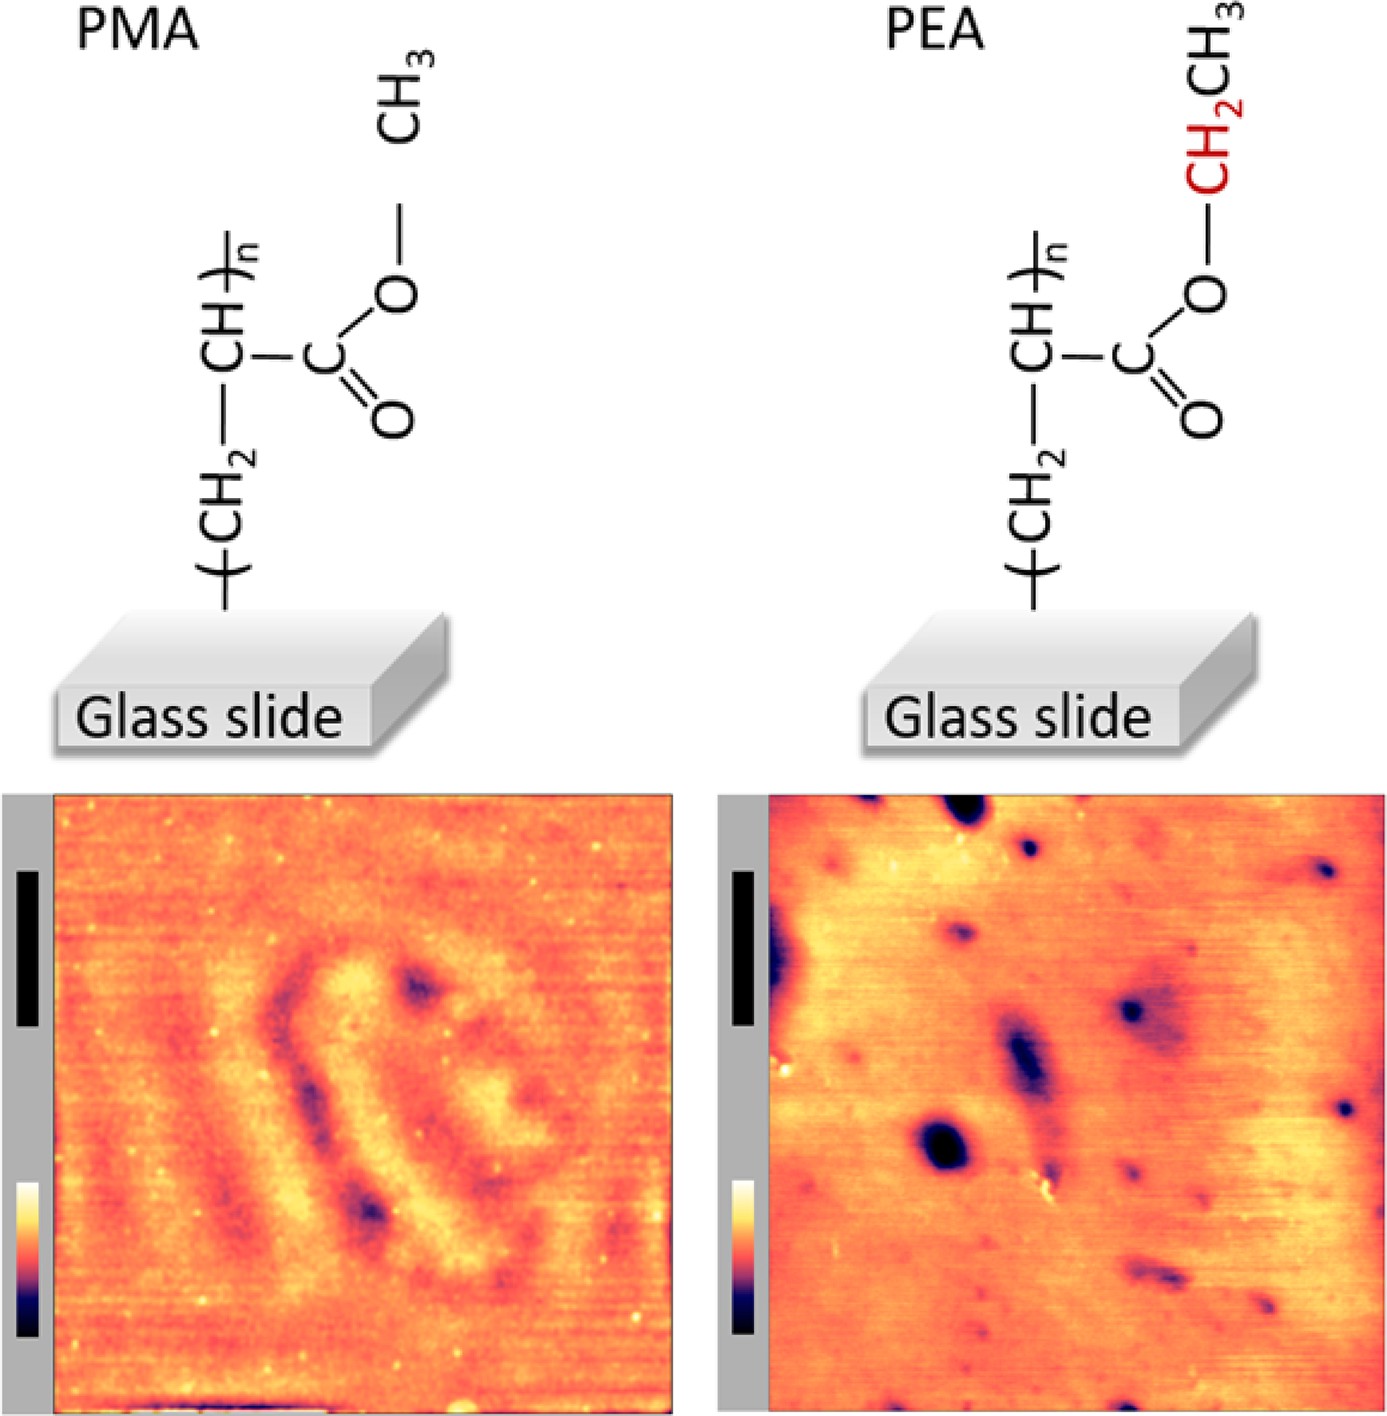
Surface topography of poly(methyl acrylate) (PMA)- and poly(ethyl acrylate) (PEA)-coated glass.
Atomic force microscopy (AFM) images (bottom panel) of PMA- and PEA-coated glass surfaces were acquired in phosphate buffered saline (PBS). The xy-scale bar (black) is 1 μm and z-scale bar (in color) is 26 nm for PMA and 16 nm for PMA.
-
Figure 3—figure supplement 1—source data 1
Zip file containing original and processed atomic force microscopy (AFM) images.
- https://cdn.elifesciences.org/articles/76164/elife-76164-fig3-figsupp1-data1-v2.zip
Figure 3—figure supplement 2
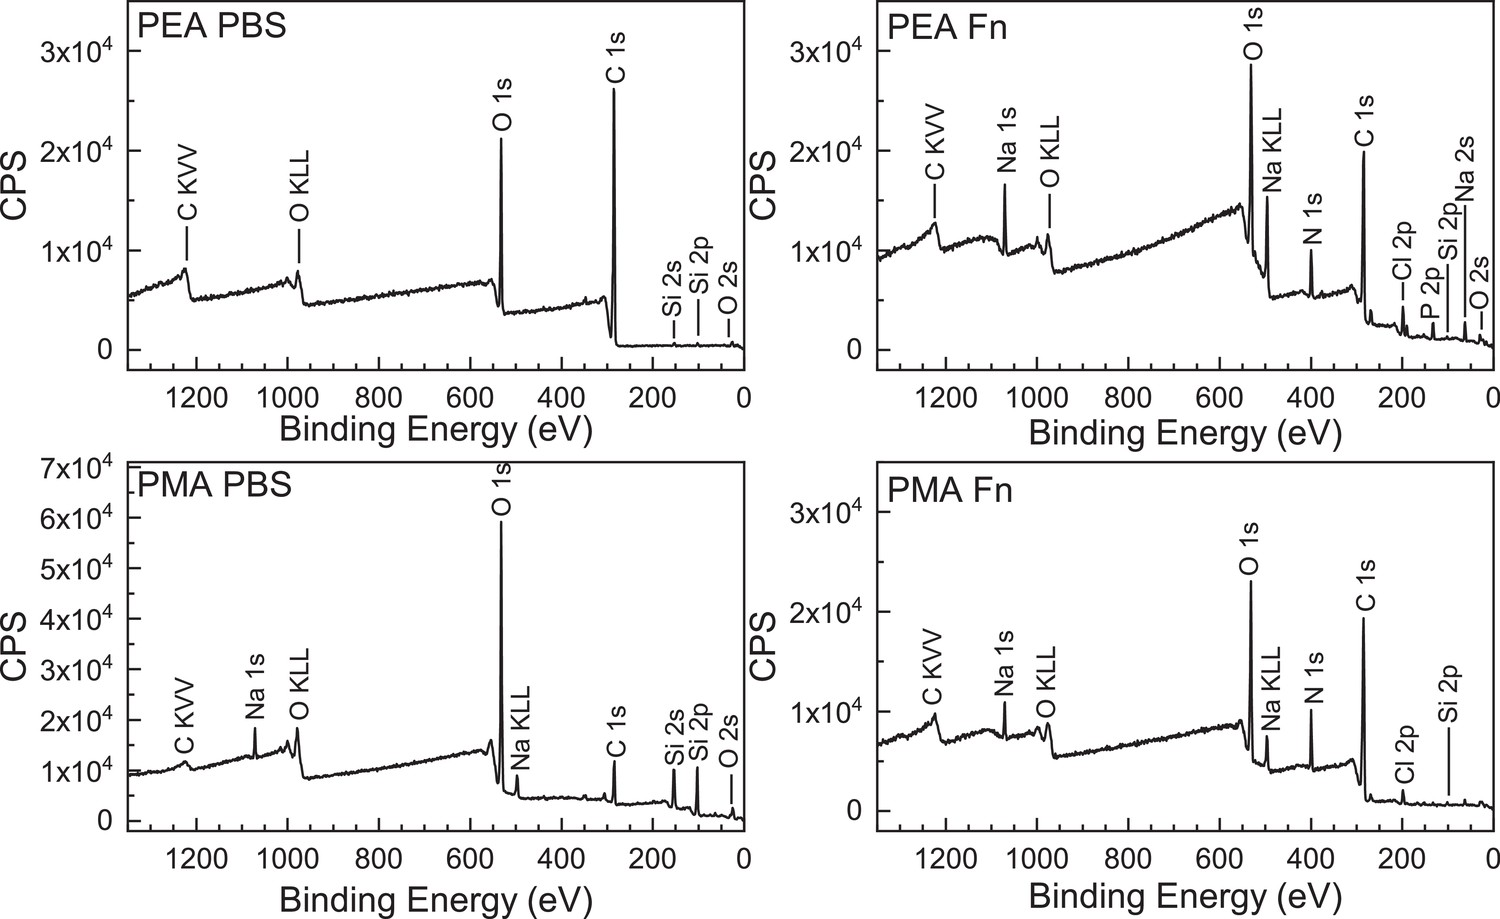
Verification of polymer coating and adsorbed fibronectin (Fn) by X-ray photoelectron spectroscopy (XPS).
XPS survey spectra of poly(ethyl acrylate) (PEA) and poly(methyl acrylate) (PMA) polymer with either phosphate buffered saline (PBS) added or fibronectin. The survey scans allow for the determination of the elements present at the sample surface.
Figure 3—figure supplement 3
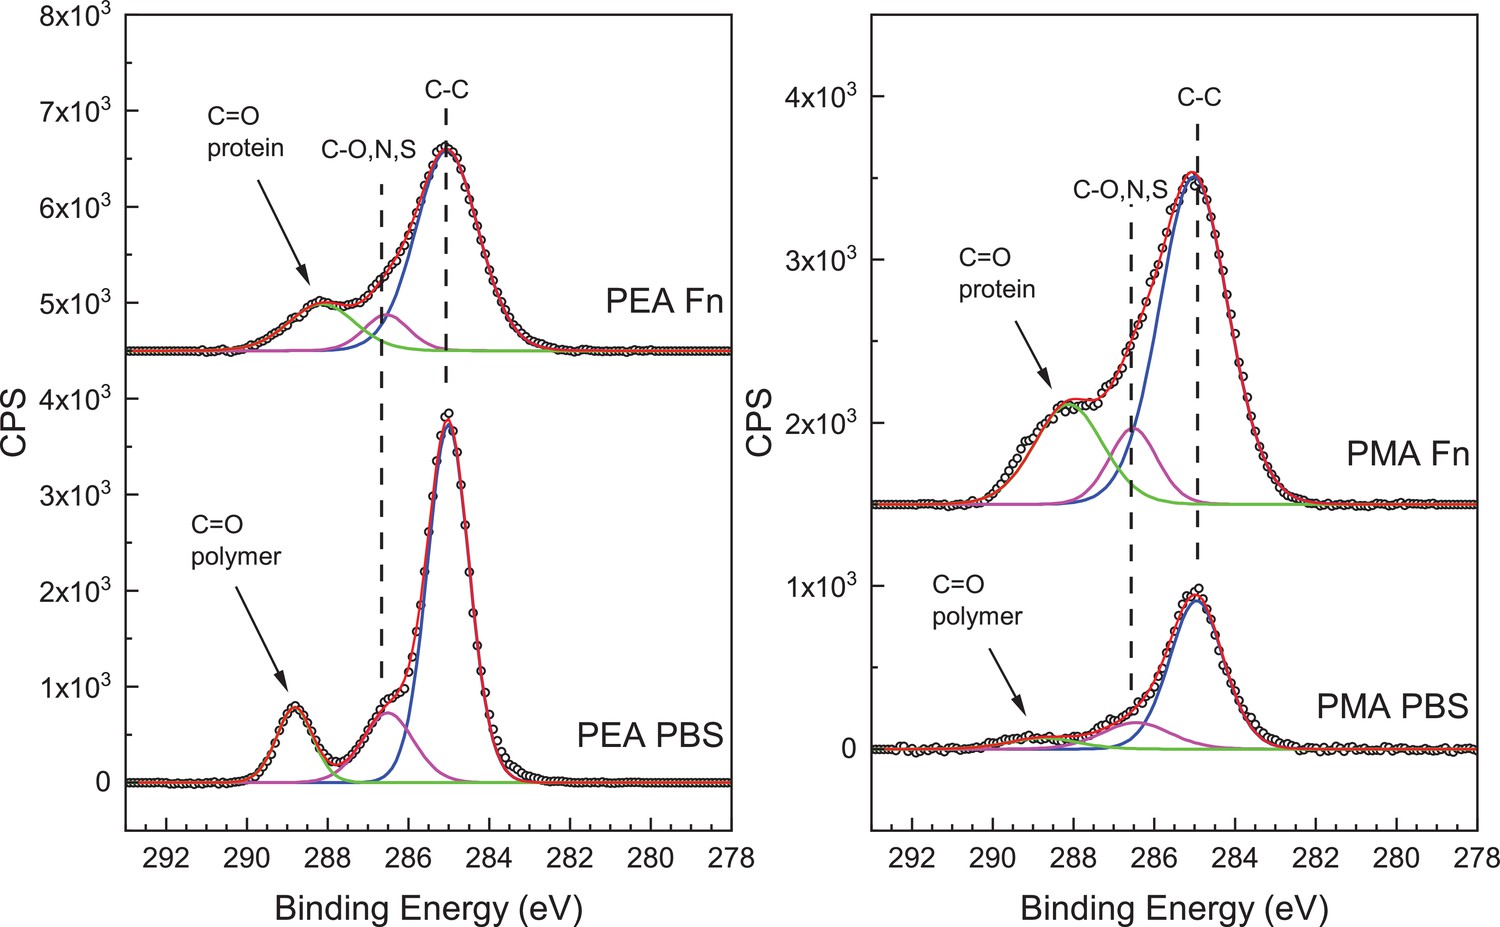
High-resolution C1s X-ray photoelectron spectroscopy (XPS) plots of peaks characteristic of protein addition on polymer surfaces.
Bottom: Spectra of only poly(ethyl acrylate) (PEA) or poly(methyl acrylate) (PMA) polymer incubated with phosphate buffered saline (PBS). Top: Spectra of PEA and PMA polymer incubated with PBS and fibronectin (Fn). The C1s high-resolution spectrum has peaks at 285.0, 286.5, 288.0, and 289.0 eV assigned to the C-C, C-O, N, or S, the C=O in a protein, and the C=O in a polymer, respectively.
Figure 3—figure supplement 4
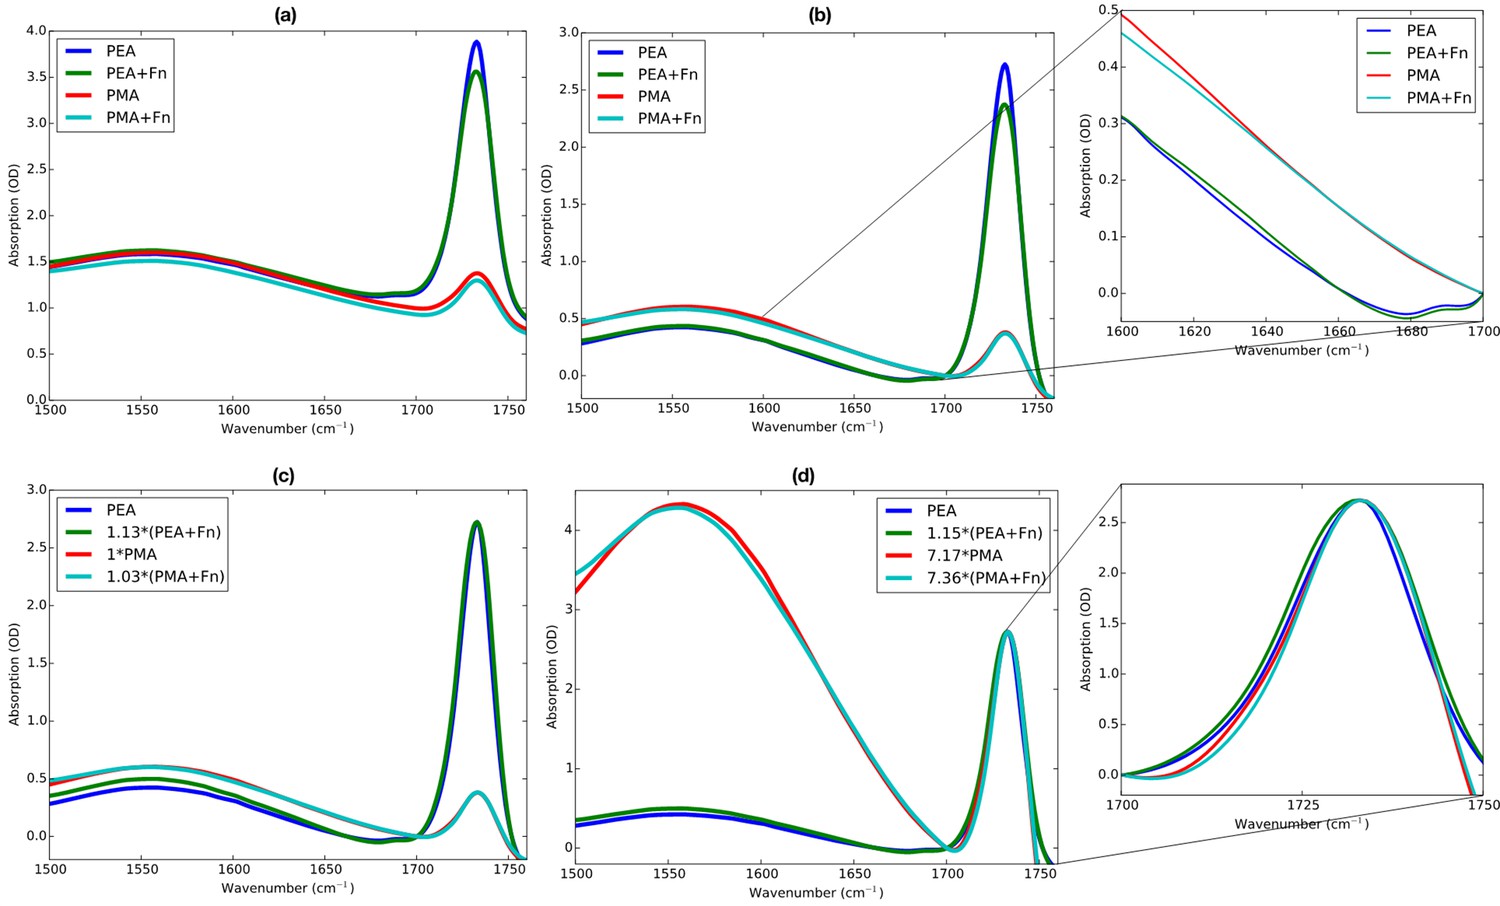
Various variants of processing of the Fourier transform infrared (FTIR) spectra, indicating the relative contributions of scattering, protein absorption, and polymer absorption.
The raw spectra show that the scattering is different for all four samples, because the spectra are offset with respect to each other. This is expected for the current sample, as the polymer layers scatter the IR light in a not fully reproducible manner. To demonstrate that the presence of protein can already be seen with minimal data processing, the spectra are vertically shifted so as to obtain 0 OD at 1700 cm–1 to show that also the sample thicknesses are not identical, as can be seen by the small intensity difference of the combination of v2 + the libration mode of D2O at 1555 cm–1. Now also the minute amount of protein absorption in the amide-I region can be appreciated (see inset), with more high-frequency absorption in the poly(methyl acrylate) (PMA) case, and more low-frequency absorption in the poly(ethyl acrylate) (PEA) case, although care must be taken with drawing direct conclusions from this as one first has to correct for the sample thicknesses (as can be seen from intensities of the 1555 cm–1 mode). Looking at the 1733 cm–1 polymer ester mode, one can now see that the incubation with fibronectin (Fn) and subsequent rinsing with d-PBS removed a small amount of polymer, reducing the polymer thickness. When overlapping the post-incubation spectra to the pre-incubation spectra on the ester peak intensity (panel c), it becomes apparent that in the PEA case, 12% of the polymer layer is lost, and in the PMA case only 3%. Finally, matching the intensity of the ester peak in all spectra to the peak intensity in the pre-incubation PEA spectrum indicates a factor ~7 between the amount of PEA and the PMA present at the samples (panel d).
Figure 3—figure supplement 5
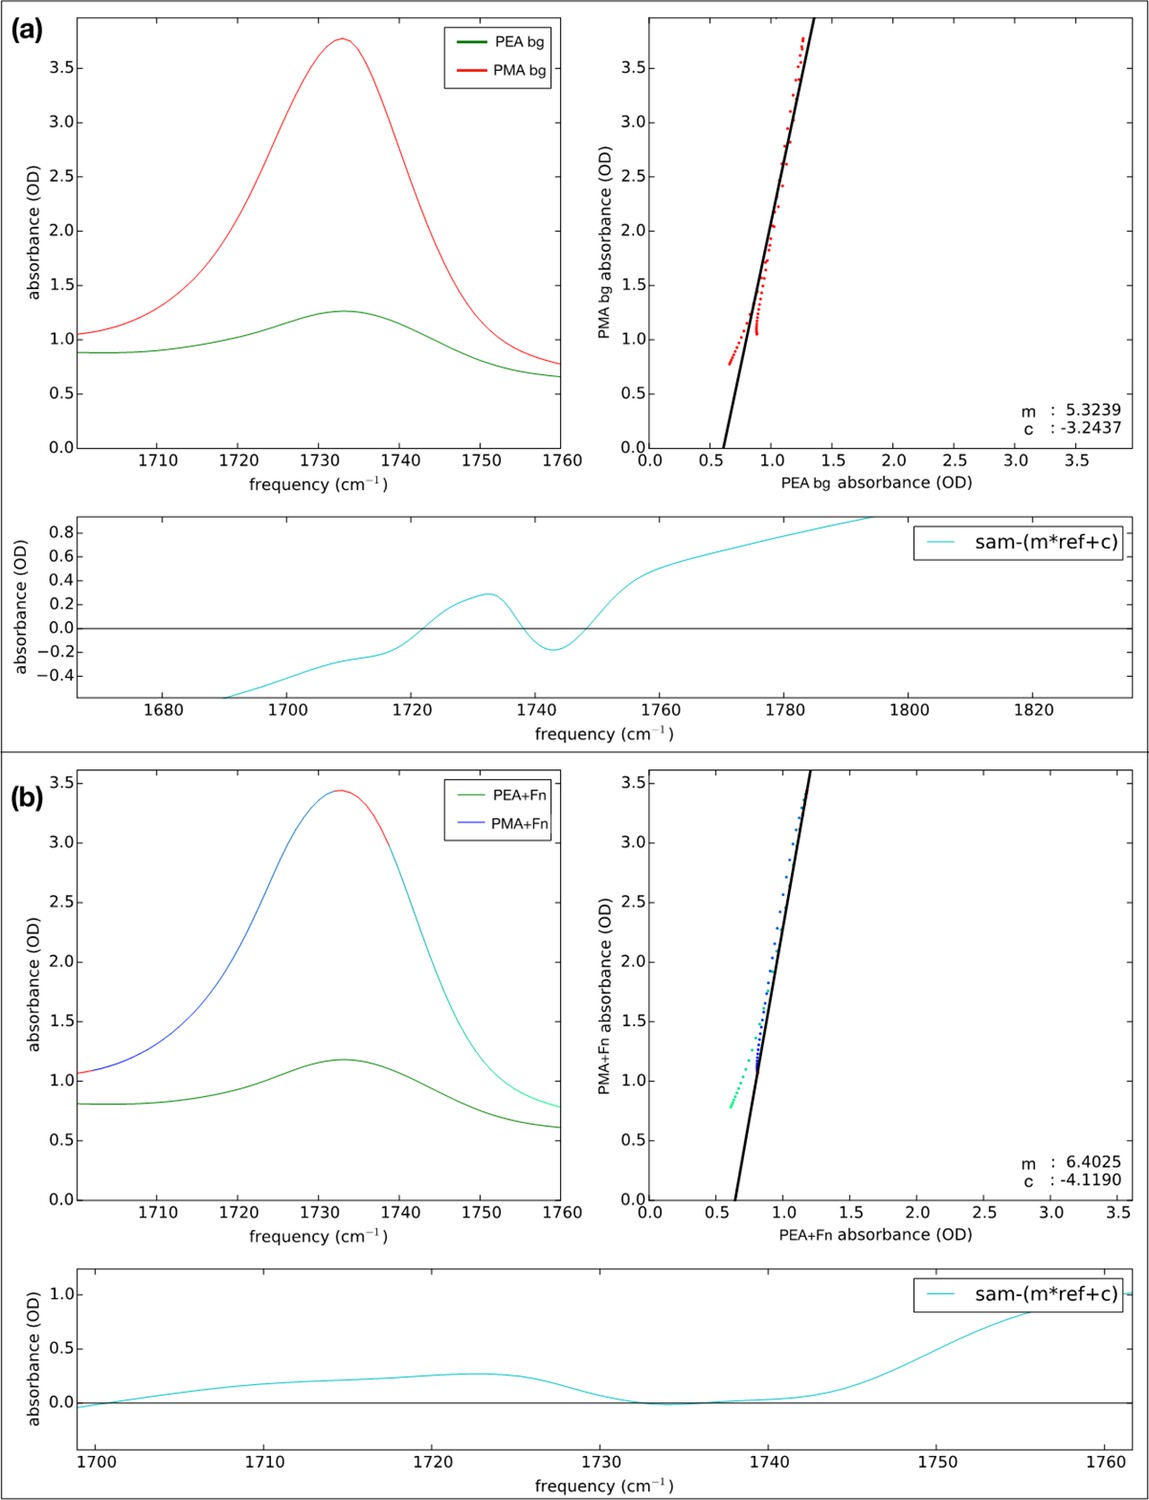
Results of least-squares fit before (top) and after (bottom) fibronectin (Fn) incubation of the spectra of the poly(ethyl acrylate) (PEA)- to the poly(methyl acrylate) (PMA)-coated surfaces, in order to obtain the relative number of PEA and PMA molecules on the surfaces.
A more accurate way to determine the relative amount of polymer-ester absorption, optimizing the overlap between the polymer ester peaks the pre- and post-incubation samples using a least-square fit with the offset and scaling factor as the fit parameters (instead of matching the intensities at 1700 and 1730 cm–1 as done in Figure 3—figure supplement 4d). In Figure 3—figure supplement 5, the result of such a least-square fit of the polymer ester peak is given before (a) and after incubation (b) with 20 μg ml−1 Fn. In this procedure, performed with a home-written Python script, the difference between two spectra is minimized with a constant offset c and a scaling factor m, that is: spectrum1(ν) – (m * spectrum2(ν)+c). The constant offset will reflect differences in the scattering, while m reflects the factor between the number of infrared (IR) oscillators (when looking at the same, isolated) peak. When performing this procedure only in the 1700–1760 cm–1 region both before and after the incubations, and subtracting the PMA spectra from the PEA spectra, we find factors of 5.3 and 6.4, respectively, that is, there are approximately six times as many ester groups present in the PEA case, as compared to the PMA case.
Figure 4
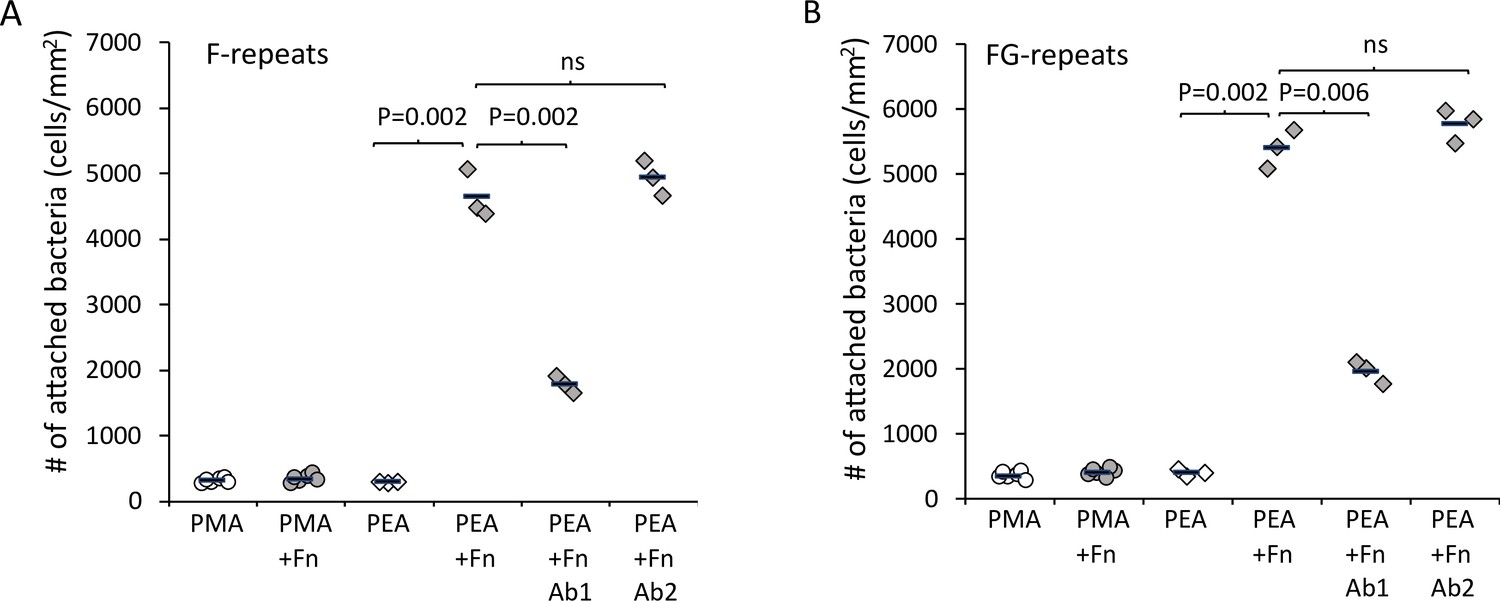
Extracellular matrix-binding protein (Embp) only mediates bacterial attachment to fibrillated fibronectin (Fn).
Staphylococcus carnosus TM300 expressing either F- (panel A) or FG-repeats (panel B) were passed through flow cells for 2 hr before enumeration of attached cells by microscopy. Adsorption of Fn only promoted attachment on poly(ethyl acrylate) (PEA)-coated surfaces where Fn fibrillated. Blocking of Fn at FnIII 12th-14th by specific antibodies (Antibody 1) resulted in decreased bacterial attachment, which indicates that Embp binds to this domain. Blocking of Fn at a different domain (FnIII 5th, Antibody 2) was included as a control for non-specific blocking of Fn by the antibodies. This antibody had no effect on bacterial attachment. p-Values are indicated (two-tailed t-test).
-
Figure 4—source data 1
Excel file with raw data and statistical calculations for the number of attached bacteria quantified by brightfield microscopy.
- https://cdn.elifesciences.org/articles/76164/elife-76164-fig4-data1-v2.xlsx
Figure 5
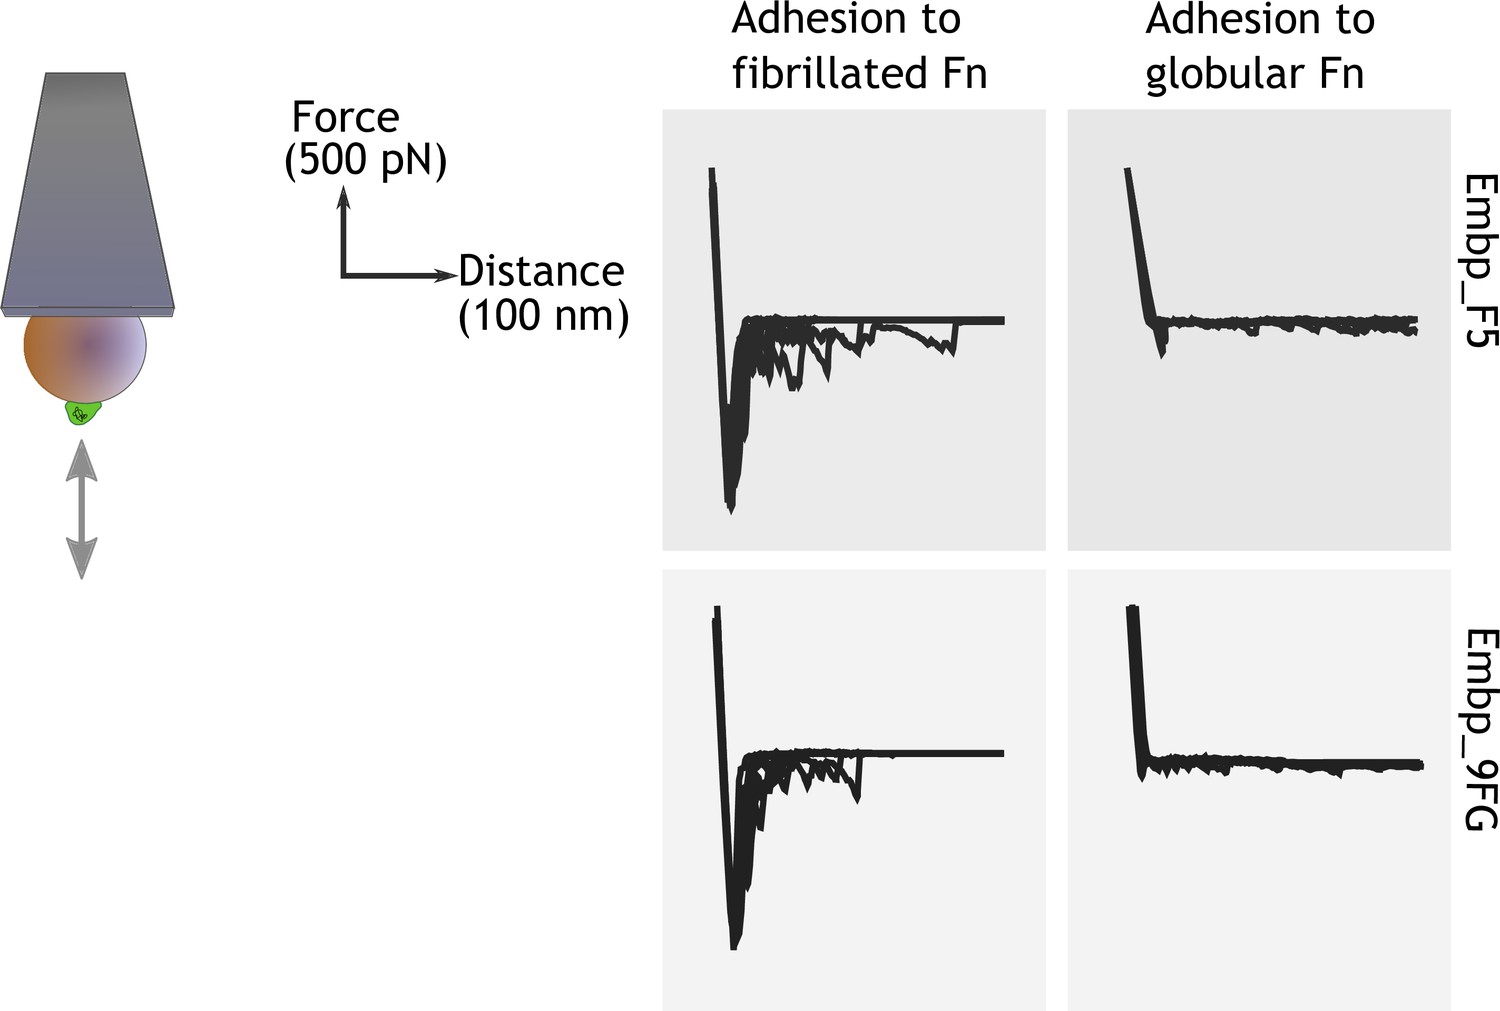
Single-cell force spectroscopy shows that both the F- and FG-repeats adheres strongly to fibrillated fibronectin (Fn).
Single Staphylococcus carnosus cells expressing either F- or FG-repeats were immobilized on a colloidal atomic force microscopy (AFM) cantilever, and force-distance curves were measured by approaching and retracting the cantilever to surfaces with fibrillated or globular Fn. Adhesion events are recognized as negative peaks on the force axis below the horizontal baseline.
-
Figure 5—source data 1
Zip file containing raw force spectroscopy data and screenshots to document system setup.
- https://cdn.elifesciences.org/articles/76164/elife-76164-fig5-data1-v2.zip
Figure 6
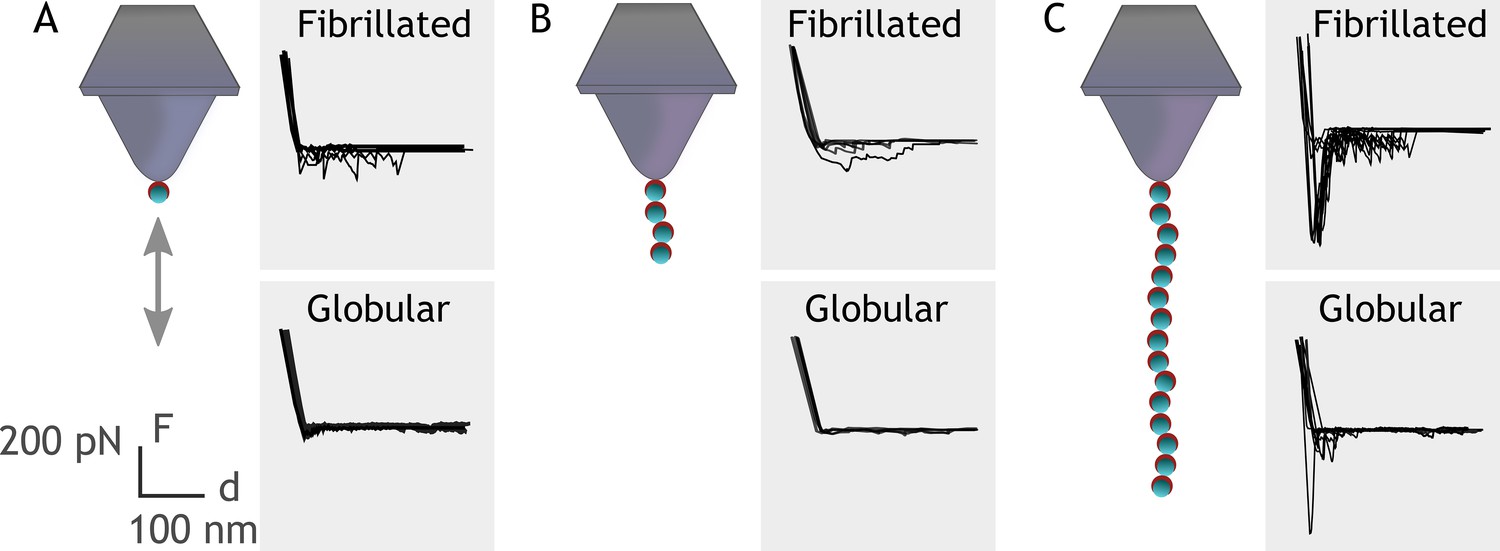
Single-molecule force spectroscopy shows that multiple FG-repeats are needed to detect binding to fibronectin (Fn).
Recombinant extracellular matrix-binding protein (Embp) consisting of either 1 (A), 4 (B), or 15 (C) FG-repeats was tethered to a chemically modified silicon probe trough 6× His-NTA interaction. Force-distance curves were measured toward fibrillated Fn on poly(ethyl acrylate) (PEA) and globular Fn on poly(methyl acrylate) (PMA).
-
Figure 6—source data 1
Zip file containing raw force spectroscopy data and screenshots to document system setup.
- https://cdn.elifesciences.org/articles/76164/elife-76164-fig6-data1-v2.zip
Figure 7
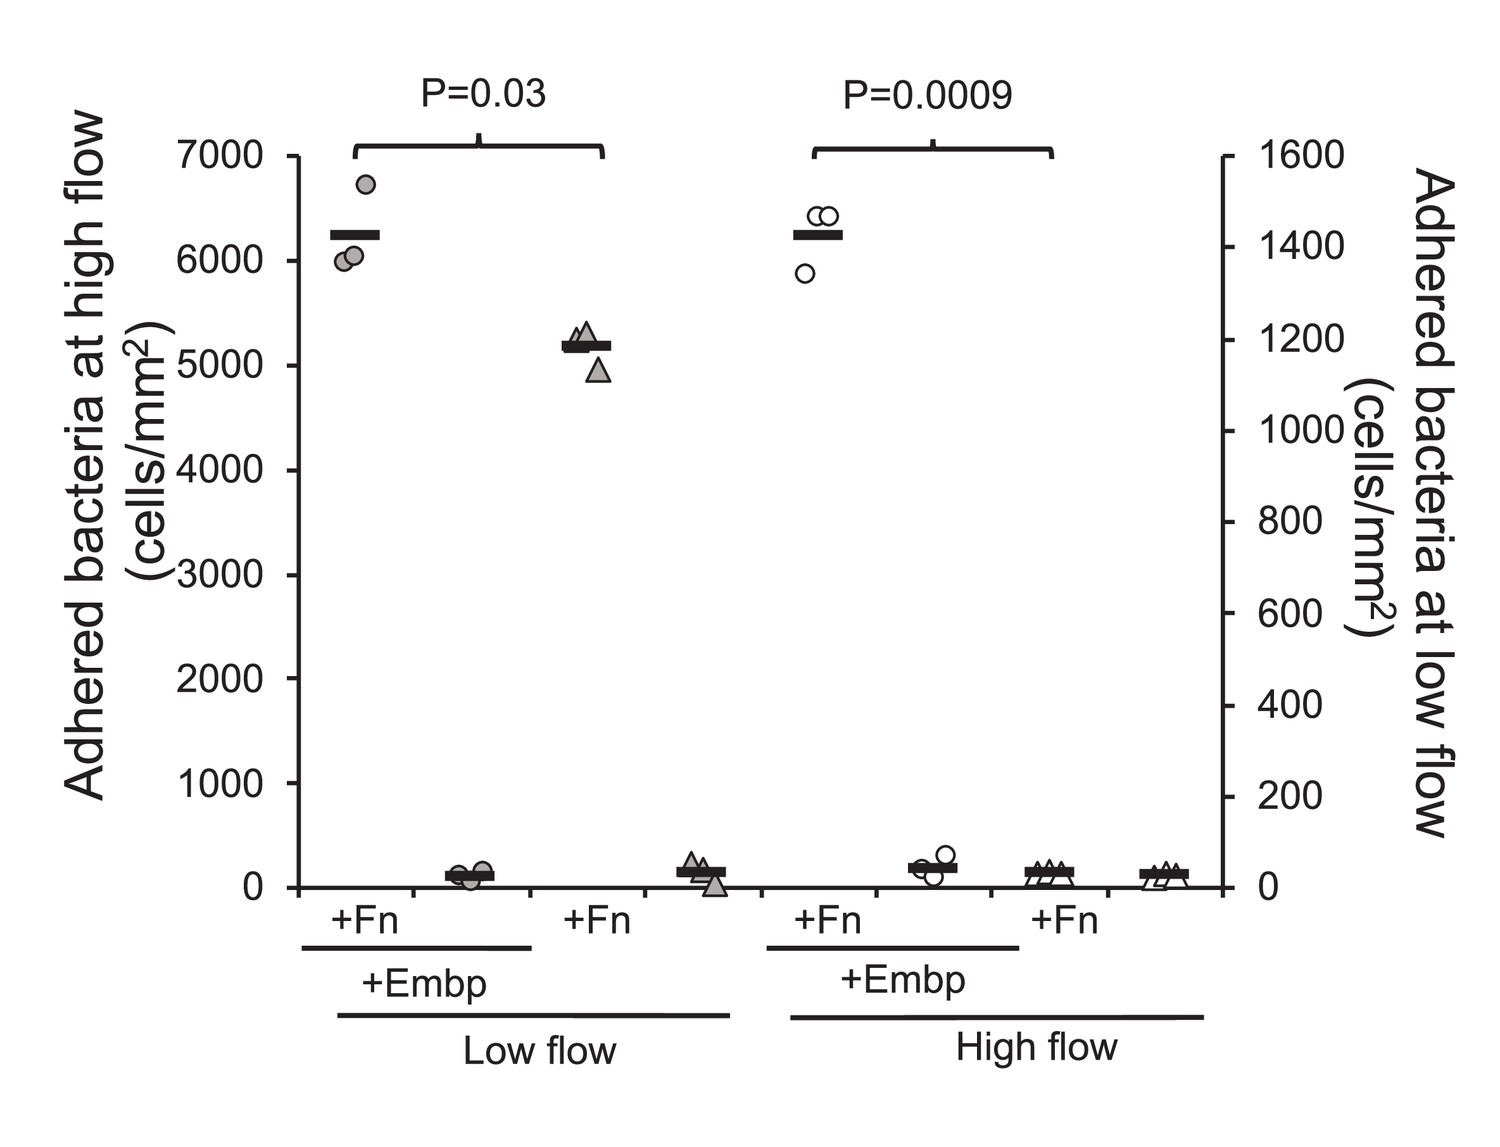
Extracellular matrix-binding protein (Embp) is essential for attachment under high flow.
Attachment to poly(ethyl acrylate) (PEA) +/-Fn was quantified for Staphylococcus epidermidis overexpressing (circles) or lacking (triangles) Embp at high flow (gray symbols, left y axis) and low flow (white symbols, right y axis). Expression of Embp led to a 20% increase in attachment at low flow (two-tailed t-test, unequal variance, p=0.03). At high flow, only the Embp-expressing strain could attach (two-tailed t-test, p=0,0009). Black bars show sample mean.
-
Figure 7—source data 1
Excel file with raw data, calculations, and statistical analysis for quantification of bacterial attachment, shear force calculation, and measurement of hydrodynamic radius.
- https://cdn.elifesciences.org/articles/76164/elife-76164-fig7-data1-v2.xlsx
Tables
Table 1
X-ray photoelectron spectroscopy (XPS) survey spectrum atomic percent compositions for polymer poly(ethyl acrylate) (PEA) and poly(methyl acrylate) (PMA) and either phosphate buffered saline (PBS) or PBS with fibronectin (Fn).
| Element | PEA PBS [%] | PEA Fn [%] | PMA PBS [%] | PMA Fn [%] |
|---|---|---|---|---|
| C1s | 79.5 (1.0) | 55.8 (1.0) | 21.4 (1.4) | 67.4 (3.8) |
| O1s | 19.6 (1.0) | 27.0 (1.1) | 55.5 (1.2) | 21.4 (1.3) |
| N1s | n.d. | 8.3 (0.4) | n.d. | 7.7 (1.5) |
| Si2p | 0.9 (0.4) | 0.1 (0.1) | 19.8 (0.8) | 0.2 (0.2) |
| Na1s | n.d. | 3.6 (0.1) | 3.2 (0.7) | 1.9 (0.6) |
| Cl2p | n.d. | 2.5 (0.3) | 0.1 (0.1) | 1.4 (0.3) |
| P2p | n.d. | 2.7 (0.1) | n.d. | n.d. |
| K2p | n.d. | n.d. | n.d. | n.d. |
-
Note: not detectable (n.d.); (.)=standard deviation; [%]=atomic percent (sample mean, n=3).
Key resources table
| Reagent type (species) or resource | Designation | Source or reference | Identifiers | Additional information |
|---|---|---|---|---|
| Strain, Strain background Staphylococcus epidermidis | 1585 WT | PMID:15752207 | ATCC12228 | Clinical isolate |
| Genetic reagent Staphylococcus epidermidis | 1585Pxyl/tet embp | PMID:19943904 | Expresses Embp from inducible promotor | |
| Genetic reagent Staphylococcus epidermidis | Δembp | PMID:33082256 | Deficient of Embp | |
| Genetic reagent Staphylococcus carnosus | TM300 × pEmbp_5F | PMID:33082256 | Recombinant Embp fragment (5 F-repeats) expressed in surrogate host | |
| Genetic reagent Staphylococcus carnosus | TM300 × pEmbp_9FG | PMID:33082256 | Recombinant Embp fragment (9 FG-repeats) expressed in surrogate host | |
| Peptide, recombinant protein | Fibronectin | Sigma-Aldrich | Catalog # F0895 | 0.1% solution isolated from human plasma |
| Antibody | Anti-Embp2588 IgG (rabbit polyclonal) | Rhode lab PMID:19943904 | (1:200) | |
| Antibody | Anti-rabbit IgG conjugated with Alexa Fluor 635 (goat polyclonal) | Invitrogen | Catalog # A31577 | (1:300) |
| Antibody | Anti-human Fn IgG (FNIII 12–14) (mouse monoclonal) | Santa Cruz Biotech | Catalog # sc-18827 | (1:100) |
| Antibody | Anti-human Fn IgG (FNIII 5th) (Mouse monoclonal) | Sigma-Aldrich | Catalog # F0916 | (1:100) |
| Antibody | Anti-mouse IgG conjugated with Alexa Fluor 635 (goat polyclonal) | Invitrogen | Catalog # A31574 | (1:300) |
| Chemical compound, drug | Goat serum | Invitrogen | Catalog # 31873 | Blocking buffer |
| Chemical compound, drug | Ethyl acrylate | Sigma-Aldrich | Catalog # E9706-1L | Monomer for generating PEA |
| Chemical compound, drug | Methyl acrylate | Sigma-Aldrich | Catalog # M27301-1L | Monomer for generating PMA |
| Chemical compound, drug | Benzoin | Sigma-Aldrich | Catalog # B8633 | Initiator for the polymerization |
| Commercial assay, kit | Phusion High-Fidelity PCR Kit | New England Biolabs | Catalog # E0553S | |
| Commercial assay, kit | GenElute PCR Clean-Up Kit | Sigma-Aldrich | Catalog # NA1020 | |
| Commercial assay, kit | Gibson assembly ligation master mix | New England Biolabs | Catalog # E5510S | |
| Commercial assay, kit | GeneJET Plasmid Miniprep Kit | Thermo Scientific | Catalog # K0702 | |
| Other | SYTO-9 | Invitrogen | Catalog # S34854 | DNA-binding fluorescent stain |
Table 2
Primers for recombinant Embp (rEmbp) cloning into pET302/NT-His.
| Primer | Sequence (5′ to 3´) |
|---|---|
| FG forward | AGAAGGAGATATACATATGCATCATCATCATCATCACGTGGAATTCGAAAACC TGTATTTTCAGGGCGGAGATCAAAAACTTCAAGATG |
| 1 FG reverse | TCCGATTATACCTAGGCTCGAATATCATCGATCTCGAGCGGAATTCTTAATGA AGATTTTGTTCAGC |
| 4 FG reverse | TCCGATTATACCTAGGCTCGAATATCATCGATCTCGAGCGGAATTCTTAATGT AAACTTTCTCTAGC |
| 15 FG reverse | TCCGATTATACCTAGGCTCGAATATCATCGATCTCGAGCGGAATTCTTAATT TAACGATGTTTCTGC |
| T7 Promotor | TAATACGACTCACTATAGGG |
| T7 Terminator | GCTAGTTATTGCTCAGCGG |
Table 3
Buffer used for recombinant Embp (rEmbp) purification.
| Buffer name | Composition |
|---|---|
| Binding/lysis | 50 mM K2PO4, 500 mM NaCl, 400 mM imidazole, pH 7.4 |
| Ni-NTA elution | 50 mM K2PO4, 500 mM NaCl, 40 mM imidazole, pH 7.4 |
| IEX binding | 20 mM Bis-Tris propane, pH 6.0 |
| IEX elution | 20 mM Bis-Tris propane, 1 M NaCl, pH 6.0 |
| SEC | 50 mM MES, 150 mM NaCl, pH 6.0 |
Additional files
Download links
A two-part list of links to download the article, or parts of the article, in various formats.
Downloads (link to download the article as PDF)
Open citations (links to open the citations from this article in various online reference manager services)
Cite this article (links to download the citations from this article in formats compatible with various reference manager tools)
The giant staphylococcal protein Embp facilitates colonization of surfaces through Velcro-like attachment to fibrillated fibronectin
eLife 11:e76164.
https://doi.org/10.7554/eLife.76164


