Integration host factor regulates colonization factors in the bee gut symbiont Frischella perrara
- Department of Fundamental Microbiology, University of Lausanne, Switzerland
- Institute of Microbiology, Eidgenössische Technische Hochschule (ETH) Zurich, Switzerland
Figures
Figure 1 with 2 supplements
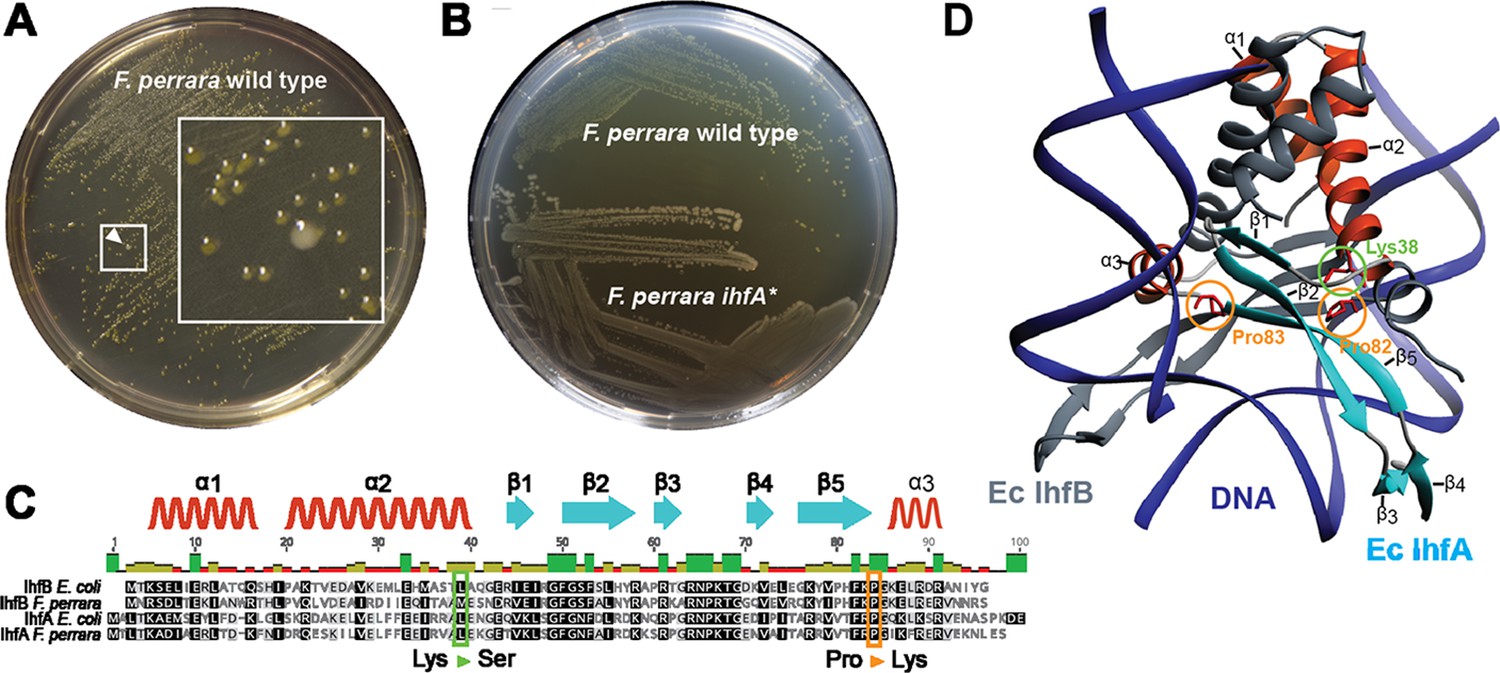
Isolation of a spontaneous ihfA* mutant of F. perrara displaying an altered colony morphotype.
(A) Colonies of F. perrara PEB0191 (wt) after 48 hr of growth on modified tryptone yeast glucose (mTYG) agar. Arrowhead points at a larger white colony in between many yellow colonies. The area in the white square is magnified. (B) Colony morphology of F. perrara wt and the isolated white ihfA* mutant after growth on mTYG for 48 hr. (C) Protein sequence comparison of IhfA and IhfB of F. perrara wt and E. coli wt. The outlined positions refer to the residues mutated in the three spontaneous ihfA mutants: (i) lysine (Lys) to serine (Ser) at position 38 of F. perrara IhfA, (ii) proline (Pro) to lysine (Lys) at position 83 of F. perrara IhfA, and (iii) proline (Pro) to lysine (Lys) at position 82 of F. perrara IhfB. Note that the numbers given on top of the alignment refer to alignment positions and not to positions in the individual sequences. Secondary structures are depicted above as ribbons (α-helix) and arrows (β-sheet) and are numbered according to their appearance in the protein and the structure shown in (D). (D) Three-dimensional structure of E. coli IhfA/B heterocomplex with DNA (source protein databank NDB: PDT040). DNA is depicted in blue and IhfB in dark gray. IhfA is colored according to secondary structure: α-helix orange, β-sheet light blue, and the rest in light gray. α-helices and β-sheets are numbered. The mutated Pro83 and Lys38 residues of F. perrara IhfA and the Pro82 residue of IhfB are marked with an orange and green circle, respectively.
Figure 1—figure supplement 1
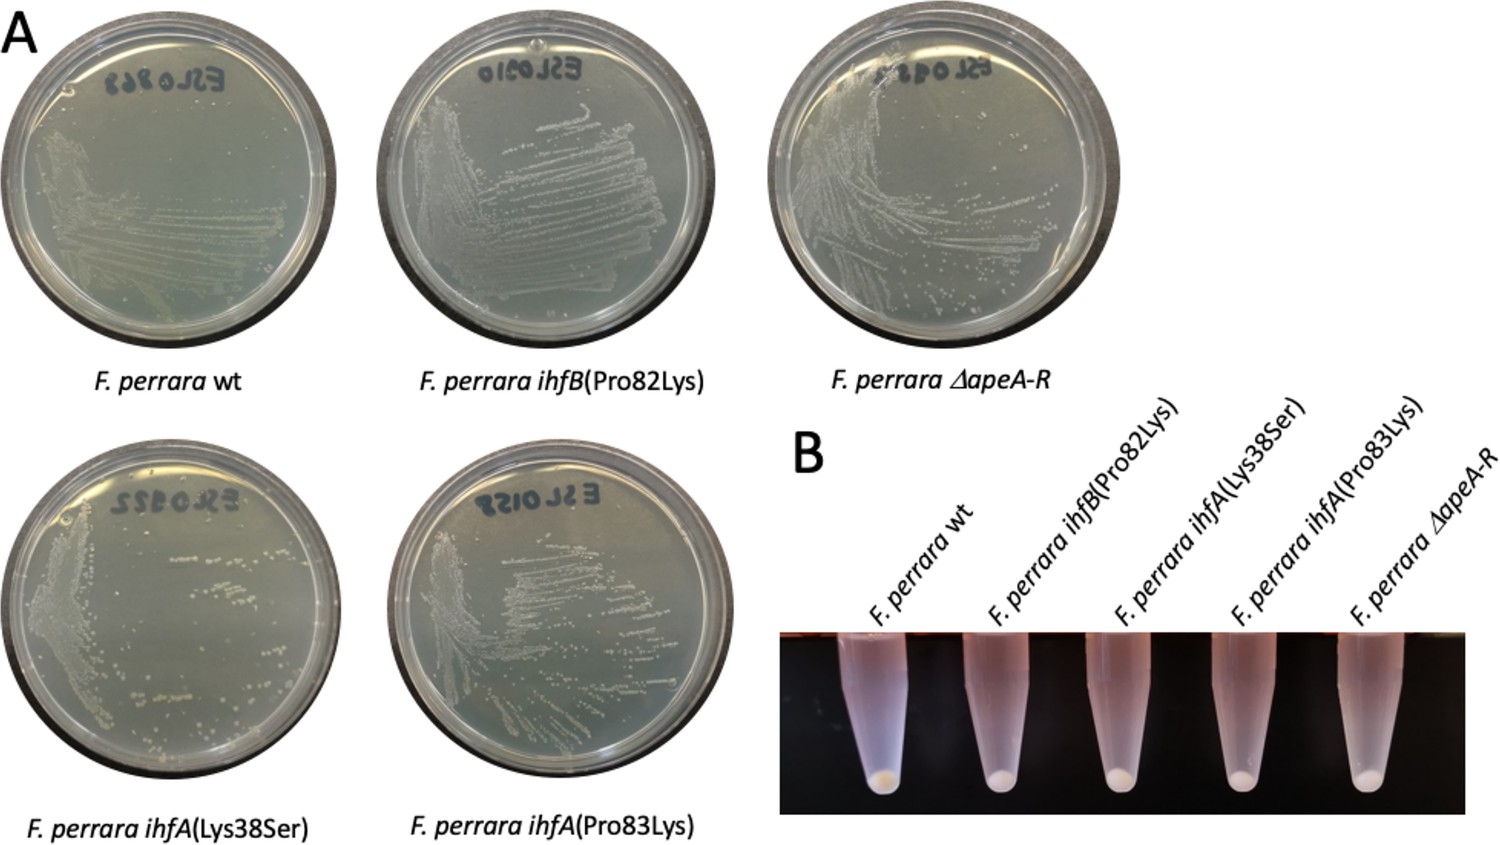
Colony morphology of different F. perrara strains on modified tryptone yeast glucose (mTYG) agar plates.
(A) Dilution streaks of five different strains, including the wt, the three separate point mutation strains of integration host factor (IHF) (two in ihfA and one in ihfB), and the ΔapeA-R mutant after 2 d of growth under anaerobic conditions. (B) Bacterial cell pellets of the same strains as in (A) harvested from the agar plates, resuspended in 1x PBS, and centrifuged for 5 min at 5000 rpm.
Figure 1—figure supplement 2
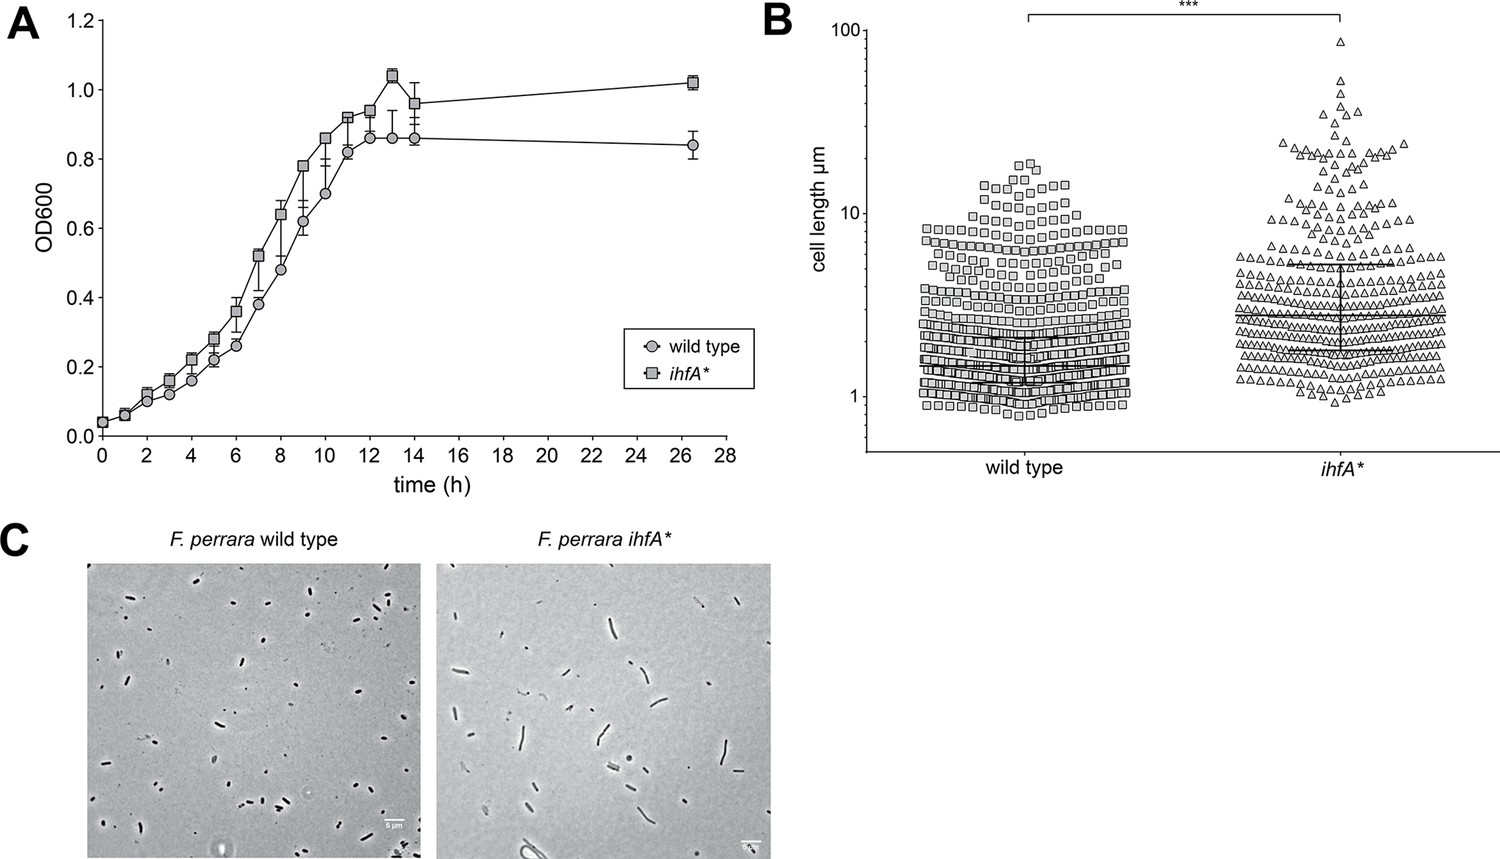
In vitro characterization of F. perrara ihfA*.
(A) Growth curve of F. perrara PEB0191 wt and ihfA* in liquid tryptone yeast glucose (TYG). The optical density (OD600) was measured every hour for 14 hr (permutation test, p=0.097). (B) Quantification of single-cell length of F. perrara wt PEB0191 and ihfA* from the single-cell microscopy experiment shown in (C). Significance was tested using Kolgomorov–Smirnov test, asterisks depict significance: ***p<0.0001. (C) Single-cell light microscopy of F. perrara wt and ihfA*. The scale bar (5 µm) is depicted in the right lower corner. Figure 1—figure supplement 2—source data 1 contains the numeric values for the figures shown here.
-
Figure 1—figure supplement 2—source data 1
Numeric data underlying the results shown in Figure 1—figure supplement 2.
- https://cdn.elifesciences.org/articles/76182/elife-76182-fig1-figsupp2-data1-v1.xlsx
Figure 2 with 11 supplements
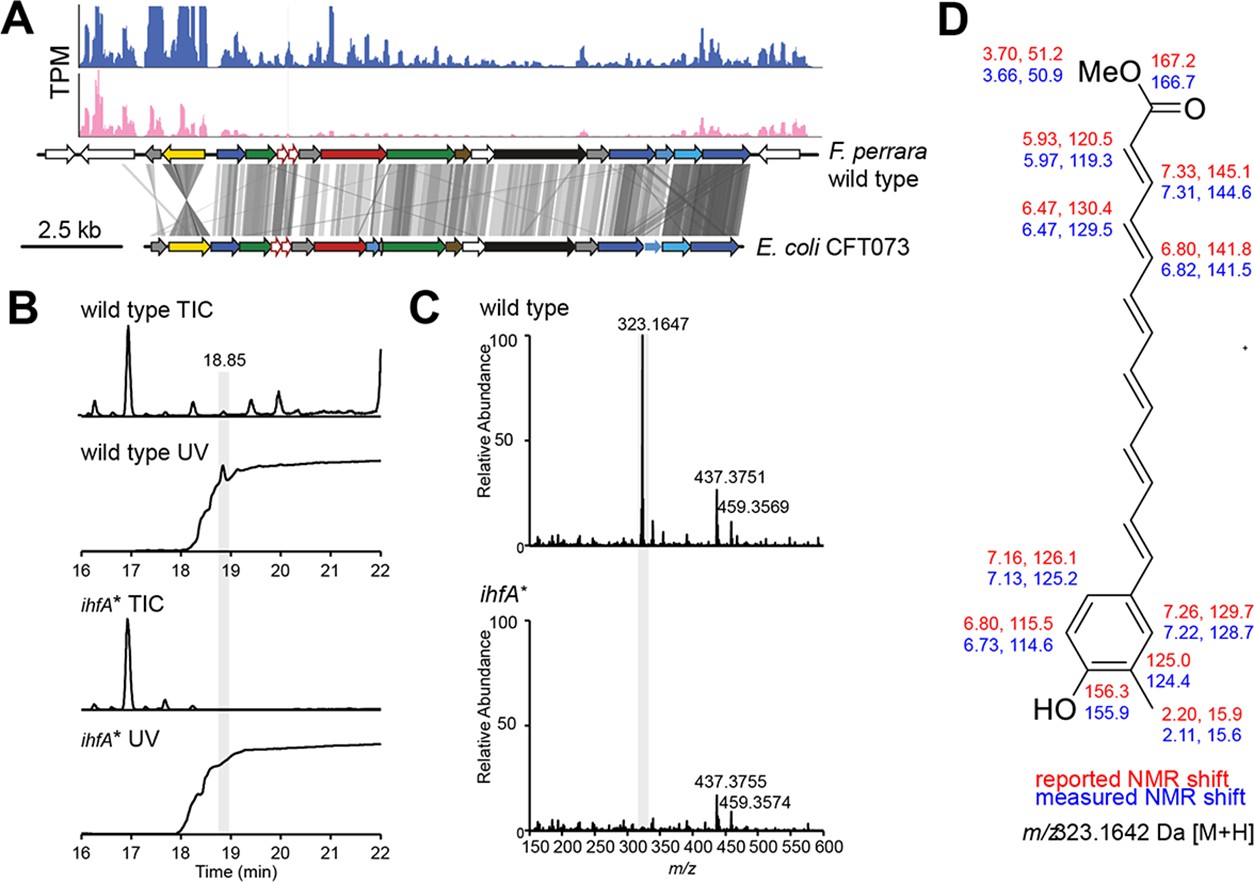
Metabolite analysis of F. perrara wt and the ihfA* mutant.
(A) Comparison of gene synteny and sequence similarity of the genomic islands of F. perrara PEB0191 (top) and E. coli CFT073 (bottom) encoding the aryl polyene (APE) biosynthesis genes. Gray lines indicate homologous regions based on tblastx analysis. Plots were generated with genoplotR (Guy et al., 2010). Transcripts per million (TPMs) are shown on top of the genomic island for one RNAseq replicate of each F. perrara wt (blue) and the ihfA* mutant grown in vitro. Coverage plots were generated with the Integrated Genome Browser v9 (Freese et al., 2016). (B) Total ion chromatogram (TIC) and UV trace (λ = 420 nm) of wt and ihfA*. A peak highly abundant in the wt was discovered at 18.85 min. Its high UV absorbance at λ = 420 nm indicated a conjugated carbon double bond system. (C) The normalized mass spectrum at 18.85 min reveals the ion m/z = 323.1647 Da to be approximately 50-fold more abundant in the wt compared to ihfA*. (D) Enrichment of the ion containing fraction by HPLC followed by nuclear magnetic resonance (NMR) experiments suggest a structure identical to that reported by Cimermancic et al., 2014. Reported (red) and observed (blue) 1H and 13C chemical shifts are shown. Central methines could not be assigned.
Figure 2—figure supplement 1
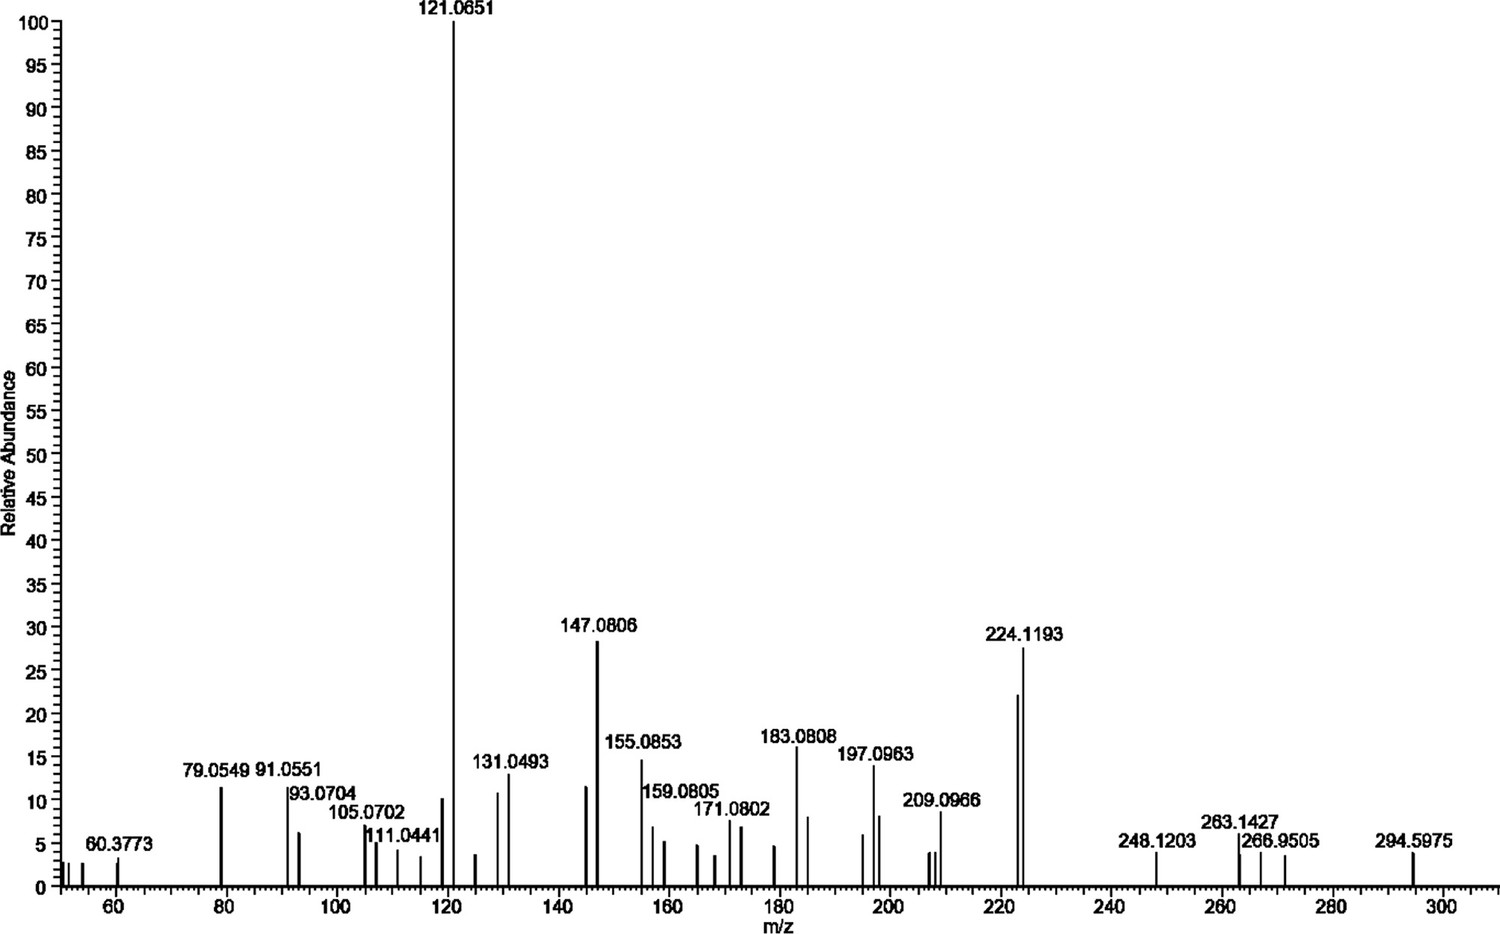
Ms-Ms fragmentation spectrum of m/z = 323.1647 in extracts of F. perrara wt.
Many of the prominent ions were reported from aryl polyenes by Schöner et al., 2016: m/z = 121.00, 131.00, 145.00, 147.08, 171.08, 183.00, 197.08, 209.08, 223.08. The spectrum was recorded at 30 kV collision energy.
Figure 2—figure supplement 2
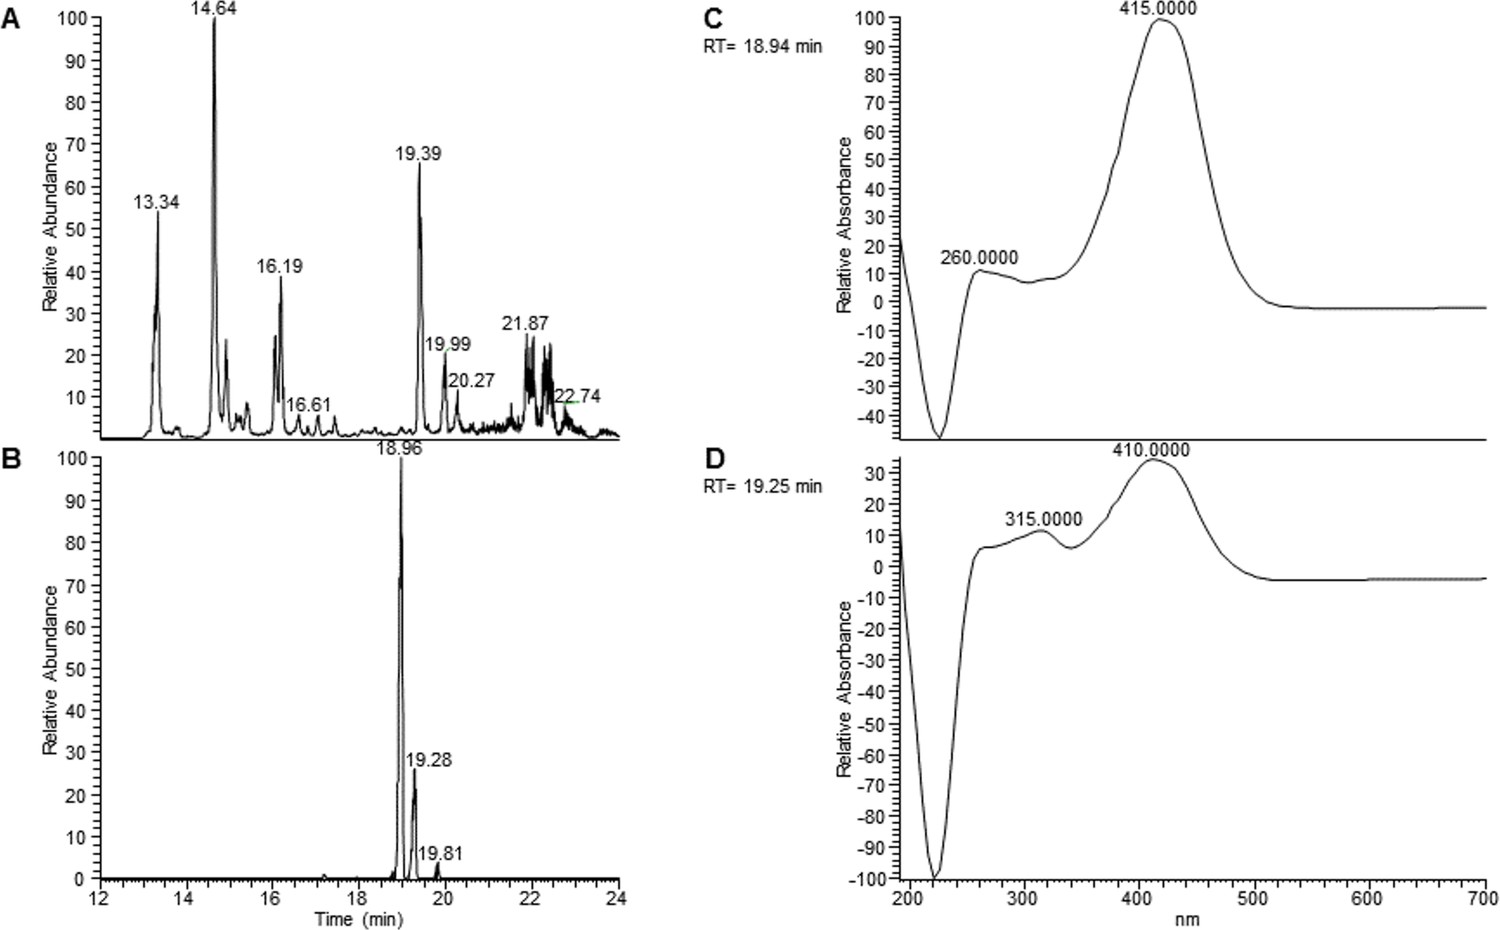
UV spectrum of the extracts indicates isomerization of the aryl polyene.
(A) Total ion chromatogram of extracts of F. perrara wt. (B) Extracted ion chromatogram of m/z = 323.1640 Da (± 5 ppm). Storage led to the formation of an additional peak at 19.28 min, possibly by isomerization. (C) The UV spectrum at 18.94 min has the maximum around 415 nm, similar to that reported by Cimermancic et al., 2014. (D) The UV spectrum at 19.25 min shows an additional maximum at 315 nm, characteristic for a trans-cis conversion of a double bond.
Figure 2—figure supplement 3
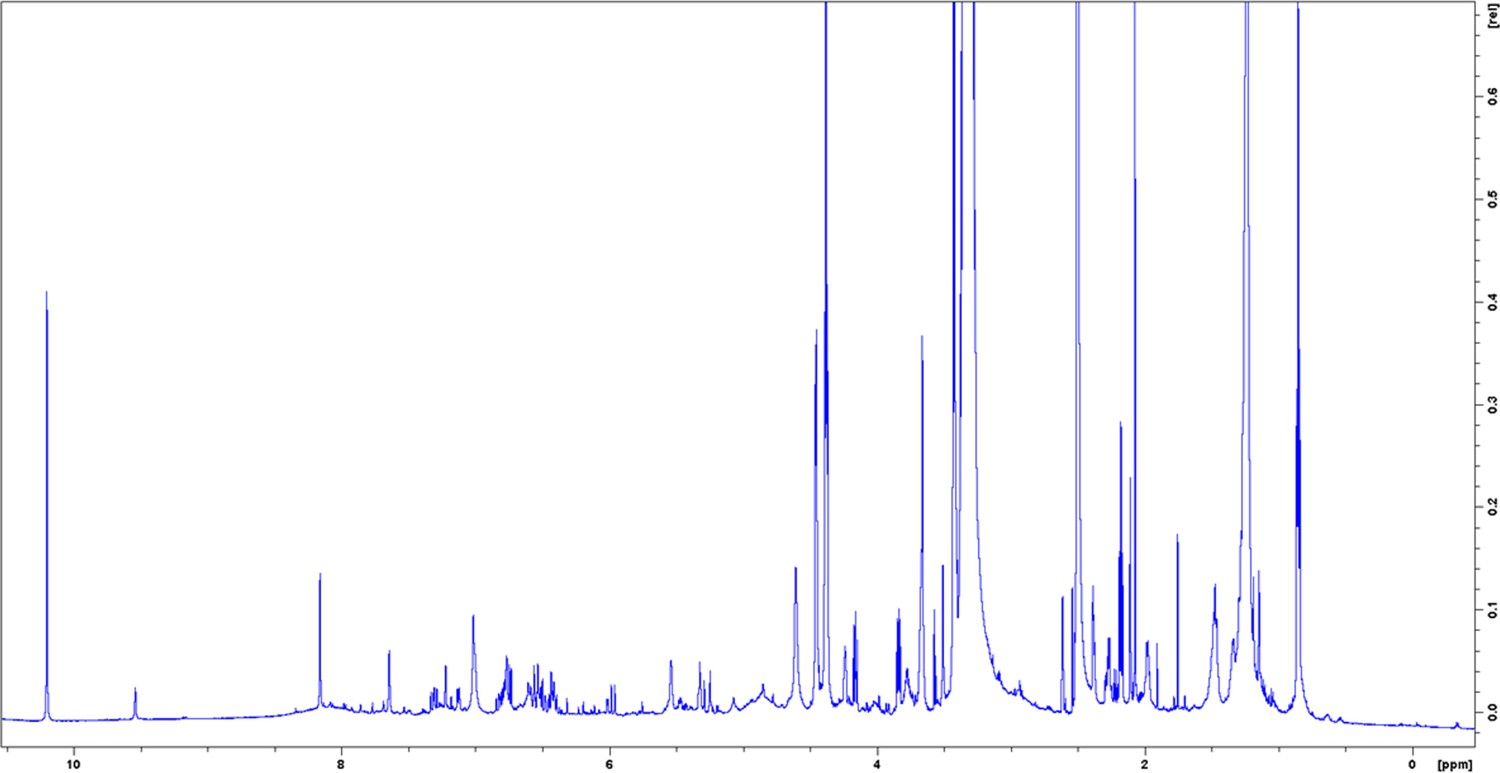
1H nuclear magnetic resonance (NMR) spectrum of enriched aryl polyene in DMSO-δ6 at 298 K.
Figure 2—figure supplement 4
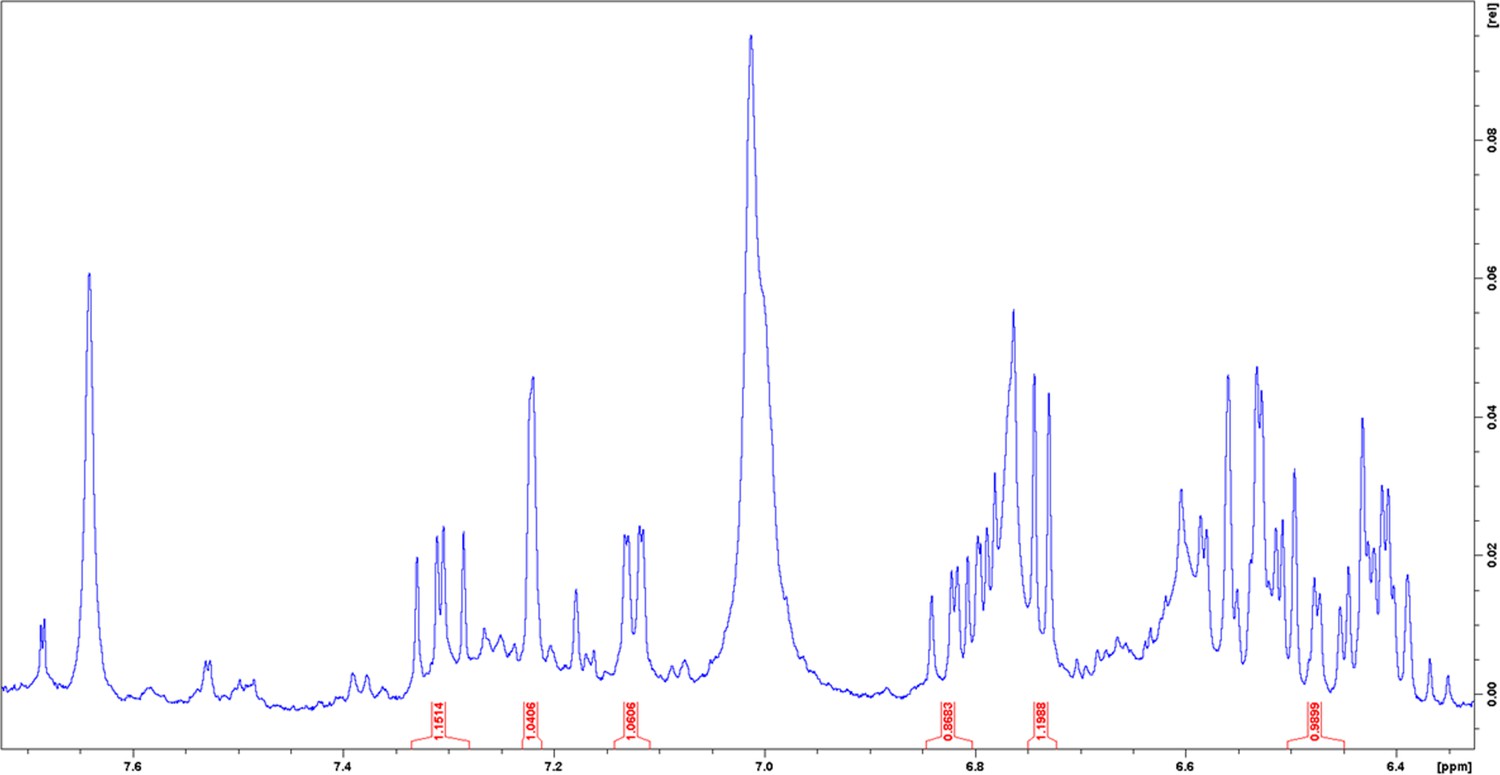
1H nuclear magnetic resonance (NMR) spectrum of enriched aryl polyene in DMSO-δ6 at 298 K.
Enhanced view of the aromatic region and integrals of assigned peaks.
Figure 2—figure supplement 5
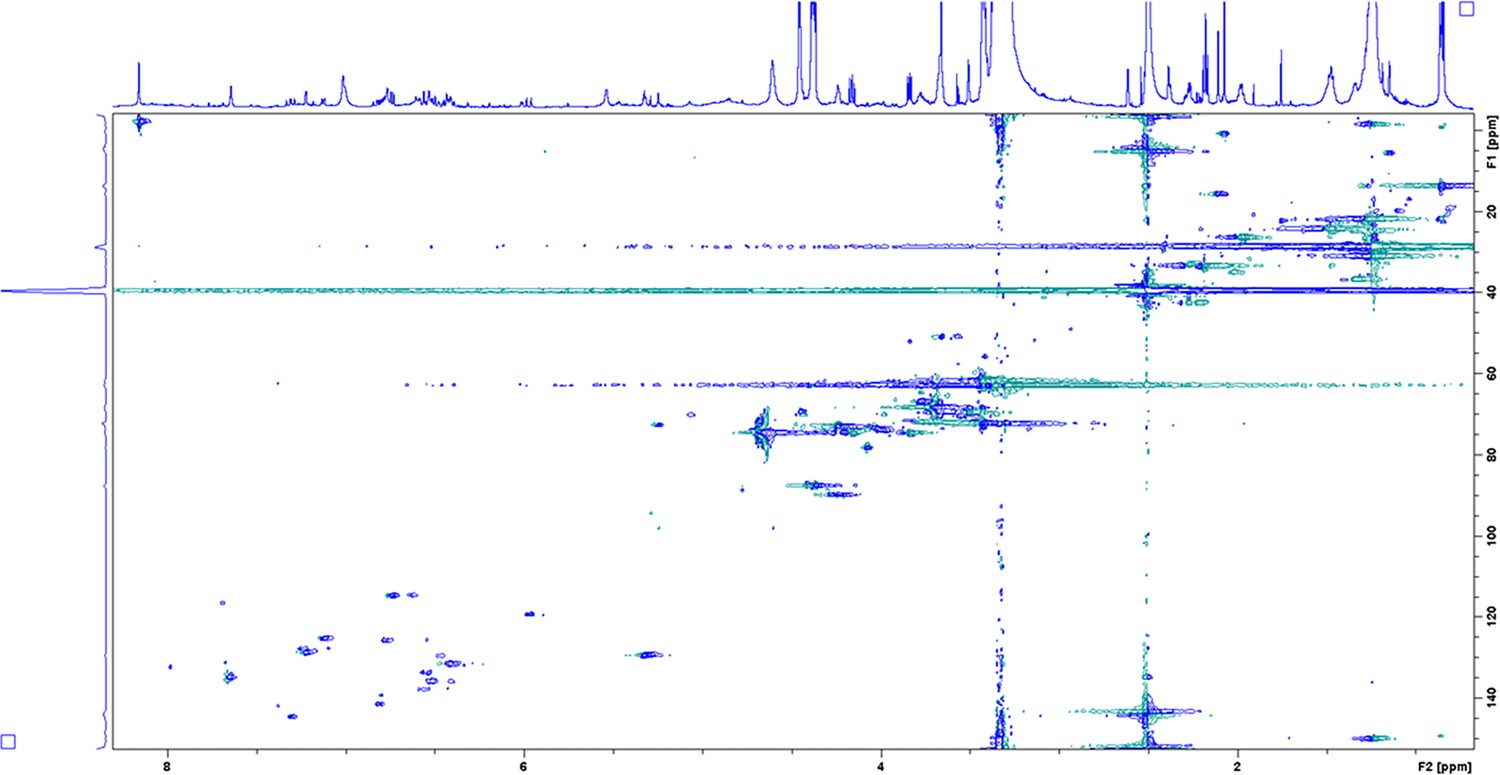
Heteronuclear Single Quantum Coherence (HSQC) spectrum of enriched aryl polyene in DMSO-δ6 at 298 K.
Figure 2—figure supplement 6
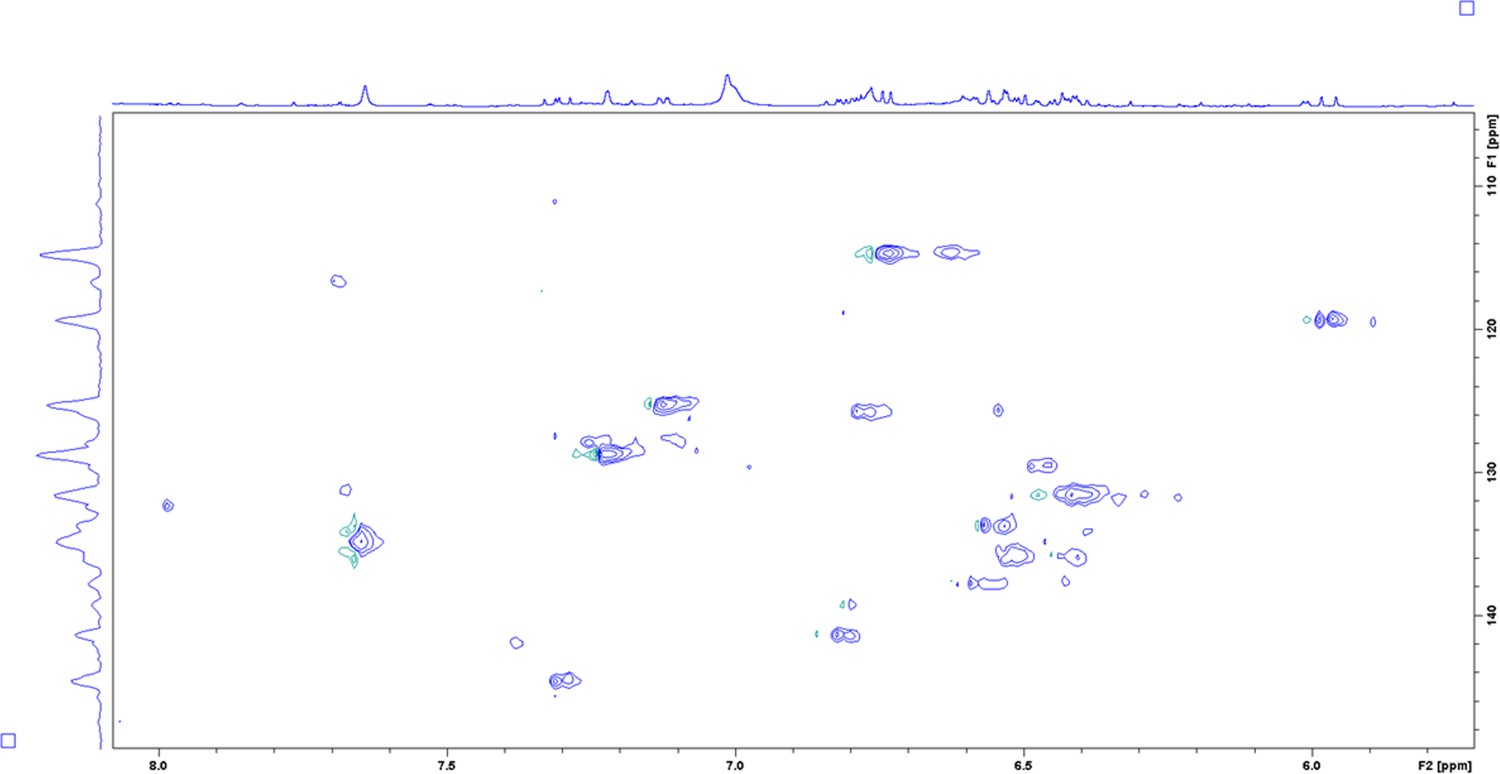
Heteronuclear Single Quantum Coherence (HSQC) spectrum of enriched aryl polyene in DMSO-δ6 at 298 K.
Enhanced view of the aromatic region.
Figure 2—figure supplement 7
COrrelated SpectroscopY (COSY) spectrum of enriched aryl polyene in DMSO-δ6 at 298 K.
Figure 2—figure supplement 8
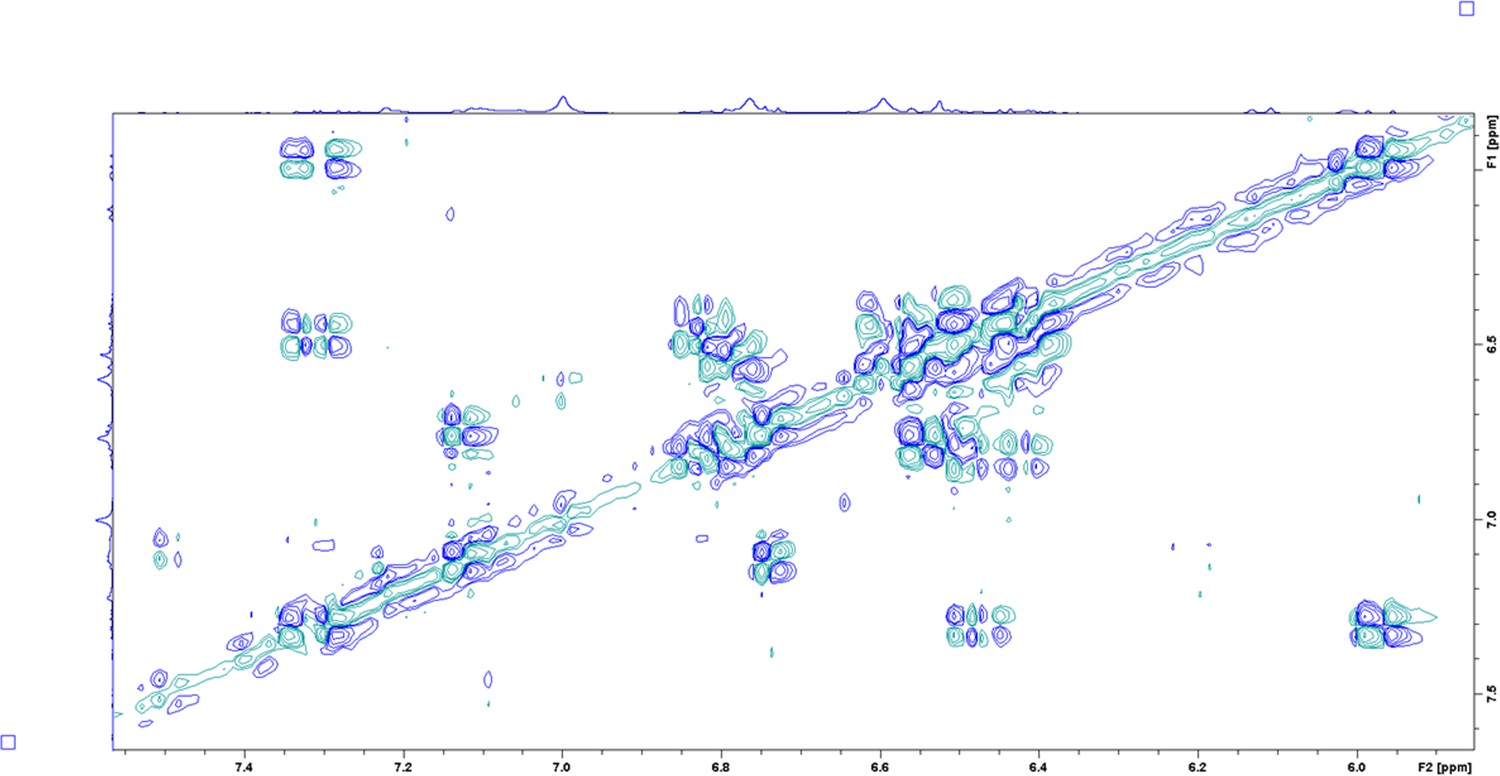
COrrelated SpectroscopY (COSY) spectrum of enriched aryl polyene in DMSO-δ6 at 298 K.
Enhanced view of the aromatic region.
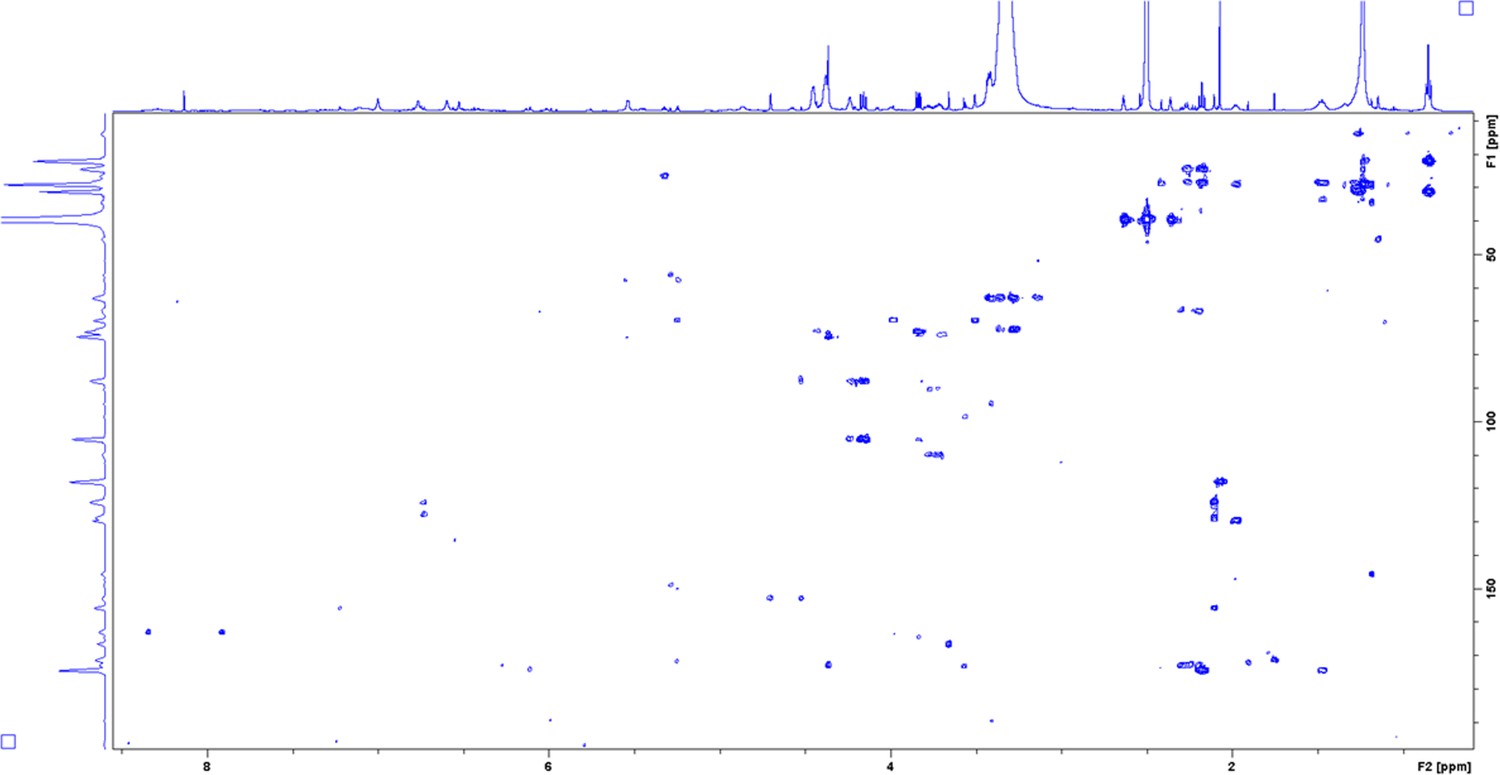
Figure 2—figure supplement 9

Heteronuclear multiple-bond coherence (HMBC) spectrum of enriched aryl polyene in DMSO-δ6 at 298 K.
Figure 2—figure supplement 10
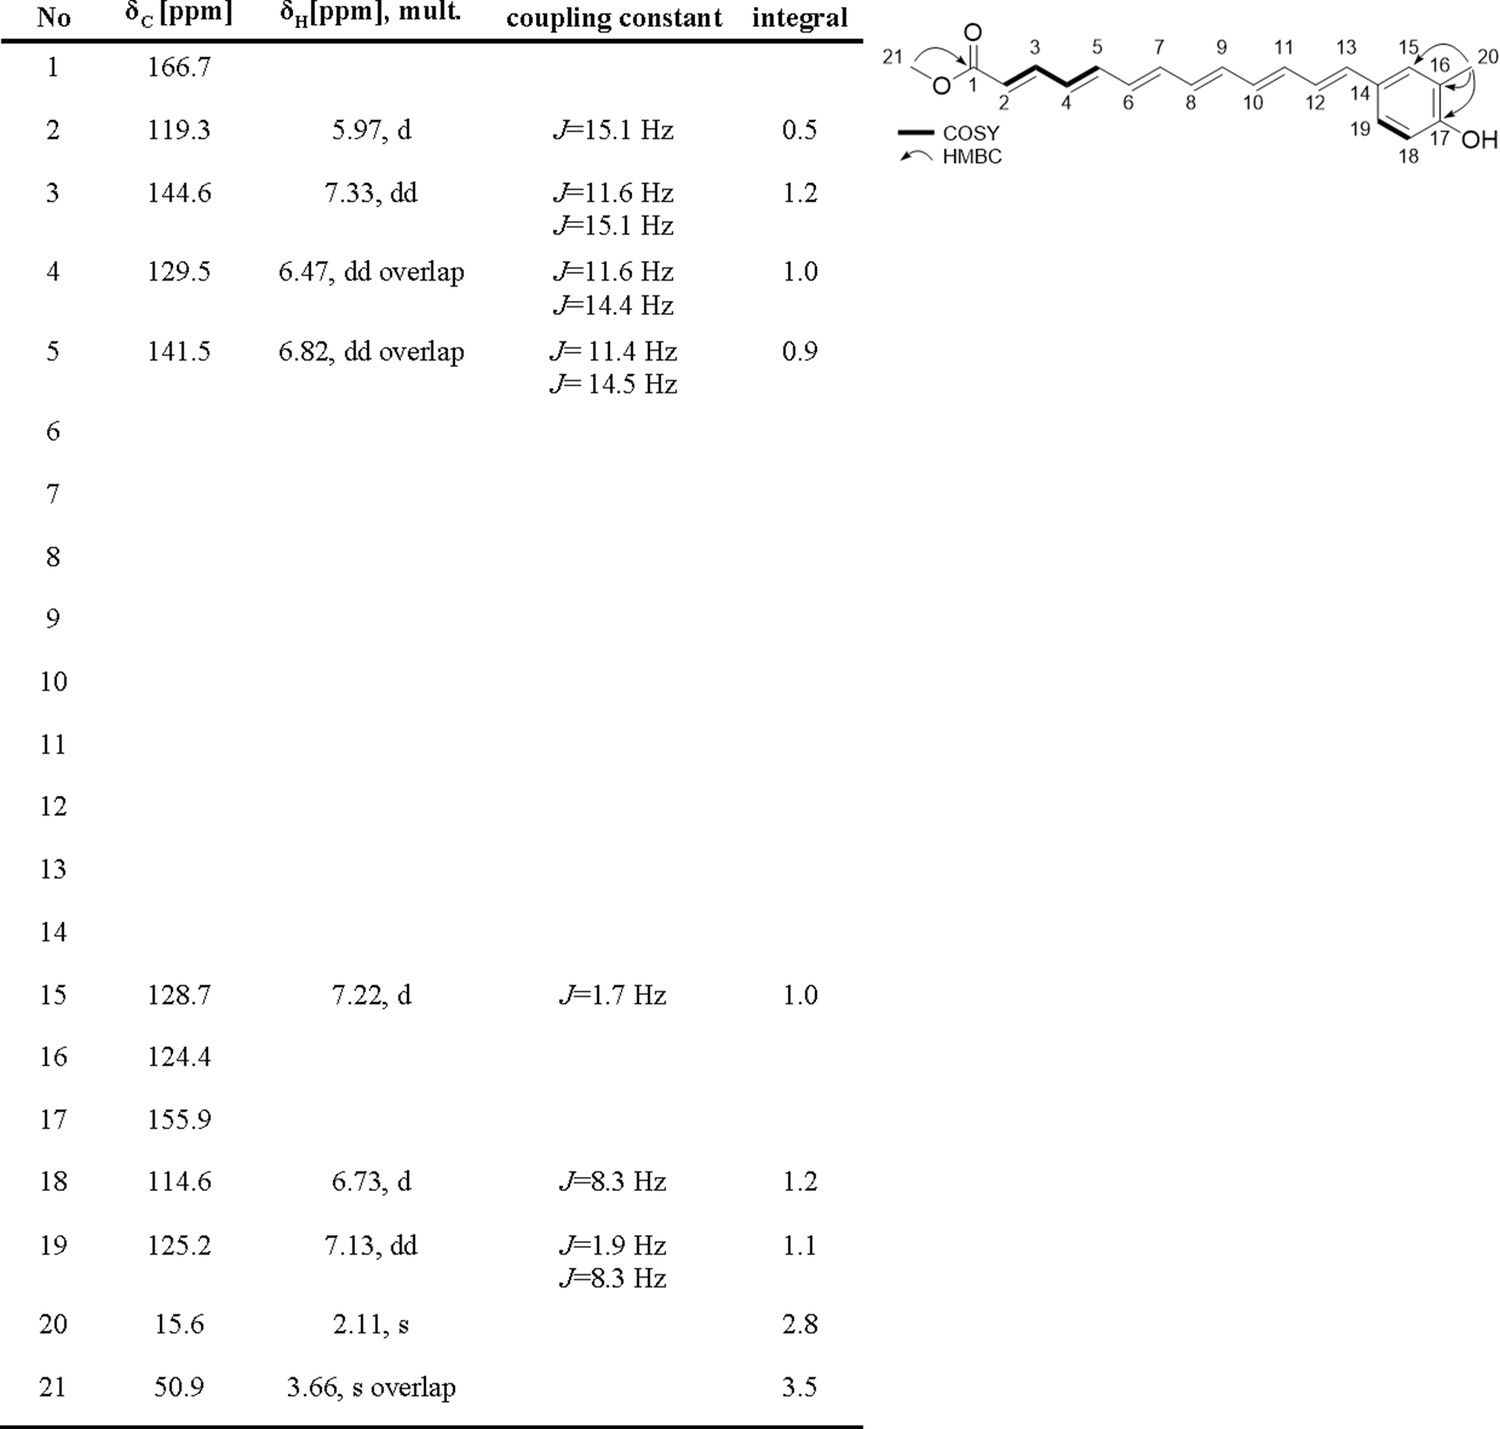
Chemical shifts of enriched aryl polyene in DMSO-δ6 at 298 K.
Key COSY and HMBC correlation of the enriched polyene.
Figure 2—figure supplement 11

HPLC-High Resolution electrospray ionisation mass spectrometry (HRESIMS) analysis of F. perrara and E. coli CFT073.
At 18.85 min, both extracts show strong absorbance at λ = 420 nm. The MS-MS fragmentation pattern of the ion m/z 323.1642 at that retention time shows a similar pattern in extracts from both strains.
Figure 3 with 1 supplement
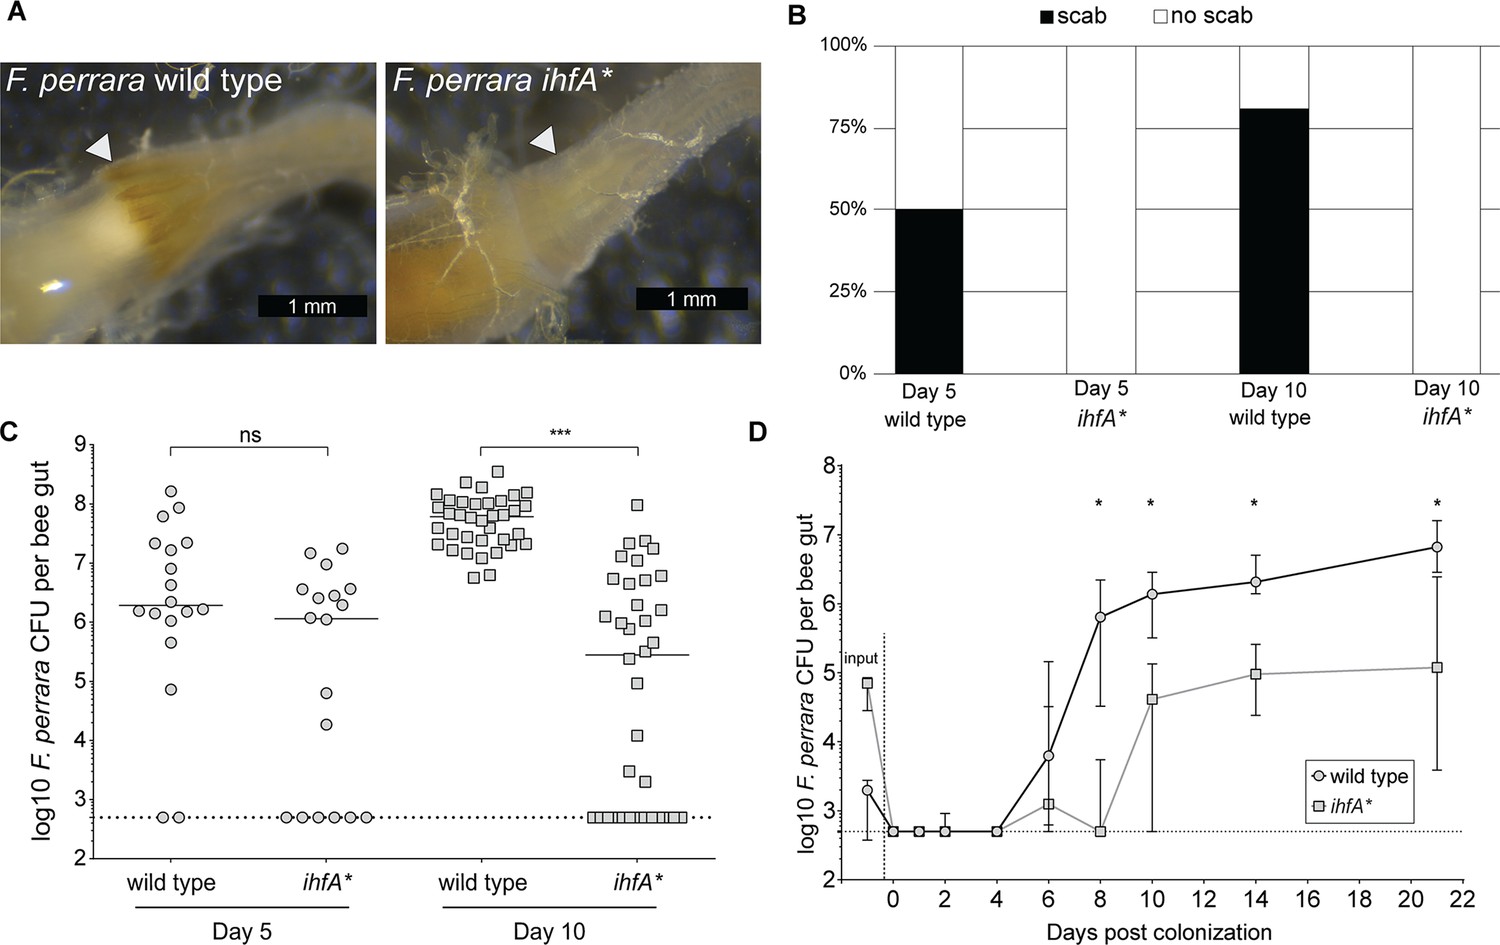
F. perrara ihfA* mutant displays a colonization defect.
(A) Light microscopy pictures of pylorus region of bees colonized with F. perrara PEB0191wt or ihfA* 10 d post colonization. (B) Quantification of scab phenotype of bees 5 and 10 d post colonization with n = 18 and n = 36 per treatment, respectively. (C) Quantification of colonization levels is measured by colony-forming units (CFUs) at day 5 (n = 18) and day 10 (n = 36) post colonization. Wilcoxon rank-sum test was used to assess significant differences. (D) Time-course experiment of bees colonized with F. perrara wt or ihfA*. Colonization levels were measured by CFUs every second day until day 10 and then at day 14 and day 21. n = 12 bees per time point per treatment. Wilcoxon rank-sum test was used to assess significant differences per time point. Error bars represent median and interquartile range. Data from three independent experiments. *p<0.05, **p<0.01, ***p<0.001. Figure 3—source data 1 contains the numeric values for the figures shown here.
-
Figure 3—source data 1
Numeric data underlying the results shown in Figure 3 and Figure 3—figure supplement 1.
- https://cdn.elifesciences.org/articles/76182/elife-76182-fig3-data1-v1.xlsx
Figure 3—figure supplement 1
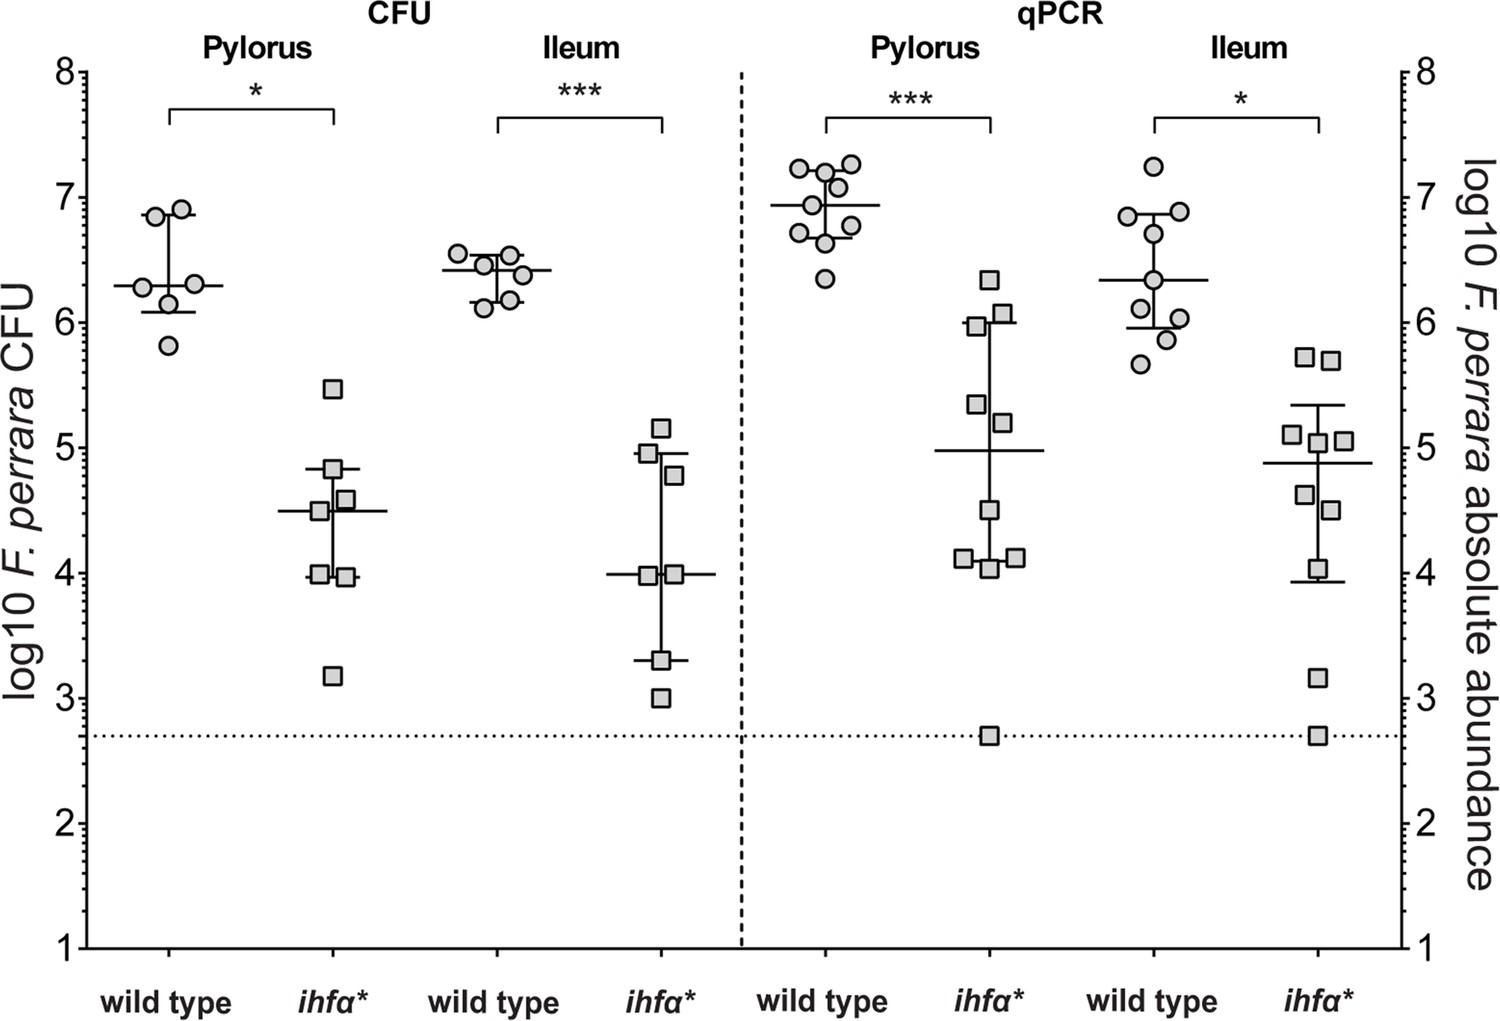
Quantification of F. perrara wt and ihfA* in the pylorus and ileum.
Mono-colonization of bees with F. perrara wt and ihfA*. Colonization levels are measured by colony-forming units (CFUs) and quantitative PCR (qPCR) 10 d post colonization in the specified gut regions: pylorus and ileum. Wilcoxon rank-sum test was used to assess the statistical significance of differences. n = 6. Figure 3—source data 1 contains the numeric values for the figure shown here.
Figure 4

Differential gene expression between F. perrara wt and ihfA* mutant during in vitro growth.
(A) Chromosomal localization of all genes significantly differentially expressed (2-log fold change = |2|, Fisher’s exact test p-value <0.05, false discovery rate [FDR] < 0.05) between F. perrara wt and the ihfA* mutant. Starting from outside, the first circle shows the scale of the genome representation of F. perrara in gray and white steps of 100 kb. The second and third circles (gray) depict the genes on the plus and minus strands of F. perrara. The fourth (beige) and fifth (light blue) circle depicts genes upregulated and downregulated in wt compared to ihfA*. Genomic islands are highlighted by coloration. (B) Bar plot of the genes differentially expressed between F. perrara wt and ihfA* with a log2-fold change > 2 (Fisher’s exact test p-value<0.05, FDR <0.05). (C) Comparison of the transcriptional profile of the genomic location encoding the colibactin biosynthetic gene cluster between F. perrara wt and the ihfA* mutant. Transcripts per million were visualized using the Integrative Genome Browser (Freese et al., 2016). The colibactin operon is schematically depicted below (green arrows). Figure 4—source data 1 and Figure 4—source data 2 contain the data used to produce the figure shown here.
-
Figure 4—source data 1
List of F. perrara genes differentially expressed in vitro.
- https://cdn.elifesciences.org/articles/76182/elife-76182-fig4-data1-v1.xlsx
-
Figure 4—source data 2
Clusters of orthologous groups for genes differentially expressed in vitro.
- https://cdn.elifesciences.org/articles/76182/elife-76182-fig4-data2-v1.xlsx
Figure 5 with 2 supplements
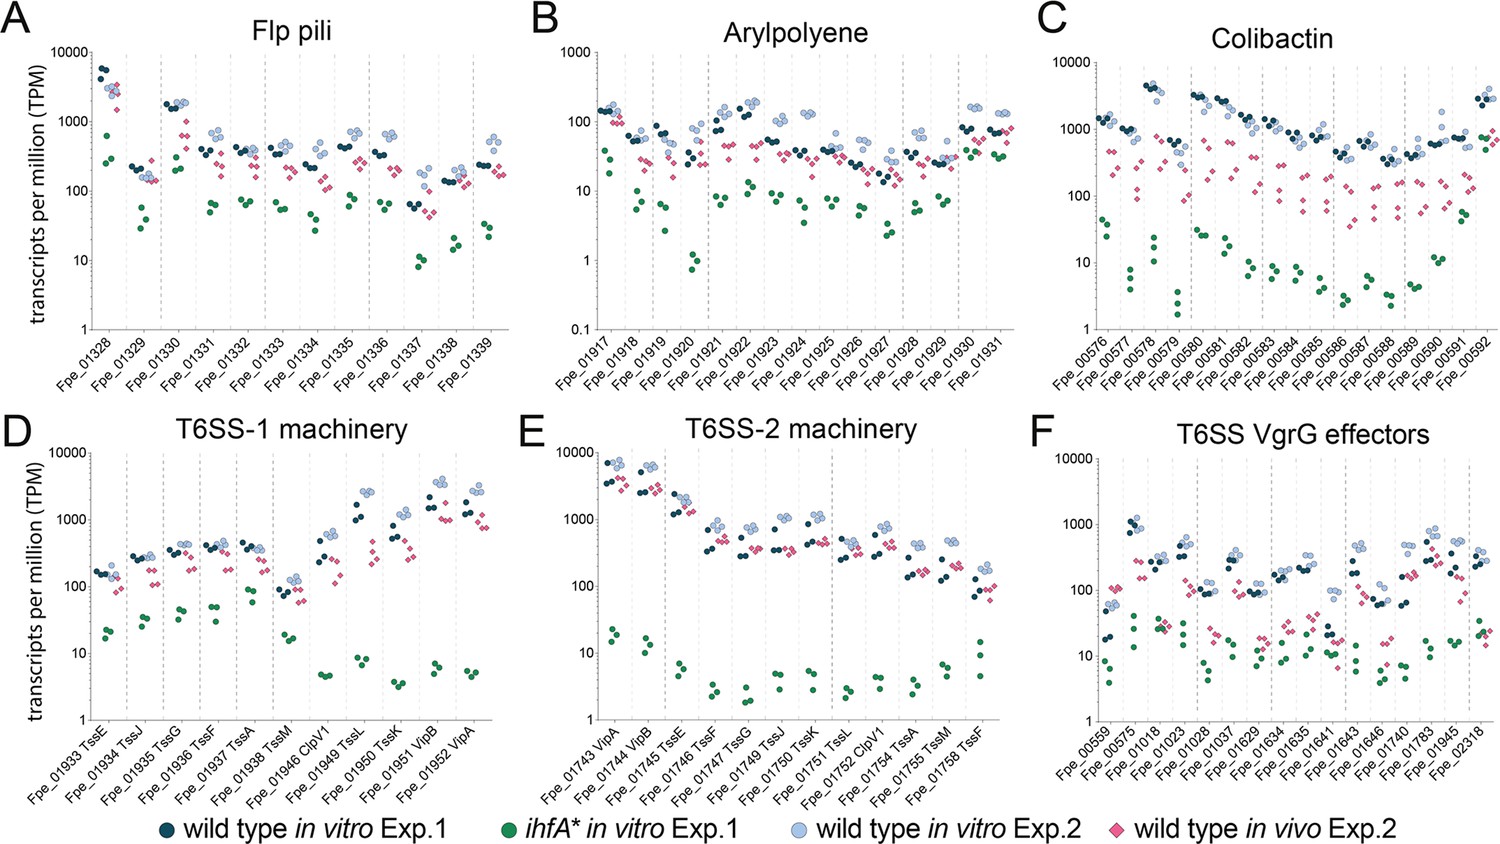
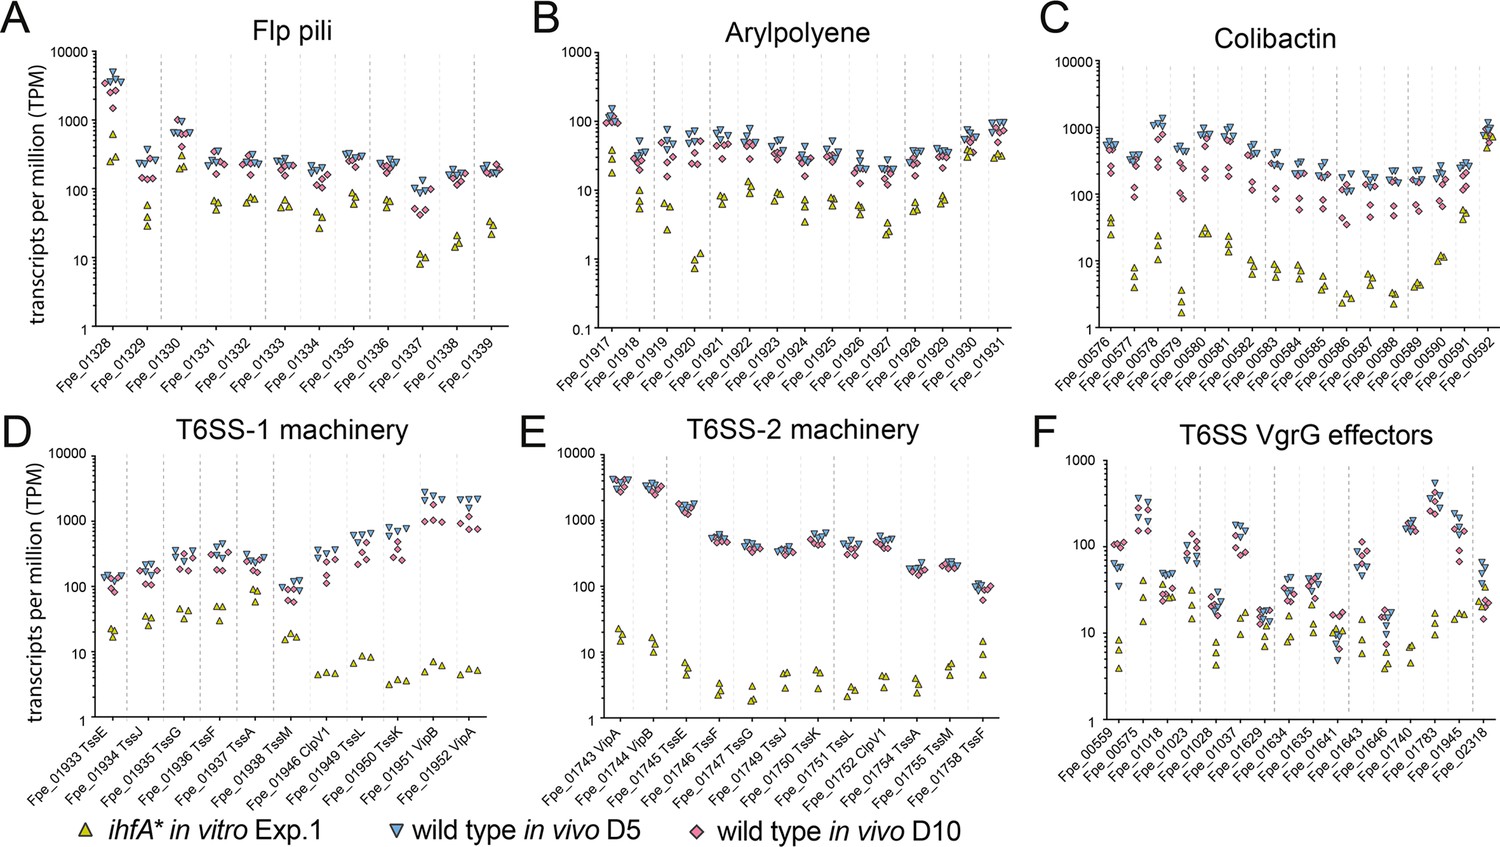
Gene expression of Ihf-regulated genes of F. perrara 10 d post inoculation of gnotobiotic honey bees.
Transcripts per million were calculated for all replicates of the in vitro and the in vivo RNAseq experiments. For the in vitro experiment (Exp. 1), all three replicates of the wt and the ihfA* mutant are shown. For the in vivo experiment (Exp. 2), the four replicates of the day 10 time point and the in vitro reference condition are shown. Data for day 5 time point in comparison to day 10 time point is shown in Figure 5—figure supplement 2. Figure 5—source data 1 and Figure 5—source data 2 contain the data used to generate the figure shown here. (A-F) The expression of Flp pili genes (A), genes involved in the synthesis of Arylpolyene (B) and Colibactin (C) and genes involved in the function of T6SSs (D-F) is shown.
-
Figure 5—source data 1
List of F. perrara genes differentially expressed in vivo.
- https://cdn.elifesciences.org/articles/76182/elife-76182-fig5-data1-v1.xlsx
-
Figure 5—source data 2
Clusters of orthologous groups for genes differentially expressed in vivo.
- https://cdn.elifesciences.org/articles/76182/elife-76182-fig5-data2-v1.xlsx
Figure 5—figure supplement 1
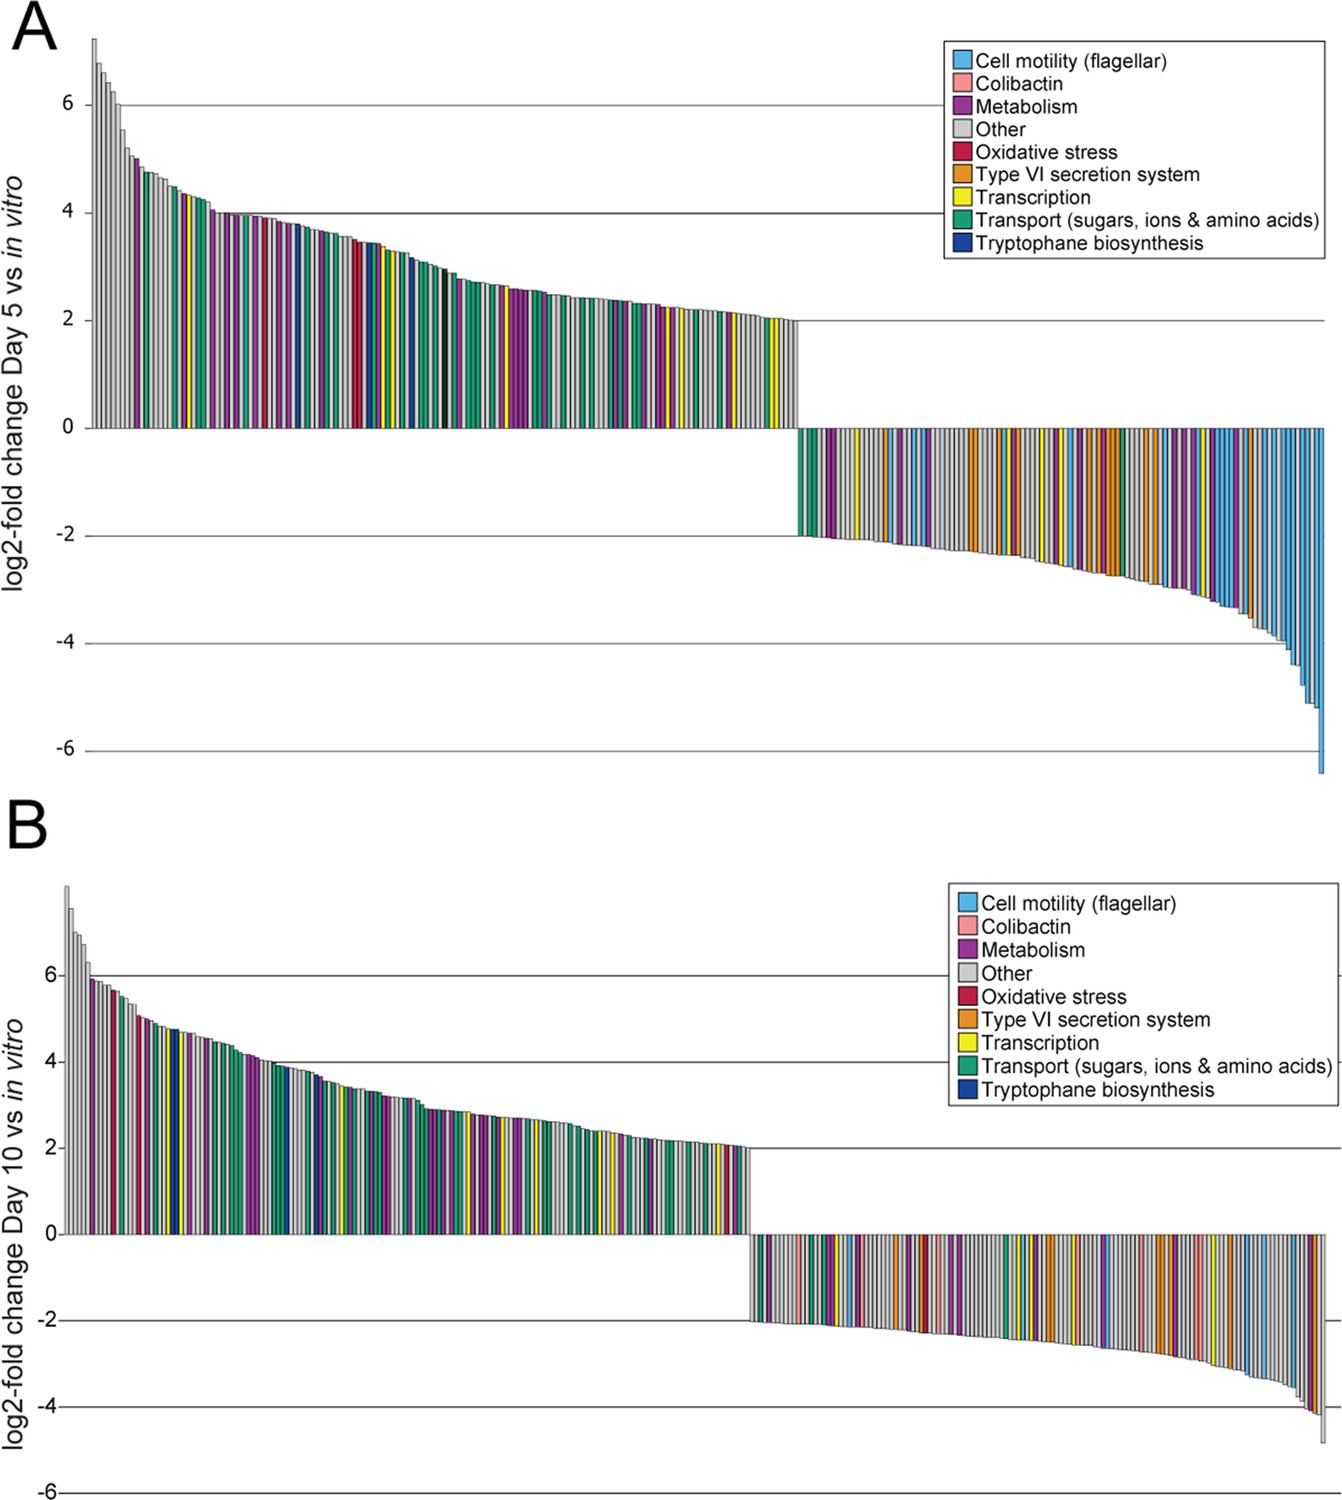
RNAseq comparison of F. perrara during in vivo colonization compared to growth in vitro.
Significantly differentially expressed genes with a |log2-fold change| >|2| of F. perrara PEB0191 wt at day 5 (A) and day 10 (B) post colonization in comparison to growth in vitro. Genes are colored according to their category. The experiment was performed in quadruplicates, all genes displayed were significantly differentially expressed with p<0.05 and a false discovery rate (FDR) < 0.05 (exact test).
Figure 5—figure supplement 2
Gene expression of Ihf-regulated genes of F. perrara 5 d post inoculation of gnotobiotic honey bees.
Same as Figure 5, but only time point day 5 and day 10 are depicted in comparison to F. perrara ihfA* in vitro. (A-F) The expression of Flp pili genes (A), genes involved in the synthesis of Arylpolyene (B) and Colibactin (C), and genes involved in the function of T6SSs (D-F) are shown.
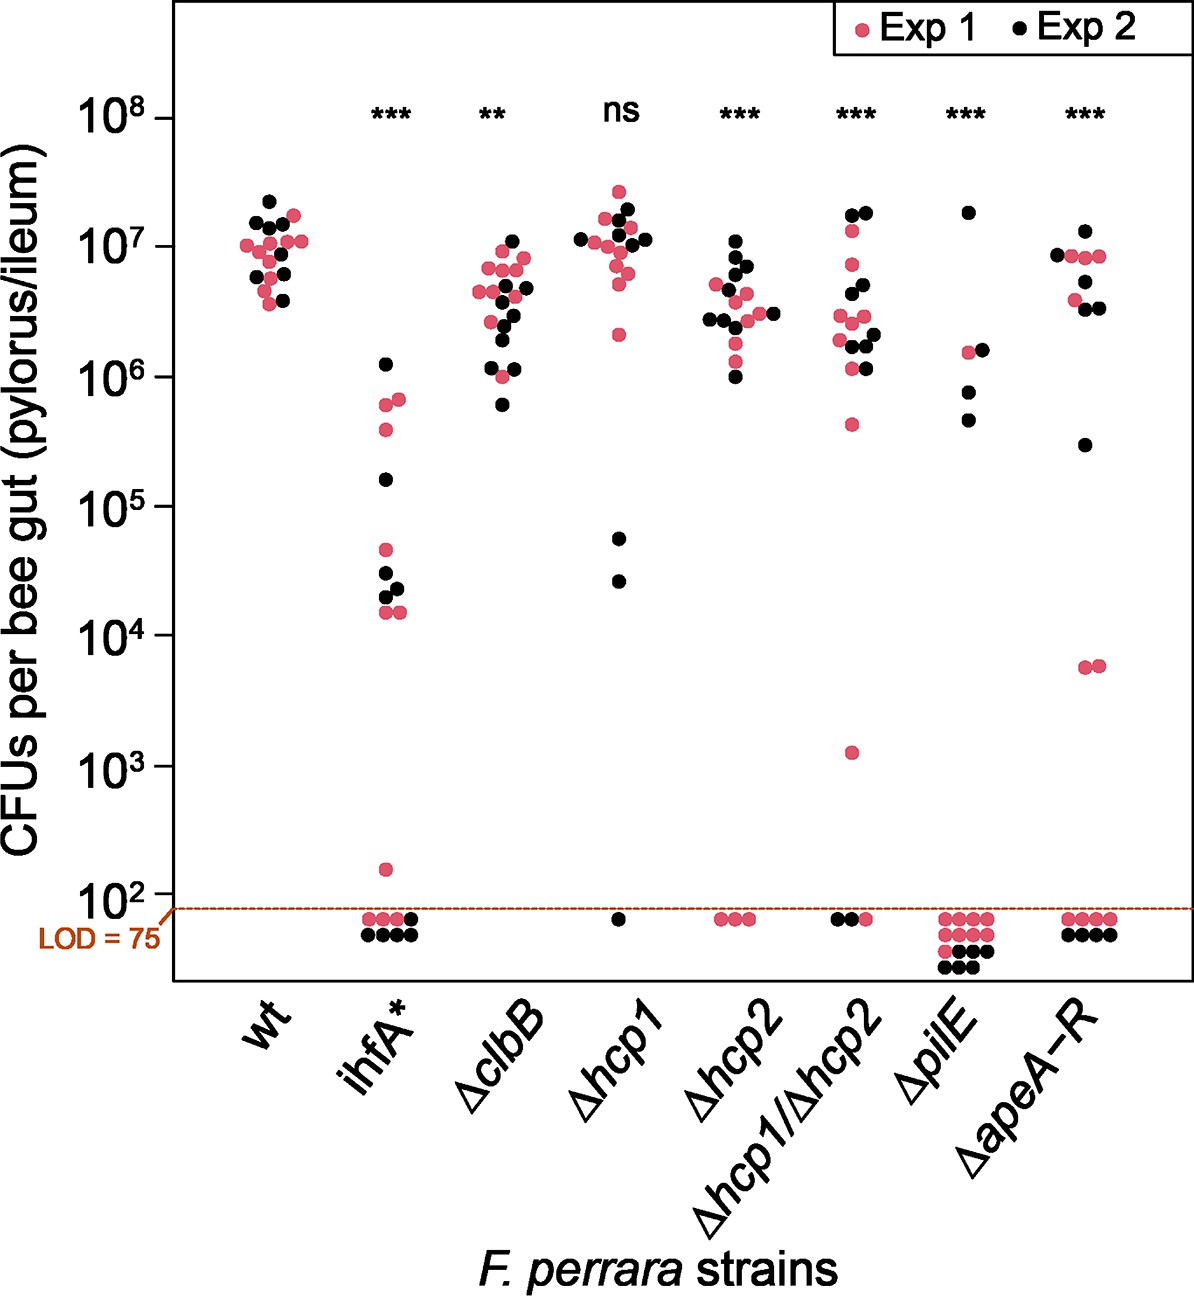
Figure 6 with 7 supplements
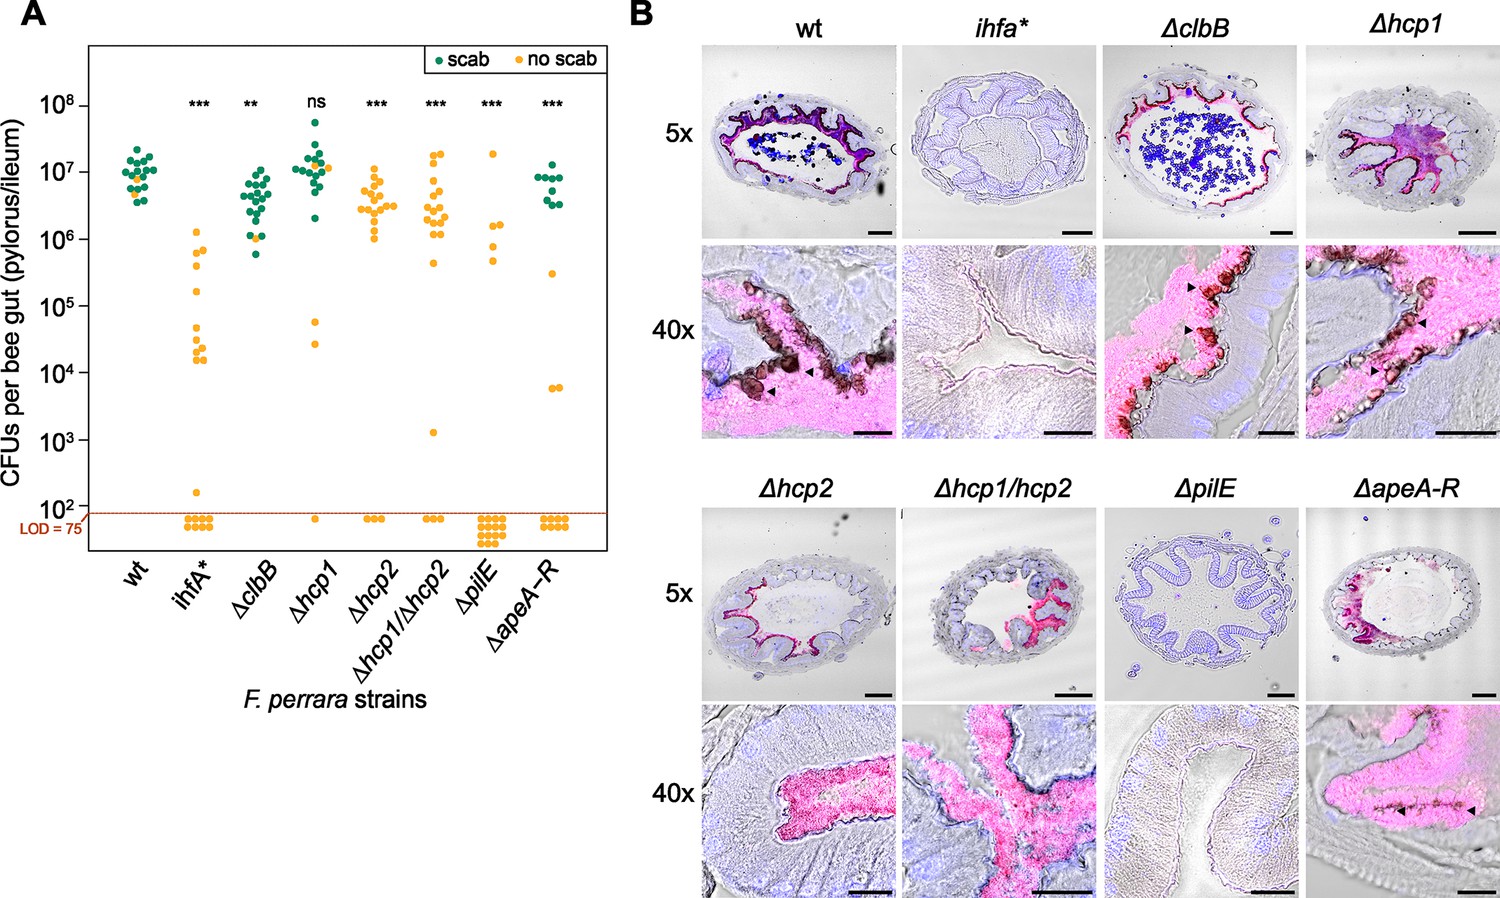
Gut colonization phenotypes of different gene-deletion mutants of F. perrara.
(A) Colonization levels were assessed 10 d after inoculation by counting colony-forming units (CFUs) in dilutions of homogenized bee guts plated on Brain Heart Infusion (BHI) agar. Only the pylorus and ileum section of the gut were analyzed. Limit of detection (LOD) corresponds to the lowest colonization level detectable in our assay, that is, points below the LOD correspond to bees for which no CFUs were detected. Statistically significant differences of the colonization levels of each mutant relative to the wt of F. perrara were determined using the Wilcoxon rank-sum test with BH correction. Bees were inoculated with an OD600 of 0.1. Data come from two independent experiments. Figure 6—figure supplement 5 shows the data points by experiments. *p<0.05, **p<0.01, ***p<0.001. Filled circle colors indicate whether a scab was detected during dissection (green = scab; yellow = no scab). (B) Location within the pylorus was assessed using FISH microscopy. Bees were inoculated with different F. perrara genotypes at OD600 = 0.1, guts were dissected at day 10 after inoculation and sectioned using a microtome. Hybridizations were done with probes specific for F. perrara (magenta). DAPI counterstaining of host nuclei and bacteria is shown in blue. Images were generated by merging brightfield, F. perrara and DAPI images that were obtained for the same section of the gut. The composite images here shown were obtained by merging the images of each channel presented in Figure 6—figure supplements 6 and 7. These were obtained using the ×5 and ×40 objectives of the Zeiss LSM900. Scale bar for images obtained with ×5: 100 µm, for ×40: 20 µm. Figure 6—source data 1 contains the numeric values used to generate (A).
-
Figure 6—source data 1
Numeric data underlying the results shown in Figure 6 and Figure 6—figure supplements 3–5.
- https://cdn.elifesciences.org/articles/76182/elife-76182-fig6-data1-v1.xlsx
Figure 6—figure supplement 1

Scheme of the gene-deletion strategy based on a two-step homologous recombination procedure.
(A) A non-replicative plasmid pKS2 integrates via homologous recombination of one of the two cloned ‘homology regions’ (HRs) upstream or downstream of the gene that is targeted for deletion. (B) In a second step, a replicative plasmid harboring the restriction enzyme I-SceI is transformed. I-SceI targets corresponding recognition sites located on pKS2 resulting in the selection of either revertant (wt genotypes) or mutant genotypes that underwent a second homologous recombination event in the region targeted for deletion. PCR screening and replica plating on different selective allows to identify to correct clones.
Figure 6—figure supplement 2

Growth curves for the different Frischella strains.
(A) The six gene-deletion mutants, ihfA*, and wt strains were diluted to OD600 = 0.05 and grown in Brain Heart Infusion (BHI) under anaerobic conditions at 35°C with continuous agitation. Absorbance was measured every 20 min for 48 hr. Per strain, four technical replicates were performed. (B) Max growth curve was calculated using the R package ‘growthcurver.’ For the hcp2 mutant, only three technical replicates were considered due to a contamination in one of the technical replicates. Figure 6—source data 1 contains the numeric values for the figures shown here.
Figure 6—figure supplement 3
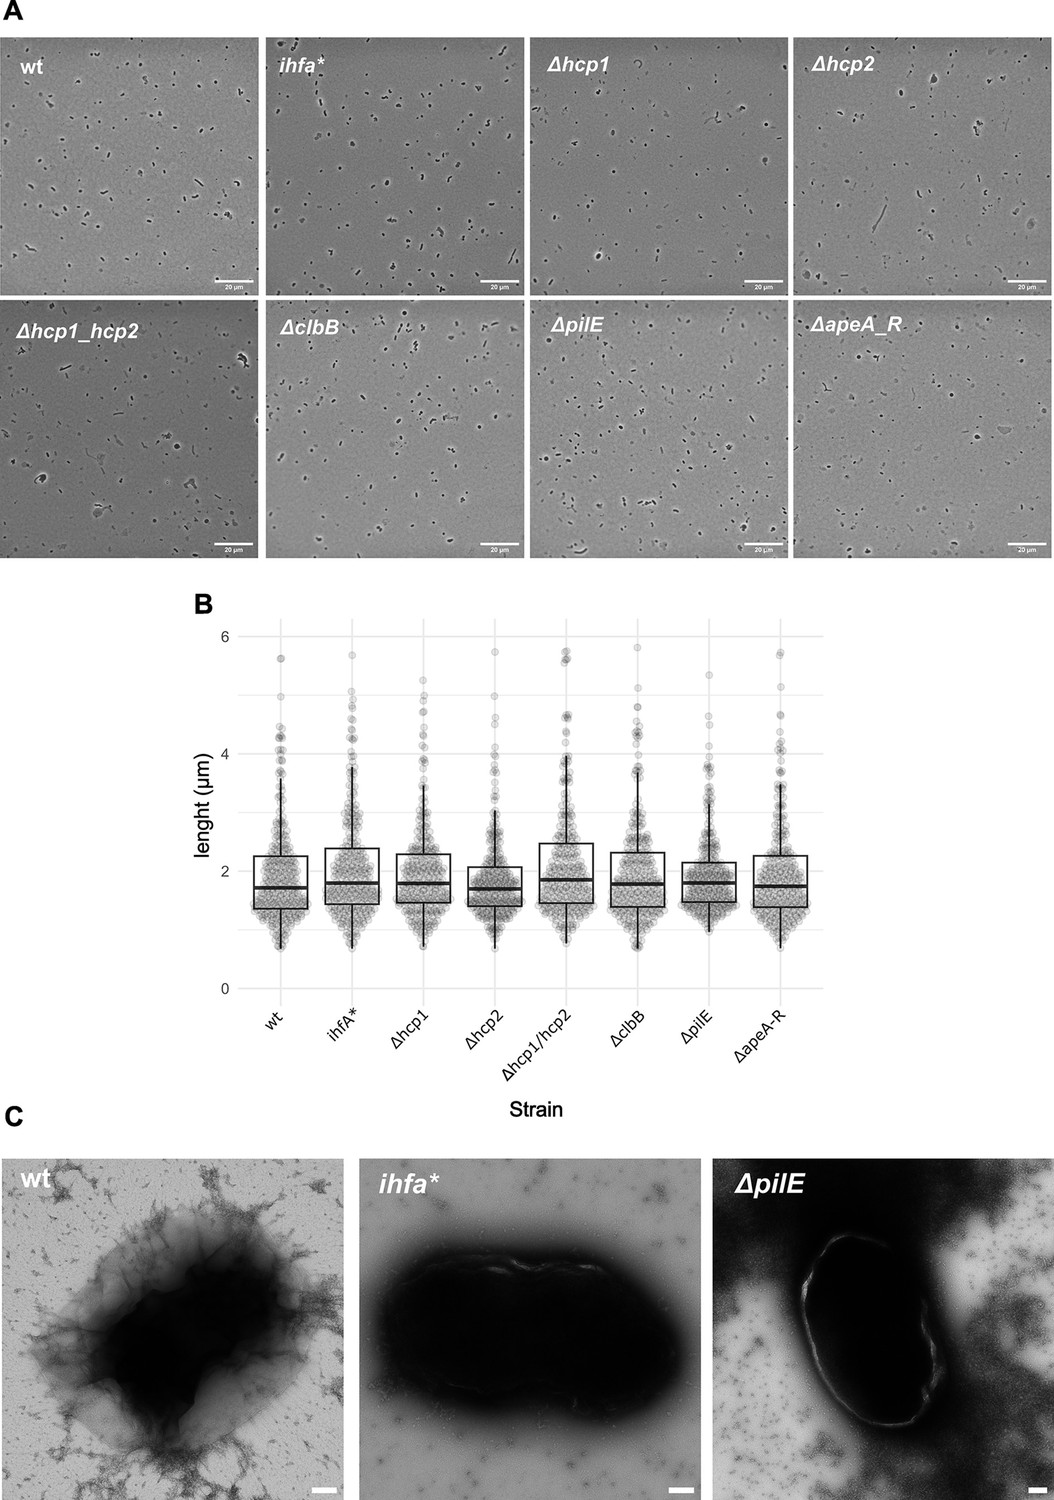
Single-cell imaging of F. perrara strains.
(A) The six gene-deletion mutants, ihfA*, and wt F. perrara strains were grown in liquid Brain Heart Infusion (BHI), diluted to OD600 = 0.1, plated in agar patches and imaged using a Nikon Ti inverted light microscope. Images were taken with a ×100 objective. Scale bar indicates 20 µm. (B) Cell length was quantified using the MicrobeJ plugin of ImageJ. (C) Electron microscopy images were obtained for the wt, ihfA*, and ΔpilE strains. Scale bar indicates 200 nm. Figure 6—source data 1 contains the numeric values for the figures shown here.
Figure 6—figure supplement 4

Correspondence between OD and colony-forming unit (CFU) for F. perrara genotypes.
For each F. perrara strain, a bacterial solution at OD600 = 0.1 was prepared, serially diluted, and plated in BHIA medium. The number of CFUs present in 5 µl of solution at OD600 = 0.1 was calculated based on the counts obtained from the serial dilutions. Statistics were calculated using a linear model with negative binomial distribution: ***p<0.0001, **p<0.001. Figure 6—source data 1 contains the numeric values for the figures shown here.
Figure 6—figure supplement 5
Same graph as shown in Figure 6 but data points are labeled by experiment.
Figure 6—source data 1 contains the numeric values for the figures shown here.
Figure 6—figure supplement 6
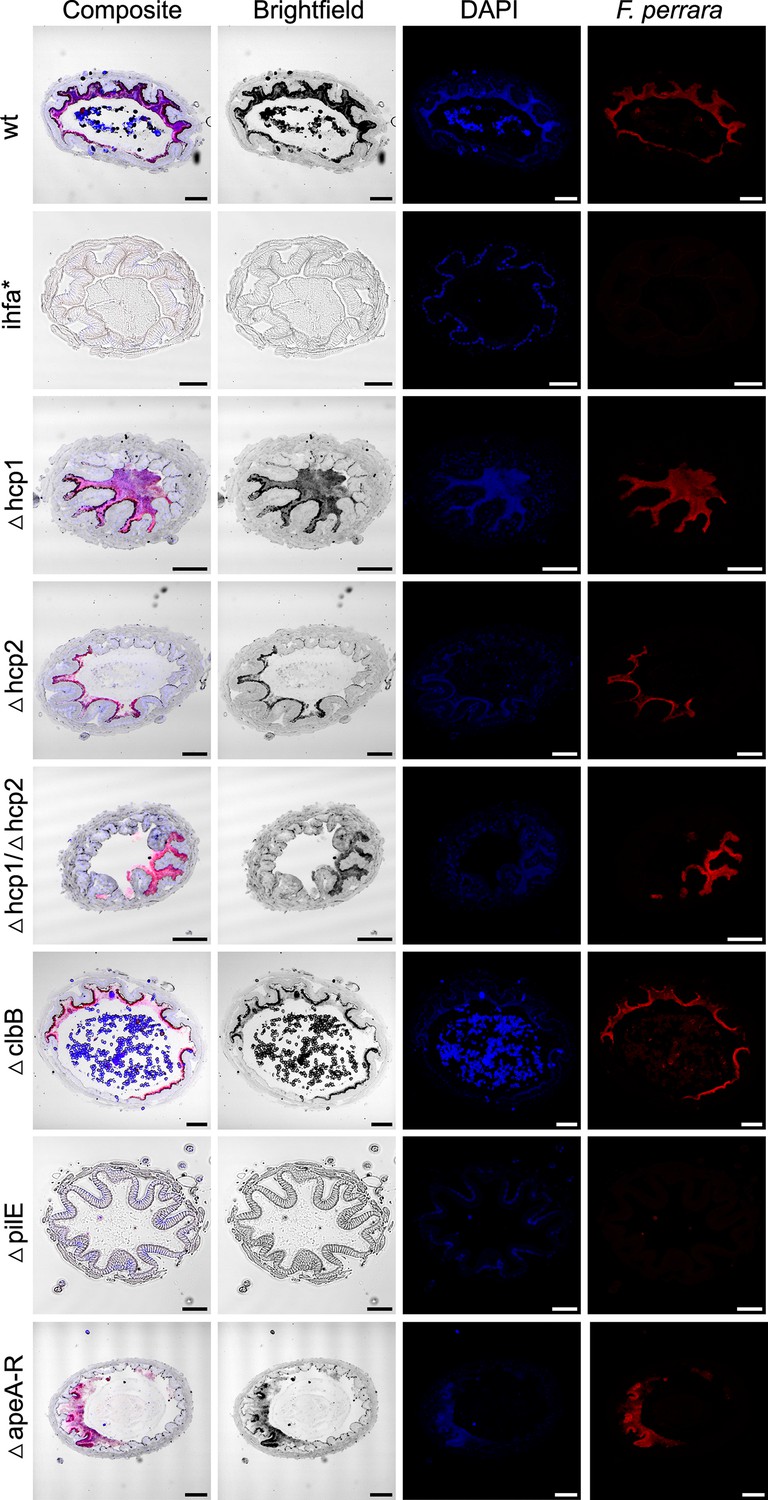
F. perrara colonization of the pylorus.
Composite images are the same as in Figure 6. These were obtained by merging the brightfield, DAPI, and F. perrara probe individual images. Images were obtained with the ×5 objective of the Zeiss LSM900. Hybridizations were done with probes specific for F. perrara (magenta). DAPI counterstaining of host nuclei and bacteria is shown in blue. The scale bar correspons to 100 µm.
Figure 6—figure supplement 7
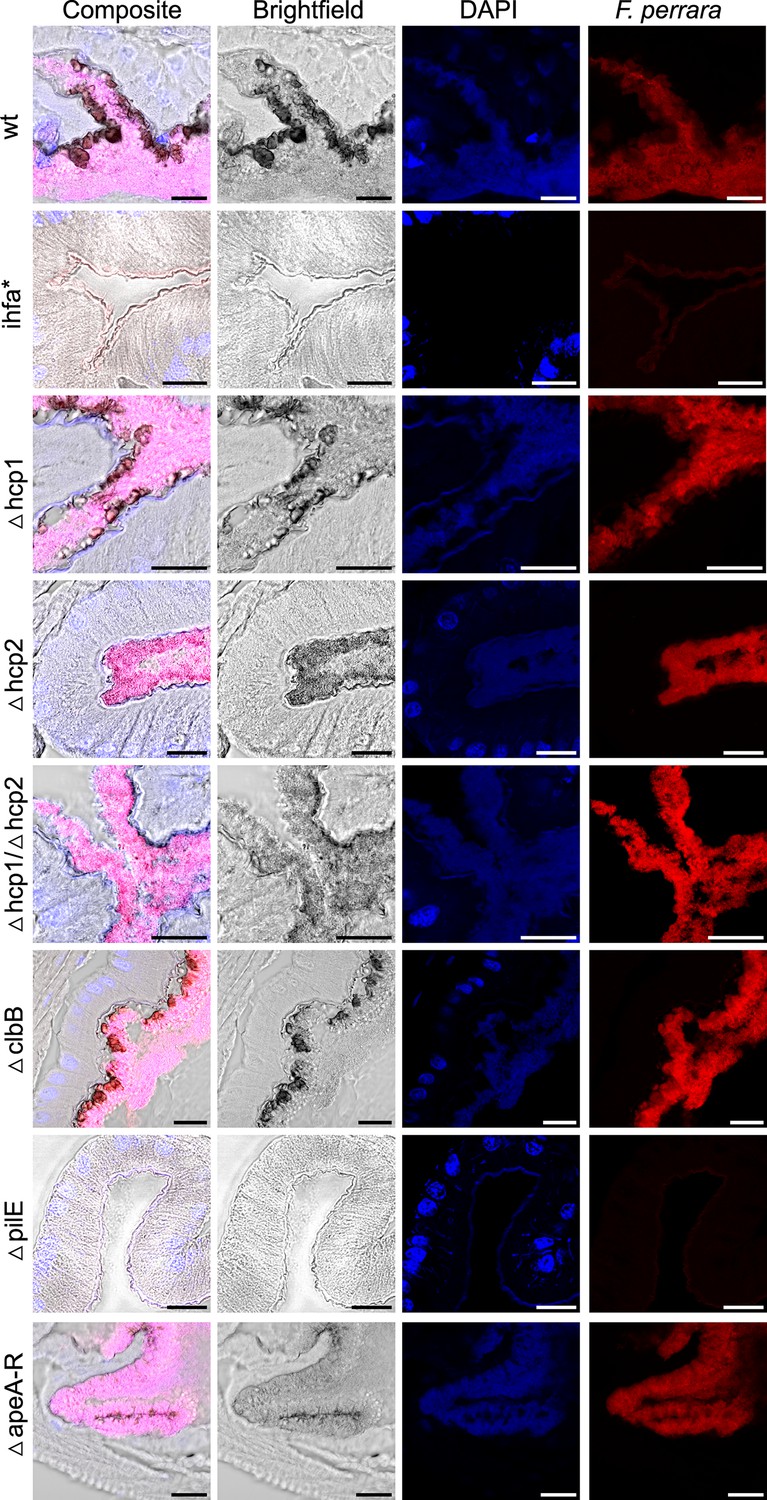
F. perrara colonization of the pylorus.
Composite images are the same as in Figure 6. These were obtained by merging the brightfield, DAPI and F. perrara probe images. Images were obtained with the ×40 objective of the Zeiss LSM900. Hybridizations were done with probes specific for F. perrara (magenta). DAPI counterstaining of host nuclei and bacteria is shown in blue. The scale bar corresponds to 20 µm.
Figure 7 with 1 supplement
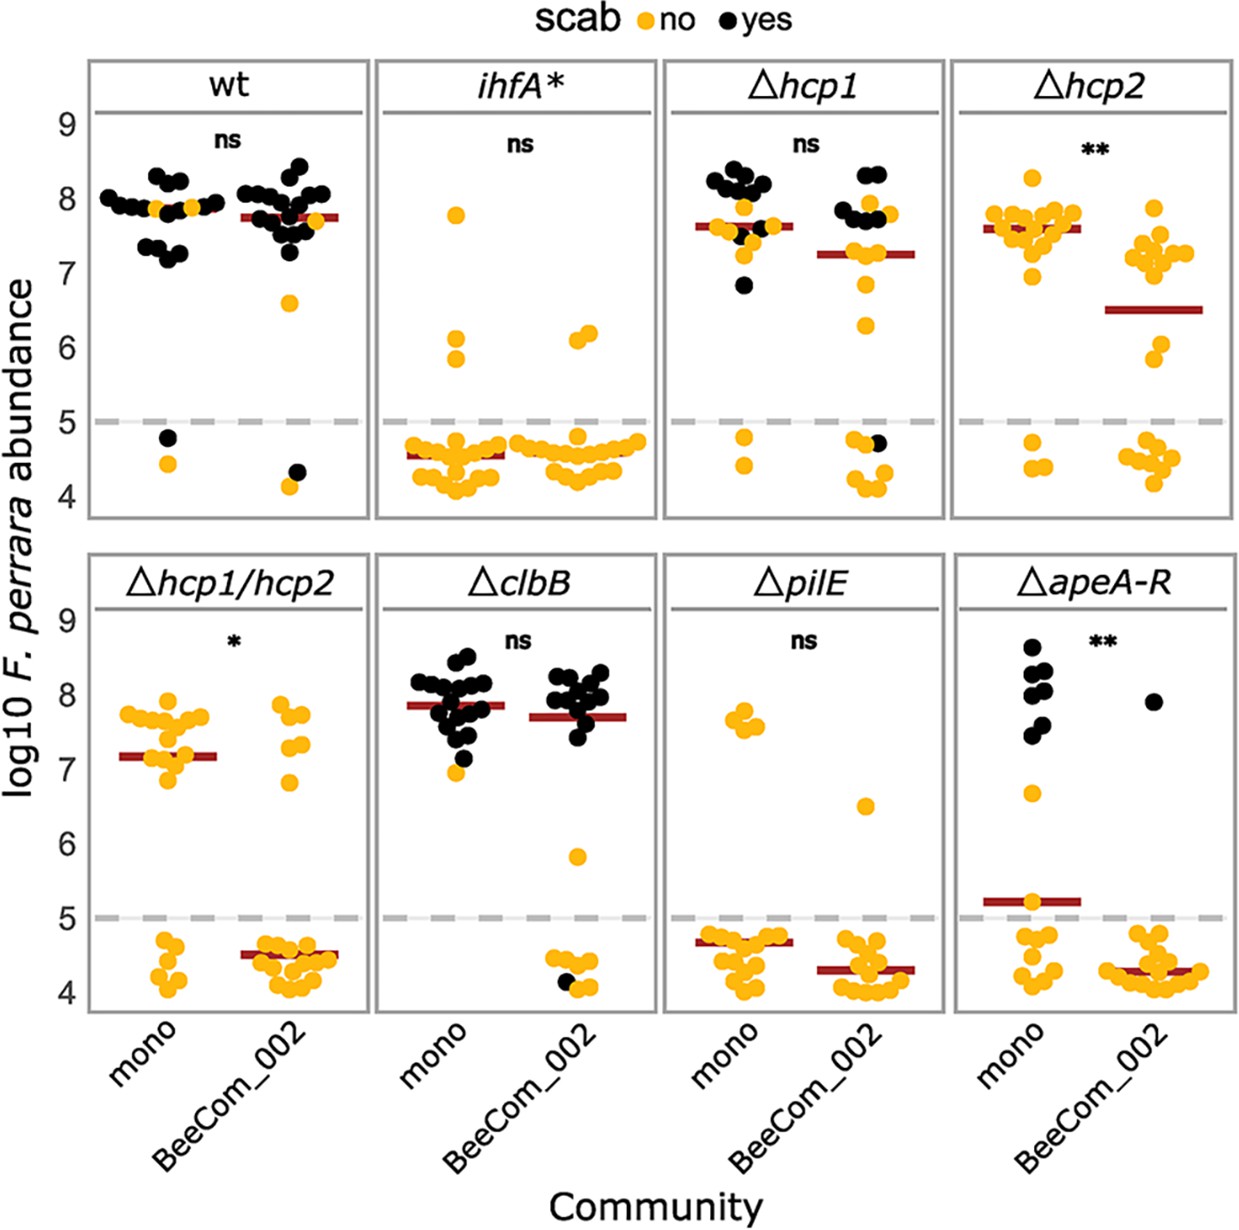
Gut colonization of the gene-deletion mutants in the presence of bacterial competition.
Bees were inoculated with F. perrara alone (mono) or in the presence of a defined bacterial community representing core members of the bee gut microbiota (BeeCom_002). Colonization levels were assessed 10 d after inoculation by qPCR. Only the pylorus and ileum section of the gut were analyzed. The dashed gray line refers to the limit of detection (LOD) and corresponds to the lowest colonization level detectable in our assay, that is, points below the LOD correspond to bees for which no F. perrara was detected. Statistically significant differences between the colonization levels of each mutant in mono-association compared to in the presence of the defined microbial community were determined using the Wilcoxon rank-sum test with BH correction. Data comes from two independent experiments. Figure 7—figure supplement 1A shows the data points colored by experiments. *p<0.05, **p<0.01, ***p<0.001. Filled circle colors indicate whether a scab was detected during dissection (black = scab; yellow = no scab). Figure 7—source data 1 contains the numeric values used to generate Figure 6A.
-
Figure 7—source data 1
Numeric data underlying the results shown in Figure 7 and Figure 7—figure supplement 1.
- https://cdn.elifesciences.org/articles/76182/elife-76182-fig7-data1-v1.xlsx
Figure 7—figure supplement 1
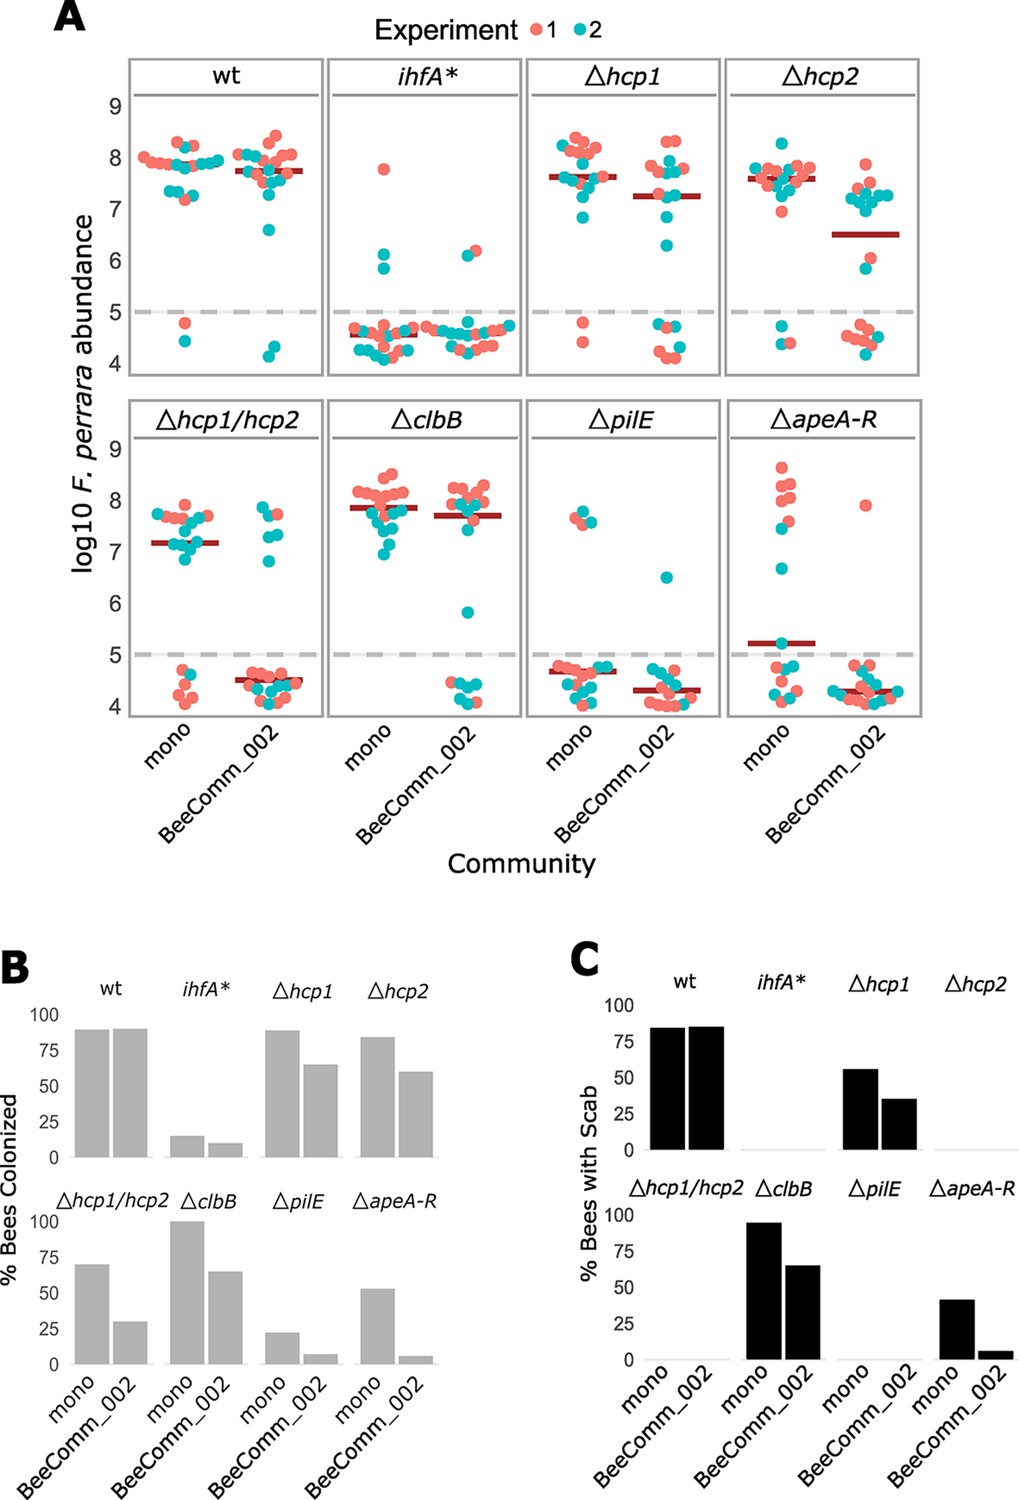
Colonization of wt, ihfa, and gene-deletion mutants of F. perrara.
(A) Same graph as shown in Figure 7 but data points are labeled by experiment. (B) Percentage of bees that had colonization levels above the limit of detection. (C) Percentage of guts that had a scab. Figure 7—source data 1 contains the numeric values for the figures shown here.
Tables
Key resources table
| Reagent type (species) or resource | Designation | Source or reference | Identifiers | Additional information |
|---|---|---|---|---|
| Strain, strain background (Frischella perrara) | Frischella perrara wt | Engel et al., 2013 (10.1099/ijs.0.049569-0) | PEB0191 or ESL0157 | Type strain of Frischella perrara isolated from Apis mellifera |
| Genetic reagent (F. perrara) | Frischella perrara ihfA* | This study | ESL0158 | Spontaneous P83L mutation (CCA→CTA) in ihfA in the wt background; mutated gene: Fpe_00769 |
| Genetic reagent (F. perrara) | Frischella perrara ΔapeO ihfB* | This study | ESL0910 | Spontaneous P82L mutation (CCA→CTA) in ihfB in a ΔapeO background, mutated genes: Fpe_00778 and Fpe_01928 |
| Genetic reagent (F. perrara) | Frischella perrara ΔapeE ihfA* | This study | ESL0922 | Spontaneous L38S mutation (TTA→TCA) in ihfA in a ΔpilE background, mutated genes: Fpe_00769 and Fpe_01328 |
| Genetic reagent (F. perrara) | Frischella perrara Δhcp1 | This study | ESL0854 | In-frame deletion of T6SS gene hcp1 in wt background; locus_tag of gene: Fpe_01742 |
| Genetic reagent (F. perrara) | Frischella perrara Δhcp2 | This study | ESL0855 | In-frame deletion of T6SS gene hcp2 in wt background; locus_tag of gene: Fpe_01942 |
| Genetic reagent (F. perrara) | Frischella perrara Δhcp1/Δhcp2 | This study | ESL0856 | In-frame deletion of of hcp1 and hcp2 of both T6SSs in wt background; locus_tags of genes: Fpe_01742 and Fpe_01942 |
| Genetic reagent (F. perrara) | Frischella perrara ΔclbB | This study | ESL0888 | In-frame deletion of clbB of the colibactin genomic island in wt background; locus_tag of gene: Fpe_00576 |
| Genetic reagent (F. perrara) | Frischella perrara ΔpilE | This study | ESL0921 | In-frame deletion of pilE of the Flp pili in wt background; locus_tag of gene: Fpe_01328 |
| Genetic reagent (F. perrara) | Frischella perrara ΔapeA-R | This study | ESL0957 | In-frame deletion of the aryl polyeene biosynthetic gene cluster in wt background; locus_tags of genes: Fpe_01915–1932 |
| Strain, strain background (Snodgrassella alvi) | Snodgrassella alvi wkB2 | Kwong and Moran, 2013 (10.1099/ijs.0.044875-0, 23041637) | wkB2 or ESL0145 | Community member of BeeComm_002; type strain of Snodgrassella alvi |
| Strain, strain background (Gilliamella apicola) | Gilliamella apicola wkB1 | Kwong and Moran, 2013 (10.1099/ijs.0.044875-0, 23041637) | ESL0309 | Community member of BeeComm_002; Apis mellifera isolate of Gilliamella apicola |
| Strain, strain background (Gilliamella apis) | Gilliamella apis ESL0178 | Ellegaard and Engel, 2018 (10.1128/MRA.00834-18) | ESL0178 | Community member of BeeComm_002; Apis mellifera isolate of Gilliamella apis |
| Strain, strain background (Gilliamella sp.) | Gilliamella sp. ESL0177 | Ellegaard and Engel, 2018 (10.1128/MRA.00834-18) | ESL0177 | Community member of BeeComm_002; Apis mellifera isolate of Gilliamella sp. |
| Strain, strain background (Bartonella apis) | Bartonella apis ESL0024 | Segers et al., 2017 (10.1038/ismej.2016.201) | ESL0024 | Community member of BeeComm_002; Apis mellifera isolate of Bartonella apis |
| Strain, strain background (Bifidobacterium asteroides) | Bifidobacterium asteroides ESL0197 | Ellegaard and Engel, 2018 (10.1128/MRA.00834-18) | ESL0197 | Community member of BeeComm_002; Apis mellifera isolate of Bifidobacterium asteroides |
| Strain, strain background (B. asteroides) | Bifidobacterium asteroides ESL0198 | (10.1128/MRA.00834-18) | ESL0198 | Community member of BeeComm_002; Apis mellifera isolate of Bifidobacterium asteroides |
| Strain, strain background (Lactobacillus Firm5) | Lactobacillus Firm5 ESL0185 | Ellegaard and Engel, 2018 (10.1128/MRA.00834-18) | ESL0185 | Community member of BeeComm_002; Apis mellifera isolate of Lactobacillus Firm5 |
| Strain, strain background (Lactobacillus Firm5) | Lactobacillus Firm5 ESL0183 | Ellegaard and Engel, 2018 (10.1128/MRA.00834-18) | ESL0183 | Community member of BeeComm_002; Apis mellifera isolate of Lactobacillus Firm5 |
| Strain, strain background (Lactobacillus Firm5) | Lactobacillus Firm5 ESL0184 | Ellegaard and Engel, 2018 (10.1128/MRA.00834-18) | ESL0184 | Community member of BeeComm_002; Apis mellifera isolate of Lactobacillus Firm5 |
| Strain, strain background (Lactobacillus Firm5) | Lactobacillus Firm5 ESL0186 | Ellegaard and Engel, 2018 (10.1128/MRA.00834-18) | ESL0186 | Community member of BeeComm_002; Apis mellifera isolate of Lactobacillus Firm5 |
| Strain, strain background (Commensalibacter sp.) | Commensalibacter sp. ESL0284 | Ellegaard and Engel, 2018 (10.1128/MRA.00834-18) | ESL0284 | Community member of BeeComm_002; Apis mellifera isolate of Commensalibacter sp. |
| Sequence-based reagent | prPEN0013 | Zufelato et al., 2004 (10.1016/j.ibmb.2004.08.005) | Forward primer for Actin | TGCCAACACTGTCCTTTCTG |
| Sequence-based reagent | prPEN0014 | Zufelato et al., 2004 (10.1016/j.ibmb.2004.08.005) | Forward primer for Actin | AGAATTGACCCACCAATCCA |
| Sequence-based reagent | prLK-Frisch-042-F | Kešnerová et al., 2017 ( 10.1371/journal.pbio.2003467) | F. perrara 16S rRNA gene | GGAAGTTATGTGTGGGATAAGC |
| Sequence-based reagent | prLK-Frisch-043-R | Kešnerová et al., 2017 ( 10.1371/journal.pbio.2003467) | F. perrara 16S rRNA gene | CTATTCTCAGGTTGAGCCCG |
Additional files
Download links
A two-part list of links to download the article, or parts of the article, in various formats.
Downloads (link to download the article as PDF)
Open citations (links to open the citations from this article in various online reference manager services)
Cite this article (links to download the citations from this article in formats compatible with various reference manager tools)
Integration host factor regulates colonization factors in the bee gut symbiont Frischella perrara
eLife 12:e76182.
https://doi.org/10.7554/eLife.76182


