Network design principle for robust oscillatory behaviors with respect to biological noise
- Beijing International Center for Mathematical Research, Peking University, China
- Center for Quantitative Biology, Peking University, China
- Peking-Tsinghua Joint Center for Life Sciences, Academy for Advanced Interdisciplinary Studies, Peking University, China
- Center for Cell and Gene Circuit Design, CAS Key Laboratory of Quantitative Engineering Biology, Shenzhen Institute of Synthetic Biology, Shenzhen Institutes of Advanced Technology, Chinese Academy of Sciences, China
Figures
Figure 1
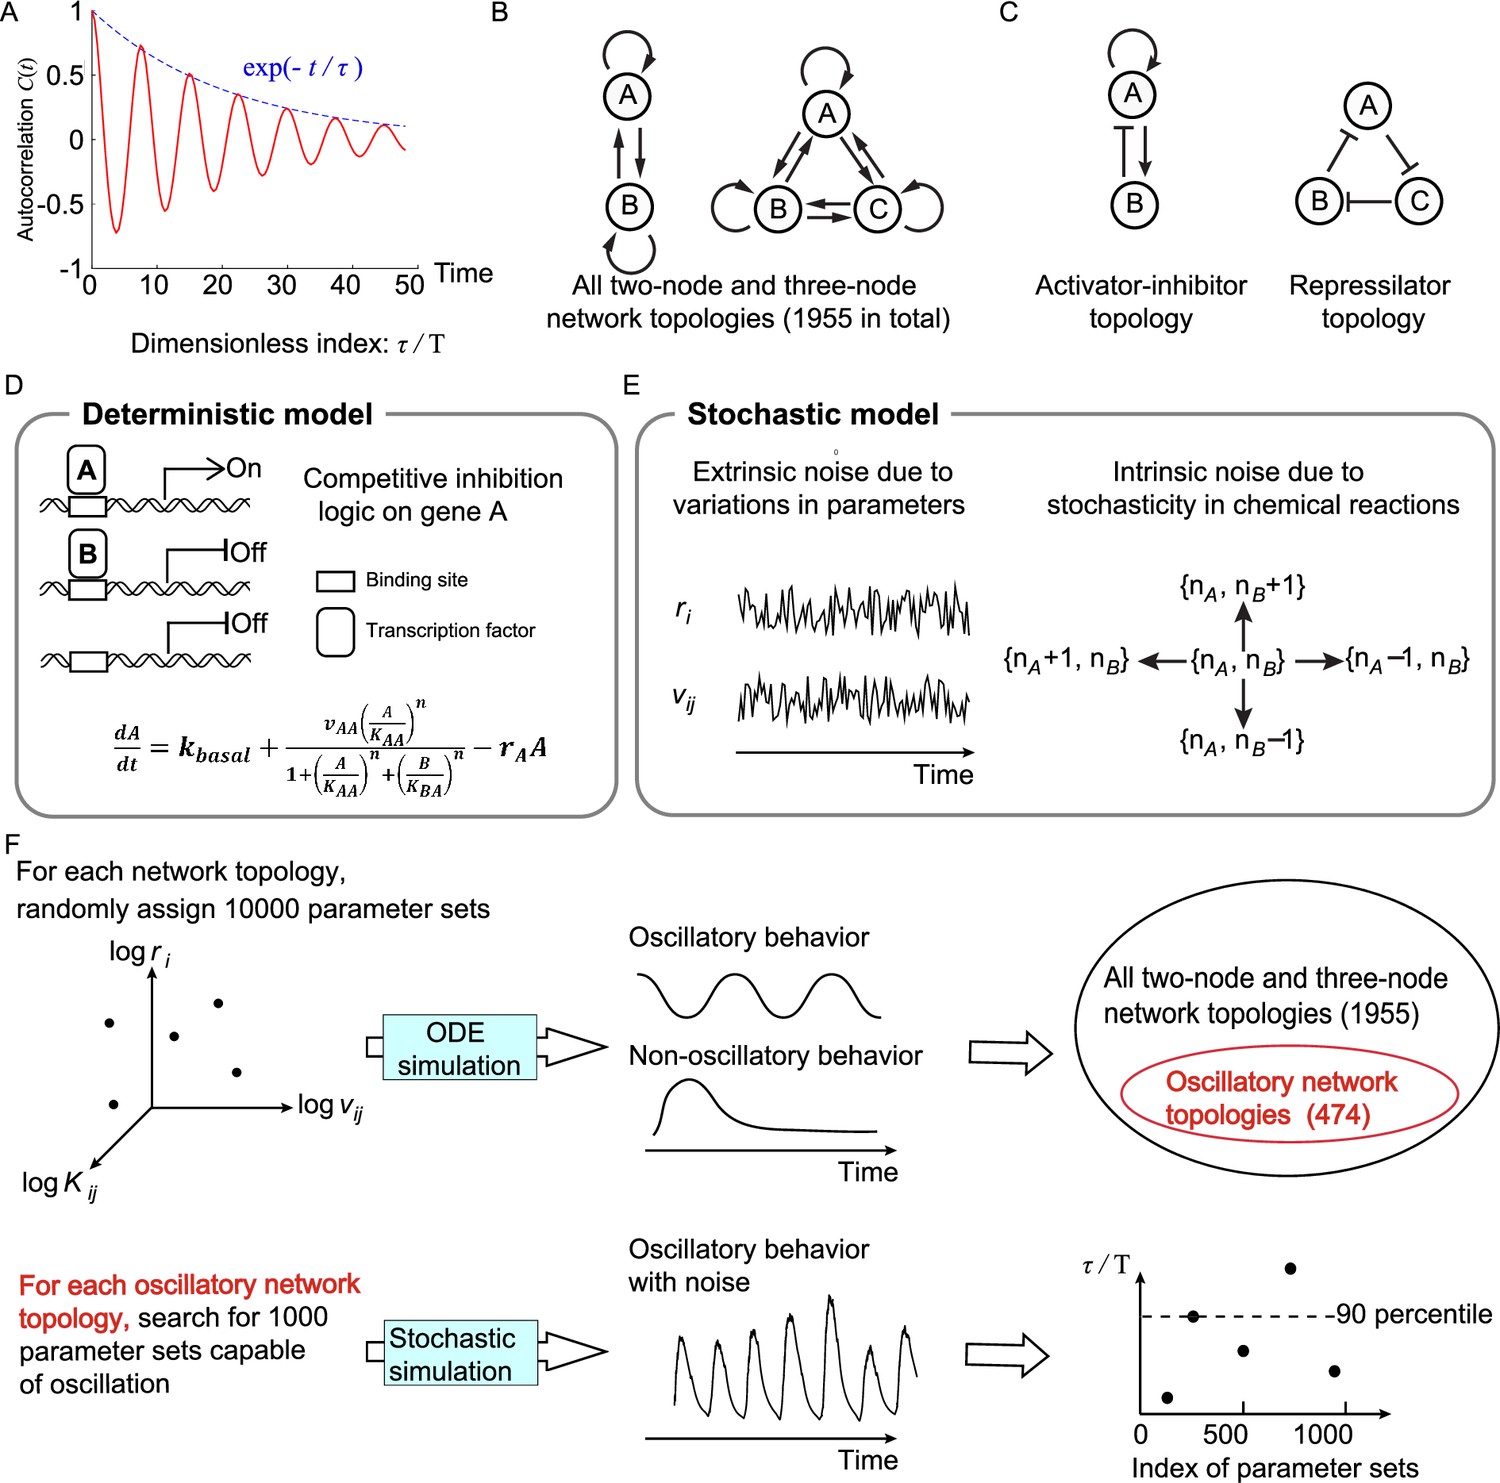
Searching all possible two-node and three-node network topologies for oscillatory topologies with high accuracy in the presence of noise.
(A) The accuracy of the oscillatory behavior against the noise is measured by the ratio of the correlation time to the period . (B) Possible links in two-node and three-node network topologies. (C) Two typical topologies of biological oscillators: the activator-inhibitor and the repressilator topologies. (D) The deterministic model. (E) Stochastic models where the extrinsic and intrinsic noise are considered separately. (F) Illustration of searching oscillatory topologies and measuring the robustness to noise for a given oscillatory topology. See ‘Methods’ and Supplementary file 1a for parameter ranges and magnitudes of extrinsic and intrinsic noise.
Figure 2 with 2 supplements
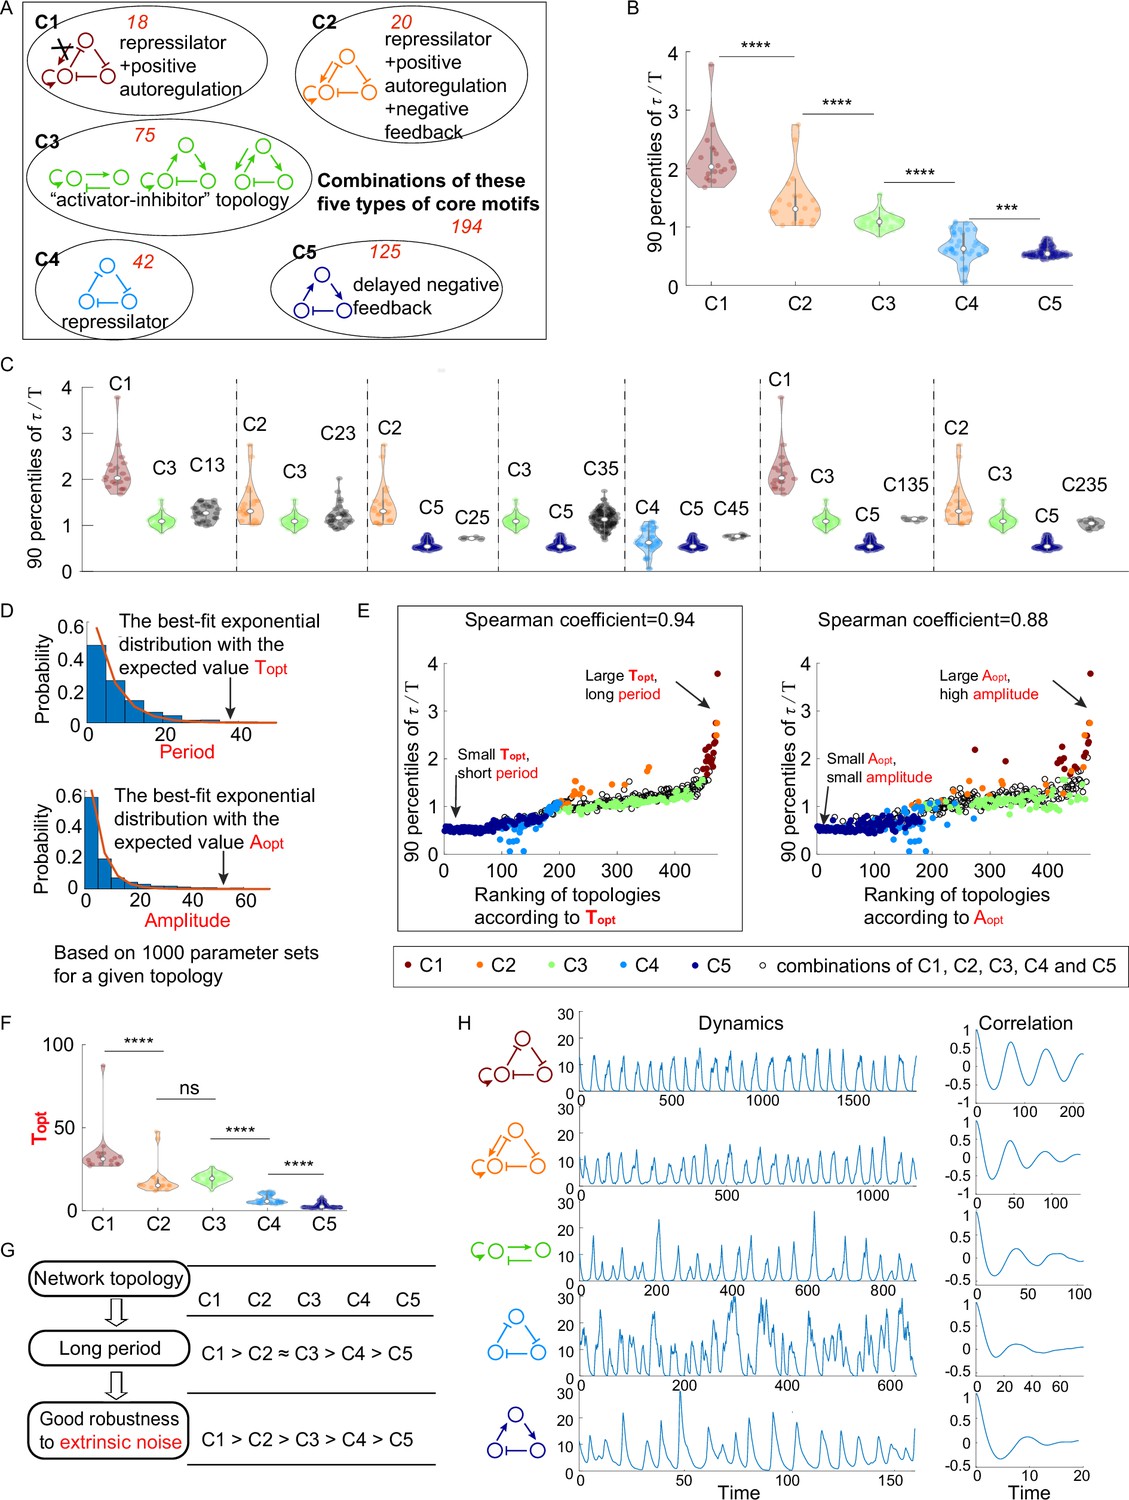
The relationship between network topology and robustness to extrinsic noise.
(A) Venn diagram of all 474 oscillatory network topologies. The C1, C2, C3, C4, and C5 categories are nonoverlapping collections of network topologies that contain core motifs in brown, orange, green, blue, and dark blue, respectively. The number in red is the number of topologies in each region. (B) The violin plots of 90 percentiles of dimensionless correlation time () for C1, C2, …, and C5 categories present in (A). Each category corresponds to one violin plot, and topologies are denoted by dots. The Wilcoxon rank-sum tests (one-tailed) are applied to adjacent categories (***p<0.001; ****p<0.0001). (C) The violin plots of 90 percentiles of for topologies that do not belong to any of C1, C2, …, and C5 categories. Taken C13 category as an example, the C13 category is the collection of the topology containing the first and third types of motifs simultaneously. (D) Illustration of calculations of the period average (denoted as ) and the amplitude average (denoted as ) for a given topology. For a given topology, (or ) is the expectation of the best-fit exponential distribution of 1000 periods (or 1000 amplitudes) with random assigned parameters. (E) The scatter plots of 90 percentiles of versus the ranks according to (left) and (right). Each oscillatory network topology is denoted by a dot, with color determined by its category. Spearman coefficients are illustrated on the top of each plot, and the plot with a relatively high Spearman coefficient is highlighted by the black box. (F) The violin plots of for the five network topology categories present in (A). The Wilcoxon rank-sum tests (one-tailed) are applied to adjacent categories (ns, not significant; ***p<0.001; ****p<0.0001). (G) Hypothesis of topology–period–robustness relation. The network topology may affect robustness to extrinsic noise by acting on an intermediate quantity – period. (H) Typical dynamics in the presence of extrinsic noise and corresponding autocorrelation functions for the five topologies present in (A). From top to bottom, the period length decreases, and the autocorrelation also decreases. The amplitude for those dynamics in the absence of noise is almost the same (near 12). The 90 percentile of is the average from five replicates.
Figure 2—figure supplement 1
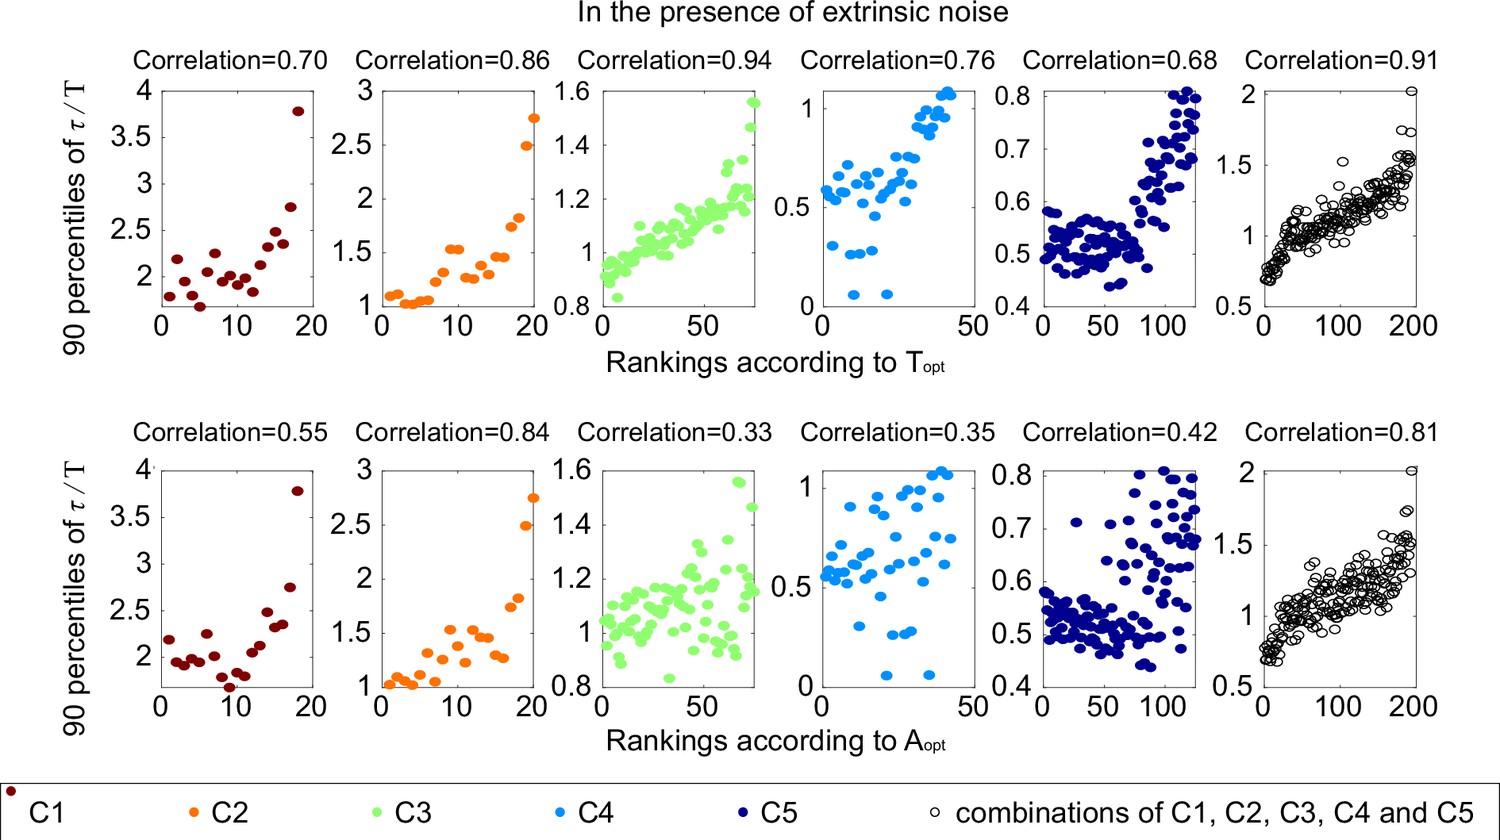
The same scatter plots as Figure 2E, except that each subplot represents one category.
The Spearman coefficients are illustrated on the top of each subplot.
Figure 2—figure supplement 2
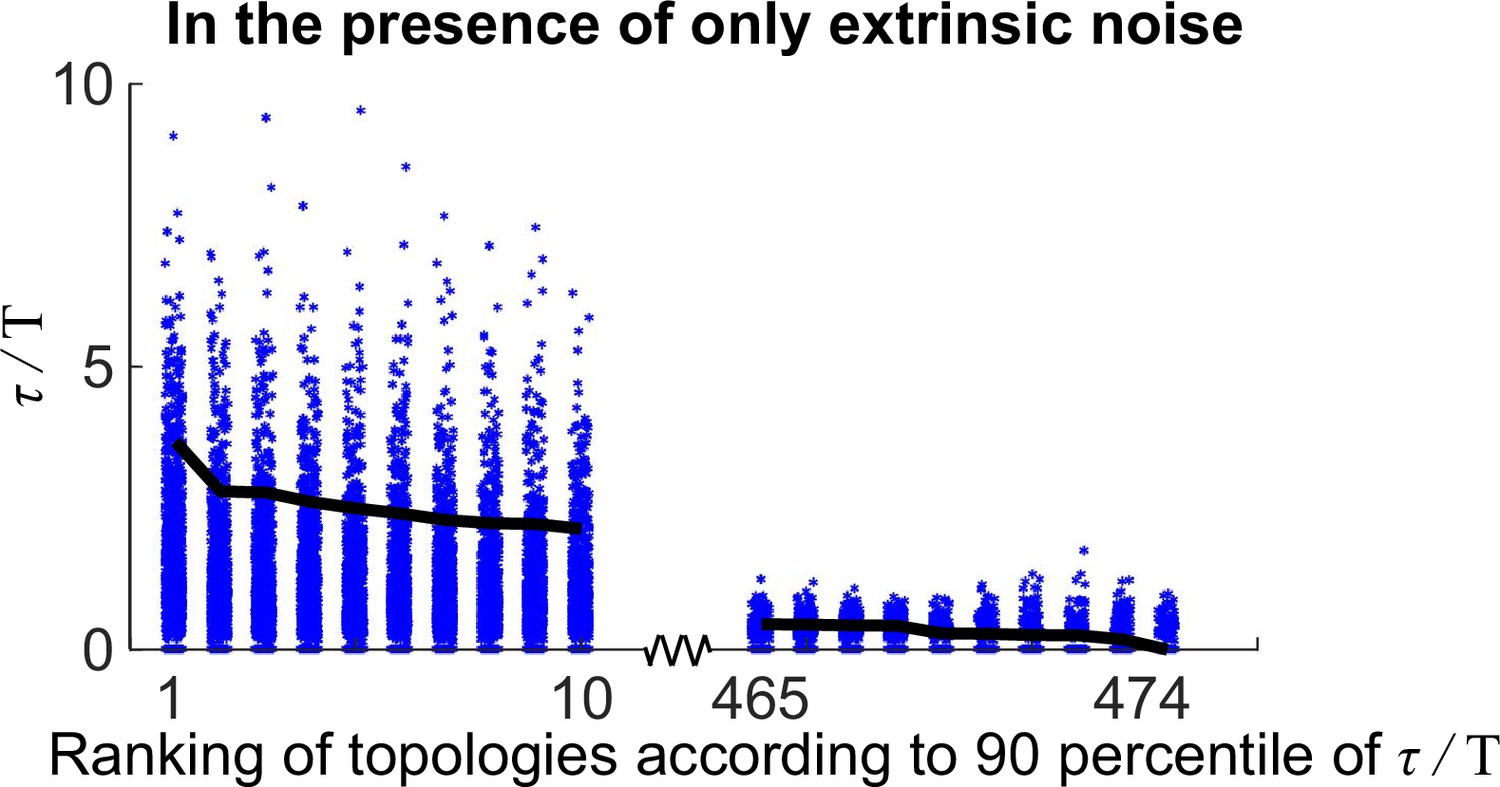
The distributions of for 20 oscillatory network topologies when randomly sampling 1000 kinetic parameter sets.
The x-axis is the ranking of all 474 oscillatory network topologies according to 90 percentile of ; for simplicity, only the first 10 and last 10 oscillatory network topologies are shown here. The black lines denote the 90 percentile of .
Figure 3 with 4 supplements

The relationship between network topology and robustness to intrinsic noise.
(A–C) The same plots as in Figure 2B, C and E, except that the noise comes from the stochasticity of biochemical reactions. The 90 percentile of dimensionless correlation time () shows a higher correlation with rather than . (D) The violin plots of for the five network topology categories present in Figure 2A. The Wilcoxon rank-sum tests (one-tailed) are applied to adjacent categories (ns, not significant; ***p<0.001; ****p<0.0001). (E) Hypothesis of topology–amplitude–robustness relation. The correlation between and 90 percentiles of in the presence of intrinsic noise indicates that the network topology may influence the robustness against intrinsic noise through the amplitude. (F) The same plot as Figure 2H except in the presence of intrinsic noise. From top to bottom, while the period in the absence of noise is very close (near 12), the amplitude decreases, and the autocorrelation also decreases. The 90 percentile of is the average from five replicates.
Figure 3—figure supplement 1
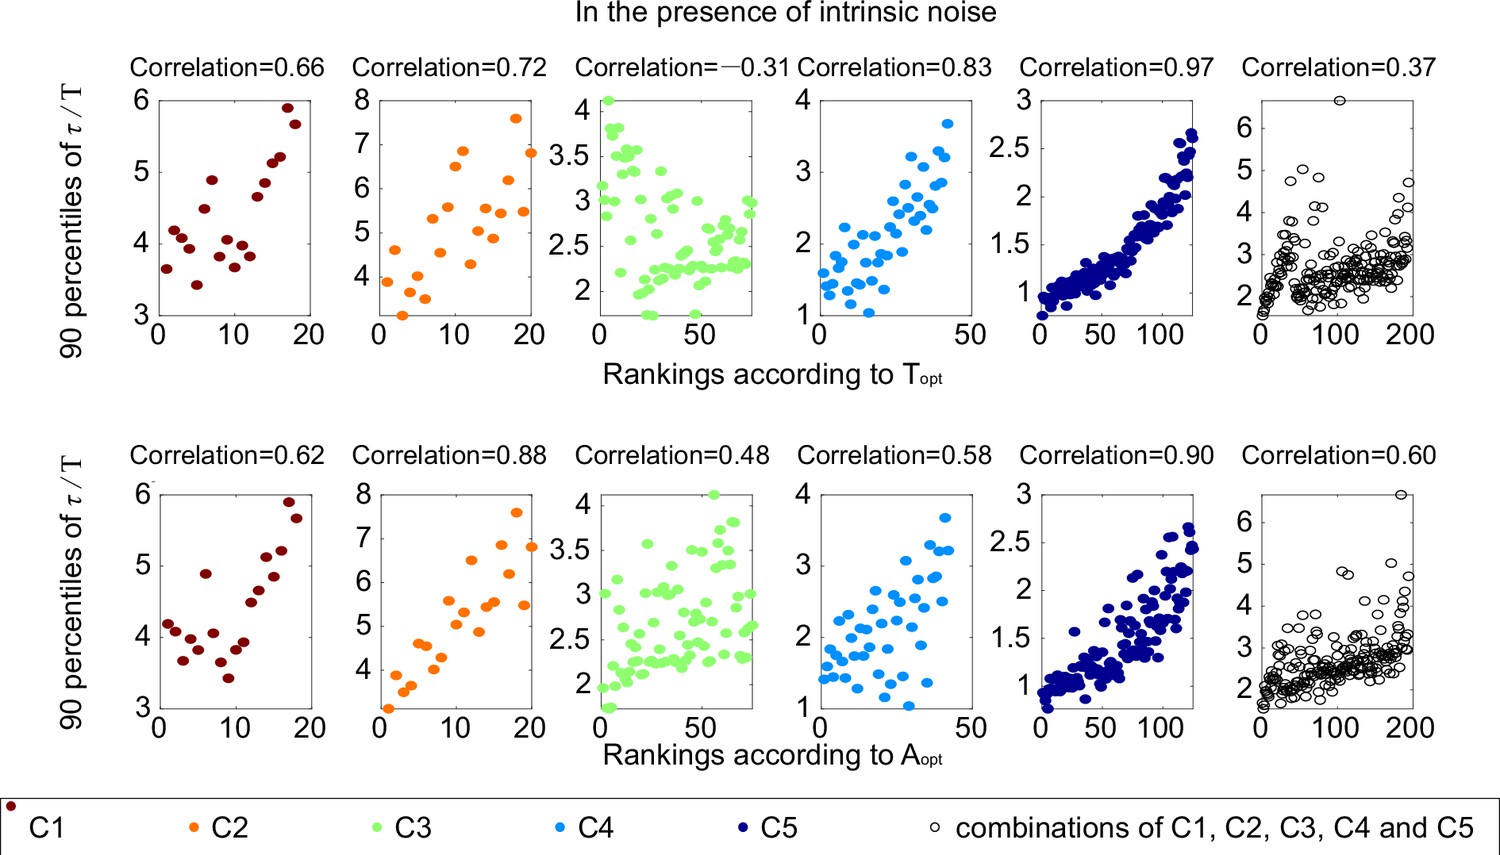
The same plots as Figure 3C.
Each subplot corresponds to one category, with Spearman coefficients on the top.
Figure 3—figure supplement 2

The relationship between network topology and robustness to intrinsic noise when using the Gillespie algorithm to simulate the dynamics.
(A-E) Same plots as Figure 3A-E except that Gillespie algorithm is adopted.
Figure 3—figure supplement 3
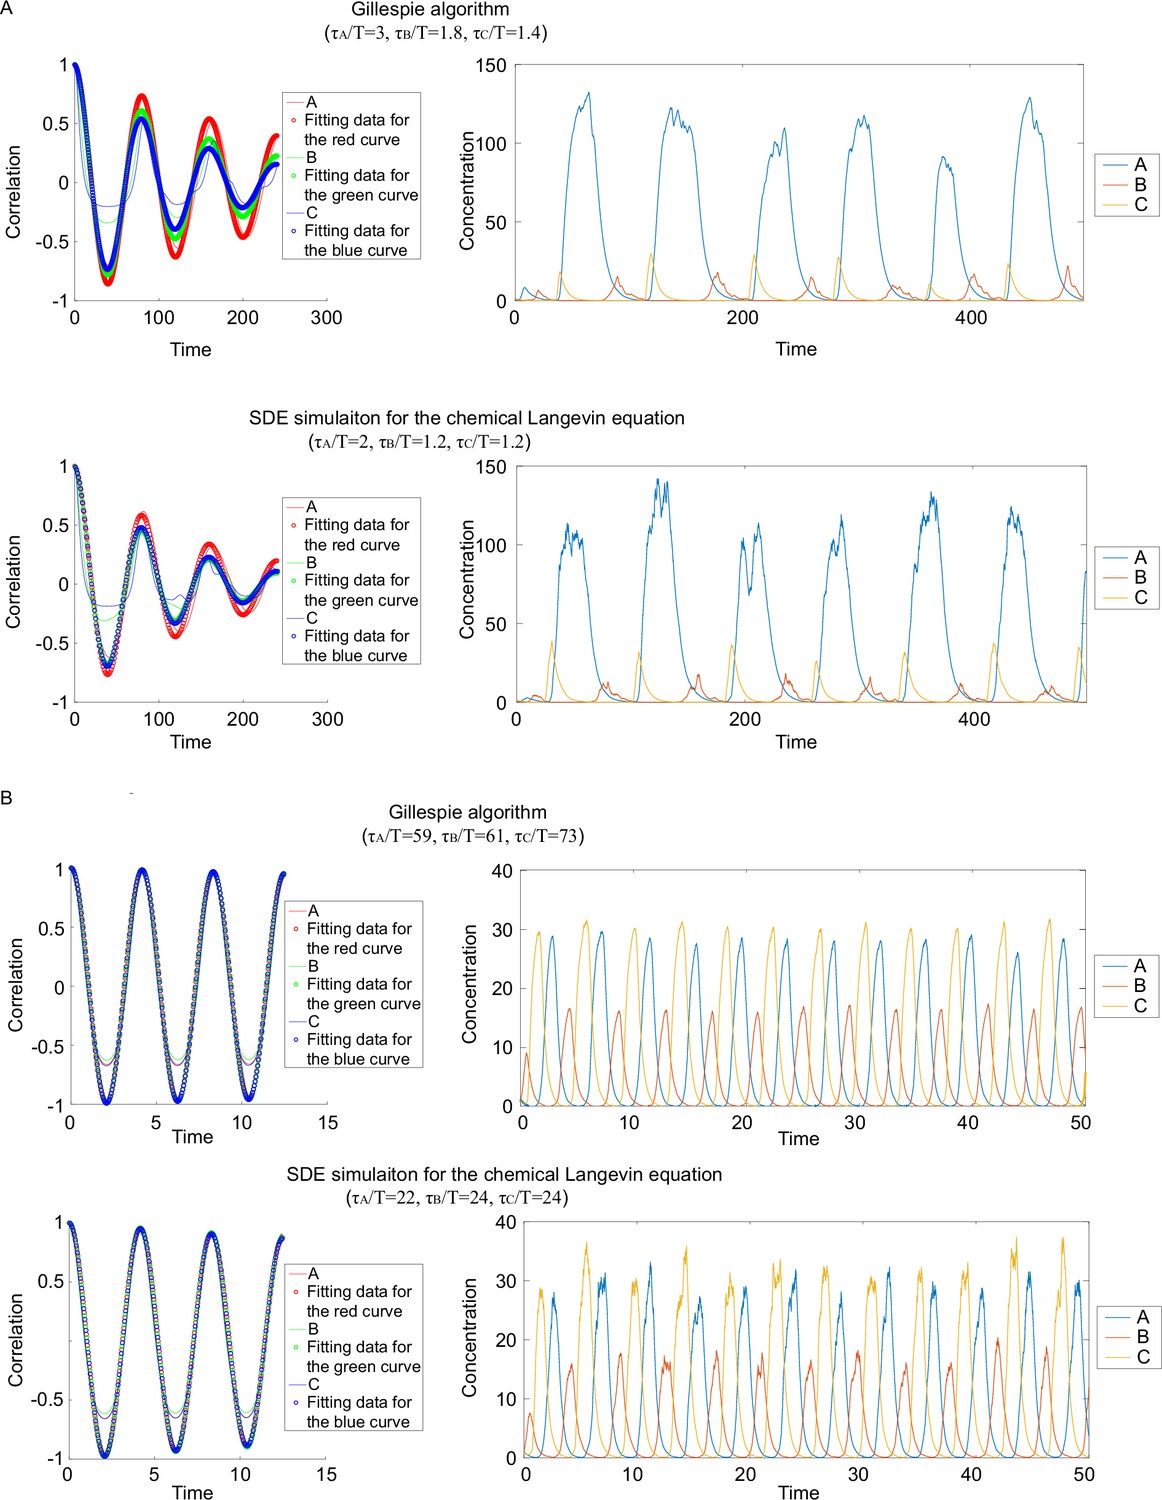
Comparisons of dimensionless correlation time obtained from different simulation methods.
(A). Autocorrelations (left panels) and corresponding dynamics (right panels) when applying different algorithms to same circuits. The upper panel corresponds to the Gillespie algorithm, and the lower panel the stochastic differential equations SDE simulation. (B). Same plot as in (A), except that different kinetic parameters are used.
Figure 3—figure supplement 4
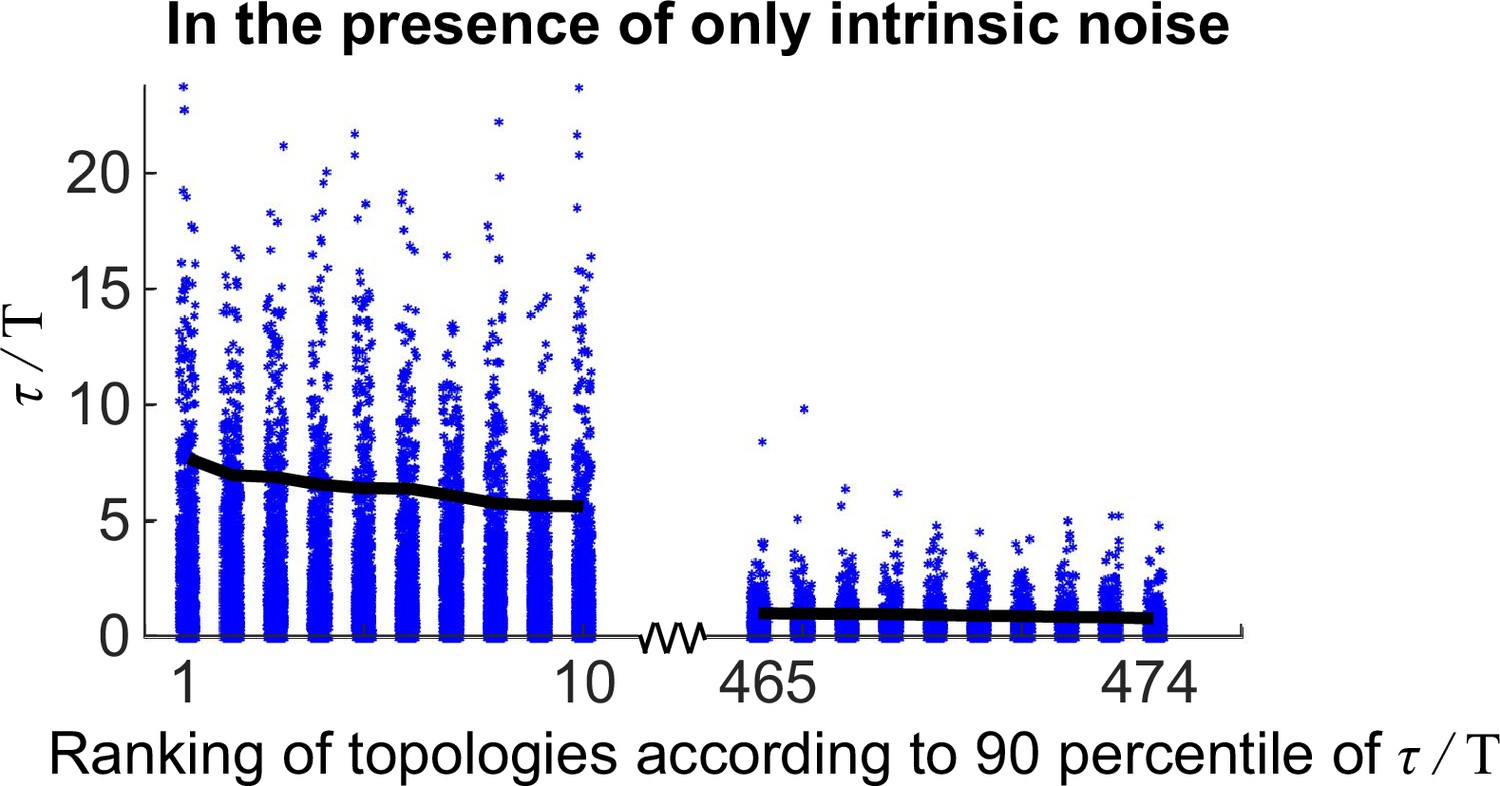
Same plot as Figure 2—figure supplement 2 except that the intrinsic noise is considered.
Figure 4 with 1 supplement
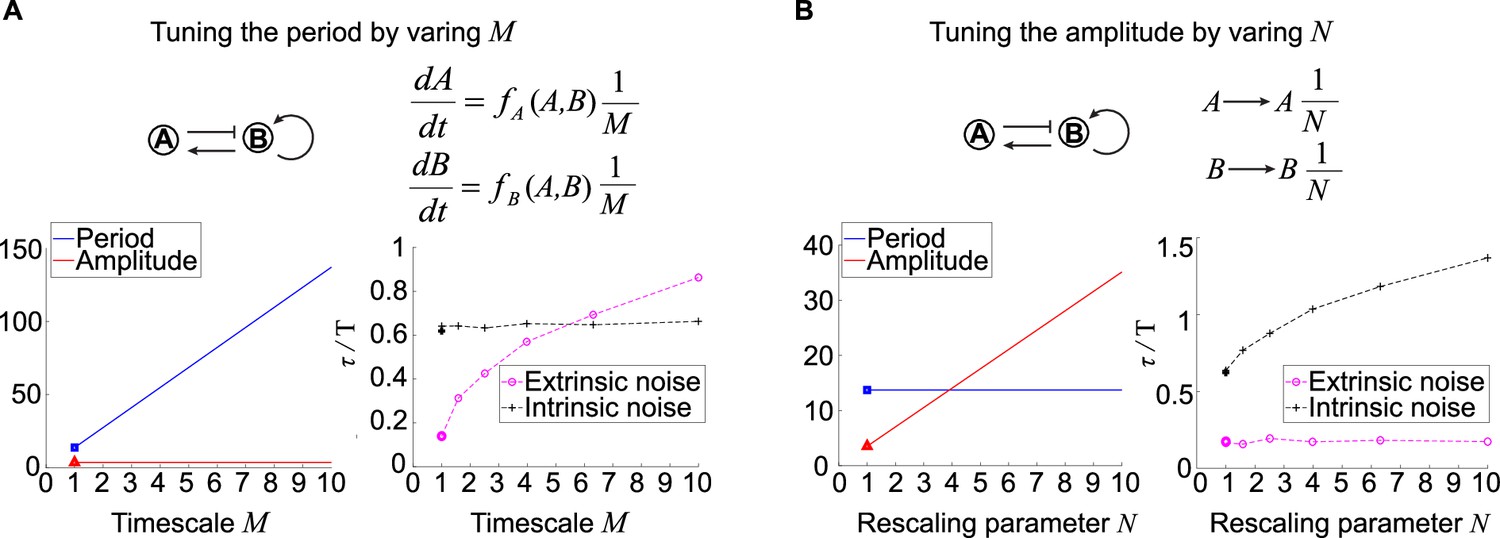
Effects of tuning period or amplitude on oscillation accuracies.
(A, B) Relations between period (A) or amplitude (B) and oscillation accuracies. For the activator-inhibitor topology, we arbitrarily choose an oscillation parameter set (see Supplementary file 1b for parameters), and then we add or in the way shown in the upper panel to tune the period or amplitude, respectively. The lower panels are simulation results of the period, amplitude, and dimensionless correlation time when or increases.
Figure 4—figure supplement 1

The mean period and mean amplitude for all 474 oscillatory network topologies show a strong positive correlation.
Figure 5
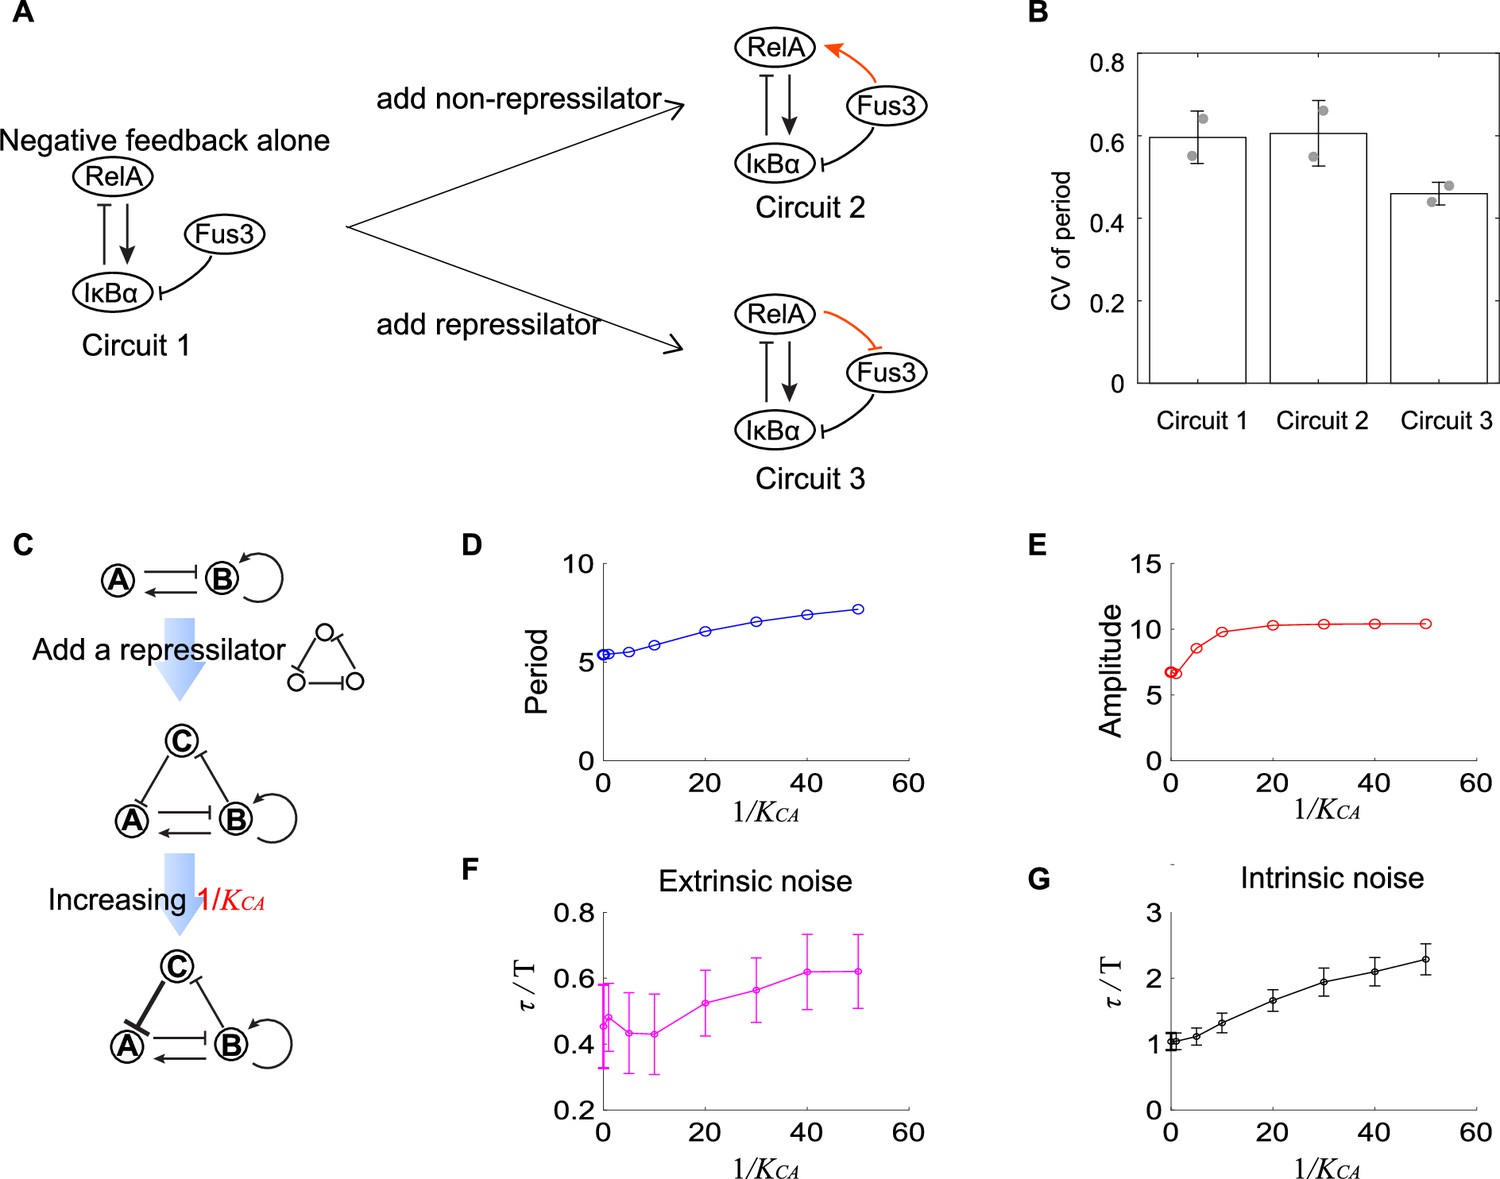
Experimental evidence of the improvement of oscillation accuracy when adding a repressilator topology to the activator-inhibitor.
(A) Schematic showing the synthetic NF-κB signaling circuits (circuit 1) and other two circuits (circuits 2 and 3) with more complicated structures. In circuit 1, RelA activates IκBα, but the latter inhibits RelA, constituting a negative feedback; we regard circuit 1 as the activator-inhibitor where the positive autoregulation is replaced by multiple reactions. Based on circuit 1, we construct circuit 2 by adding a copy of IκBα to form a new link from Fus3 to NF-κB (RelA), where RelA, IκBα, and Fus3 cannot constitute a repressilator. Circuit 3 is circuit 1 with additional negative regulation from RelA to Fus3, which is constructed by adding a yeast MAPK phosphatase Msg5 that is activated by RelA and dephosphorylate Fus3. Circuit 3 includes a repressilator consisting of RelA, IκBα, and Fus3. (B) Bar plots of coefficients of variation (CVs) of period for three synthetic circuits present in (A). For each circuit, time required from the peak of RelA to next peak from 0 to 10 hr for over 50 cells is recorded to calculate the CV. Two replicates are performed for each circuit. (C) Procedures to study how adding repressilator topology to activator-inhibitor affect the oscillation accuracy by using mathematical models present in Figure 1. represents the binding affinity of protein C to gene A, and large indicates strong inhibition from protein C to protein A. (D–G) Simulation results for period (D), amplitude (E), and dimensionless correlation time in the presence of extrinsic (F) or intrinsic (G) noise when increases. See Supplementary file 1c for parameters. The marker with x coordinate 0 denotes the value for activator-inhibitor. The error bar represents the standard deviation for 100 repeated simulations. Increasing (i.e., strengthening the inhibition from protein C to protein A) prolongs period, increases the amplitude, and improves the oscillation accuracy.
Additional files
-
Supplementary file 1
Kinetic parameters used in numerical simulations.
- https://cdn.elifesciences.org/articles/76188/elife-76188-supp1-v1.docx
-
MDAR checklist
- https://cdn.elifesciences.org/articles/76188/elife-76188-mdarchecklist1-v1.pdf
Download links
A two-part list of links to download the article, or parts of the article, in various formats.
Downloads (link to download the article as PDF)
Open citations (links to open the citations from this article in various online reference manager services)
Cite this article (links to download the citations from this article in formats compatible with various reference manager tools)
Network design principle for robust oscillatory behaviors with respect to biological noise
eLife 11:e76188.
https://doi.org/10.7554/eLife.76188


