The number of cytokinesis nodes in mitotic fission yeast scales with cell size
- Department of Molecular Cellular and Developmental Biology,Yale University, United States
- Department of Molecular Biophysics and Biochemistry, Yale University, United States
- Department of Cell Biology,Yale University, United States
Figures
Figure 1
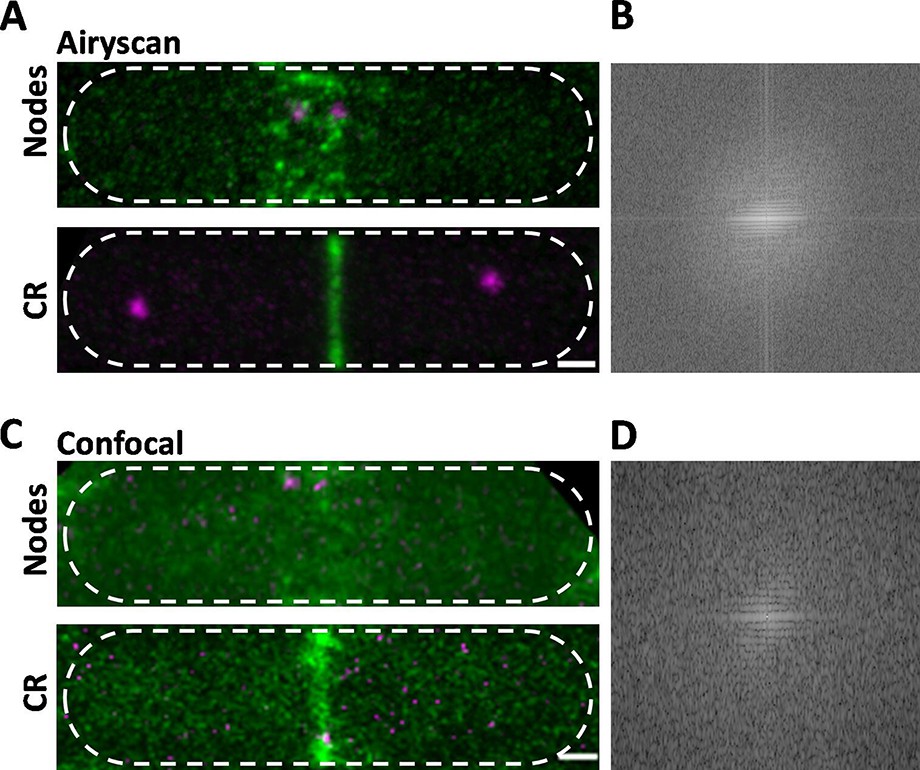
Comparison of Airyscan and confocal images of cytokinesis nodes and contractile rings in wild-type fission yeast cells expressing Blt1-mEGFP (green) and Sad1-RFP showing two spindle pole bodies (SPBs) (magenta).
(A) Airyscan images. Max projections of 40 Z-slices. The upper cell has a broad band of cytokinesis nodes (green). The lower cell has a contractile ring. (B) Fast Fourier transform of the image in lower panel A, green channel. (C) Confocal images. Max projections of 20 Z-slices of confocal fluorescence with 0.6 AU + 8X averaging + iteratively constrained deconvolution micrographs. The upper cell has a broad band of cytokinesis nodes. The lower cell has a contractile ring. (D) Fast Fourier transform of the image in lower panel C, green channel. The scale bar is 1 µm.
Figure 2

Counting cytokinesis nodes in broad bands and contractile rings of wild-type cells expressing Blt1-mEGFP.
(A) Reverse contrast fluorescence micrograph of Figure 1A, upper panel. Black dotted circles are nodes selected for fluorescence measurements. The scale bar is 1 µm. (B) Reverse contrast fluorescence micrograph of a sum projection of seven slices of the cell in panel A. A black dotted circle marks a spot selected to measure the fluorescence of single nodes and blue dotted circles mark cytoplasmic regions selected to measure background fluorescence. (C) Reverse contrast fluorescence micrograph of a sum projection of 40 Z-slices of the cell in panel A. The red rectangle outlines the region used to measure the total node broad band fluorescence and the yellow polygonal area marks the area chosen to measure background intensity to subtract from the broad band area. (D) Histogram of the distribution of fluorescence intensities of a sample of 235 cytokinesis nodes from 21 cells including all the selected nodes. The continuous curve is a fit of a Gaussian distribution to the intensities of 231 single nodes excluding the 4 high-intensity nodes. The mean intensity value is 2300 AU and the standard deviation (SD) is 900 AU. (E) Bee–Swarm plots comparing the total Blt1-mEGFP intensity in node broad bands (BB) (black, 21 cells) and contractile rings (CR) (blue, 23 cells).
-
Figure 2—source data 1
Related to Figure 2D, E.
- https://cdn.elifesciences.org/articles/76249/elife-76249-fig2-data1-v1.xlsx
Figure 3 with 2 supplements
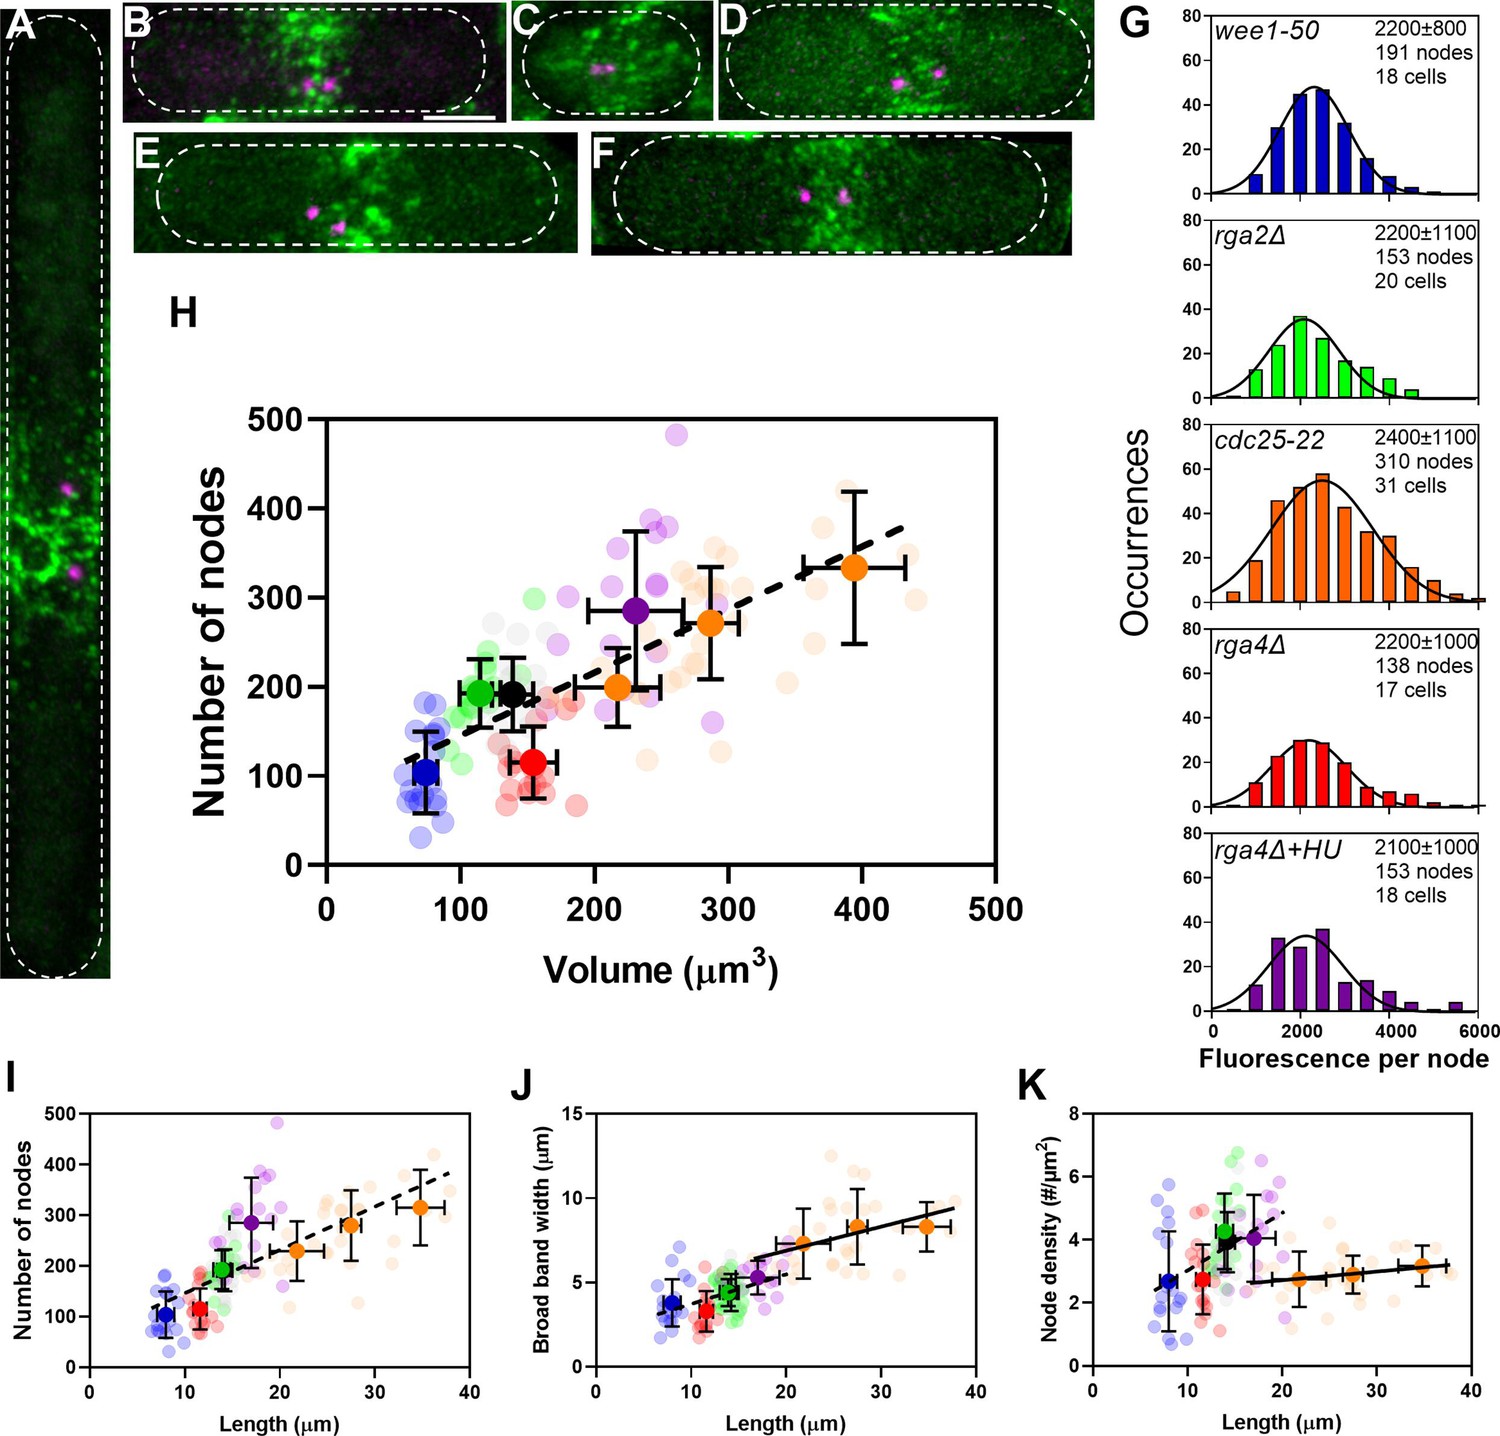
The number of cytokinesis nodes scales with the size of the cell.
(A–F) Maximum intensity projections of Airyscan images of 40 Z-sections of fission yeast cells expressing Blt1-mEGFP and Sad1-RFP showing two spindle pole bodies (SPBs) (magenta). The scale bar is 3 µm. (A) cdc25-22; (B) wild type; (C) wee1-50; (D) rga4Δ; (E) rga2Δ; and (F) rga4Δ + HU at 25°C. (G) Histograms of the distributions of fluorescence intensities of small nodes in five different strains. Figure 2D shows the distribution of fluorescence intensities of small nodes in wild-type cells. Insets list average single node fluorescence intensity ± standard deviation (SD) for each strain. Tukey’s multiple comparison test showed no significant difference in any strain from the wild-type strain with p > 0.05 except in the rga4Δ + HU strain, p = 0.04. The Shapiro–Wilk W test did not reject the null hypothesis of normal distribution in all strains with W values ≥0.97. The descriptive statistics Z score for our sample size 135 > n > 310 was <3.29 for all strains, which does not reject the null hypothesis of a normal distribution. (H–K) Relationships between parameters (node numbers, broad band widths, and node densities) and cell size parameters in six strains: ( ) wee1-50 (n = 18 cells); (
 ) rga2Δ at (n = 20 cells); (
 ) wild type at (n = 21 cells); (
 ) rga4Δ at (n = 17 cells); (
 ) rga4Δ + HU (n = 18 cells); and cdc25-22 (
 ) at 25°C. All measurements for each strain are collected in one bin except for (
 ) cdc25-22 cells, which are divided into three volume bins: 150–250 µm3, n = 8 cells; 250–350 µm3, n = 17 cells; 350–450 µm3, n = 6 cells, and three length bins: 15–25 µm, n = 14 cells; 25–30 µm, n = 10 cells; 30–40 µm, n = 7 cells. The transparent symbols are measurements of individual cells. The solid symbols are the mean numbers of node parameters. Except for the cdc25-22 cells, the vertical error bars show the SD of the mean numbers and horizontal error bars the SD of the lengths. For the cdc25-22 (volume 350–450 µm3) cells the error bar is the range. (H) Node number versus cell volume. The slope of the linear regression (black dashed line) is significantly different from zero (p < 0.0001; R2 = 0.5). (I) Node number versus cell length. The slope of the linear regression (black dashed line) is significantly different from zero (p < 0.0001; R2 = 0.5). (J) Width of node broad band as a function of cell length. The slope of the linear regression for four strains (black dashed line) is significantly different from zero (p < 0.0001; R2 = 0.2), The slope of the linear regression for cdc25-22 cells of various sizes (black line) is also significantly different from zero (p = 0.03; R2 = 0.2). (K) Node density on the cortex of the broad band area as a function of cell length. The slope of the linear regression (black dashed line) is significantly different from zero (p < 0.0001; R2 = 0.2). The slope of the linear regression for cdc25-22 cells (black line) is not significantly different from zero (p = 0.3; R2 = 0.05).
-
Figure 3—source data 1
Related to Figure 3G-K.
- https://cdn.elifesciences.org/articles/76249/elife-76249-fig3-data1-v1.xlsx
Figure 3—figure supplement 1
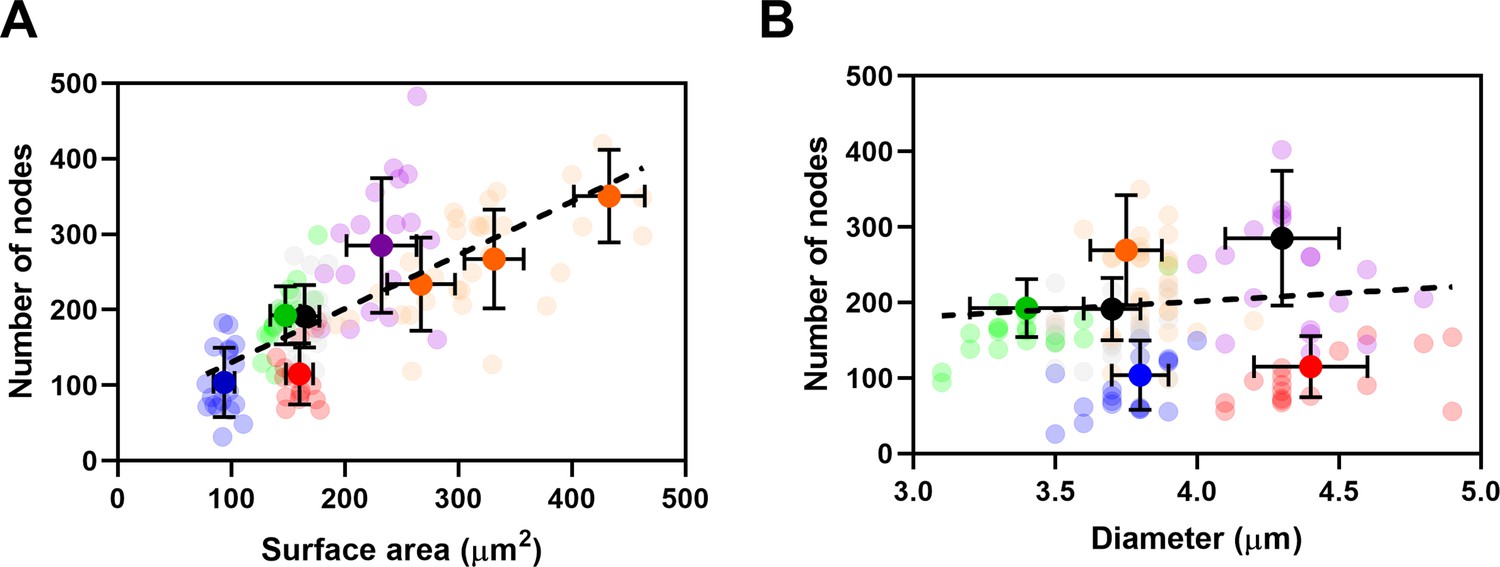
The number of cytokinesis nodes scales with the surface area of the cell.
(A, B) Relationships between node number and cell surface area and diameter in five strains: ( ) wee1-50 (n = 18 cells); (
 ) rga2Δ at (n = 20 cells); (
 ) wild type at (n = 21 cells); (
 ) rga4Δ at (n = 17 cells); and (
 ) rga4Δ + HU (n = 18 cells) at 25°C. (A) Node number versus surface area. All measurements for each strain are collected in one bin except for (
 ) cdc25-22 cells, which are divided into three surface area bins: 200–300 µm3, n = 12 cells; 300–400 µm3, n = 14 cells; >400 µm3, n = 5 cells. The transparent symbols are measurements of individual cells. The solid symbols are the mean numbers of node parameters. Except for the cdc25-22 cells, the vertical error bars show the standard deviation (SD) of the mean numbers and horizontal error bars the SD of the lengths. For the cdc25-22 cells with surface areas >400 µm3, the error bar is the range. The dashed black line is a linear regression using all the data points. The slope of the linear regression is significantly different from zero (p < 0.0001; R2 = 0.5). (B) Node number versus cell diameter. All measurements for each strain are collected in one bin. The slope of the linear regression (black dashed line) is not significantly different from zero (p = 0.3; R2 = 0.01) indicating no relationship between the number of nodes and the diameter of cells.
-
Figure 3—figure supplement 1—source data 1
Related to Figure 3—figure supplement 1A,B.
- https://cdn.elifesciences.org/articles/76249/elife-76249-fig3-figsupp1-data1-v1.xlsx
Figure 3—figure supplement 2
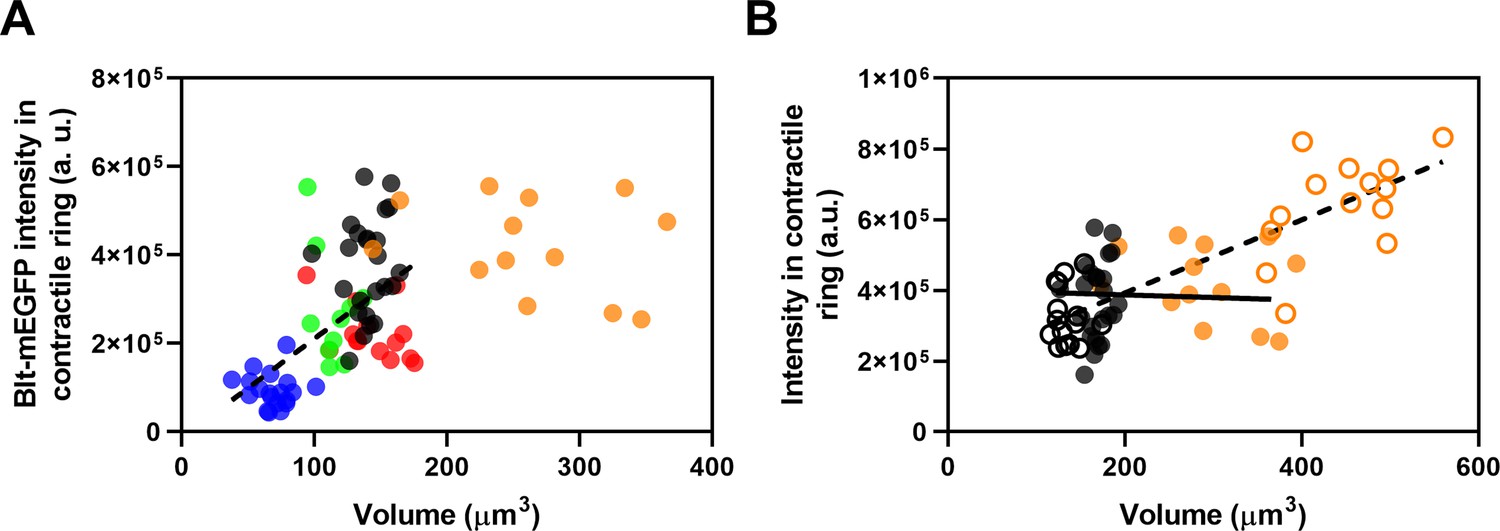
Fluorescence intensities in the contractile rings of yeast strains as a function of cell volume.
(A) Blt1-mEGFP intensity in contractile ring versus cell volume for five strains: ( ) wee1-50; (
 ) rga2Δ; (
 ) wild type; (
 ) rga4Δ; and (
 ) cdc25-22. The slope of the linear regression to all but the orange data points (black dashed line) is significantly different from zero (p < 0.0001; R2 = 0.3). (B) Fluorescence intensity of Blt1-mEGFP in contractile rings of (
 ) wild type and (
 ) cdc25-22 mutant cells from panel (A) and fluorescence intensity of mEGFP-Myo2 in contractile rings of (
 ) wild type and (
 ) cdc25-22 mutant cells versus cell volumes. The slope of the linear regression to all empty circle data points (black dashed line) is significantly different from zero (p < 0.0001; R2 = 0.8). The slope of the linear regression to all filled circle data points (solid black line) is not significantly different from zero (p = 0.8; R2 = 0.003).
-
Figure 3—figure supplement 2—source data 1
Related to Figure 3—figure supplement 2A,B.
- https://cdn.elifesciences.org/articles/76249/elife-76249-fig3-figsupp2-data1-v1.xlsx
Figure 4
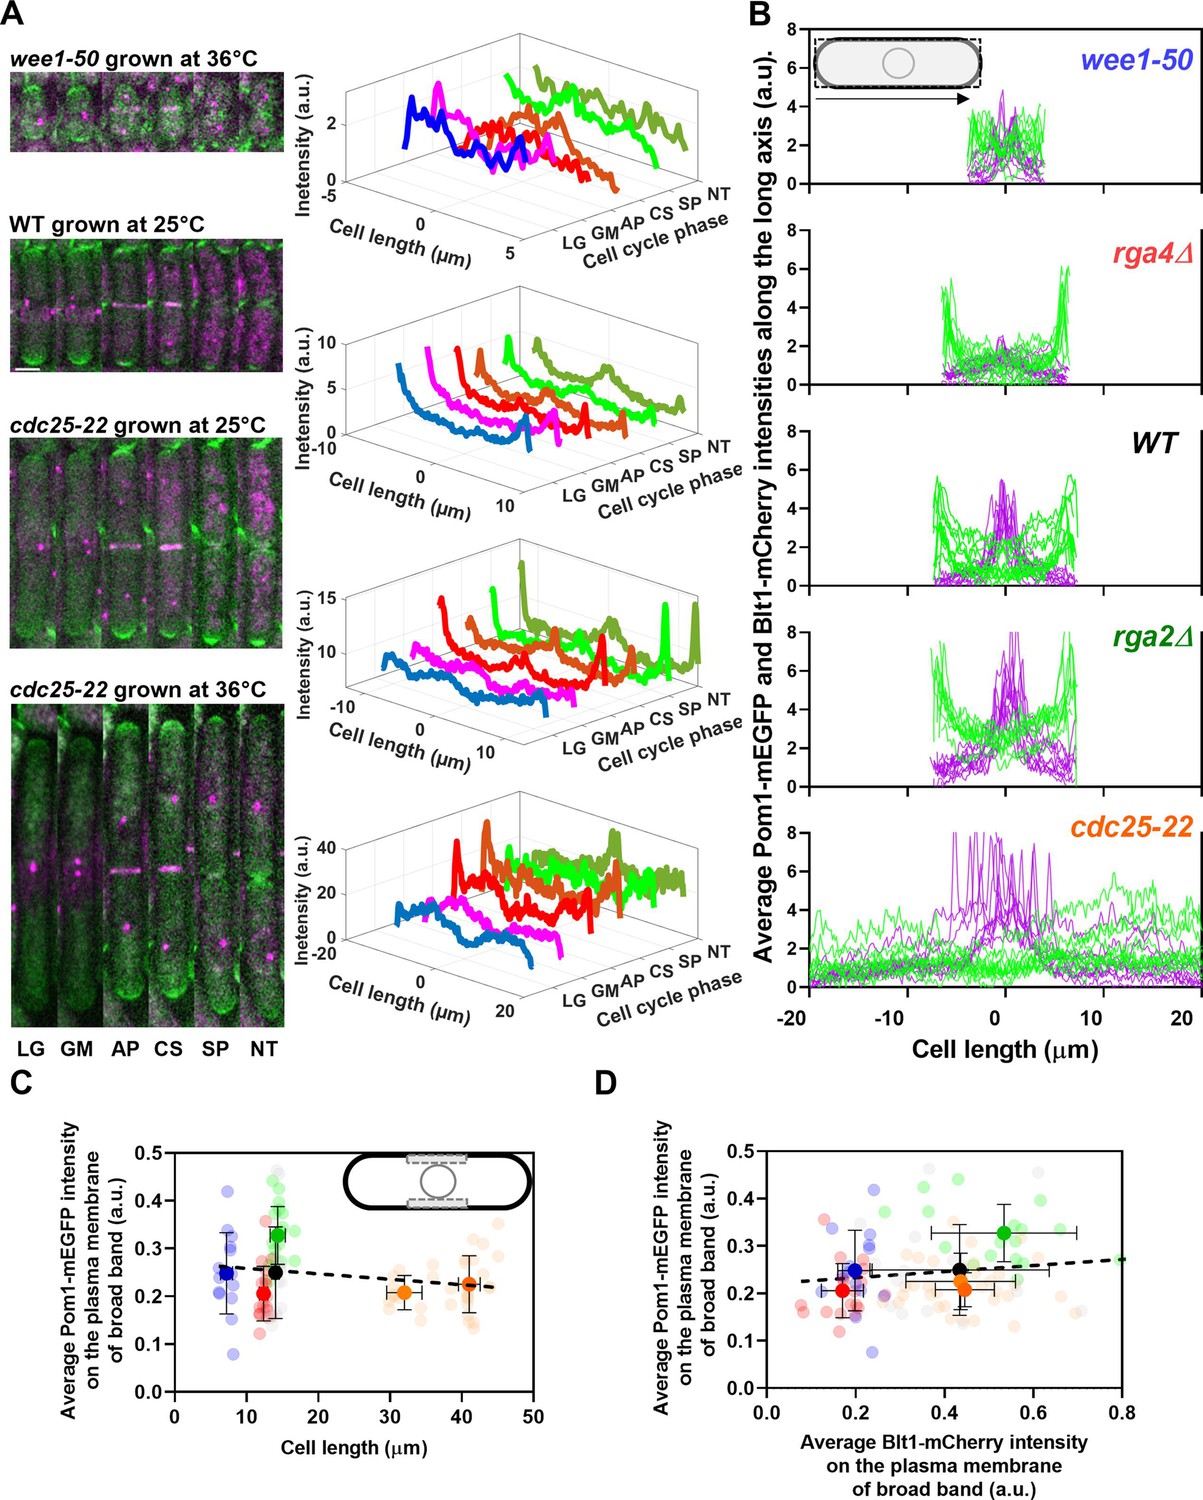
Distributions of Pom1 and Blt1 in cells that differ in size.
(A) Distribution of Pom1 in wild type, wee1-50, and cdc25-22 mutant cells. Each strain expressed Pom1-GFP and Blt1-mCherry-Sad1-RFP from their native loci. Each panel has two parts: (left) sum projected confocal images of 15 Z-slices of wild-type cells taken at different phases of the life cycle abbreviated as LG (late G2), GM (G2/M), AP (anaphase), CS (constriction), SP (separation), and NT (new end take off); and (right) time series of plots of the average intensity of Pom1-GFP fluorescence along the length of the cells. Scale bar 3 µm. (Top panel) wee1-50 grown at 36°C and imaged at 22°C. (Second panel) Wild-type cells were grown at 25°C and imaged at 22°C. (Third panel) cdc25-22 mutant cells grown at 25°C and imaged at 22°C. (Bottom panel) cdc25-22 mutant cells grown at 36°C for 4 hr before imaging at 22°C. (B) Distributions of Pom1 and Blt1 in cells at the G2/M transition measured by confocal microscopy of wild-type and four mutant strains. Cells were grown at 25°C and imaged at 22°C: ( , n = 9 cells) WT, (
 , n = 7 cells) wee1-50, (
 , n = 8 cells) cdc25-22, (
 , n = 9 cells) rga2Δ and (
 , n = 9 cells) rga4Δ mutant cells. Lines are fluorescence intensities of Blt1-mCherry-Sad1-RFP (magenta) and Pom1-GFP (green) across the full width of the cells and along the lengths of the cells. (C, D) Relationships between cell length and average Blt1-mCherry intensity on the plasma membrane of broad band with average Pom1-mEGFP intensity on the plasma membrane of broad band in five strains in (B). All measurements for each strain are collected in one bin except for (
 ) cdc25-22 cells, which are divided into two length bins: 30–36 µm, n = 12 cells; 36–45 µm, n = 22 cells. The transparent symbols are measurements of individual cells. The solid symbols are the mean numbers of node parameters. The vertical error bars show the SD of the mean numbers and the horizontal error bars the standard deviation (SD) of the lengths. (C) Average Pom1-mEGFP intensity per pixel along the plasma membrane across the broad band of nodes in the middle focal plane of the cells as a function of the lengths of the cells. The inset shows the rectangle three pixels wide and the length of the broad band of nodes used to make the measurements. The slope of the linear regression (black dotted line) is not significantly different from zero (p = 0.07; R2 = 0.03). (D) Graph of the average Pom1-mEGFP intensity per pixel versus the average Blt1-mCherry intensity per pixel along the plasma membrane in the middle focal plane of the cells (as in the inset of panel C). The slope of the linear regression (black dotted line) is not significantly different from zero (p = 0.13; R2 = 0.02).
-
Figure 4—source data 1
Related to Figure 4C, D.
- https://cdn.elifesciences.org/articles/76249/elife-76249-fig4-data1-v1.xlsx
Figure 5
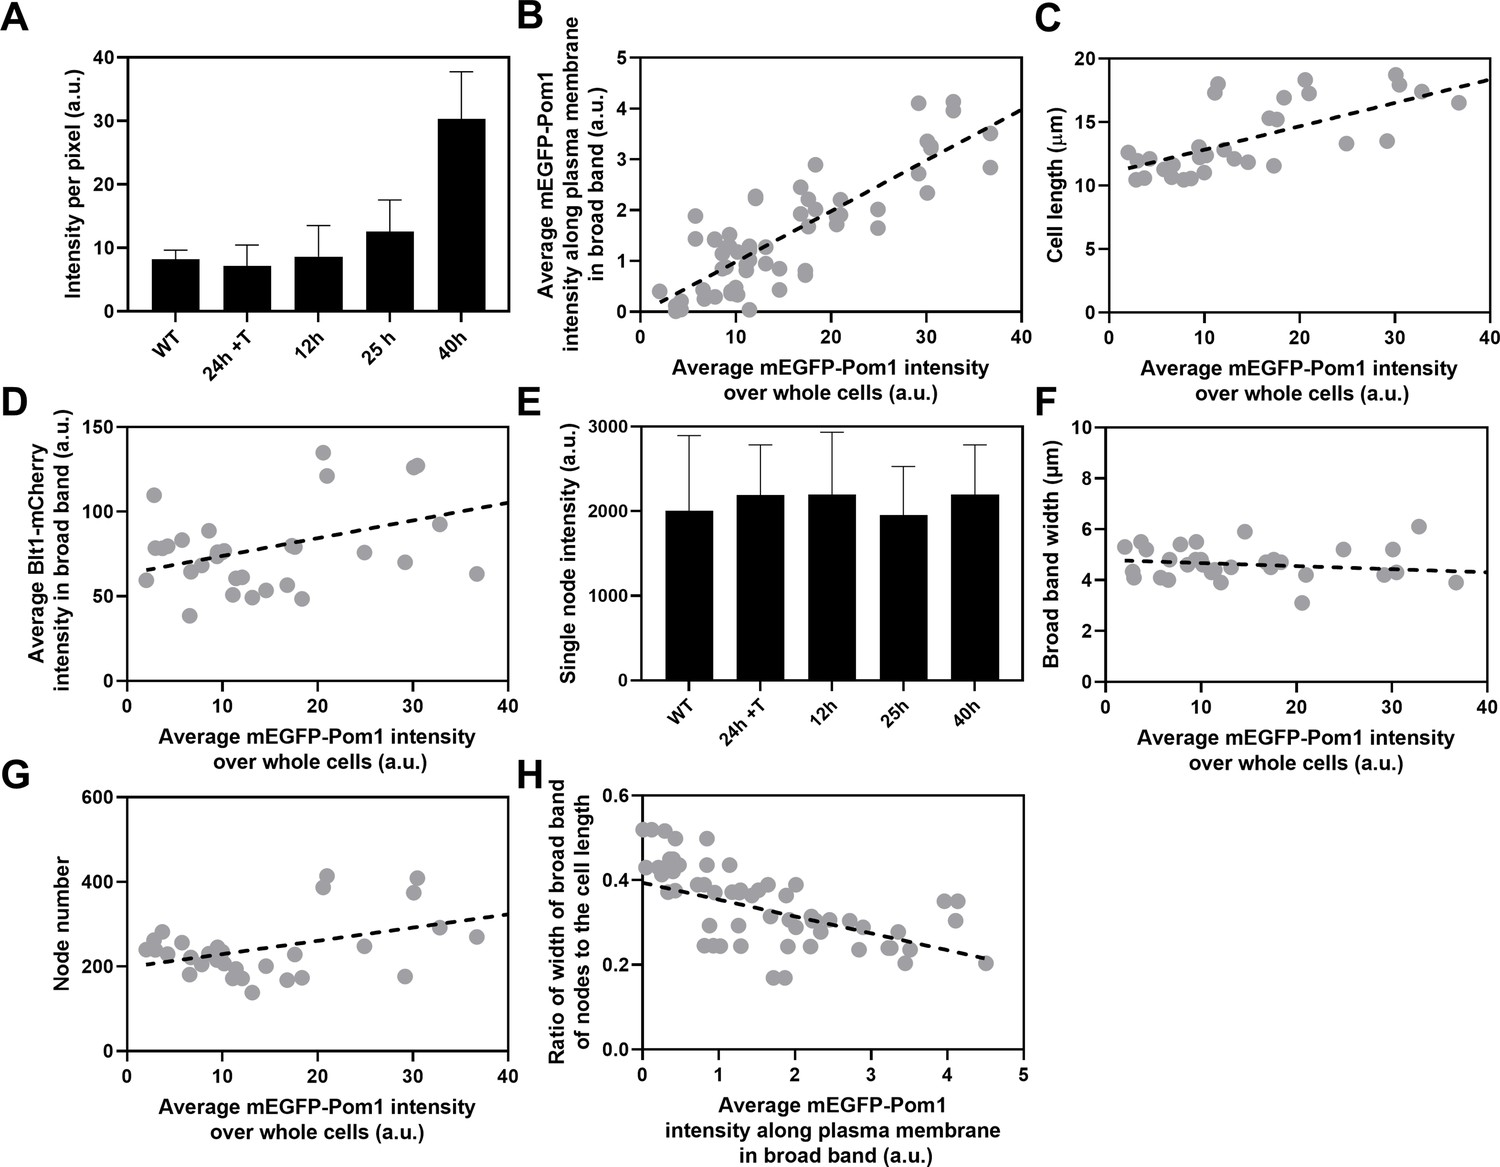
Influence of Pom1 concentration on cell size and numbers of cytokinesis nodes.
Expression of mEGFP-Pom1 in cells from the nmt81 promoter under three conditions: in EMM5S with 5 µg/ml thiamine for 24 hr (n = 6 cells) to suppress expression or in EMM5S without thiamine to promote expression for 12 hr (n = 6 cells), 25 hr (n = 8 cells), or 40 hr (n = 8 cells). Gray symbols show individual cells. (A) mEGFP-Pom1 expression under four conditions measured as fluorescence intensity per pixel of mEGFP-Pom1 over the whole cells. (B) Average mEGFP-Pom1 intensity along the plasma membrane in the broad band of nodes in the middle focal plane of the cells as a function of average mEGFP-Pom1 intensity in whole cells. The slope of the linear regression (black dotted line) is significantly different from zero (p < 0.0001; R2 = 0.7). (C) Cell length as a function of average mEGFP-Pom1 intensity in whole cells. The slope of the linear regression (black dashed line) is significantly different from zero (p < 0.0001; R2 = 0.5). (D) Blt1-mCherry intensity per pixel in node broad band as a function of average mEGFP-Pom1 intensity in whole cells. The slope of the linear regression (black dashed line) is significantly different from zero (p = 0.01; R2 = 0.2). (E) Single node intensities measured by using Blt1-mCherry in WT cells and cells expressing different levels of Pom1. Error bars are standard deviation (SD), p = 0.001 as determined by Tukey’s multiple comparison test. (F) Width of the broad band region as a function of average mEGFP-Pom1 intensity in whole cells. The slope of the linear regression (black dashed line) is not significantly different from zero (p = 0.3; R2 = 0.04). (G) Node number as a function of average mEGFP-Pom1 intensity in whole cells. The slope of the linear regression (black dashed line) is significantly different from zero (p = 0.0017; R2 = 0.3). (H) Ratio of width of broad band of nodes to the cell length as a function of average mEGFP-Pom1 intensity along the plasma membrane in the broad band of nodes in the middle focal plane of the cells. The slope of the linear regression (black dashed line) is significantly different from zero (p = 0.0001; R2 = 0.4).
-
Figure 5—source data 1
Related to Figure 5A–H.
- https://cdn.elifesciences.org/articles/76249/elife-76249-fig5-data1-v1.xlsx
Figure 6
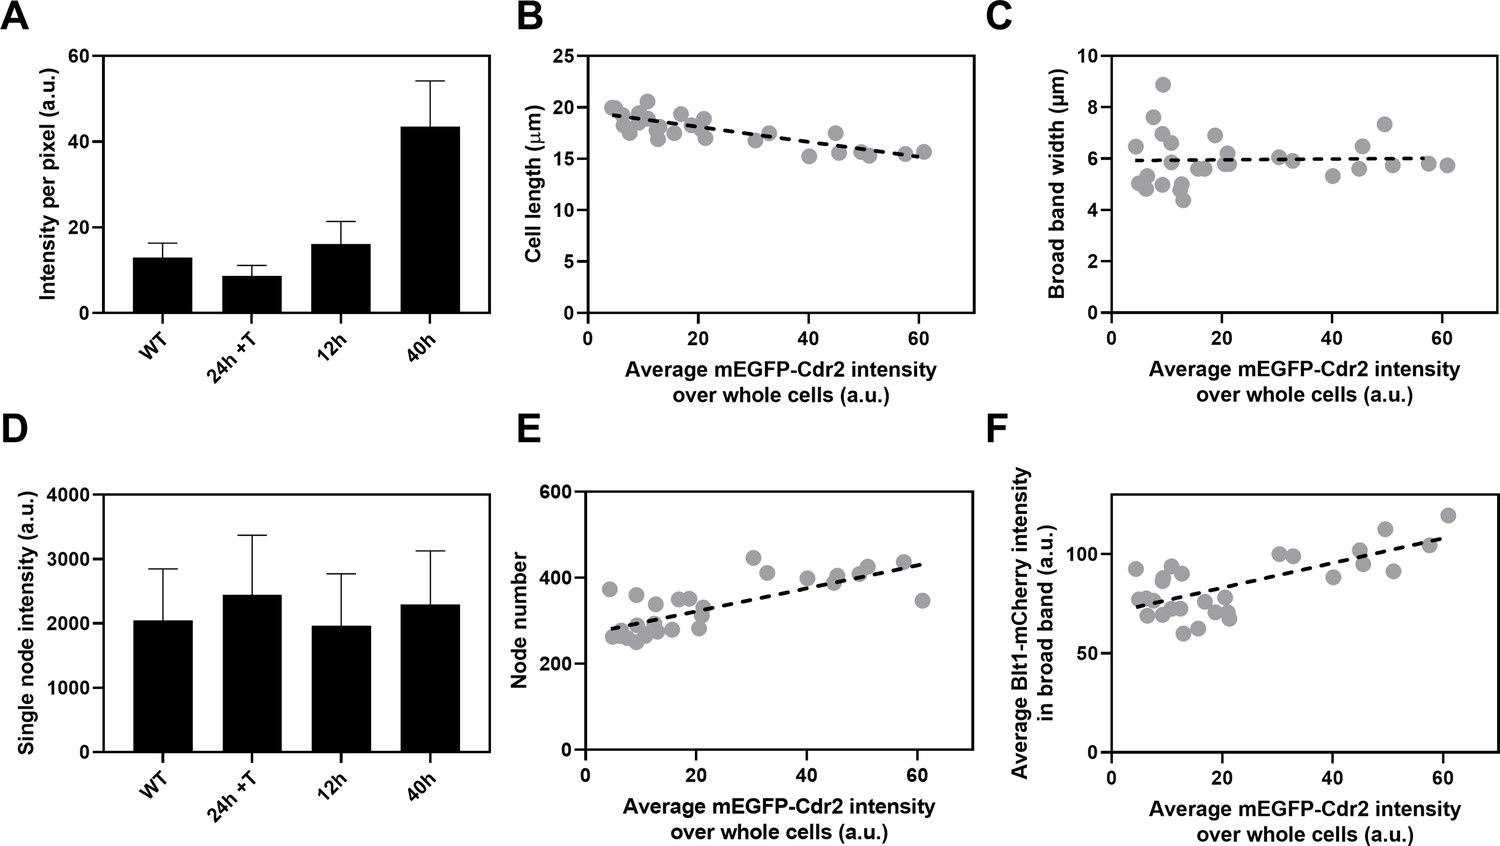
Influence of Cdr2 concentration on cell size and the number of cytokinesis nodes.
Expression of mEGFP-Cdr2 in wild-type cells (n = 11 cells) and from the nmt81 promoter under three conditions: in EMM5S with 5 µg/ml thiamine for 24 hr (n = 10 cells) to suppress expression or in EMM5S without thiamine to promote expression for 12 hr (n = 9 cells) or 40 hr (n = 9 cells). Average fluorescence intensities per pixel were measured in sum projection images over whole cells. Gray symbols show individual cells. (A) Average mEGFP-Cdr2 fluorescence intensities per pixel over the whole cells under four conditions. (B) Cell length as a function of average mEGFP-Cdr2 intensity over whole cells. The slope of the linear regression (black dashed line) is significantly different from zero (p < 0.0001; R2 = 0.6). (C) Width of the broad band of nodes as a function of average mEGFP-Cdr2 intensity over whole cells. The slope of the linear regression (black dashed line) is not significantly different from zero (p = 0.9; R2 = 0.0004). (D) Single node intensities measured by using Blt1-mCherry in WT cells and cells expressing different levels of Cdr2p. (E) Node number as a function of average mEGFP-Cdr2 intensity over whole cells. The slope of the linear regression (black dashed line) is significantly different from zero (p < 0.0001; R2 = 0.6). (F) Blt1-mCherry intensity per pixel in the broad band area as a function of average mEGFP-Cdr2 intensity over whole cells. The slope of the linear regression (black dashed line) is significantly different from zero (p < 0.0001; R2 = 0.7).
-
Figure 6—source data 1
Related to Figure 6A–F.
- https://cdn.elifesciences.org/articles/76249/elife-76249-fig6-data1-v1.xlsx
Figure 7
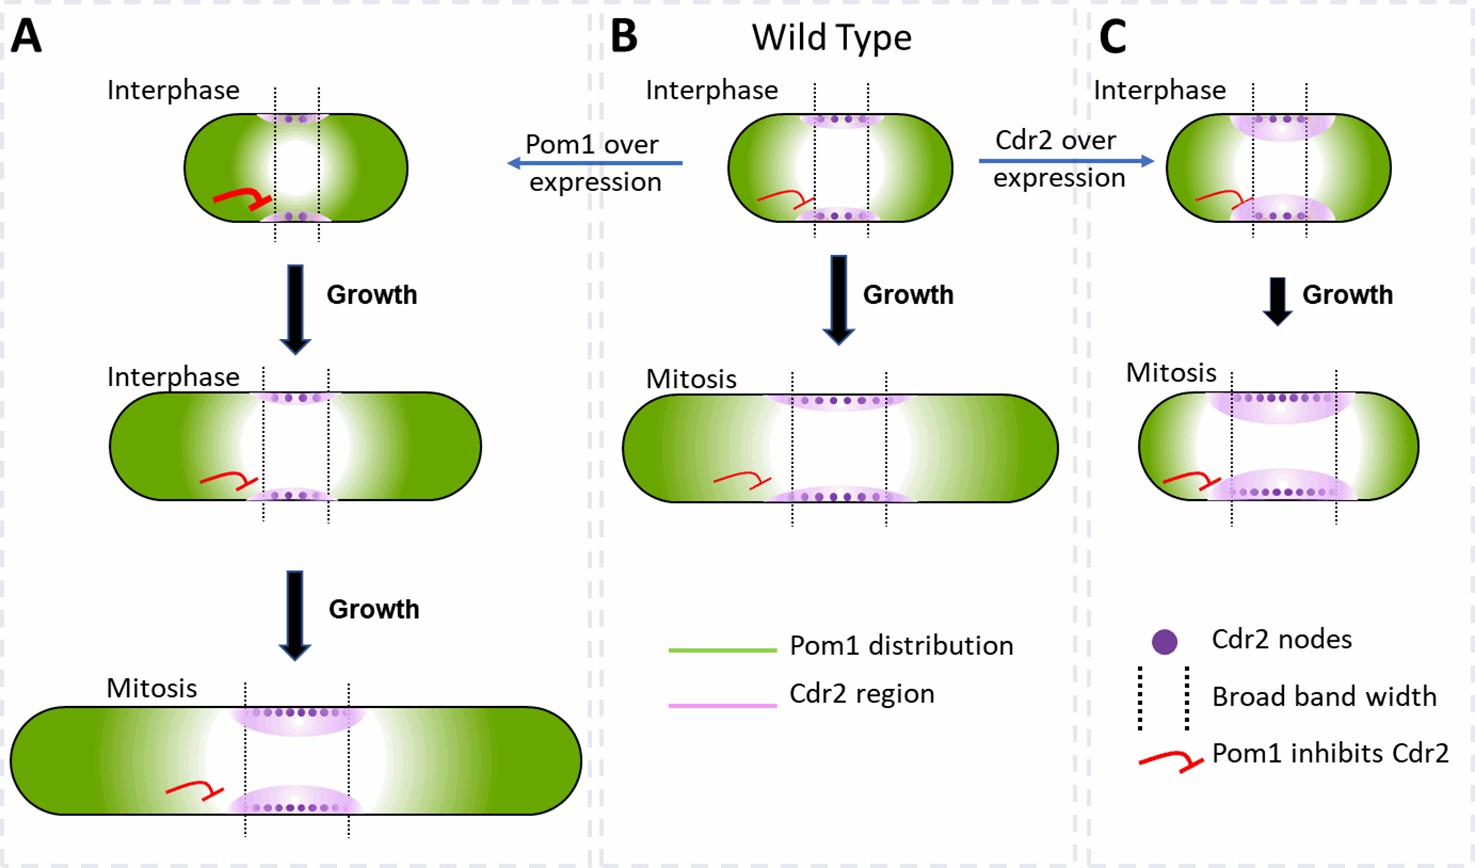
Factors that influence cell size and the broad band of cytokinesis nodes in (A) cells overexpressing Pom1, (B) wild-type cells and (C) cells overexpressing Cdr2.
The gradient of Pom1 along the cell plasma membrane is shown in green. The distribution of Cdr2 on the plasma membrane is shown in magenta and called the Cdr2 region. Purple dots show the density of Cdr2 nodes. Blunt end red lines show the inhibitory action of Pom1 on Cdr2, with the line thickness showing the strength. Lengths of black arrows show the time spent growing. The two dotted lines show the borders of the broad band of nodes.
Author response image 1
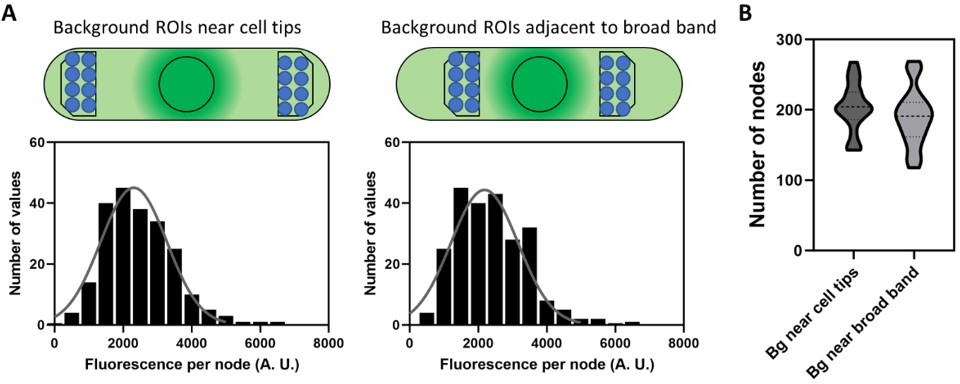
Comparison of two regions to measure cytoplasmic background fluorescence for correcting the fluorescence intensities of unitary nodes, the total fluorescence in the broad band, and the number of cytokinesis nodes.
(A) Schematic diagram of cells to show the position of ROIs for measuring background at the cell tips (left) and adjacent to the node broad band (right). Blue circles are ROIs to measure the background for unitary node intensities and the black polygons are ROIs to measure the background for total node broad band intensities. The histograms show the distributions of unitary node fluorescence intensities in wild type cells obtained after subtracting the background measured at cell tips (left) and adjacent to the node broad band (right). Each distribution satisfies the Shapiro-Wilk normality test with P> 0.05. (B) Violin plots of the numbers of nodes calculated from the ratio of total broad band fluorescence to the average fluorescence of a unitary node when the background (Bg) ROIs were near cell tips or adjacent to node broad band. An unpaired t-test shows that these two distributions did not differ significantly with P = 0.3.
Author response image 2

Comparison of the fluorescence intensity of Blt1-mEGFP in the cytoplasmic background and the broad band.
(A) SUM projected image of 7 central Z- slices (23-29). The yellow line outlines the boundary of the cell. Blue and green shaded areas are 12 pixels wide. (B) Line profiles of the fluorescence intensities of the (blue line) background and (green line) node broad band are both corrected for background outside the cell.
Author response image 3
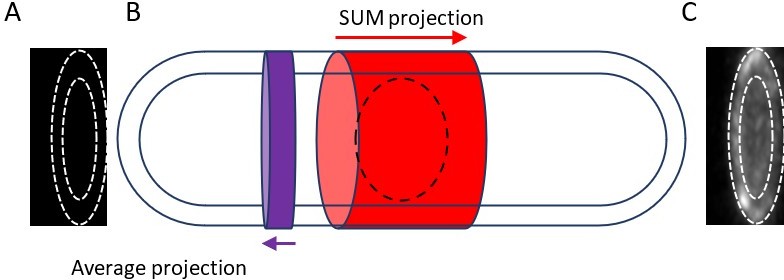
Measuring the total broad band fluorescence intensity with hollow cylinders.
We measured the total fluorescence of a hollow cylinder with a wall thickness extending from the cell surface to the surface of the nucleus and a height equal to the width of the broad band. First, we SUM projected the region of the cell containing nodes in the X-direction (red arrow in panel B) and subtracted the total intensity of the cytoplasm inside the inner white dotted line in panel C. The remaining disk has the total intensity of the node broad band but without background correction (t). To calculate the background, we used the region of the cell near the node broad band shown by the purple disk and average projected it in the direction of the purple arrow shown in panel B to obtain the image in panel A. We calculated the intensity per pixel (i) within the two dotted lines in panel A, multiplied it by the total number of pixels (n) in the hollow cylinder of the node broad band, and subtracted it from the total intensity of broad band (t) to obtain the total intensity of broad band without contributions from the background and nucleus. T = t – (I X n).
Author response image 4
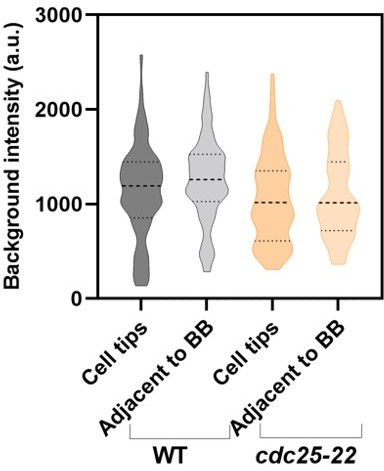
Violin plots comparing the background fluorescence in WT and cdc25-22 mutant cells at the cell tips and adjacent to the broad band (BB).
Author response image 5
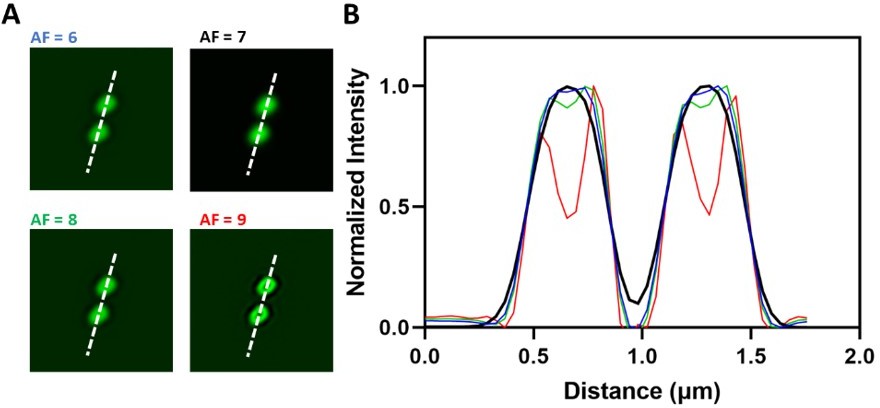
Comparison of different Airyscan filtering strengths.
(A) Airyscan images of two 0.17 µm green fluorescence beads processed with a range of Airyscan filtering strengths. (B) Corresponding line profiles along the white dotted lines in each micrograph in panel (A). The images obtained using AF >7 show artifacts.
Author response image 6
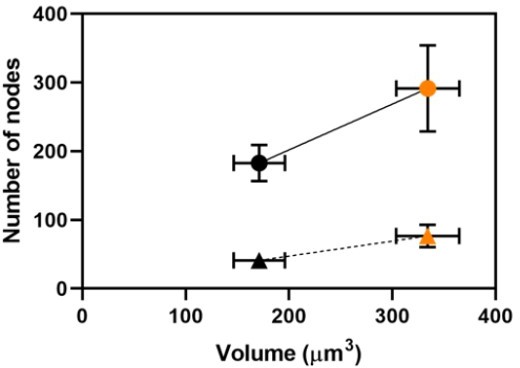
The number of nodes in the broad bands of two strains with different volumes: (black) wild type (n = 11); and (orange) cdc25-22 mutant cells (n = 8).
Nodes were counted by two methods: (circles) calculation from the ratio of total broad band Blt1-mEGFP fluorescence (corrected for background) to the average fluorescence intensity of a unitary node (corrected for background) as explained in the Methods section; and (triangles) direct counting of unitary nodes resolved in 3D reconstructions of Airyscan images. Vertical and horizontal bars are ±1 SD. The vertical SD is smaller (5) than the data point for the direct count of WT cells.
Author response image 7
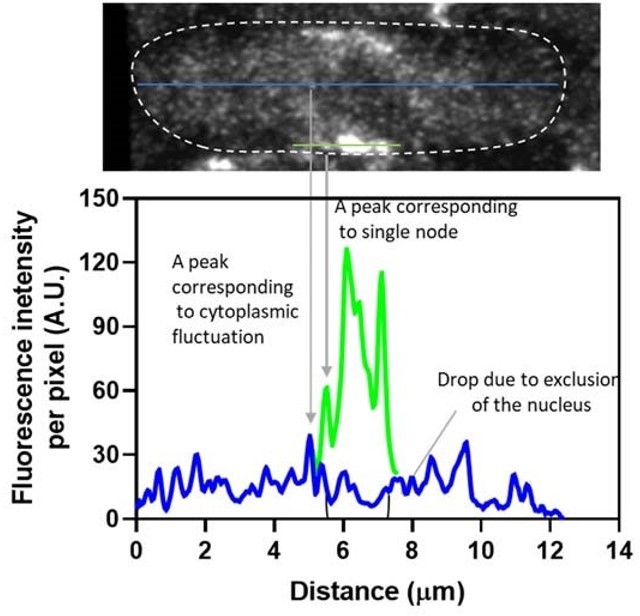
Comparison of the fluorescence intensity of Blt1-mEGFP in the cytoplasmic background and along the one edge of the cell containing a single node and clusters of nodes.
(A) SUM projected image of 7 central Z-slices (22–28). The white dotted line outlines the boundary of the cell. Blue and green lines are one pixel wide. (B) Line profiles of the fluorescence intensities of the (blue) cytoplasmic background and (green) the broad band of nodes, including a single node are both corrected for background outside the cell.
Author response image 8
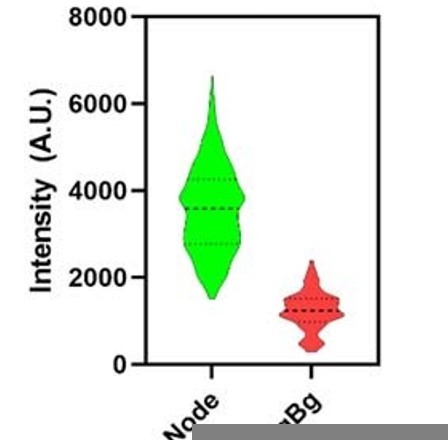
Violin plots of the intensity of single nodes without background correction (Node, green) and the average cytoplasmic background (AvgBg).
Tables
Table 1
Strains used in this study.
| Strain | Genotype | Source |
|---|---|---|
| WS40 | h− blt1-mEGFP:KanMX6 sad1-RFP:KanMX6 ade6-M21X leu1-32 ura4-Δ18 | Laboratory Stock |
| WS46 | h− cdc25-22 blt1-mEGFP:KanMX6 sad1-RFP:KanMX6 ade6-M21X leu1-32 ura4-Δ18 | This study |
| WS47 | h− wee1-50 blt1-mEGFP:KanMX6 sad1-RFP:KanMX6 ade6-M21X leu1-32 ura4-Δ18 | This study |
| WS51.1 | h− rga2Δ blt1-mEGFP:KanMX6 sad1-RFP:KanMX6 ade6-M21X leu1-32 ura4-Δ18 | This study |
| WS52.1 | h− rga4Δ blt1-mEGFP:KanMX6 sad1-RFP:KanMX6 ade6-M21X leu1-32 ura4-Δ18 | This study |
| WS59 | h− pom1-GFP kanMX6 blt1-mCherry natMX6 sad1-mRFP kanMX6 ade6-M21X leu1-32 ura4-Δ18 | Laboratory Stock |
| WS54 | h− rga2Δ pom1-GFP kanMX6 blt1-mCherry natMX6 sad1-mRFP kanMX6 ade6-M21X leu1-32 ura4-Δ18 | This study |
| WS55 | h− rga4Δ pom1-GFP kanMX6 blt1-mCherry natMX6 sad1-mRFP kanMX6 ade6-M21X leu1-32 ura4-Δ18 | This study |
| WS56 | h− cdc25-22 pom1-GFP kanMX6 blt1-mCherry natMX6 sad1-mRFP kanMX6 ade6-M21X leu1-32 ura4-Δ18 | This study |
| WS57 | h− wee1-50 pom1-GFP kanMX6 blt1-mCherry natMX6 sad1-mRFP kanMX6 ade6-M21X leu1-32 ura4-Δ18 | This study |
| WS70 | h− HygMX6-Pnmt81-mEGFP-Pom1 blt1-mCherry natMX6 sad1-mRFP kanMX6 ade6-M21X leu1-32 ura4-Δ18 | This study |
| WS71 | h− KanMX6-Pnmt81-mEGFP-Cdr2 blt1-mCherry natMX6 sad1-mRFP kanMX6 ade6-M21X leu1-32 ura4-Δ19 | This study |
| CL181 | h+ KanMX6-Pmyo2-mEGFP-myo2 Sad1-RFP-KanMX6 ade6-M216 his3-D1 leu1-32 ura4-D18 | Laboratory Stock |
| JW875 | h+ cdc25-22 kanMX6-Pmyo2-GFP-myo2 ade6-M210 leu1-32 | Laboratory Stock |
Additional files
-
Transparent reporting form
- https://cdn.elifesciences.org/articles/76249/elife-76249-transrepform1-v1.pdf
-
Source code 1
Matlab code to extract data from Airyscan images to make Figures 2, 3, 5 and 6.
- https://cdn.elifesciences.org/articles/76249/elife-76249-code1-v1.zip
Download links
A two-part list of links to download the article, or parts of the article, in various formats.
Downloads (link to download the article as PDF)
Open citations (links to open the citations from this article in various online reference manager services)
Cite this article (links to download the citations from this article in formats compatible with various reference manager tools)
The number of cytokinesis nodes in mitotic fission yeast scales with cell size
eLife 11:e76249.
https://doi.org/10.7554/eLife.76249


