Oscillatory movement of a dynein-microtubule complex crosslinked with DNA origami
- Biomedical Research Institute, National Institute of Advanced Industrial Science and Technology (AIST), Japan
- Research Center for Functional Materials, National Institute for Materials Science, Japan
- Institute for Protein Research, Osaka University, Japan
- SLST and Gene Editing Center, ShanghaiTech University, China
- Graduate School of Science, The University of Tokyo, Japan
- Kyushu Institute of Technology, Japan
- Institut Pasteur, France
Figures
Figure 1
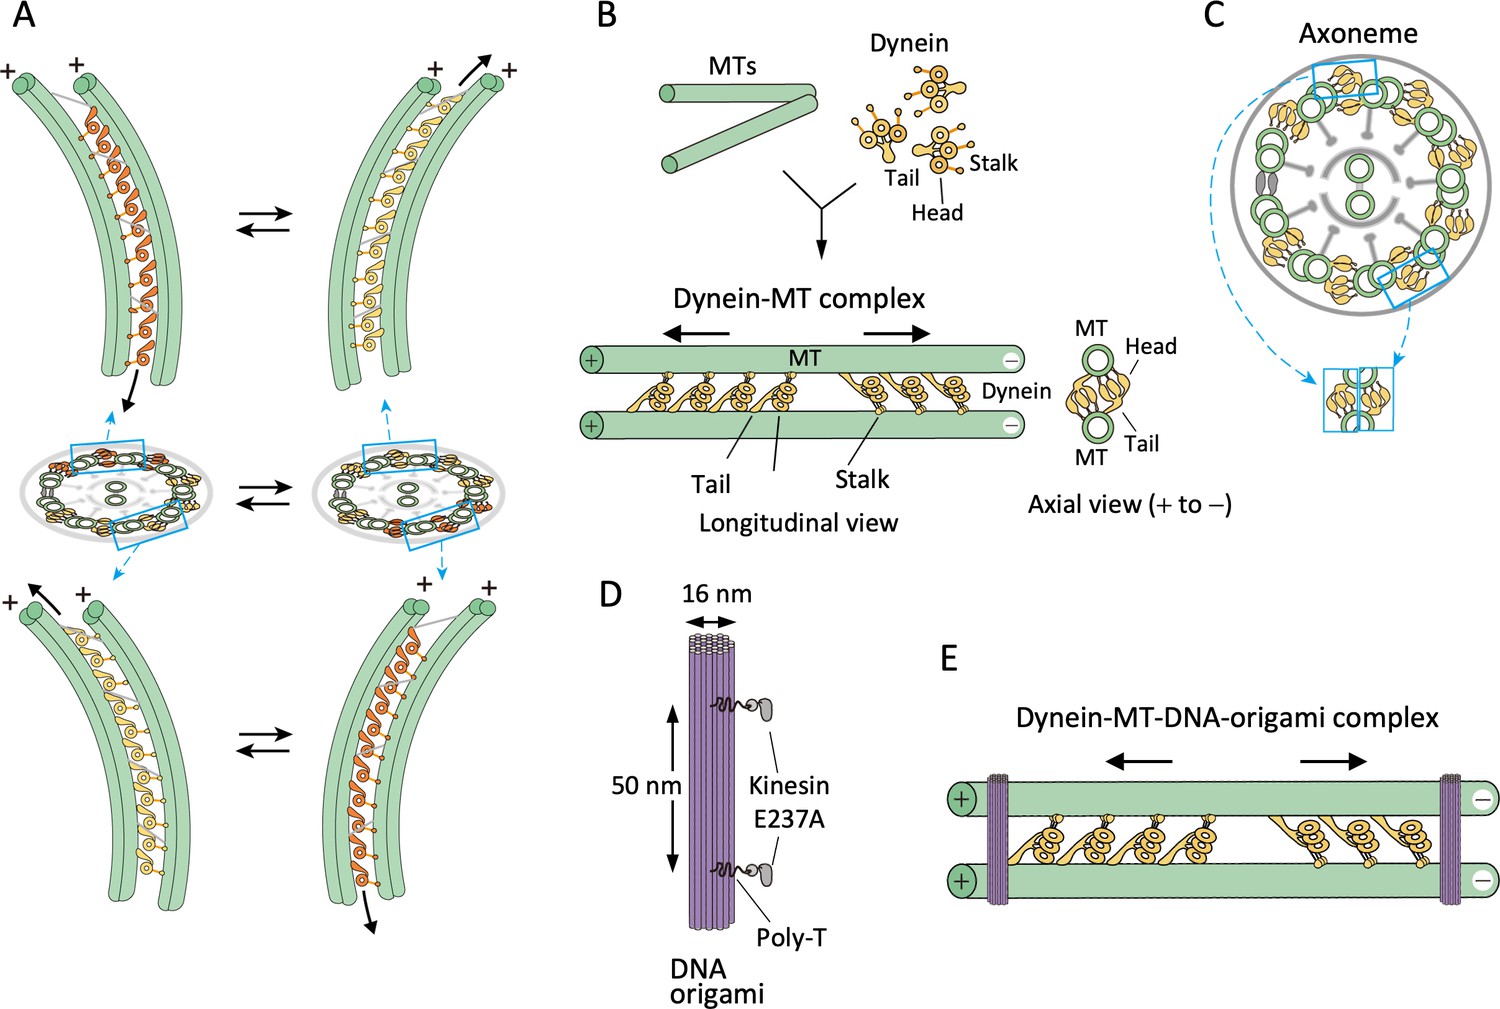
Design of the dynein-microtubule-DNA-origami (dynein-MT-DNA-origami) complex.
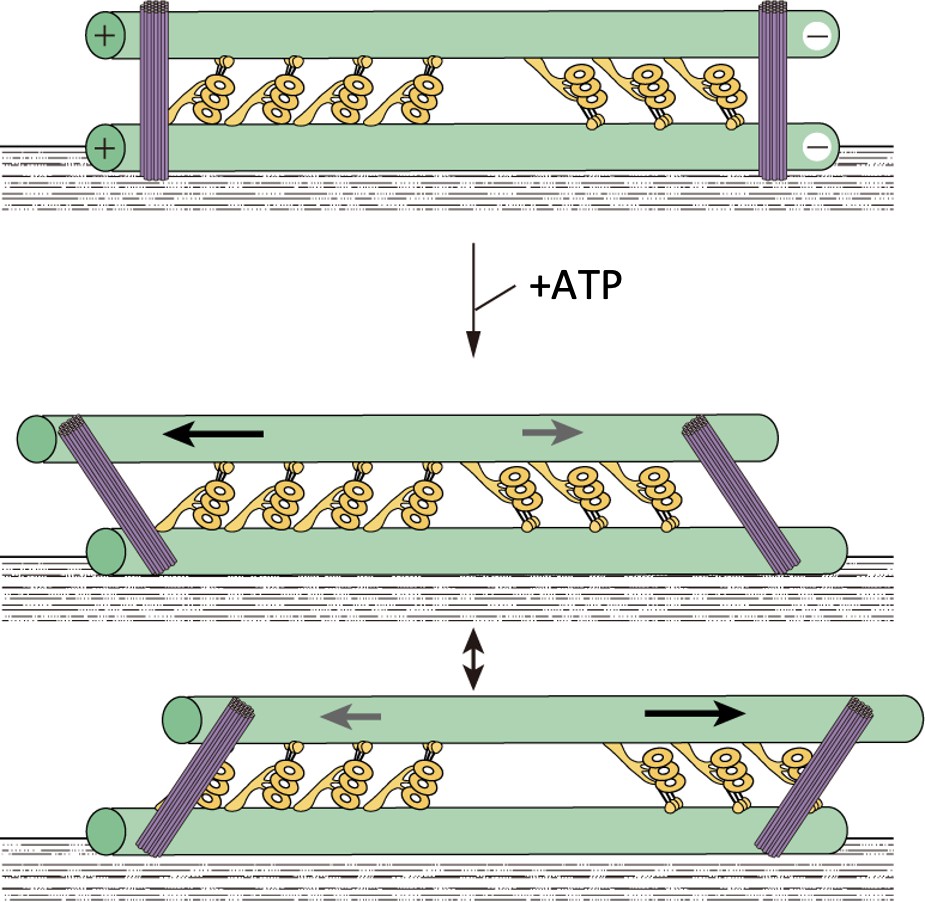
(A) Schematic models showing directions of dynein sliding and bending of the axoneme. Dynein molecules between two pairs of doublet MTs, one pair on the far-side (top) and another pair on the near-side (bottom) are illustrated. When viewed from the front of the axoneme, the stalk and head of a far-side dynein are seen to the left of the tail, whereas those of a near-side dynein are on the right. As a result, the axoneme bends in opposite directions when only the far-side or only the near-side dyneins are activated and move toward the minus ends (colored in orange). Bending of the axoneme causes sliding of dynein on the unactivated side (yellow) toward the plus end. (B) Geometry of the dynein-MT complex. Longitudinal and axial views are illustrated. Chlamydomonas outer-arm dynein molecules crossbridge two MTs, binding with their tails and stalks. The stalks point toward the MT minus end. Because the tails and stalks bind to different MTs, there are two possible orientations for dynein depending on which MT the stalks bind to. (C) Schematic illustration of a cross-sectional view of an axoneme. Note that the geometry of dyneins in the dynein-MT complex shown in (B) mimics that of a combination of the dyneins on two opposite sides of the axoneme (cyan boxes), although the dynein arrays in (B) are not continuous. (D) Design of rod-shaped DNA origami. For binding to MTs, mutant kinesin motor domains (E237A) were attached to 5'-SNAP-ligand-modified handles placed on the DNA rod. The two handles were separated by ~50 nm, corresponding to the center-to-center distance of the two MTs in the dynein-MT complex. Each handle has 30 nucleotides of poly-thymidine linker between the SNAP ligand and the rod. (E) Geometry of the dynein-MT complex crosslinked with DNA-origami rods. In the presence of ATP, dynein molecules bound in the opposite orientations are thought to produce force in opposite directions (indicated by arrows). DNA rods are expected to crosslink the two MTs of the complex and restrict their relative movement.
Figure 2 with 4 supplements
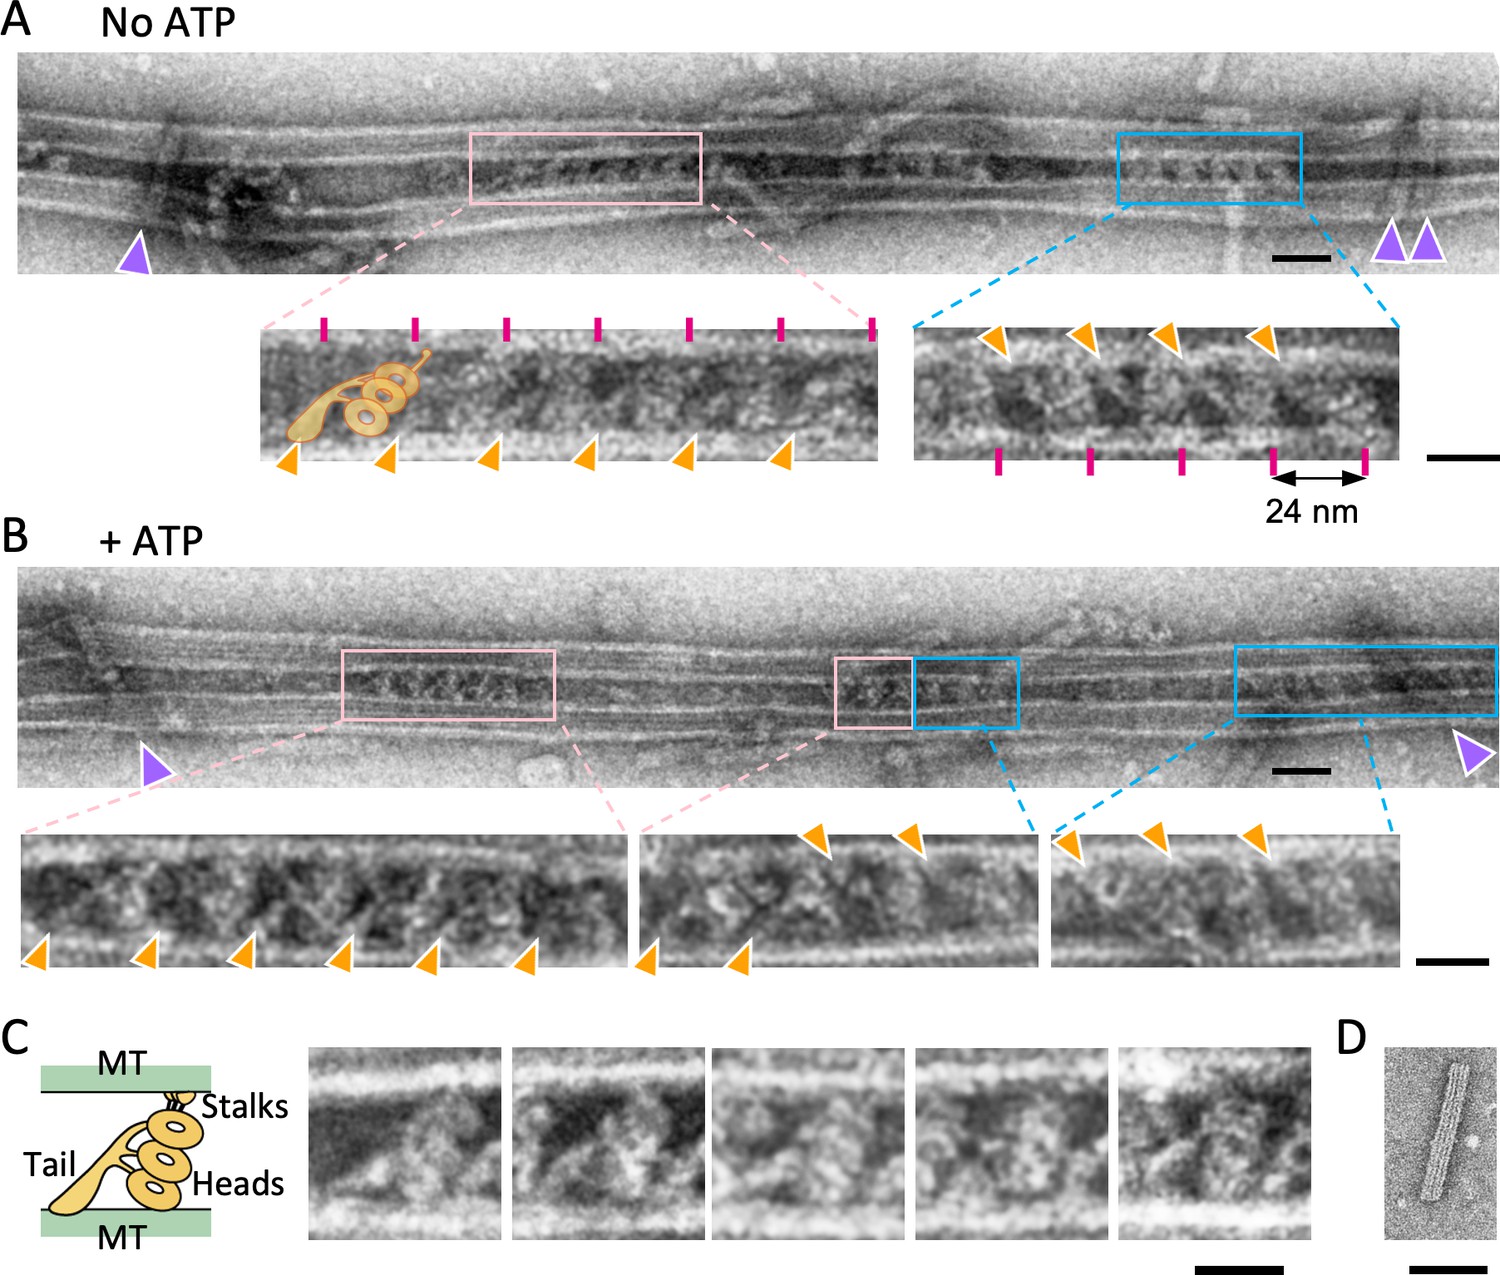
Structure of the dynein-microtubules-DNA-origami (dynein-MT-DNA-origami) complex.
(A–B) Negative stain images of the dynein-MT-DNA-origami complex in the absence (A) and presence (B) of 0.1 mM ATP. DNA rods crosslinking the MTs are indicated by purple arrowheads. Dynein molecules tend to bind in patches and the neighboring dyneins usually have the same orientation. Patches of dynein cross-bridging the MTs in two different orientations are indicated by pink and cyan boxes. Enlarged views show examples of dyneins in two orientations, with their tails (indicated by orange arrowheads) on different MTs. Magenta lines show a periodicity of 24 nm. The typical shape of an outer-arm dynein is illustrated. Bars: 50 nm in low magnification images and 20 nm in enlarged views. (C) Images of individual dynein molecules crossbridging two MTs. As illustrated on the left, the characteristic shapes of a Chlamydomonas outer-arm dynein molecule (Heuser et al., 2009; Movassagh et al., 2010) with a tail and three heads are observed. Bar: 20 nm. (D) A negative stain image of a DNA origami rod. Bar: 50 nm.
-
Figure 2—source data 1
Numerical data for Figure 2—figure supplement 4.
- https://cdn.elifesciences.org/articles/76357/elife-76357-fig2-data1-v1.xlsx
Figure 2—figure supplement 1
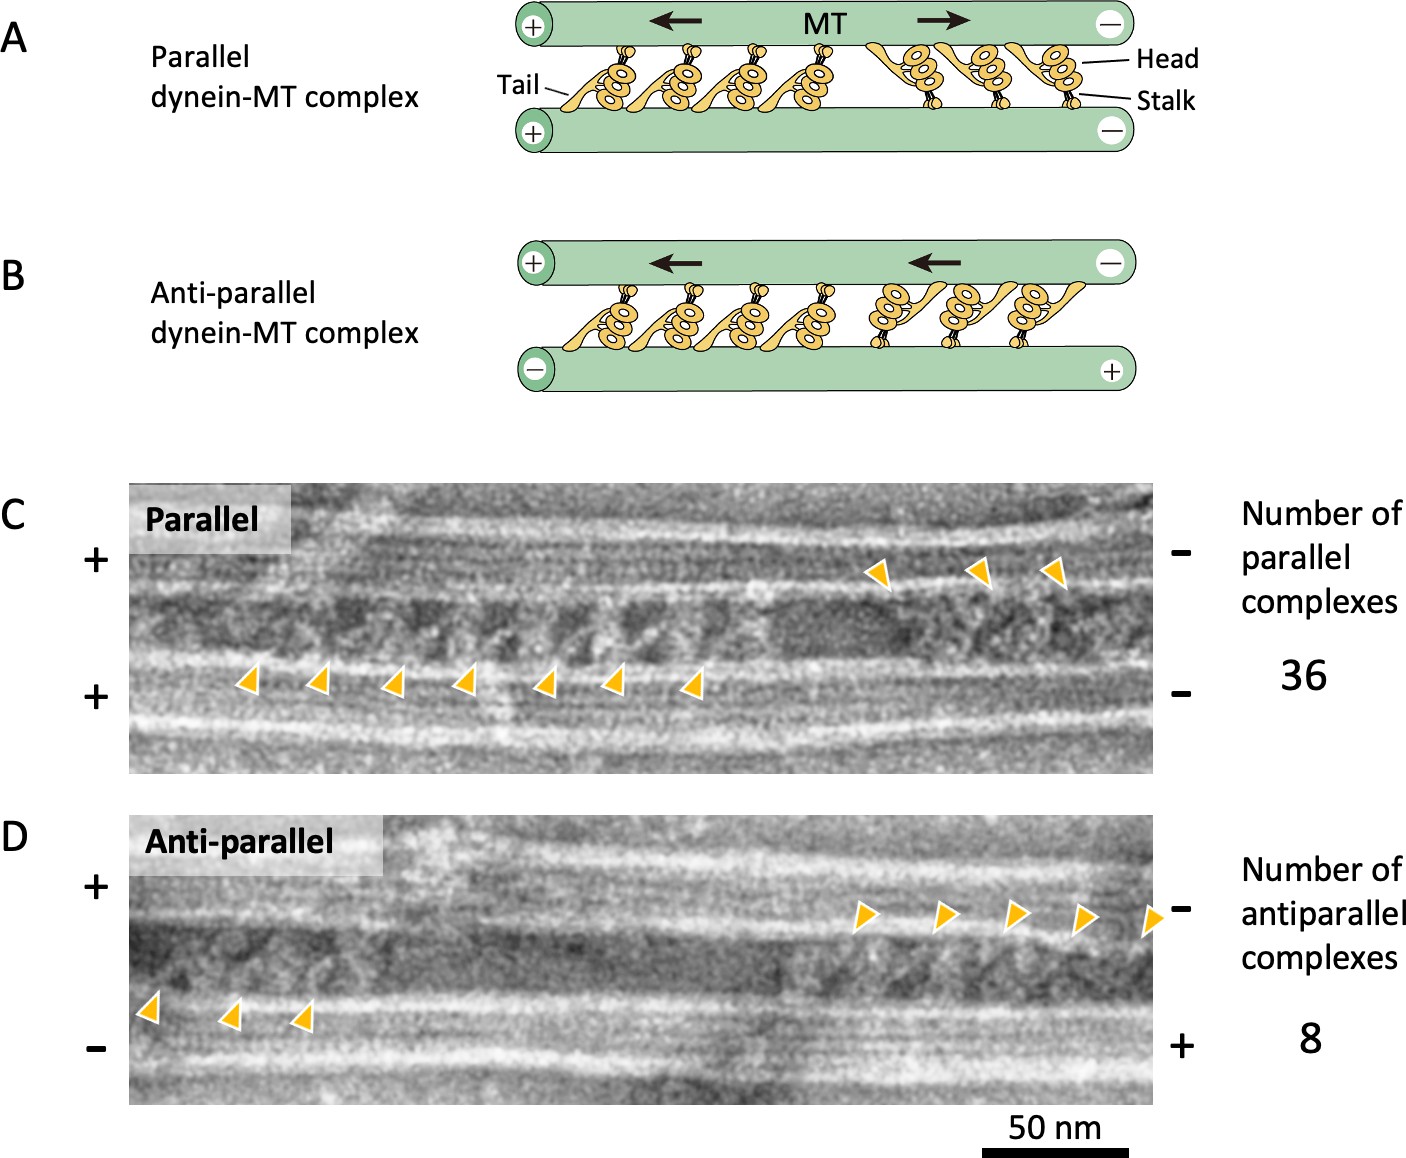
Geometries of the dynein-microtubule (dynein-MT) complex.
(A – B) A diagram showing two different geometries of the dynein-MT complex. An outer-arm dynein molecule cross-bridges two MTs by binding to one of the MTs with the MT-binding domain at the end of the stalk and to another MT with the tail. The stalk of each dynein is oriented closer to the minus end of the MT to which the stalk binds. Therefore, there are two possible orientations for dynein bound between a pair of MTs, depending on which MT its stalk binds to. If the two MTs have the same polarity as in vivo, two groups of dynein molecules produce opposing force (A). On the other hand, if the MTs are anti-parallel, all the dynein molecules produce force in the same direction (B). (C – D) Electron microscopy (EM) images of dynein-MT complexes showing two different geometries as illustrated in (A) and (B). When high-salt extracted Chlamydomonas dynein was used, ~80% of the complexes (36 out of 44 complexes) had MTs with the same polarity, as judged by the negative stain images. The positions of the dynein tails are indicated by orange arrowheads.
Figure 2—figure supplement 2
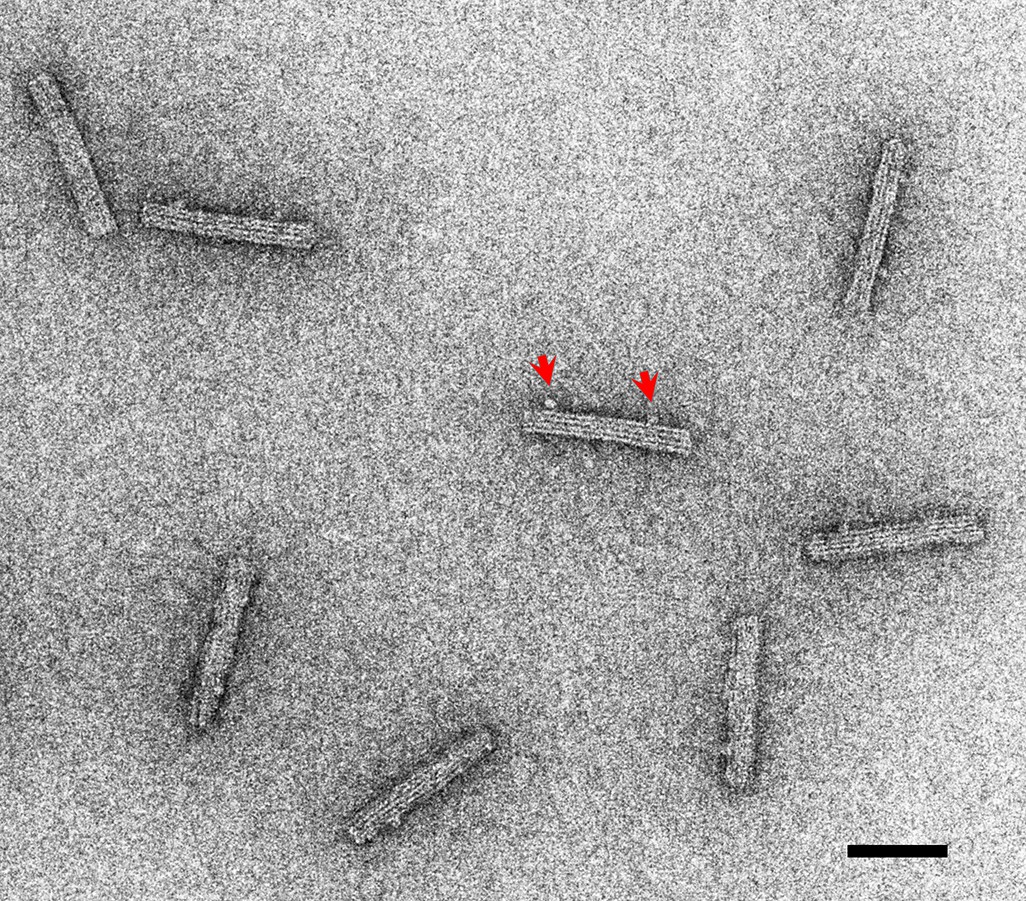
A negative stain image of DNA origami rods.
Linkers are observed for some DNA origami rods (an example indicated by red arrows). Bar: 50 nm.
Figure 2—figure supplement 3
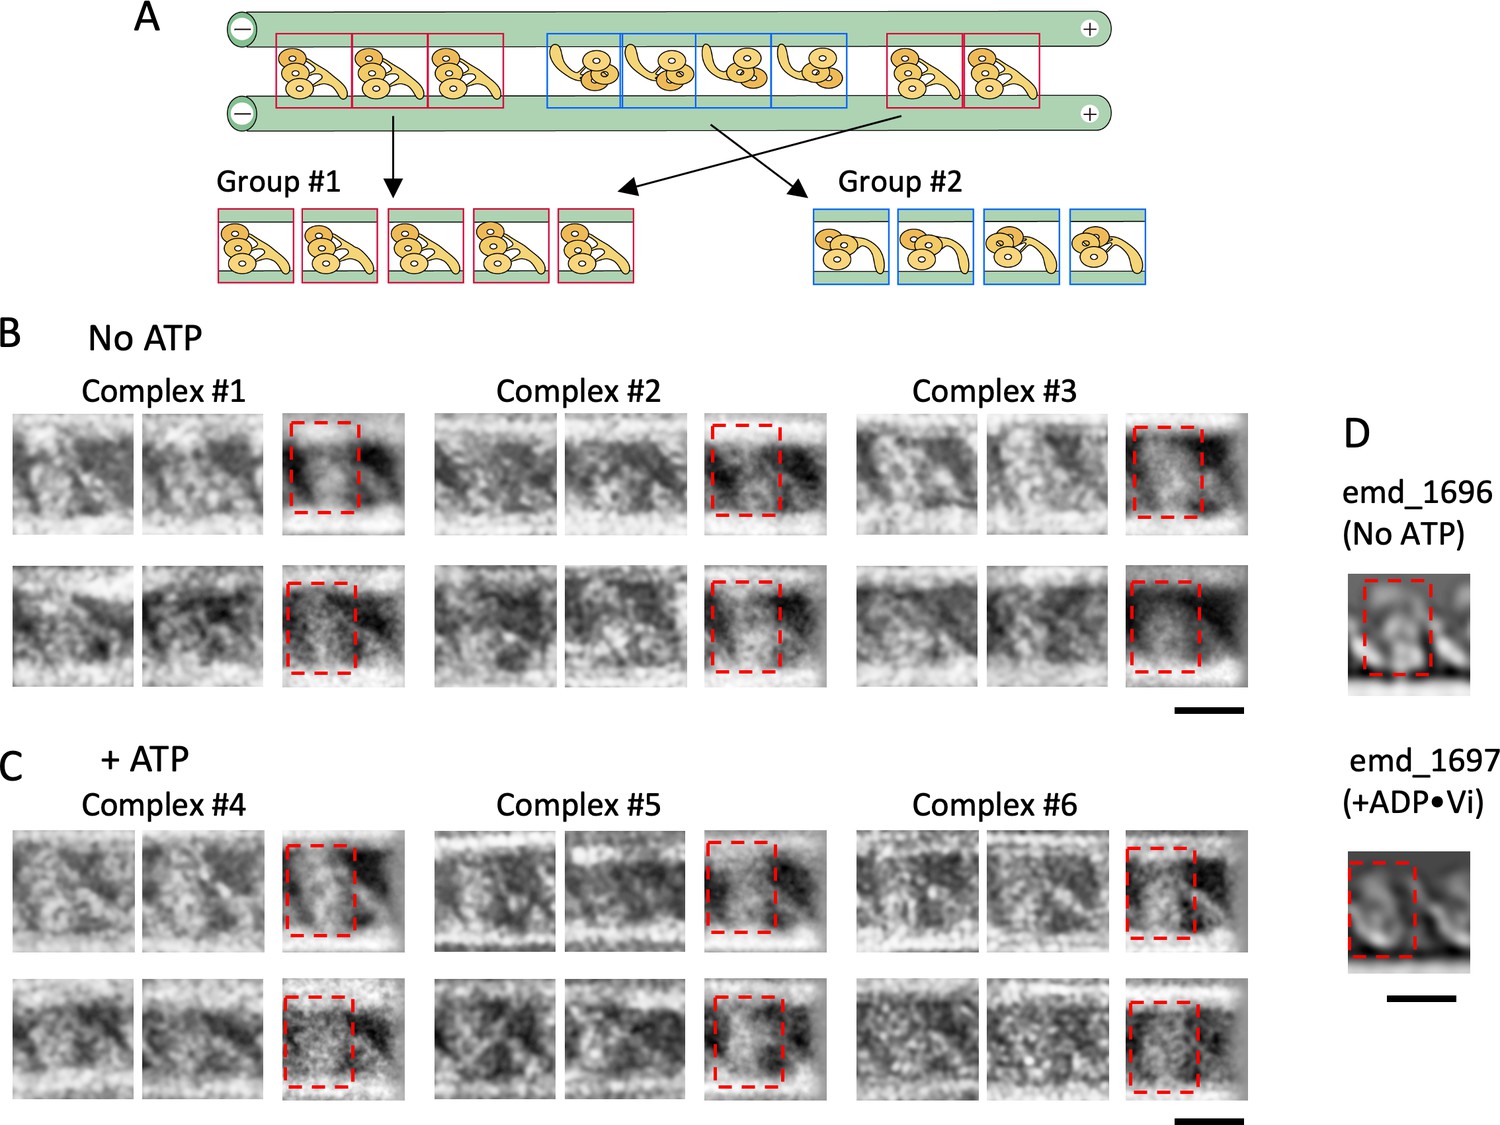
Structures of dynein molecules in the absence and presence of ATP.
(A) Schematic of the classification method. Images of individual dynein molecules in each dynein-microtubule-DNA-origami (dynein-MT-DNA-origami) complex were classified into two groups depending on the orientation. The averaged image for each group was calculated. (B – C) Examples of individual and averaged images. Images from three complexes in the absence of ATP (B) and three in the presence of ATP (C) are shown. The top and bottom rows show oppositely oriented dyneins, rotated so that the MT minus end is toward the left. For each group, two individual images (left) and the averaged image (right) are shown (n=30 and 5, 11 and 11, 15 and 12, 22 and 2, 20 and 9, 14 and 19 for the complexes #1–6, respectively). (D) 2D-projected images of cryo-electron tomograms of Chlamydomonas outer-arm dynein without nucleotide and with ADP•Vi (EMDB maps emd_1696 and emd_1697) (Movassagh et al., 2010). Dynein heads are indicated by red squares in (B – D). Bars: 20 nm.
Figure 2—figure supplement 4
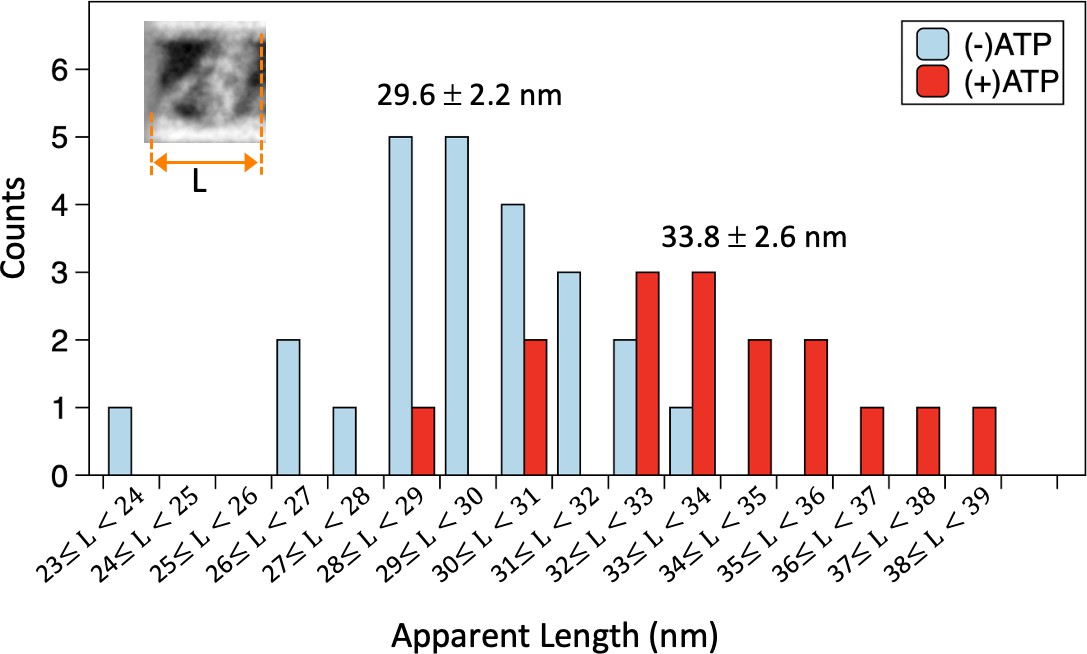
Apparent lengths of microtubule (MT)-bound dynein molecules in the absence and presence of ATP measured in negative stain images.
The histogram shows distribution of the average lengths (L) of MT-bound dynein molecules along the MT axis, calculated for each dynein-MT complex. The average and standard deviation (n=24 and 16 for the absence and presence of ATP, respectively) are indicated. Also see Figure 2—source data 1.
Figure 3 with 1 supplement
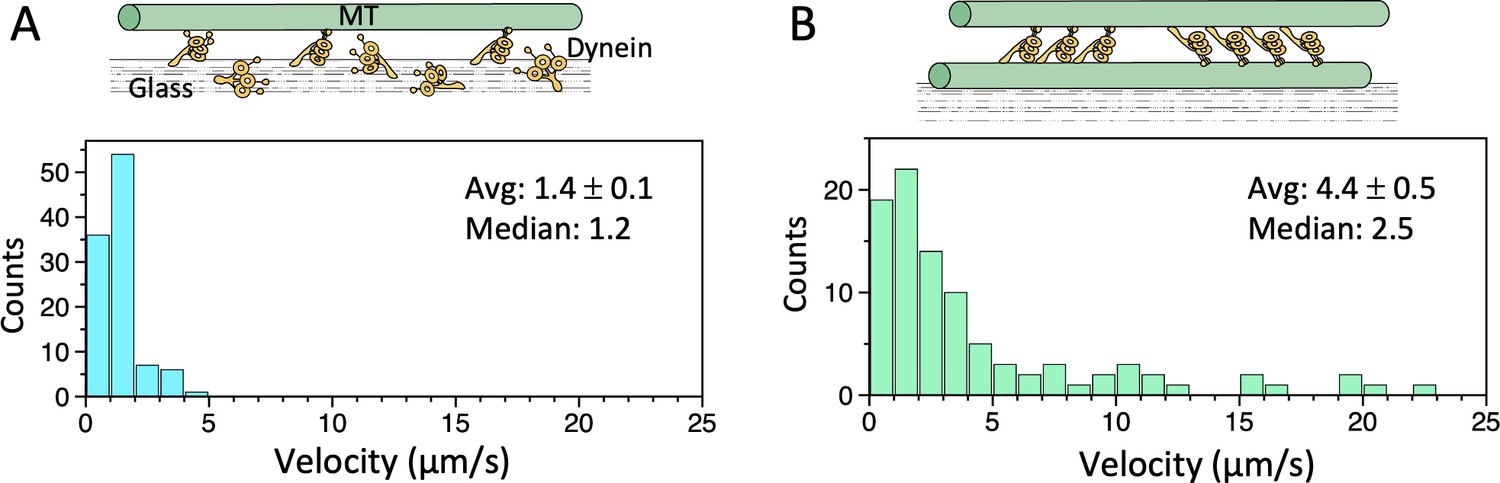
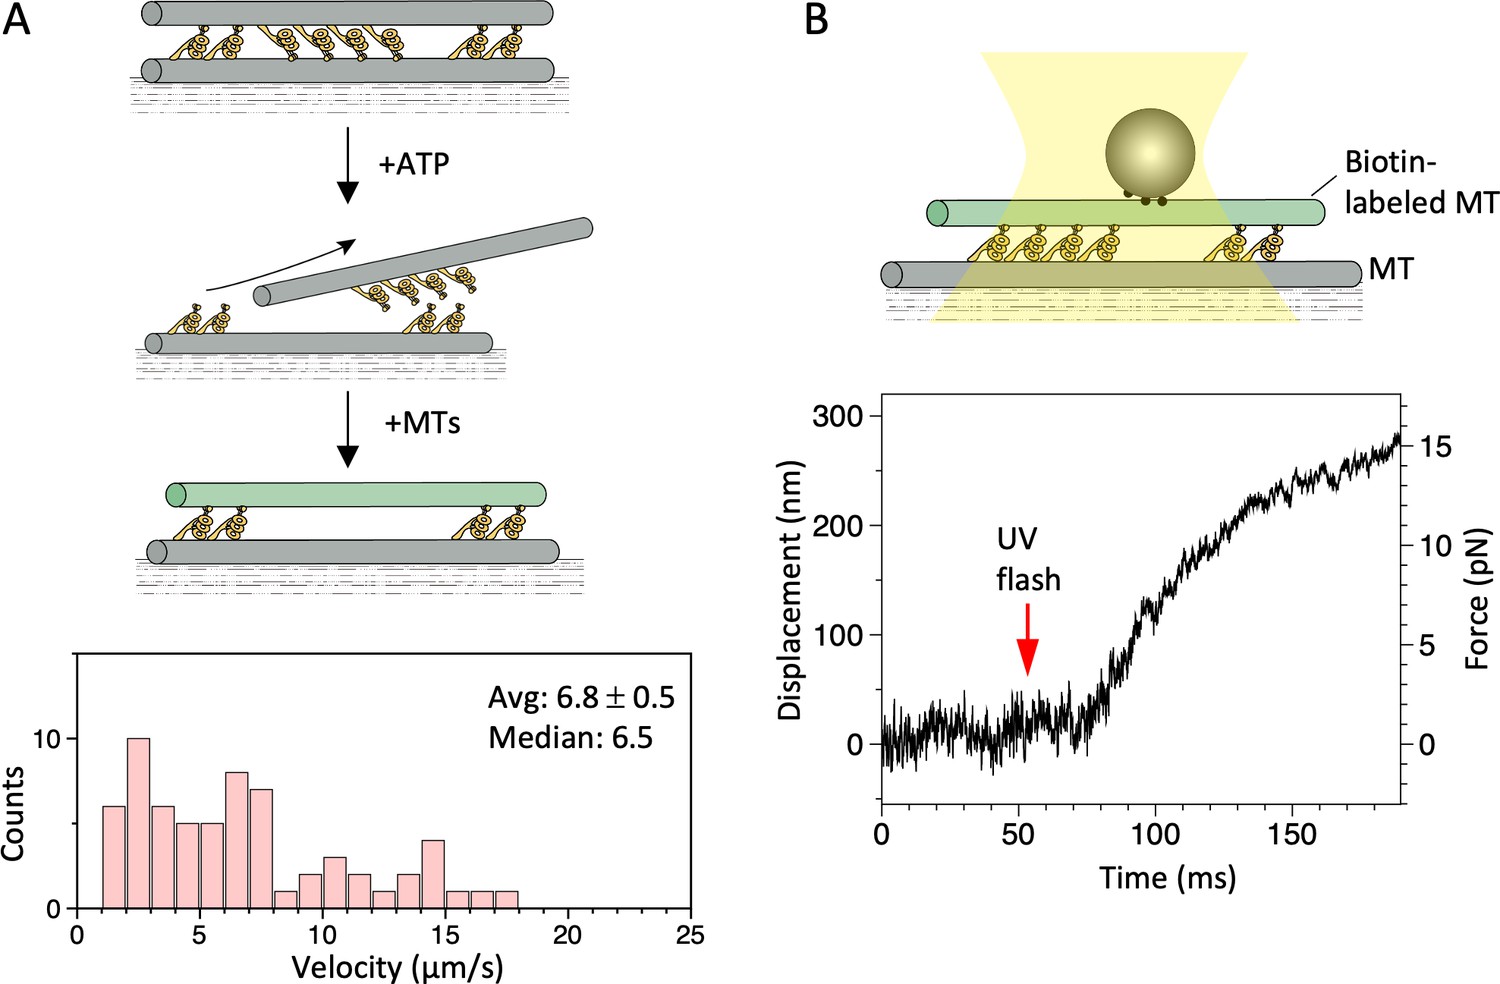
Microtubule (MT)-gliding velocities in two different conditions.
(A) Distributions of the MT gliding velocities in usual MT gliding assays in which MTs move over dynein-coated glass surfaces. (B) Relative sliding velocities of the MTs in a dynein-MT complex that contains dyneins in two opposite orientations. Average (mean ± SEM) and median values of the velocities are indicated (n=104 and 94 for A and B, respectively). Also see Figure 3—source data 1.
-
Figure 3—source data 1
Numerical data for Figure 3.
- https://cdn.elifesciences.org/articles/76357/elife-76357-fig3-data1-v1.xlsx
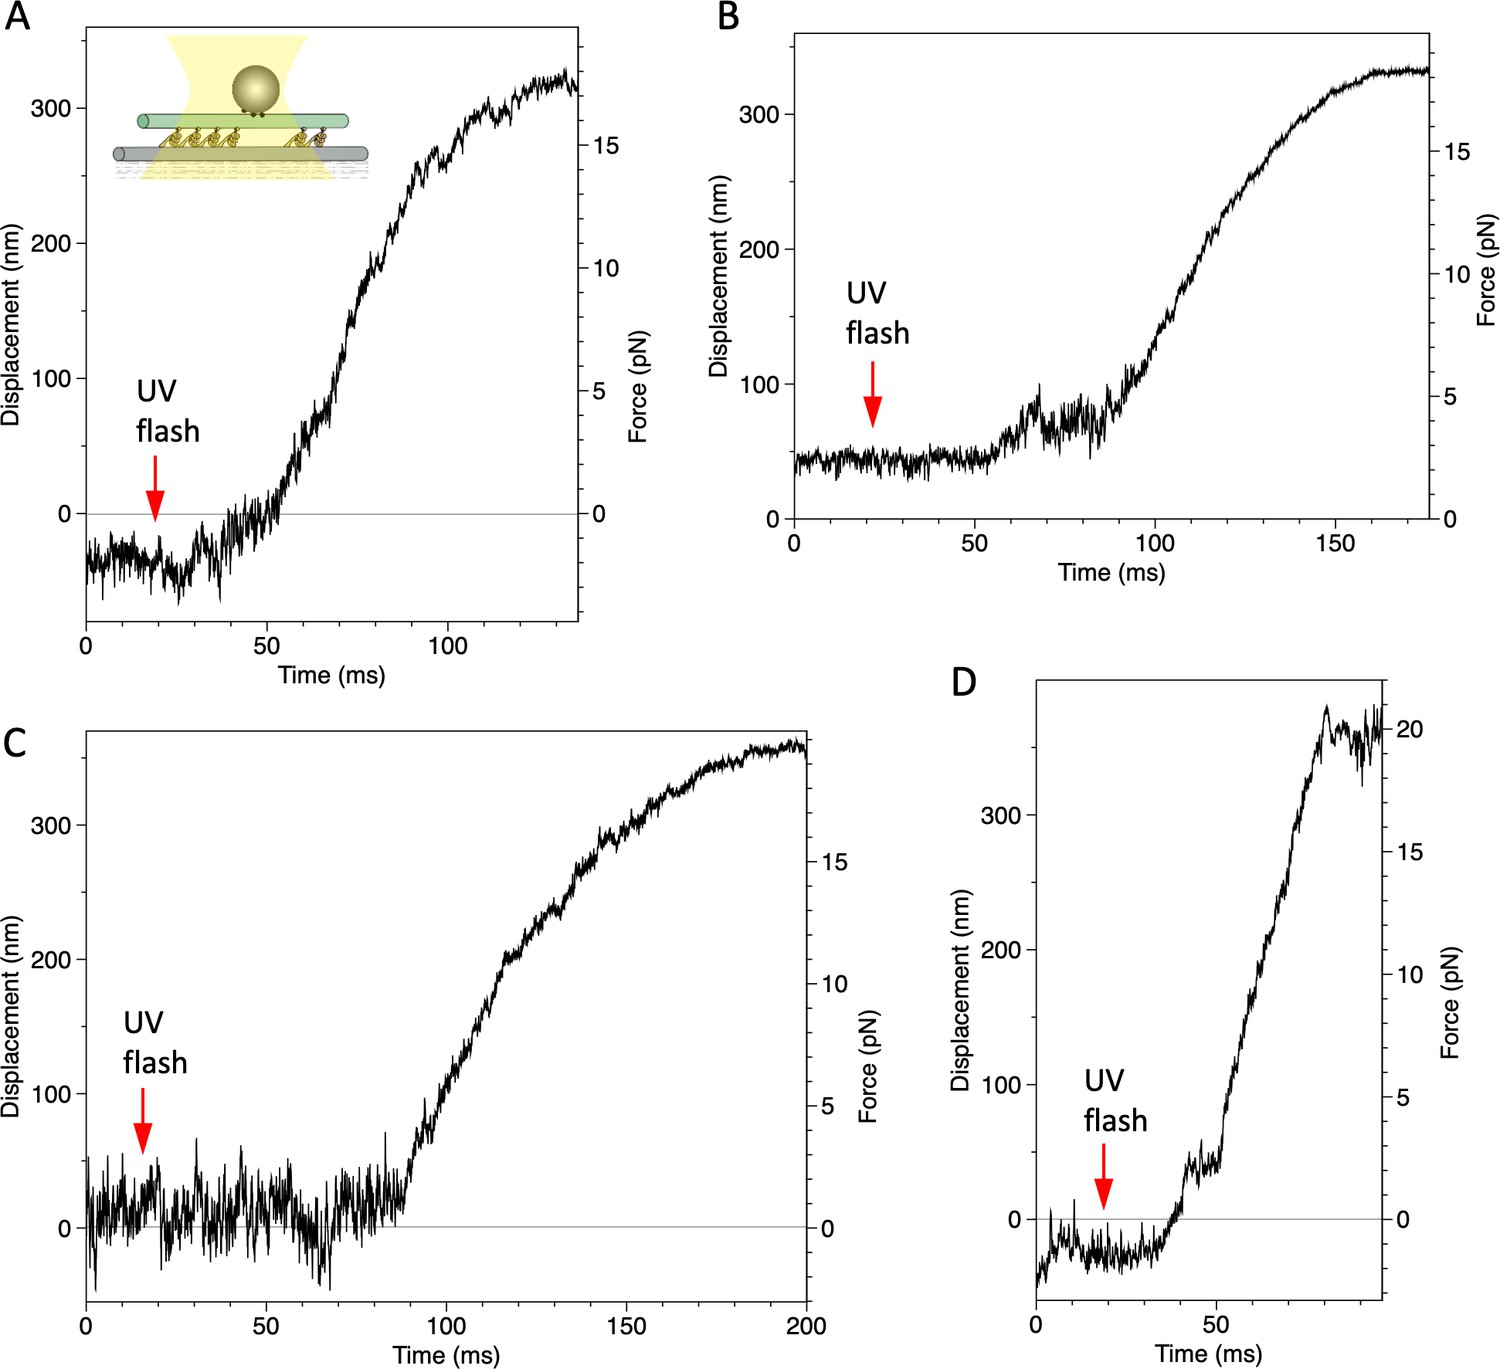
Figure 3—figure supplement 1
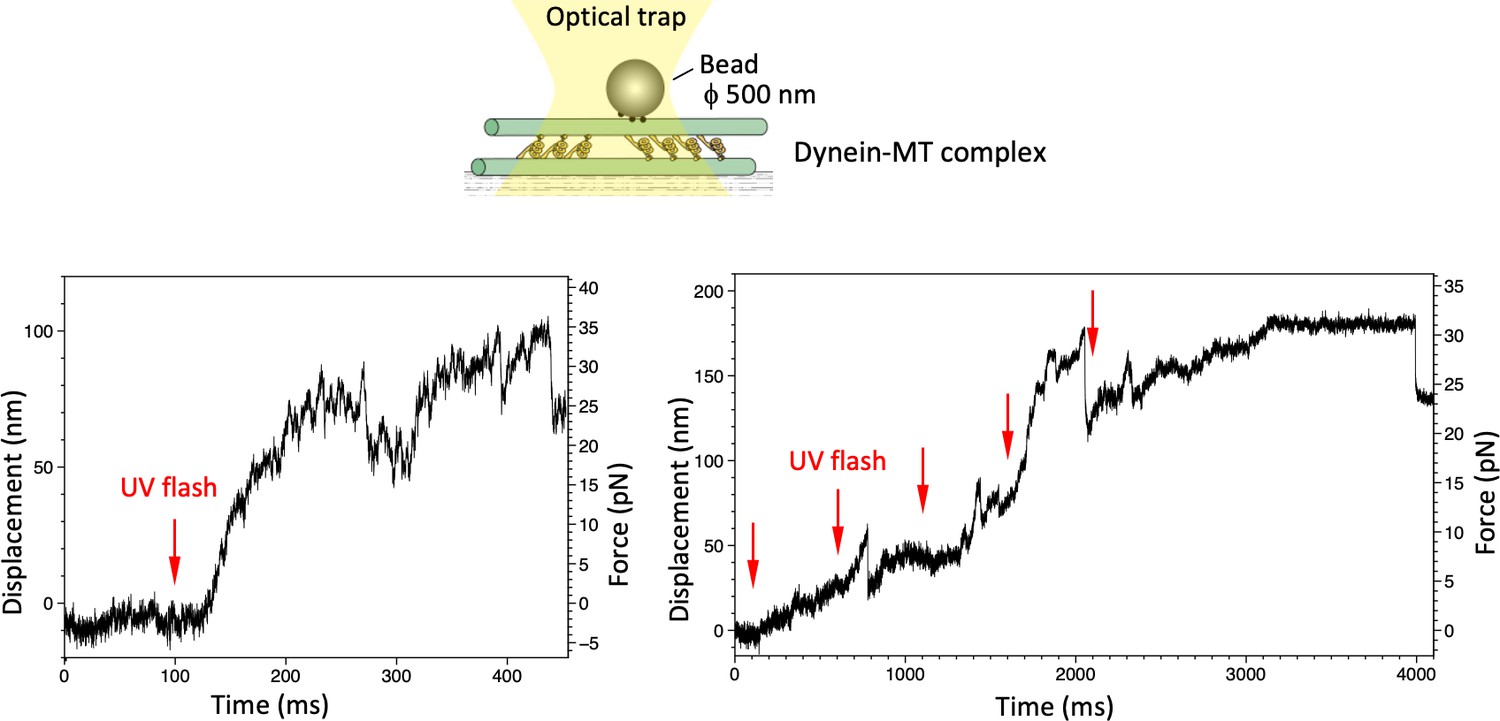
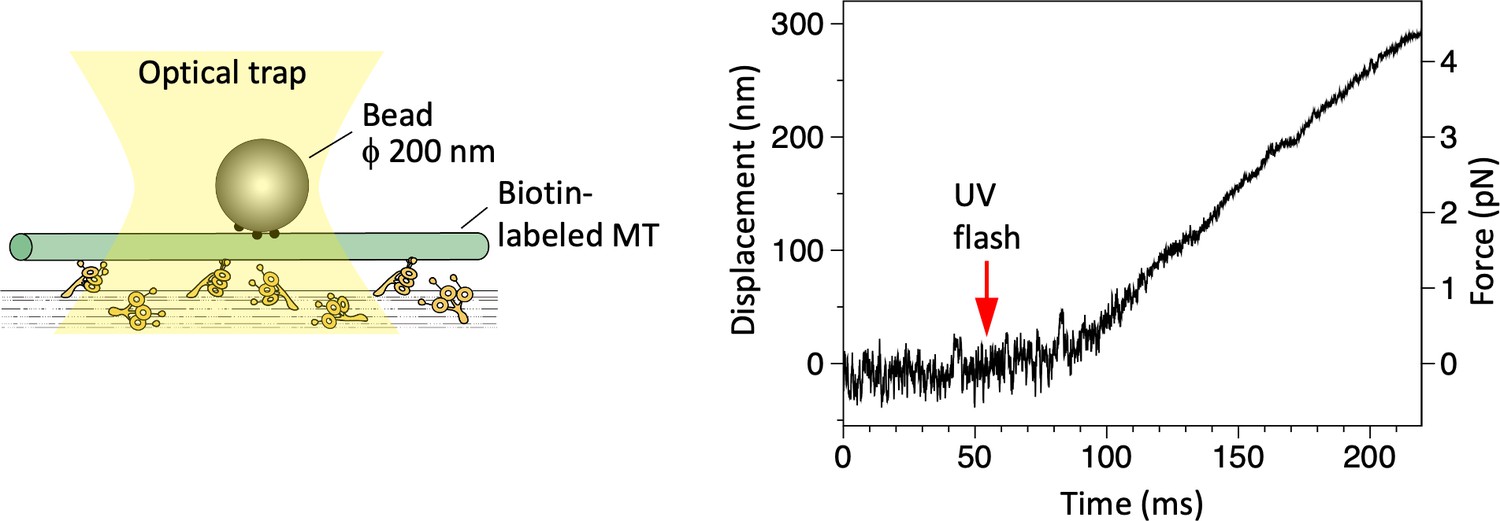
Maximum force produced by the dynein-microtubule (dynein-MT) complex without DNA origami rods.
Schematic representation of the experiment (not to scale) and two examples of the traces are shown. Larger beads (500 nm in diameter) were used to measure the maximum force. Red arrows indicate the timing of UV photolysis of caged ATP. In both cases, the maximum force was 30–35 pN.
Figure 4 with 3 supplements
A model showing oscillatory movement of a dynein-microtubule-DNA-origami (dynein-MT-DNA-origami) complex.
The two groups of dyneins produce opposing forces. DNA rods are expected to crosslink the two MTs of the complex and restrict their relative movement. When the total force produced by one of the groups is stronger, the upper MT moves in one direction and the DNA rods tilt. Movement of the MT would stop when the linkers between the MTs and DNA rods are fully extended. The MT would then move in the opposite direction until the movement is again stopped by the DNA rods.
-
Figure 4—source data 1
Numerical data for Figure 4—figure supplement 2 (tilt angles of DNA origami rods).
- https://cdn.elifesciences.org/articles/76357/elife-76357-fig4-data1-v1.xlsx
-
Figure 4—source data 2
Numerical data for Figure 4—figure supplement 2 (Mann-Whitney U-test).
- https://cdn.elifesciences.org/articles/76357/elife-76357-fig4-data2-v1.xlsx
Figure 4—figure supplement 1
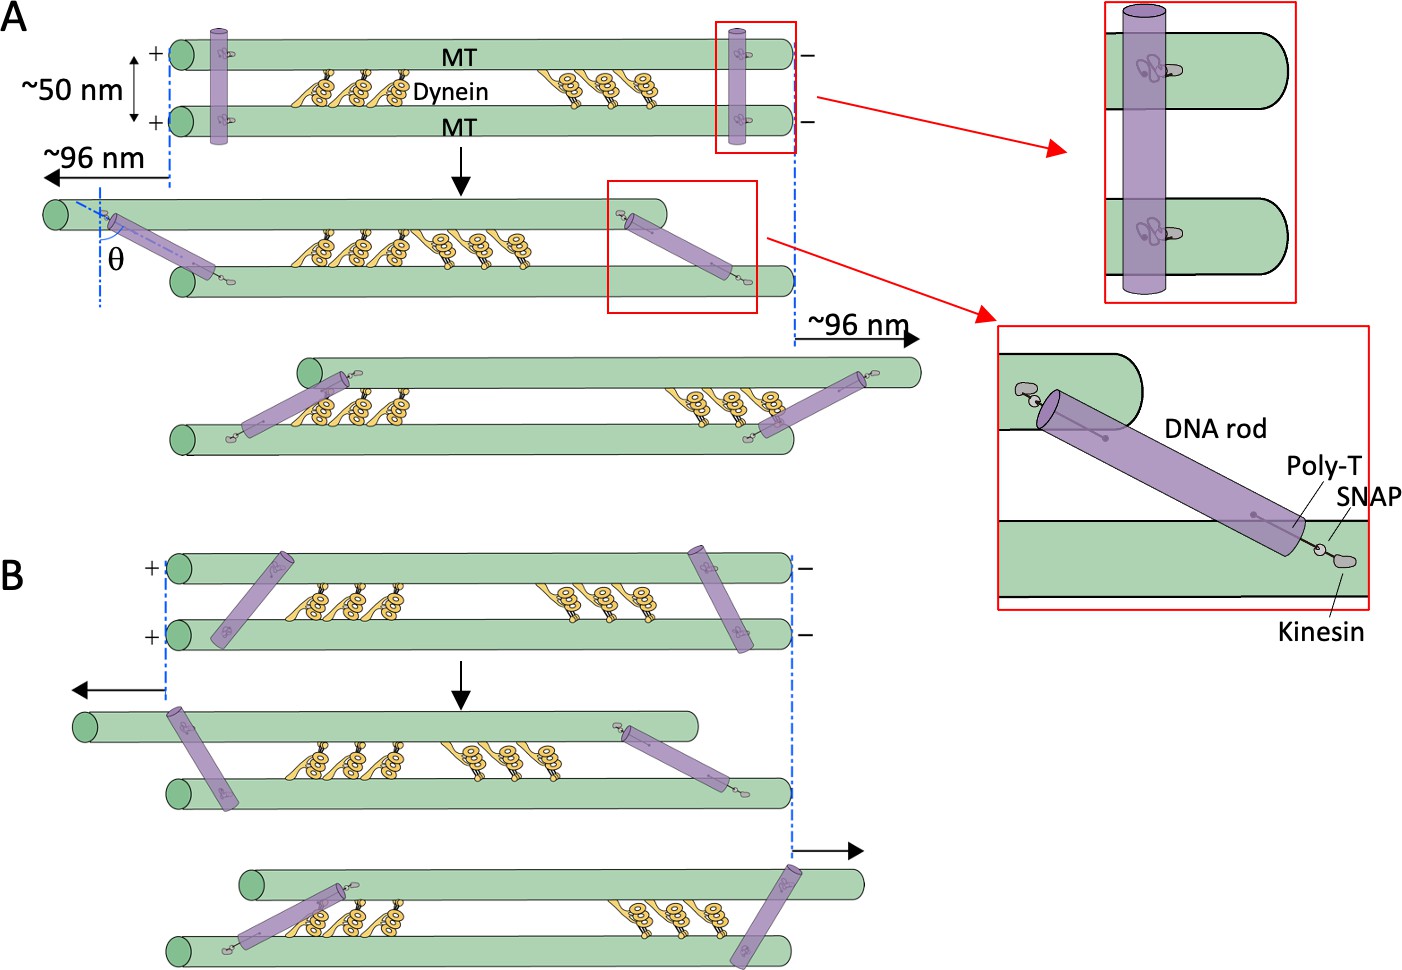
Estimation of tilt angles of DNA origami rods.
(A) The ideal situation in which the initial binding angles of all the DNA rods are perpendicular to the microtubules (MTs). Upon addition of ATP, the MTs slide relative to each other, the linkers become stretched (illustrated in red boxes), and the DNA rods would tilt. Assuming the center-to-center distance between the MTs to be 50 nm, and the length of the linker between DNA rods and the MT-binding site 29 nm (see Materials and methods), the maximum sliding distance and tilt angle (θ) are calculated to be ~96 nm and ~62° in both directions. (B) In cases where the initial binding angles are variable, the maximum sliding distance and tilt angle are expected to be smaller than the maximum values.
Figure 4—figure supplement 2
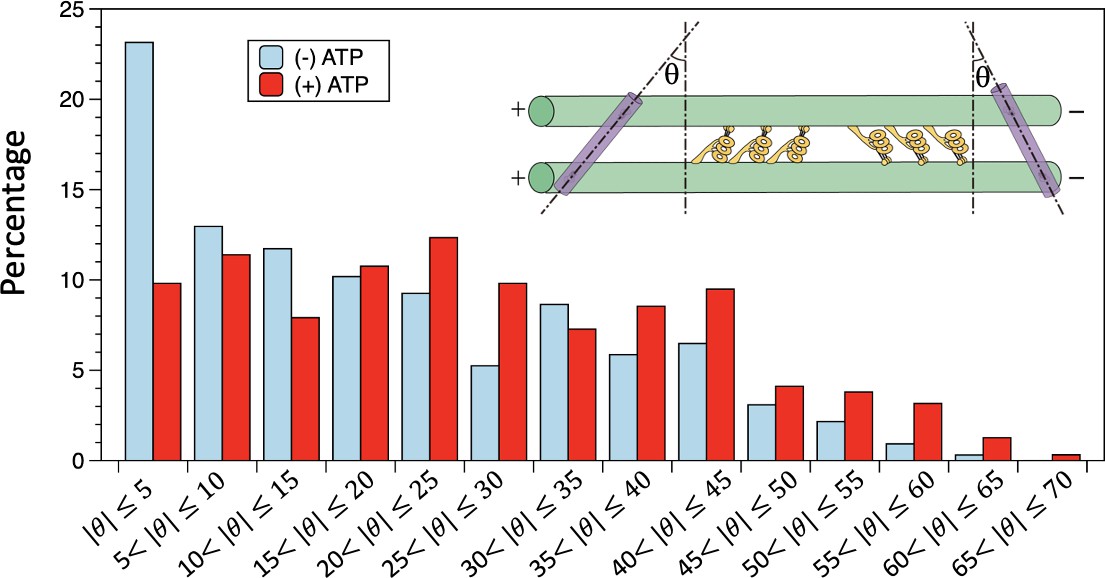
Distributions of the tilt angles measured in the negative stain electron microscopy (EM) images.
In the absence of ATP, the bin with tilt angle less than 5° has the highest population. In the presence of ATP, the tilt angles have a wider distribution, with no apparent preference for smaller angles. The n=324 and 316 for in the absence and presence of ATP, respectively. Also see Figure 4—source data 1 and Figure 4—source data 2.
Figure 4—video 1
Effect of DNA-origami rods on the movement of dynein-microtubule (dynein-MT) complexes.
The dynein-MT-DNA-origami complex was adsorbed to the glass surface. The complex showed little movement after photolysis of caged ATP, indicating that relative sliding of MTs is restricted by cross-linking with DNA origami. Recorded at 400 ms/frame.
Figure 5 with 1 supplement
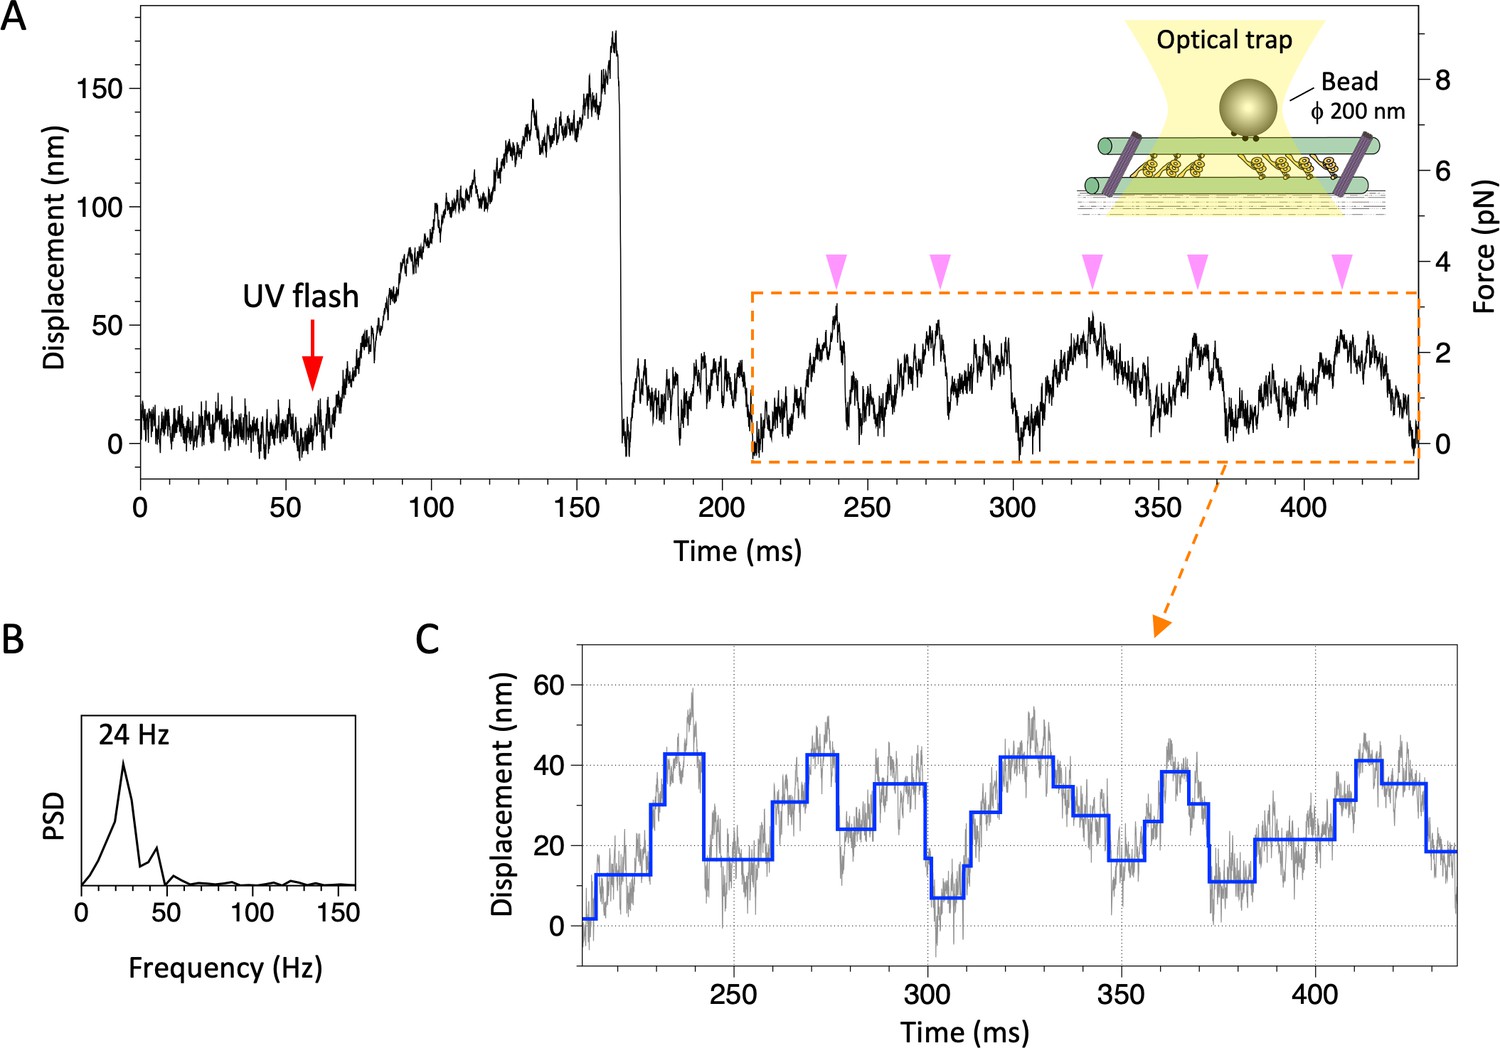
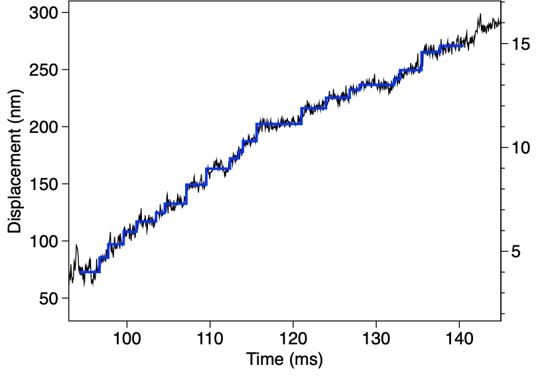
Movement of the dynein-microtubule-DNA-origami (dynein-MT-DNA-origami) complex measured in optical trapping assays.
(A) Trace showing displacement of a bead attached to the dynein-MT-DNA-origami complex after UV photolysis of caged ATP (red arrow). Schematic of the experimental set-up is shown in inset (not to scale). A streptavidin-coated bead was captured by the optical trap (trap stiffness 0.052 pN/nm) and attached to a dynein-MT-DNA-origami complex adsorbed to a glass surface. A part of the trace shows oscillatory movement (pink arrowheads). (B) The frequency of the oscillatory movement was measured by the power spectral density (PSD). (C) Steps (blue) detected for the same region by the step-finding algorithm (Kerssemakers et al., 2006). Steps are found in both forward (away from the trap center) and backward (toward the trap center) movements.
Figure 5—figure supplement 1
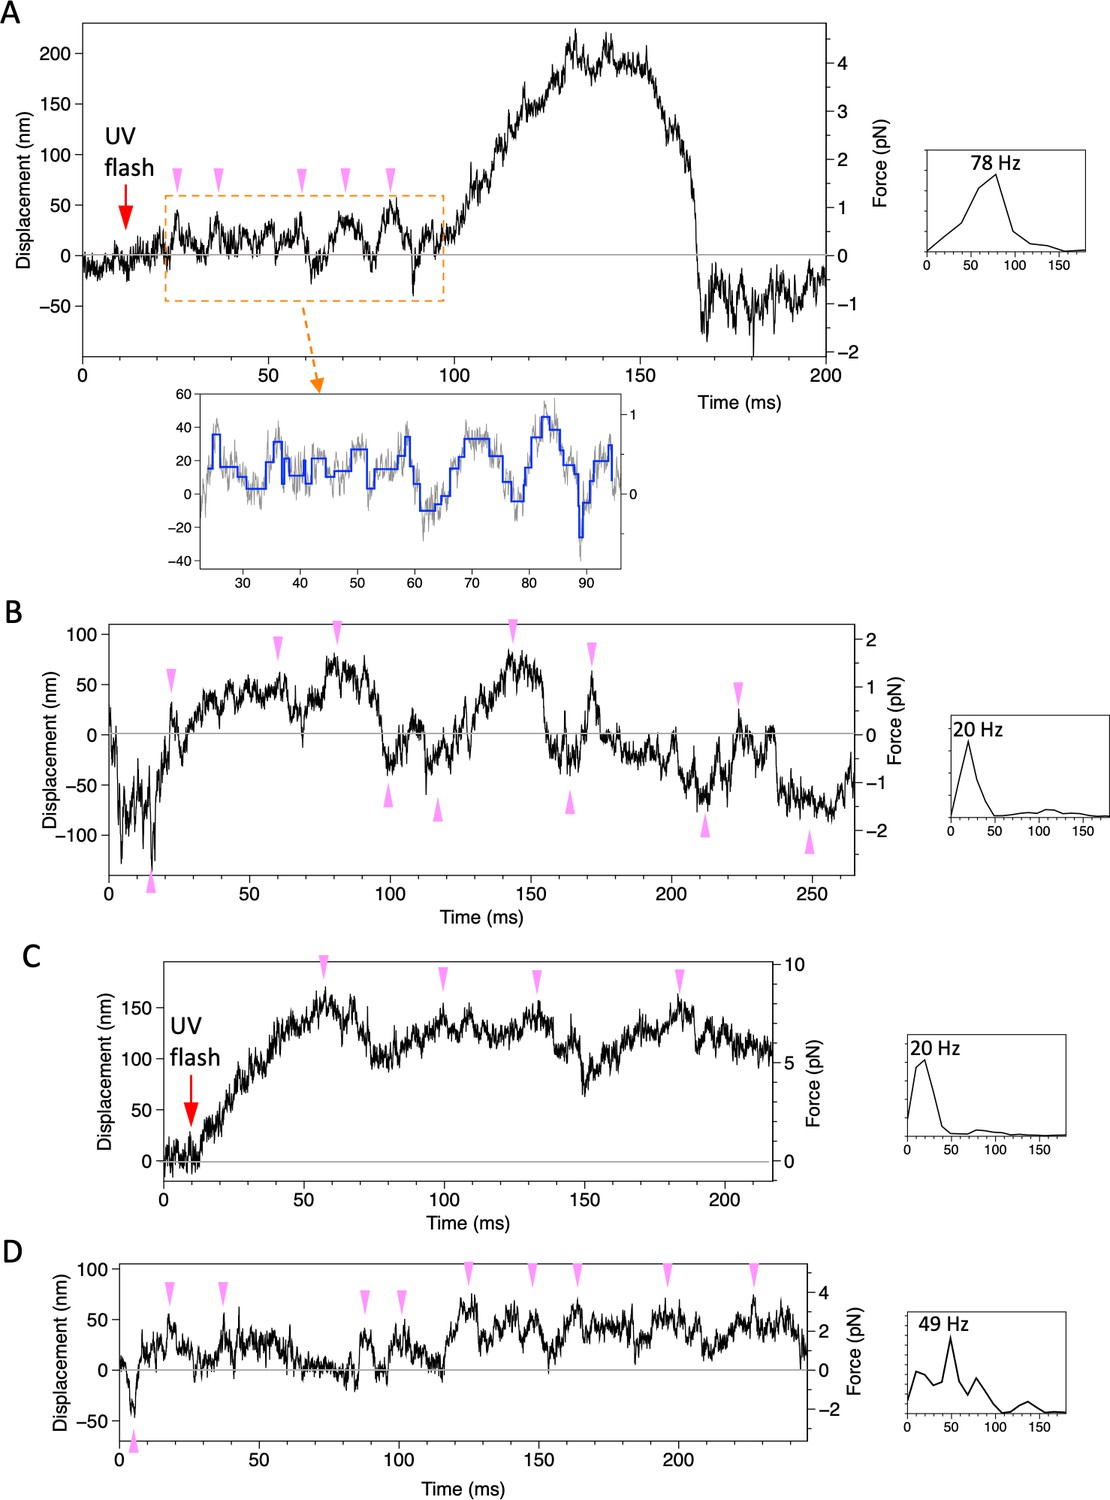
Displacement of beads attached to the dynein-microtubule-DNA-origami (dynein-MT-DNA-origami) complex.
Four examples of traces, recorded under the similar conditions as in Figure 5 (trap stiffness 0.021 pN/nm for A and B, 0.052 pN/nm for C and D) are shown. The power spectral density of a part of the trace is shown to the right of each trace, with the peak value indicated. In the trace in (A), the bead showed oscillatory movement (pink arrowheads) after photolysis of caged ATP and then moved for ~200 nm unidirectionally. Steps detected for the boxed region is shown in blue. The trace in (B) was recorded ~100 ms after the UV flash. The bead moved in both directions from the trap center (0 nm of the vertical axis).
Figure 6
Analysis of movement of the dynein-microtubule-DNA-origami (dynein-MT-DNA-origami) complex measured in optical trapping assays.
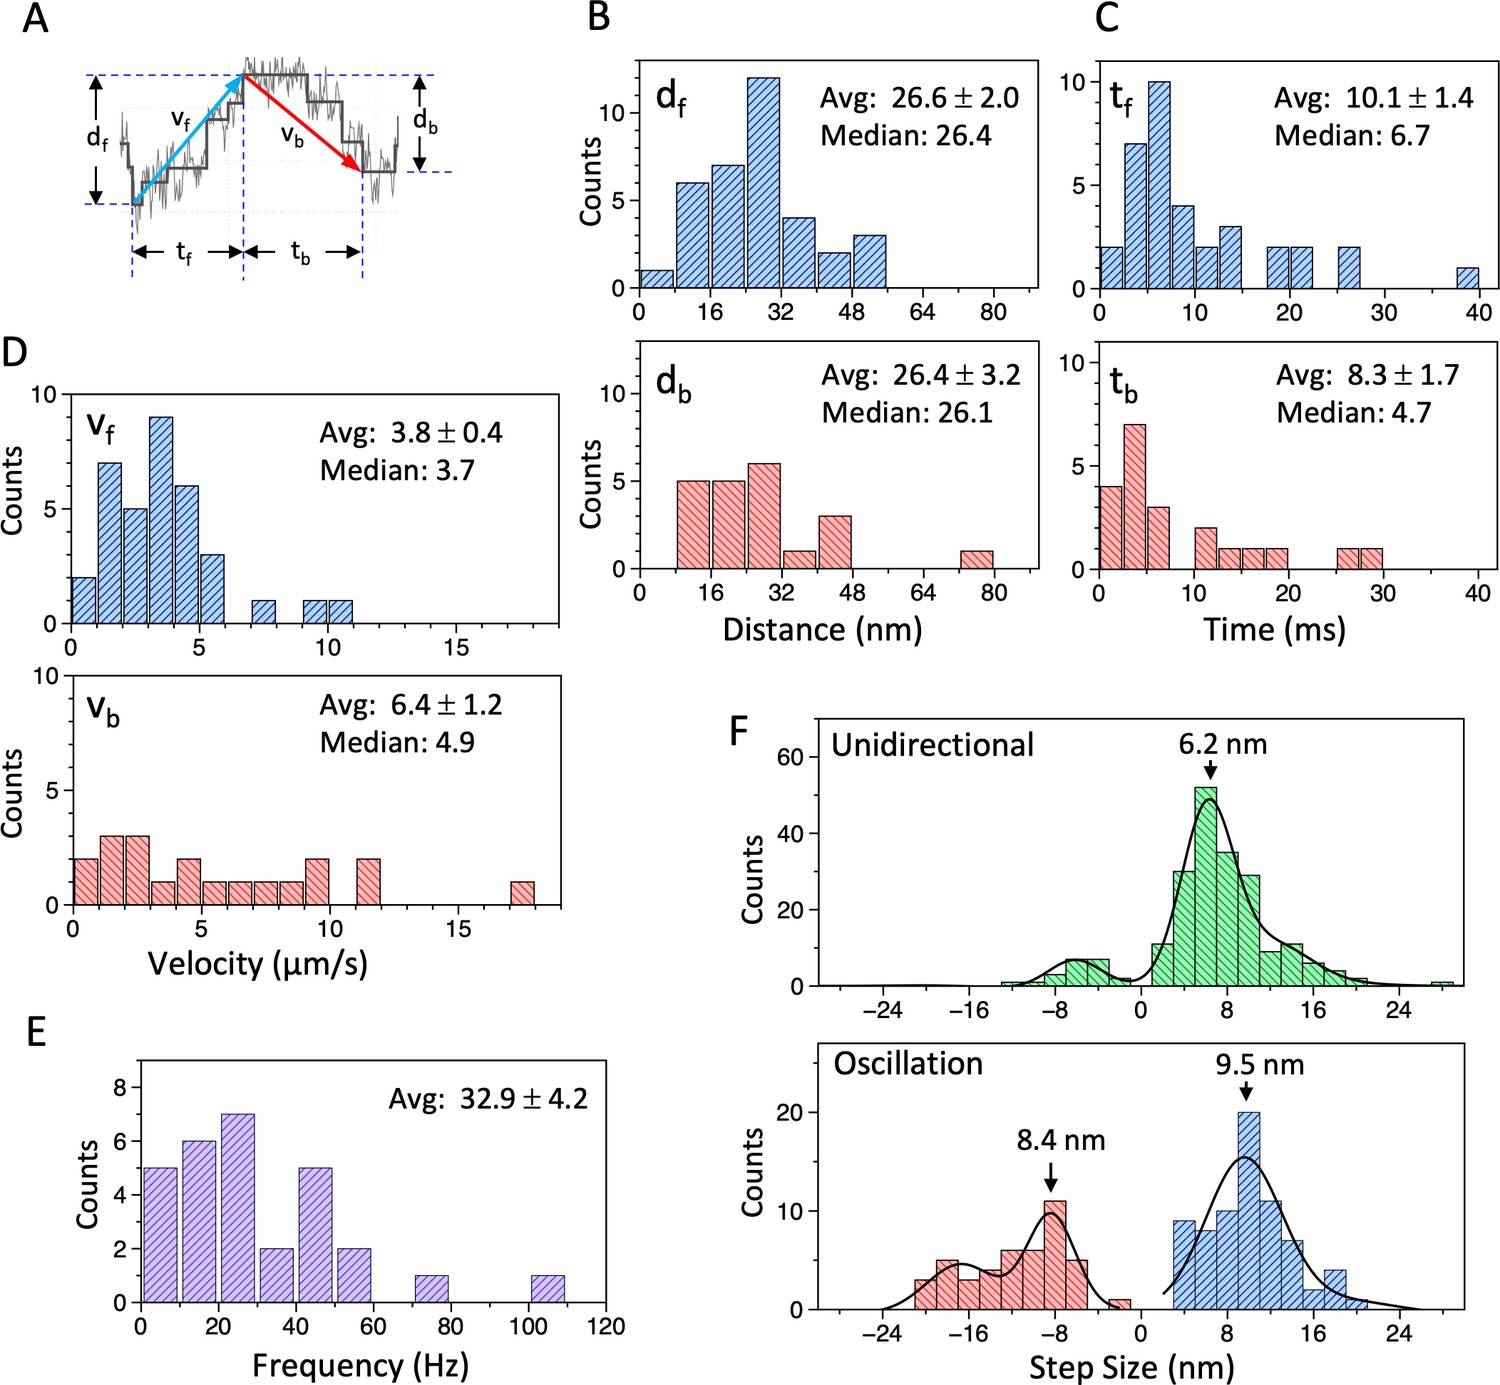
(A) Definition of the distance (df, db), time (tf, tb), and velocity (vf, vb) used for the histograms in (B – D). (B – D) Histograms of the distance (B), time (C), and velocity (D) during the forward (df, tf, vf) and backward (db, tb, vb) movements of the bead attached to the dynein-MT-DNA-origami complex. Average (mean ± SEM) and median values are indicated in each histogram (n=35 for df, tf, vf, and 21 for db, tb, db). (E) A histogram of the frequency of the oscillatory movements (n=29). (F) Histograms of the step size during unidirectional movement (top; n=211) and oscillatory movement (bottom; n=72 for forward and n=44 for backward), fit with multiple Gaussian curves. Main peak positions of the Gaussian functions are indicated. Also see Figure 6—source data 1.
-
Figure 6—source data 1
Numerical data for Figure 6.
- https://cdn.elifesciences.org/articles/76357/elife-76357-fig6-data1-v1.xlsx
Figure 7 with 2 supplements
Motility of a dynein-microtubule (dynein-MT) complex in which dyneins are arranged unidirectionally.
(A) Relative sliding of the MTs observed by fluorescence microscopy. As illustrated in the diagram, dynein-MT complexes that contain dyneins in two opposite orientations were prepared using less brightly fluorescent MTs and adsorbed to the glass. Addition of ATP disassembles the complex, leaving MTs with dyneins oriented in the same way. New MTs (more brightly fluorescent) were added in the absence of ATP to make the complexes. Average (mean ± SEM) and median values of the velocities are indicated (n=65). (B) Relative sliding of the MTs measured in optical trapping assays. Trap stiffness: 0.055 pN/nm. Also see Figure 7—source data 1.
-
Figure 7—source data 1
Numerical data for Figure 7A.
- https://cdn.elifesciences.org/articles/76357/elife-76357-fig7-data1-v1.xlsx
Figure 7—figure supplement 1
Displacement of a microtubule (MT) over dynein-coated glass surfaces measured in optical trapping assays.
Trap stiffness: 0.015 pN/nm.
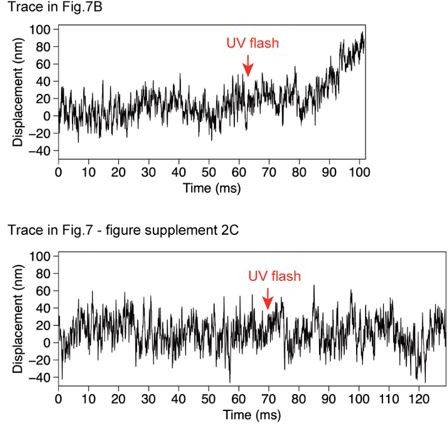
Figure 7—figure supplement 2
Displacement of a bead attached to the dynein-microtubule (dynein-MT) complex in which dyneins are arranged unidirectionally.
Four examples recorded under the same condition as in Figure 7B.
Figure 8 with 1 supplement
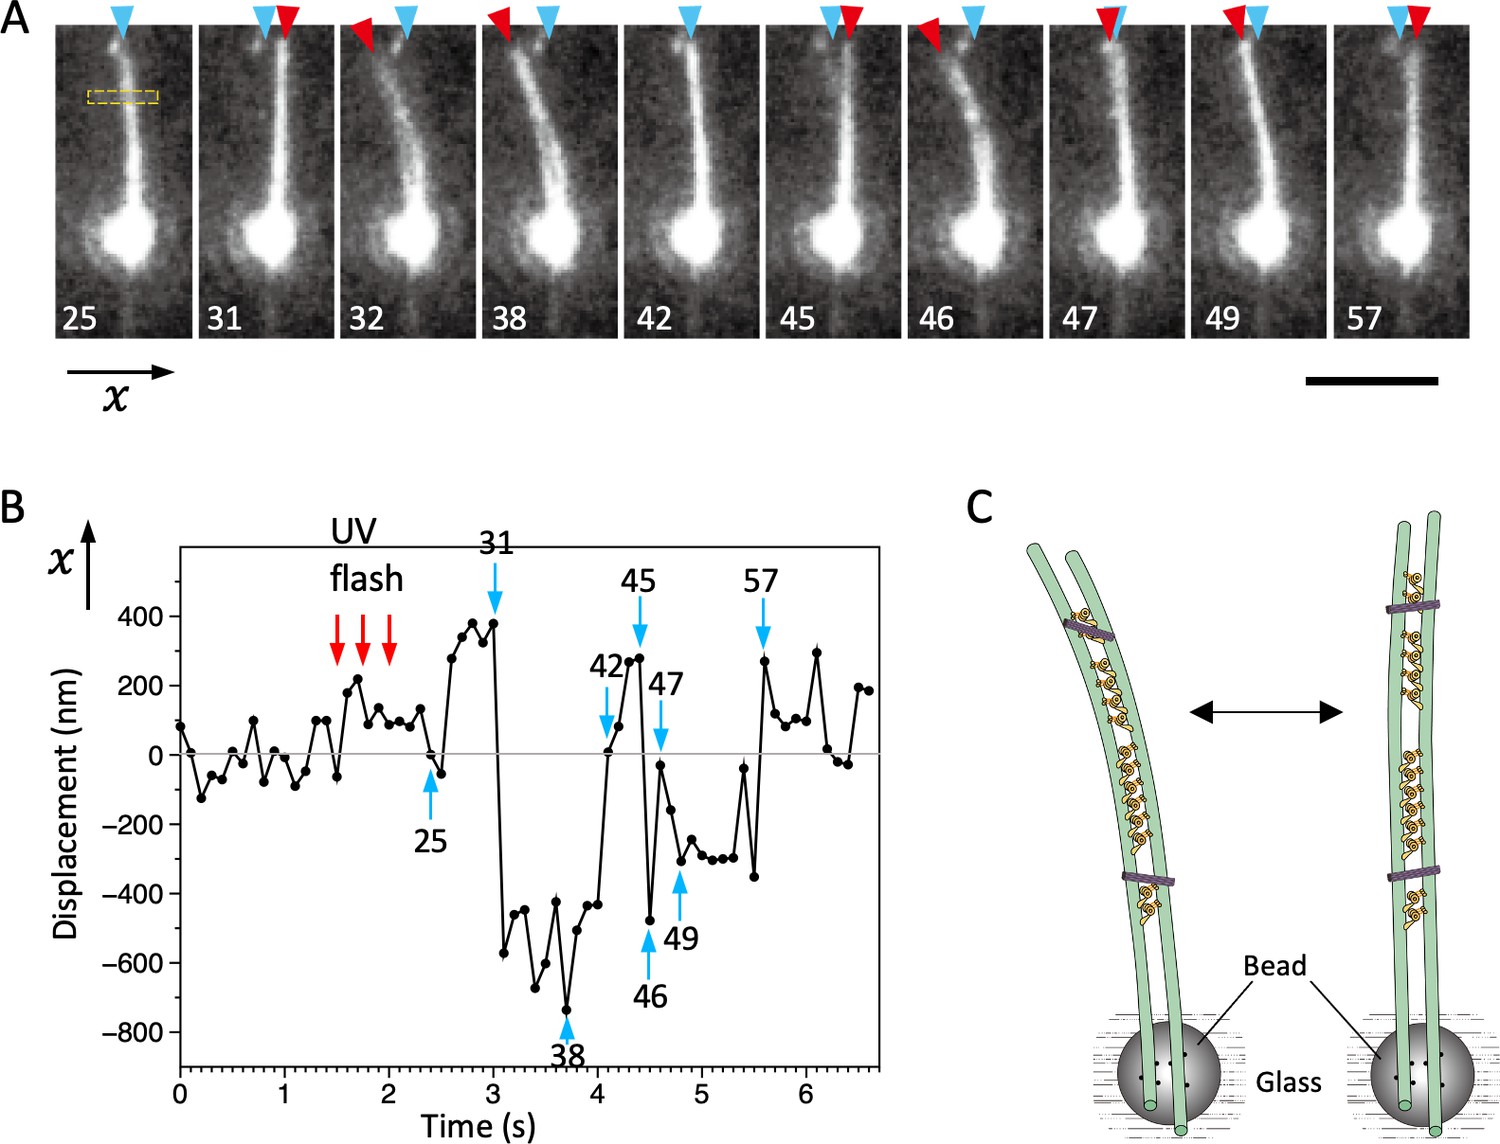
Bending motions of the dynein-microtubule-DNA-origami (dynein-MT-DNA-origami) complex.
(A) Snapshots during movement of the dynein-MT-DNA-origami complex shown in Video 2. The number indicated in each frame corresponds to the frame number in the movie (recorded at 10 frames/s). The UV was flashed at frames #16, 18, and 21, each for 50 ms. The complex is attached to a bead while one end (red arrowheads) is free, which moves with respect to the position before the UV flash (cyan arrowhead) as the complex bends repeatedly. Bar: 5 µm. (B) Displacement of the complex during bending motion. The plot shows the lateral (x) positions of the complex observed in the boxed region in A. The average position before the UV flash (frames #5–15) was taken as 0 on the vertical axis. Note that the displacement is to both the plus and minus directions. (C) Diagram illustrating a model explaining the movement.
Figure 8—figure supplement 1
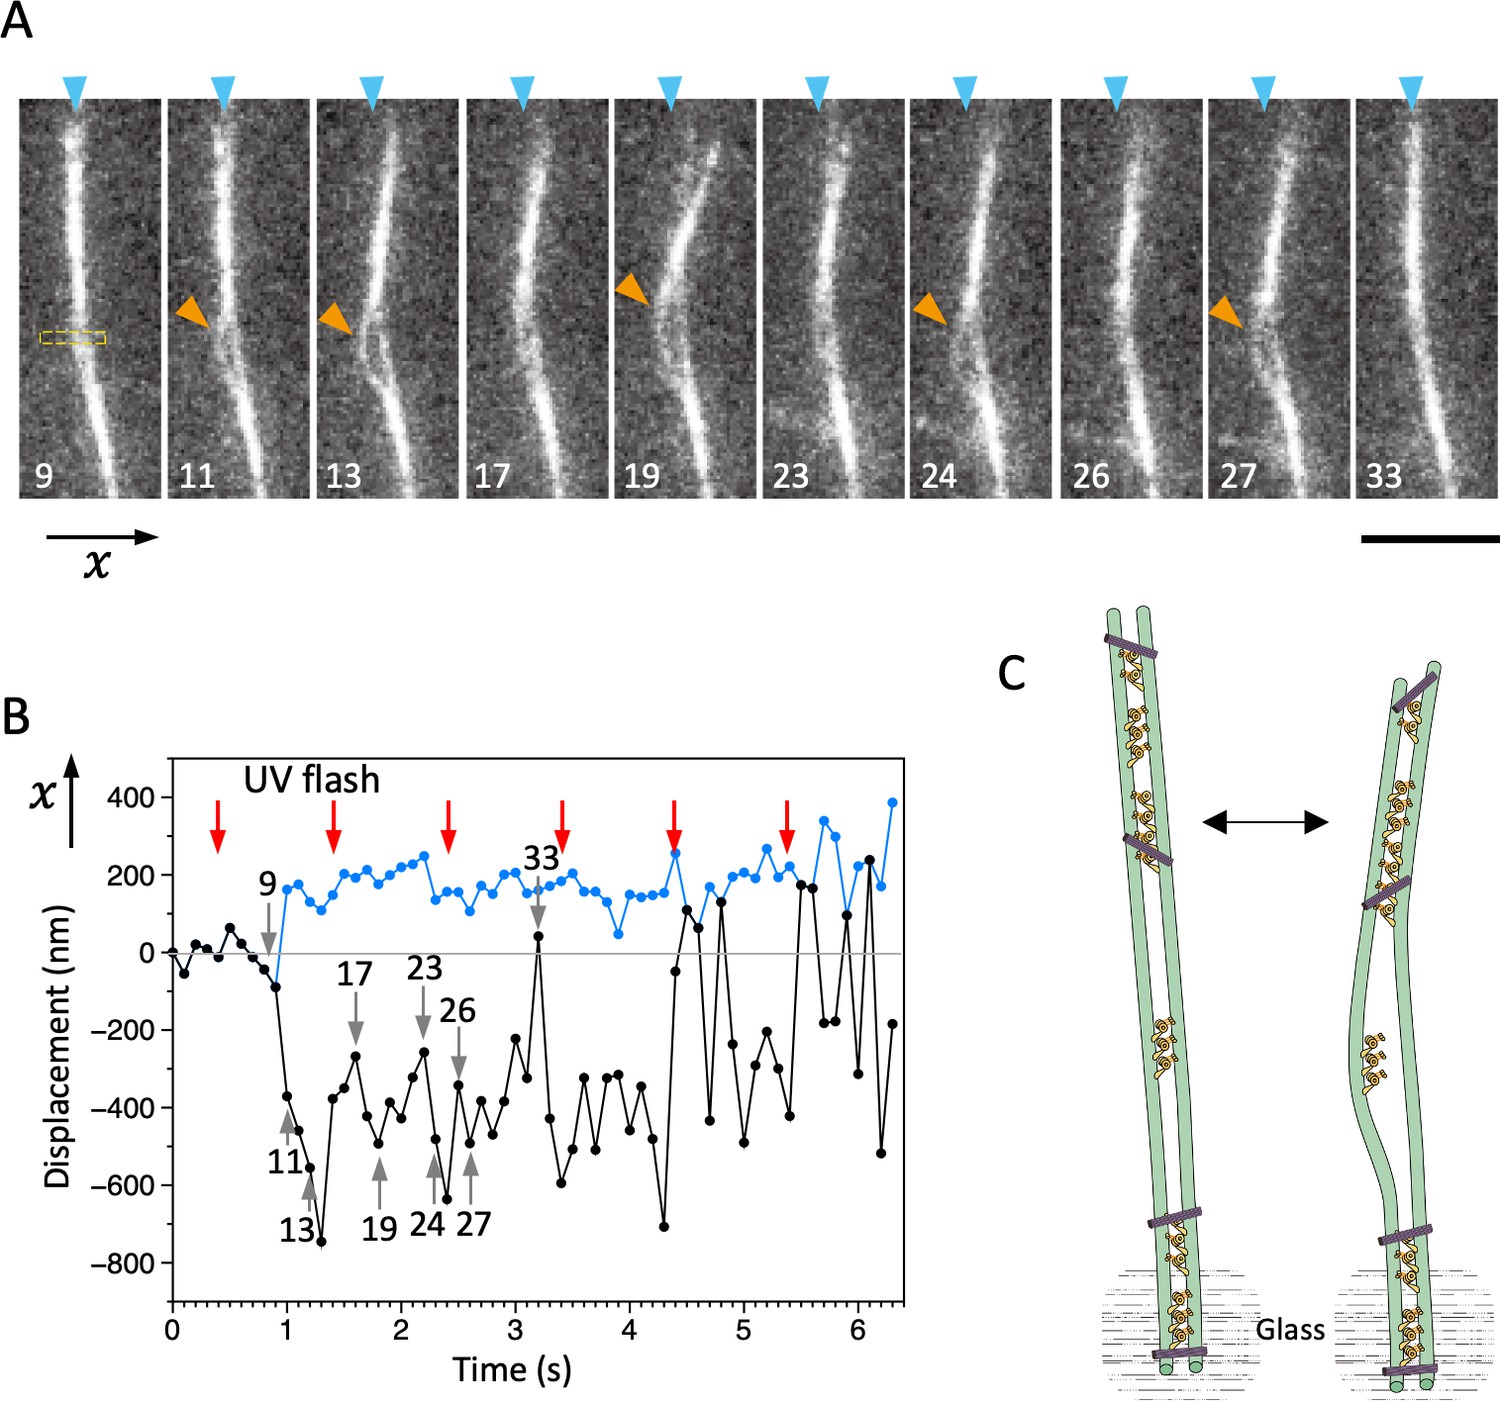
An example of bending motions of the dynein-microtubule-DNA-origami (dynein-MT-DNA-origami) complex.
Movement of the complex was observed under the same experimental conditions as in Figure 8, but in this example, one end of the complex (bottom of the images) seemed to be attached to the glass. The movie of this complex is shown in Video 3. The numbers indicated in A and B correspond to the frame numbers in Video 3 (recorded at 10 frames/s). (A) Snapshots during movement. UV was flashed at frames #5, 15, 25, 35, 45, and 55, each for 50 ms. After the UV flash, the middle part of the complex repetitively bows outward and becomes separated (orange arrowheads), presumably because there are not enough DNA origami and dynein molecules to hold the two MTs together when they are bent. Bar: 5 µm. (B) Displacement of the complex during bending motion. The plot shows the lateral (x) positions of the two MTs (or MT bundles) observed in the boxed region in A, where the complex separated and one of the MTs bowed outward repeatedly. The average position before UV flash was taken as 0 on the vertical axis. (C) Diagram illustrating a model explaining the movement.
Author response image 1
Comparison of the noise before and after UV flash.
Author response image 2
Steps detected for the trace in Figure 7 —figure supplement 2C.
Videos
Video 1
Unidirectional movement of microtubules (MTs) from the dynein-MT complex.
Dynein-MT complexes were adsorbed to the glass surface. Upon photolysis of caged ATP, some MTs (indicated by arrowheads) moved unidirectionally and slid out of the bundles. Recorded at 400 ms/frame.
Video 2
Bending motions of the dynein-microtubule-DNA-origami (dynein-MT-DNA-origami) complex.
Movie of the dynein-MT-DNA-origami shown in Figure 8. The complex is fixed to beads while one of the ends is free in solution. After UV photolysis of caged ATP (frames #16, 19, 21), the complex bends repeatedly. Recorded at 100 ms/frame.
Video 3
Bending motions of the dynein-microtubule-DNA-origami (dynein-MT-DNA-origami) complex.
Movie of the dynein-MT-DNA-origami shown in Figure 8—figure supplement 1. Movement of the dynein-MT-DNA-origami complex was recorded under the same conditions as in Video 2 but without beads. One end of the complex is attached to the glass surface, while the MTs in the upper part of the image slide relative to each other, which causes bending and separation of the MTs in the middle part. UV flash at frames #5, 15, and 25. Recorded at 100 ms/frame.
Additional files
-
Supplementary file 1
DNA oligonucleotide sequences for the DNA origami rod.
The asterisk indicates the C6dT modified oligonucleotide. Small letter "tttt" indicates the four thymine (4T) linker added to prevent the aggregation of DNA rods.
- https://cdn.elifesciences.org/articles/76357/elife-76357-supp1-v1.docx
-
Transparent reporting form
- https://cdn.elifesciences.org/articles/76357/elife-76357-transrepform1-v1.docx
Download links
A two-part list of links to download the article, or parts of the article, in various formats.
Downloads (link to download the article as PDF)
Open citations (links to open the citations from this article in various online reference manager services)
Cite this article (links to download the citations from this article in formats compatible with various reference manager tools)
Oscillatory movement of a dynein-microtubule complex crosslinked with DNA origami
eLife 11:e76357.
https://doi.org/10.7554/eLife.76357


