De novo apical domain formation inside the Drosophila adult midgut epithelium
- The Gurdon Institute, University of Cambridge, United Kingdom
Figures
Figure 1 with 1 supplement
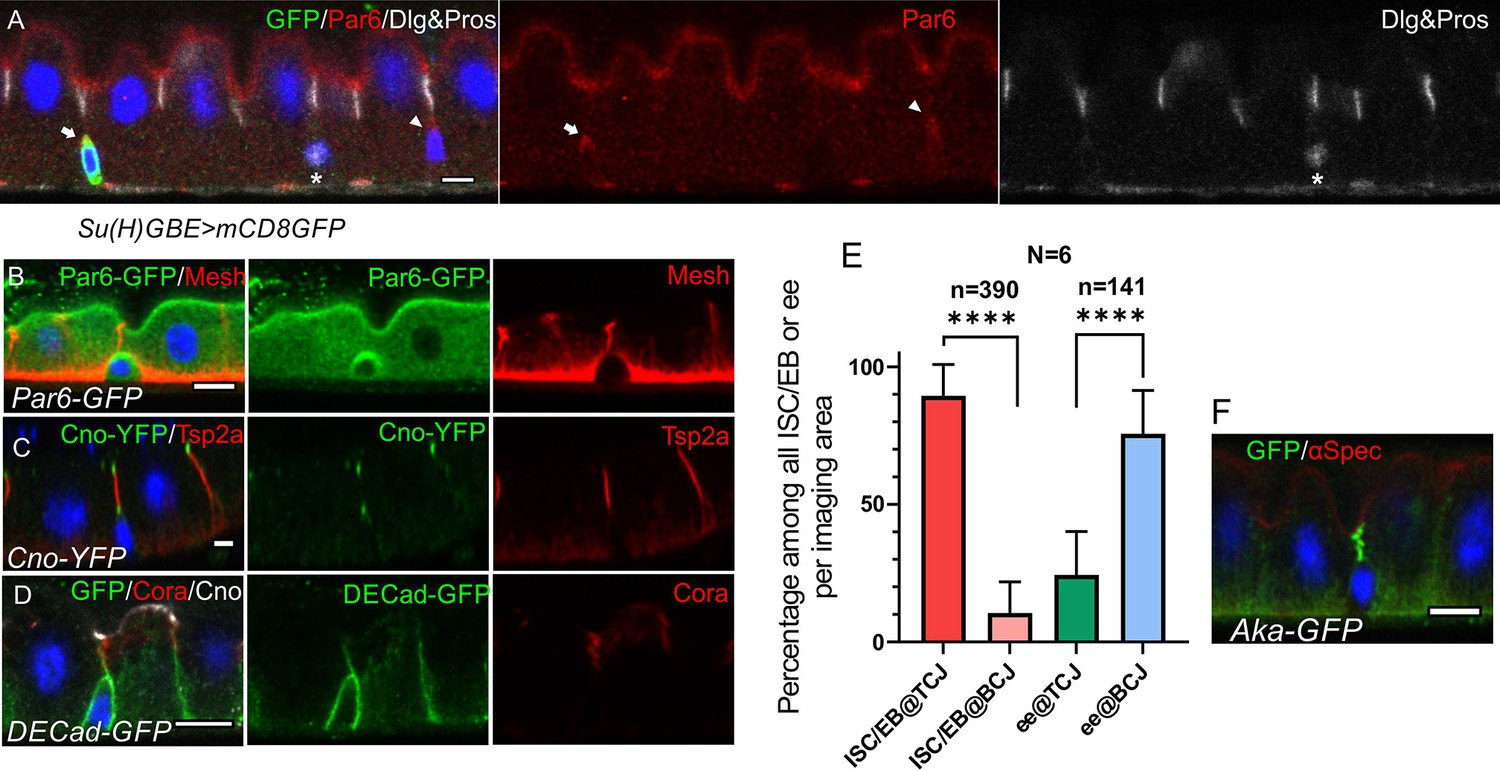
ISCs/early enteroblasts are polarised and reside underneath tri-cellular junctions.
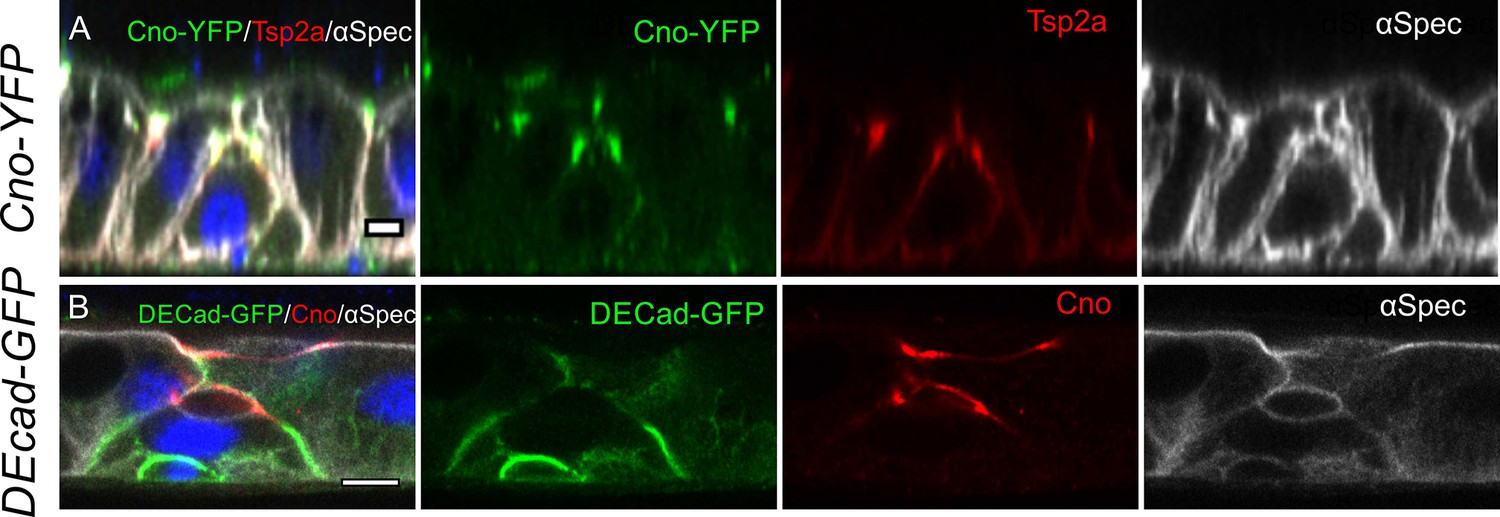
(A) Par-6 localises apically in ISCs and early enteroblasts. Su(H)GBE >mCD8 GFP expression (arrow) marks an early enteroblast, while the GFP-negative cell (arrowhead) is an ISC. Nuclear Prospero staining (white) marks an entero-endocrine cell (*) and cytoplasmic Dlg (greyscale) labels the septate junctions. (B) An ISC/early enteroblast expressing Par-6-GFP (green), which localises apically. Mesh (red) marks the septate junctions and basal labyrinth. (C) Canoe-YFP (green) localises to the marginal zone above the septate junctions (Tsp2a; red) in mature enterocytes. Although ISC/early enteroblasts do not form septate junctions, Canoe-YFP localises apically. (D) Adherens junctions (DE-cadherin-GFP; green) form throughout the cell-cell contacts between ISC/early enteroblasts and enterocytes. Coracle (red) marks the septate junctions; Canoe; white. (E) A graph showing the proportion of ISCs/early enteroblasts (ISC/EB) or entero-endocrine cells (ee) that localise beneath tri-cellular junctions (@TCJ) and bicellular junctions (@BCJ). Most ISCs/EBs localise beneath tricellular junctions where three enterocytes meet, whereas entero-endocrine cells mainly lie beneath bicellular junctions. DE-Cad-GFP expressing midguts were stained for GFP to mark cell contacts and Prospero to mark the ees. Cells with a low DNA content (~2 n) were counted by imaging from the basal side. 390 ISC/early enteroblasts and 141 ee were scored in 6 guts. (F) An example of an ISC/EB beneath a tricellular junction marked by Anakonda-GFP (Aka-GFP; green). Scale bars = 5 µm.
-
Figure 1—source data 1
Source data for the graph as Figure 1E.
- https://cdn.elifesciences.org/articles/76366/elife-76366-fig1-data1-v2.xlsx
Figure 1—figure supplement 1
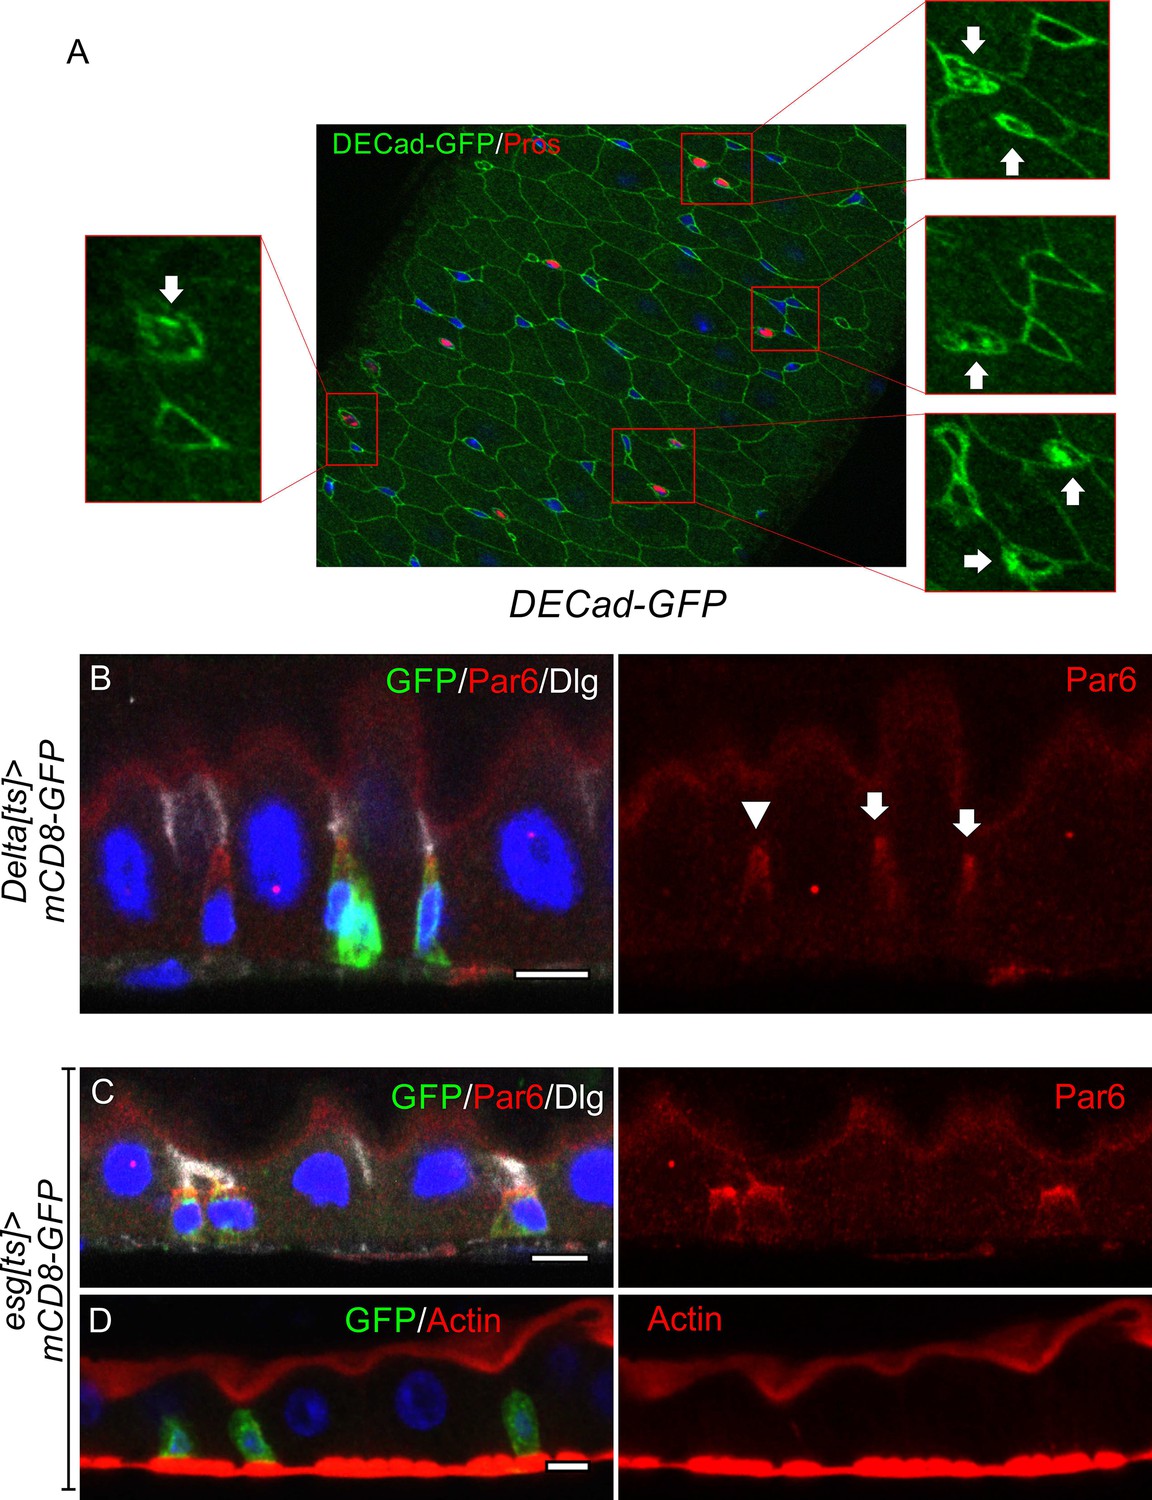
Most ISCs and enteroblasts lie beneath tricellular junctions.
(A) Related to Figure 1C. A DECad-GFP expressing midgut at homeostasis stained for GFP (green) and Prospero (red). The arrows indicate the Prospero+ entero-endocrine cells in the magnified images on each side. (B) Par-6 (red) is localised apically in ISCs (Deltats >GFP positive cells; arrow) and early enteroblasts (Deltats >GFP negative cell; arrowhead). (C–D) Par-6 (red; C) localises apically in esgts >GFP positive ISC/early enteroblasts, whereas F-actin (red; D) is not apically-enriched. Dlg (greyscale; C) marks the septate junctions. Scale bars = 5 µm.
Figure 2 with 3 supplements

Integrating enteroblasts form an apical domain before reaching the gut lumen.
(A) A transverse section of a Su(H)GBE >mCD8 GFP midgut imaged 1 day after heat shock. Large spherical lumens surrounded by plasma membranes (α-spectrin; greyscale) have formed between the integrating enteroblasts and the overlying enterocytes. One enteroblast is still GFP-positive, indicating that it has recently been activated, whereas the other has lost Su(H)GBE >mCD8 GFP (green) expression. Canoe (red) labels the apical corners of the enteroblasts. (B) The lumen-facing side of the enteroblast is marked by MyoIA-YFP (green) and Myo7a (red), which are markers for the enterocyte brush border and apical cortex respectively. (C) A GFP protein trap line in the transmembrane transporter Picot (green) labels the apical brush border in enterocytes and the lumen-facing membrane in an integrating enteroblast. Note that multiple lumens have formed between the enteroblast and the enterocytes above. Plasma membranes are labelled with α-spectrin (red). (D) Fimbrin-GFP (Fim-GFP; green) marks the apical cortex of an integrating enteroblast and the enterocyte brush border. Note that the enteroblast to the right has not yet formed a lumen but has Fimbrin, Canoe (red) and Coracle (greyscale) localised to its apical surface. (E) The actin binding domain of Utrophin (Sqh::UtrABD-GFP; green) marks the enterocyte brush border and the apical side of an integrating enteroblast. The apical recycling endosome marker, Rab11 (red) also labels the apical region of the enteroblast. (F) A transmission electron micrograph showing that the lumen above an integrating enteroblast is surrounded by brush border microvilli. Scale bar, 2 µm. (G) An integrating enteroblast with a closed pre-apical compartment (PAC) and lumen that lie below the septate junction between the overlying enterocytes. The cells express the actin marker, Sqh::UtrABD-GFP (green), and are stained for Coracle (red) and Canoe (greyscale). (H) An integrating enteroblast stained as in (H) with an open lumen that is continuous with the gut lumen. (I) A model for enteroblast integration in which a ‘closed’ lumen above the PAC precedes an ‘open’ lumen. The ‘closed’ lumen stage represents the pre-EC with a PAC forming underneath the septate junction between the neighbouring enterocytes (purple), creating an isolated, closed lumen inside the epithelial layer. The cap over the ‘closed’ lumen comes from the neighbouring enterocytes. Adherens junctions form between pre-EC (light blue) and neighbouring enterocytes. New septate junctions also form between the pre-EC and the adjacent enterocytes (purple). The ‘open’ lumen represents a fully-developed enterocyte after the lumen has fused with the gut lumen, turning the PAC into the apical domain. To simplify the cartoons in the following figures, we combine the membranes between pre-EC and neighbouring ECs into one line. Scale bars in A-E, G and H, 5 µm.
Figure 2—figure supplement 1
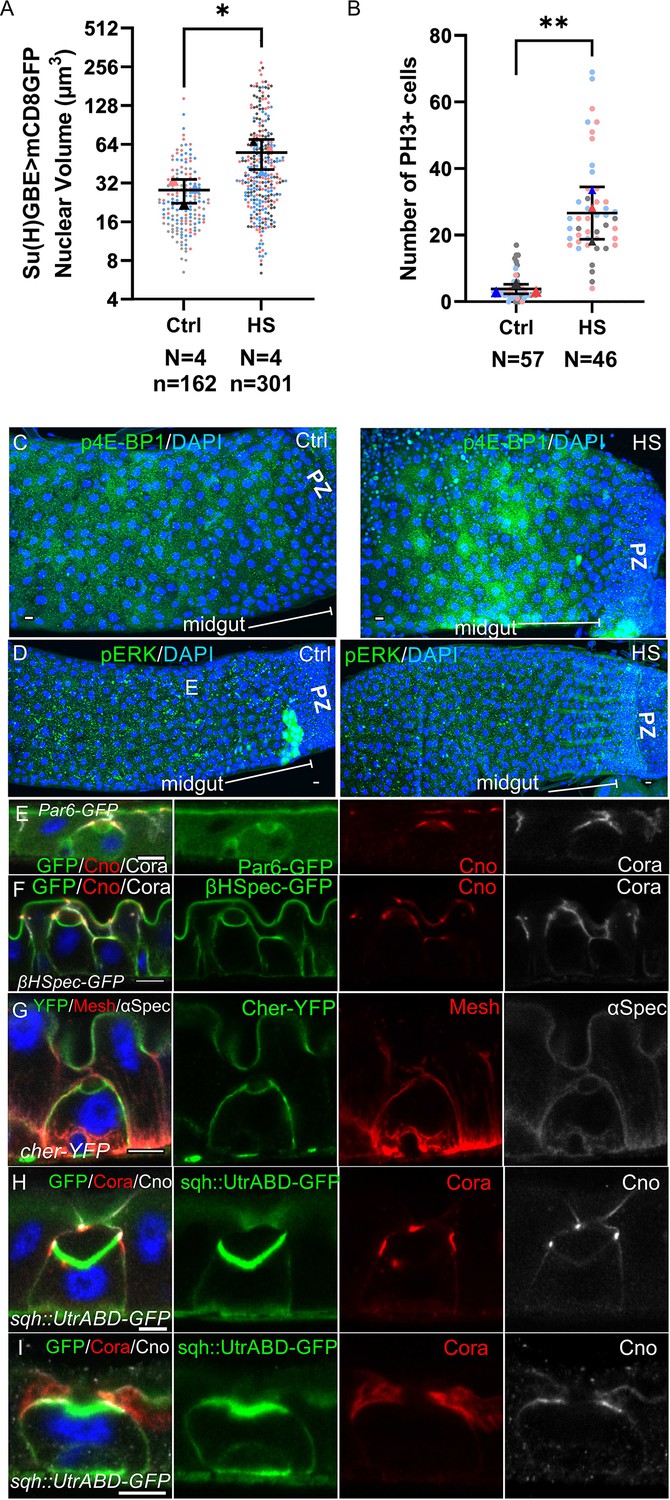
Heatshock increases the number of integrating enteroblasts without inducing a regeneration response.
(A) Graph showing the distribution of enteroblast nuclear volumes in control guts and in guts imaged one day after a 2 hour heat shock. The horizontal lines indicate the median values, which are significantly different by a two-tailed t test (*p<0.05). After heat-shock treatment, the Su(H)GBE >GFP + enteroblasts have larger nuclear volumes on average, indicating that more cells are activated and becoming polyploid. N shows the number of midguts analysed in each experiment and n, the number of nuclei. (B) Graph showing the number of cells in mitosis (phospho-histone H3 (PH3) staining) in control guts and in guts imaged one day after a 2 hr heatshock. The heat shock increases the number of ISC divisions. The horizontal lines indicate the median values, which are significantly different by a two-tailed t test (**p<0.01). N shows the number of midguts analysed in this experiment. (C) Phosphorylated eukaryotic translation initiation factor 4E-binding protein 1 (p-4EBP1; green) staining in a control gut (left panel) and a gut 24 hr after a 2-hr heat shock (right panel). The heat shock induces a modest increase in p-4EBP1 levels. DNA is stained with DAPI (blue). (D) Phosphorylated Extracellular Regulated Kinase (p-ERK; green) staining in a control gut (left panel) and a gut 24 hr after a 2-hr heat shock (right panel). p-ERK levels are not increased after this treatment. (E) Par-6-GFP localisation to the lumen-facing domain of an integrating enteroblast. Canoe is labelled in (red) and the septate junctions are labelled with Coracle (greyscale). (F) βH-spectrin-GFP (green) localises to the enterocyte apical membrane and marks the lumen-facing membranes of both the integrating enteroblast and the overlying enterocytes. Canoe is labelled in (red) and the septate junctions are labelled with Coracle (greyscale). (G) A GFP protein trap line in the actin crosslinker, Cheerio (Cher; green). Cheerio localises to apical brush border of the enterocytes and to the apical, lumen-facing surface of an integrating enteroblast. Mesh (red) marks the septate junctions and basal labyrinth and α-spectrin (greyscale) marks the cell membranes. (H) Separate channels from the image of an integrating enteroblast with a pre-apical compartment (PAC) beneath a closed lumen shown in Figure 2G. (I) Separate channels from the image of an integrating enteroblast with an open lumen shown in Figure 2H. Scale bar=5μm.
-
Figure 2—figure supplement 1—source data 1
Source data for graph as Figure 2—figure supplement 1A.
- https://cdn.elifesciences.org/articles/76366/elife-76366-fig2-figsupp1-data1-v2.xlsx
-
Figure 2—figure supplement 1—source data 2
Source data for graph as Figure 2—figure supplement 1B.
- https://cdn.elifesciences.org/articles/76366/elife-76366-fig2-figsupp1-data2-v2.xlsx
Figure 2—video 1
Stack images for Figure 2G, showing the ‘closed’ lumen above the PAC.
The cells express the actin marker, Sqh::UtrABD-GFP (green), and are stained for Coracle (red) and Canoe (greyscale).
Figure 2—video 2
Stack images for Figure 2H, showing the ‘open’ lumen with a new enterocyte exposed to the gut lumen, it has a concave shape apical domain which is originated from the PAC.
The cells express the actin marker, Sqh::UtrABD-GFP (green), and are stained for Coracle (red) and Canoe (greyscale).
Figure 3 with 2 supplements
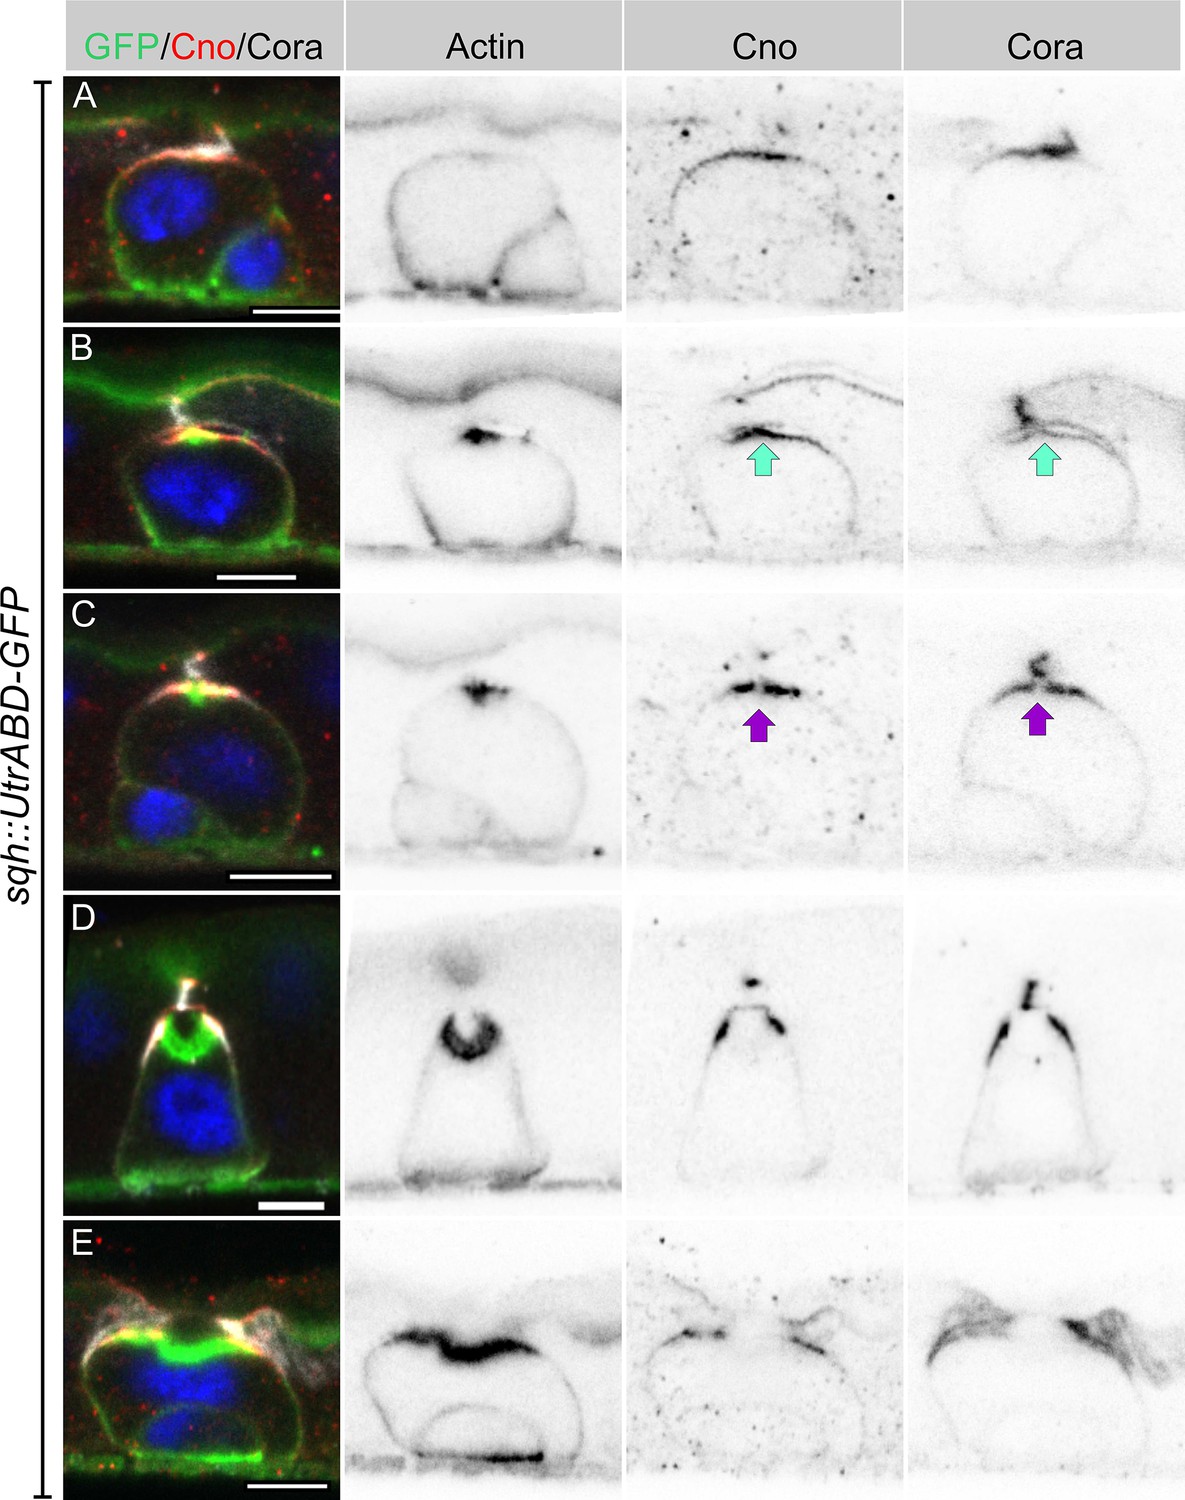
Integrating enteroblasts form an AMIS before forming a PAC.
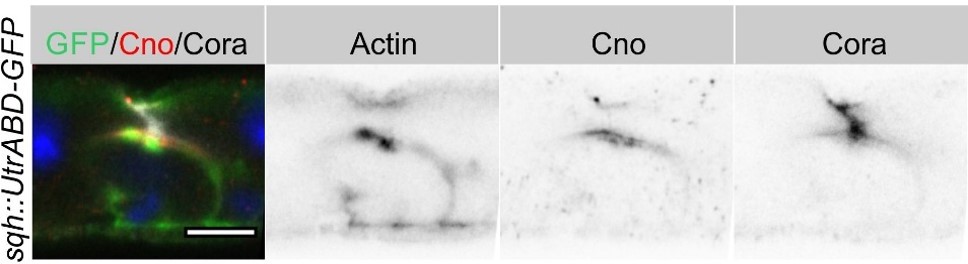
(A) When enteroblasts reach the level of the septate junction between the adjacent ECs, Canoe (red) and Cora (greyscale) localise to the apical side of the enteroblast, whereas actin is still uniformly distributed around the enteroblast cortex (green, GFP staining in sqh::UtrABD-GFP flies). (B) AMIS (green arrow) formation in an integrating enteroblast. Actin now localises to the apical side of the enteroblast in a smaller domain than Cora and Canoe. Note that the plasma membrane in the AMIS forming region has detached from the neighbouring ECs. (C) Actin concentrates in the centre of the AMIS, while Canoe and Cora are excluded from this region (purple arrow). (D) The actin enrichment enlarges to form a pre-assembled apical compartment (PAC) below the septate junction between the neighbouring ECs. Cora localises to the septate junctions that are forming between the pre-enterocyte and mature enterocytes on either side. Canoe localises to the marginal zones above the septate junctions and is also enriched on the enterocyte membranes facing the PAC lumen. (E) The septate junction between the overlying enterocytes dissolves and allows the closed lumen to fuse with the gut lumen. Scale bars = 5 µm.
Figure 3—figure supplement 1
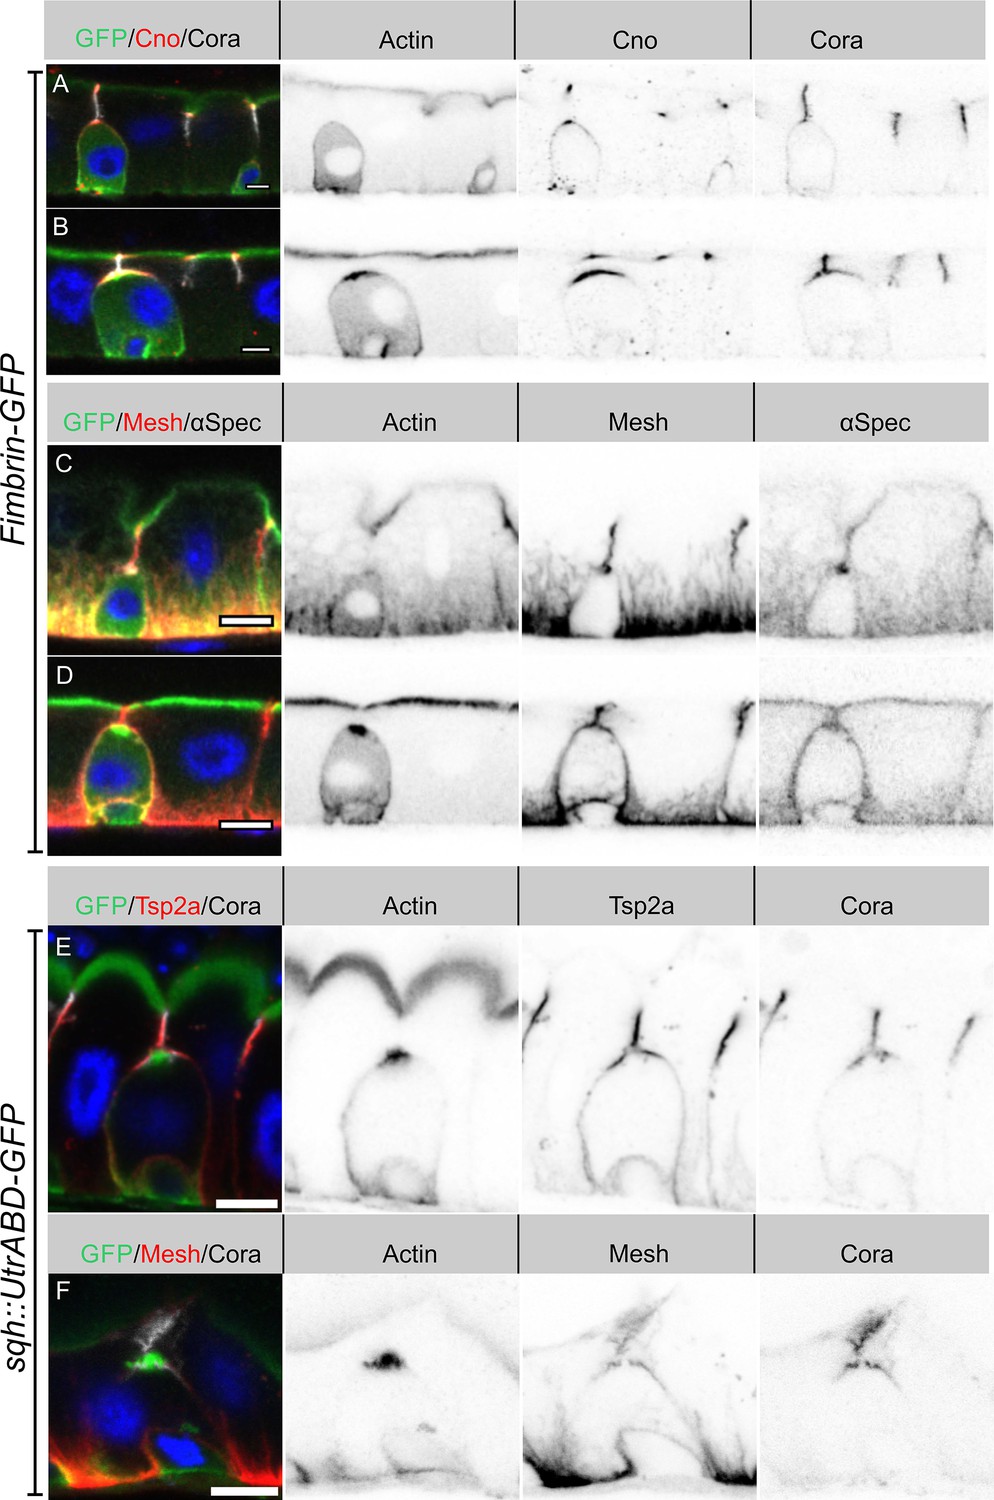
Actin and septate junction protein localisation during AMIS and PAC formation.
(A–B) Fim-GFP (green) marking actin. The enteroblasts in A and B are at similar stages to those shown in in Figure 3A and C. Canoe (red) and Cora (greyscale). (C–D) Fim-GFP (green; actin), Mesh (red, septate junctions), and α-spectrin (greyscale; cell cortex). The enteroblasts in C and D are at similar stages as those in Figure 2A and C. Mesh also labels the membrane invaginations from the basal side that form the basal labyrinth. (E–F) Cora (greyscale) colocalises with Tsp2a (red in E) and Mesh (red in F) during PAC formation. Actin is labeled with GFP (green) in sqh::UtrABD-GFP flies. Scale bars = 5 µm.
Figure 3—video 1
Stack images for Figure 3D, showing the ‘closed’ lumen above the PAC.
The cells express the actin marker, Sqh::UtrABD-GFP (green), and are stained for Coracle (greyscale) and Canoe (red).
Figure 4 with 1 supplement

AJs are lost from the enteroblast apical membrane during AMIS formation.
(A) E-cadherin (green) localises all around the plasma membrane of integrating enteroblasts that have not yet reached the septate junction between the overlying enterocytes. Cora (greyscale) is not polarised at this stage and Canoe (red) is only weakly enriched apically. (B) Canoe and Cora form apical caps in enteroblasts that have reached the septate junction between the overlying enterocytes, but E-cadherin is still uniformly distributed along the enterocyte-enteroblast cell contact sites. This enteroblast is at the stage when Canoe is polarised but actin is not (see Figure 3A, Figure 3—figure supplement 1A and C). (C) AMIS formation (green arrow) in an integrating enteroblast. The Adherens junctions (Arm staining in white) disappear from the AMIS region. Canoe (red) localises to both the enteroblast and enterocyte membranes after their separation as seen in Figure 3B. The integrating enteroblast on the right (orange arrow) is at a slightly earlier stage before separation of the apical enteroblast membrane from the overlying enterocyte membranes. Actin (green) has started to accumulate apically, but at lower levels than in the left-hand enteroblast. (D) Ecad-GFP (green) is absent from the membrane around the pre-assembled apical compartment (purple arrow) as it forms. The fluorescence intensities of all labelled components are plotted in the panels next to the corresponding figures. Scale bars = 5 µm.
-
Figure 4—source data 1
Source data for the fluorescence intensity plot in Figure 4A–D.
- https://cdn.elifesciences.org/articles/76366/elife-76366-fig4-data1-v2.xlsx
Figure 4—figure supplement 1
The localisation of junctional proteins during PAC formation.
(A) Tsp2a (red) localises to the septate junctions that develop between the pre-enterocyte and the neighbouring enterocytes as the PAC forms. Canoe is shown in green and α-spectrin in greyscale. (B) E-cadherin (green) disappears around the PAC. Canoe is shown in red and α-spectrin in greyscale. Scale bars = 5 µm.
Figure 5 with 1 supplement
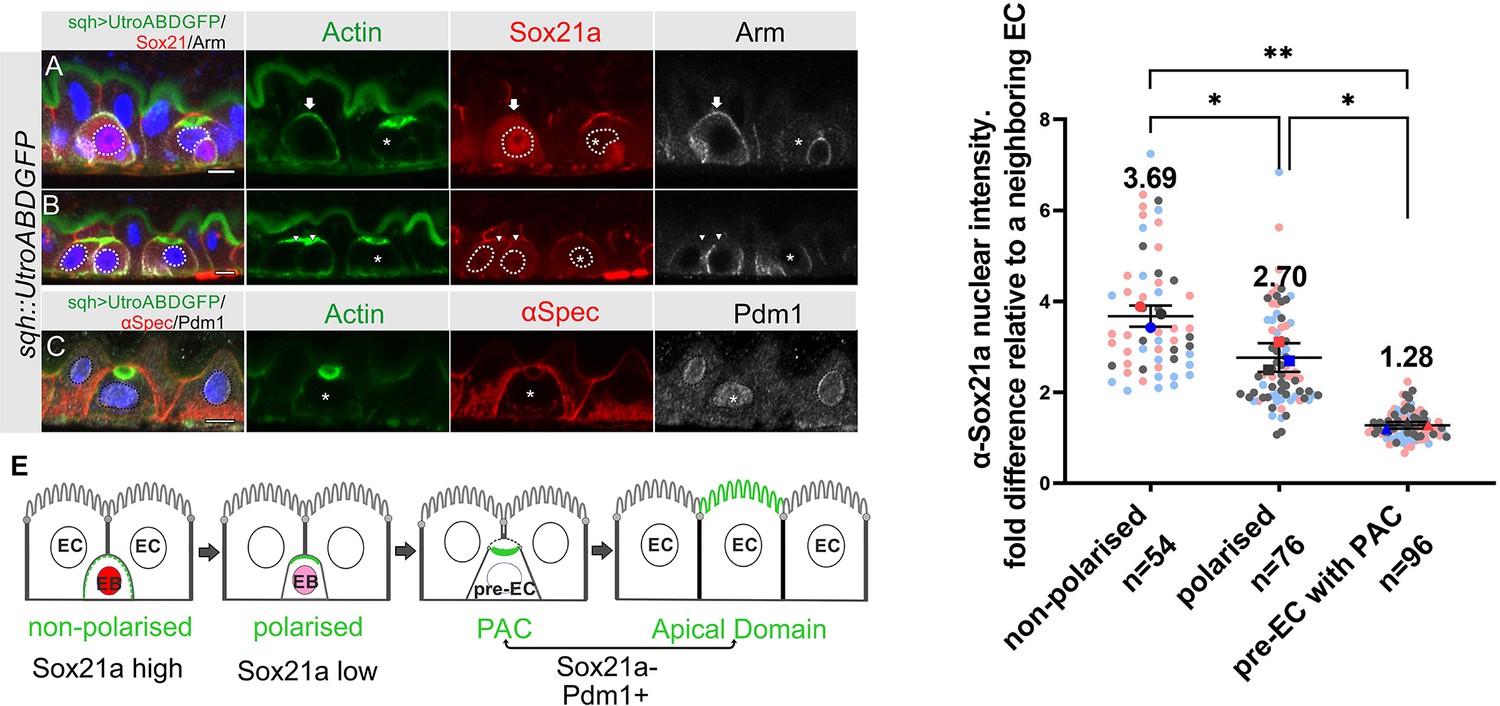
Sox21a levels fall as the PAC forms during integration.
(A–B) Sox21a (red) is present at high levels in the nuclei of enteroblasts in which actin (Utr-ABD-GFP; green) is not yet polarised apically (arrow in A), is lower in the nuclei of enteroblasts with polarised actin (arrowheads in B). Pre-enterocytes that have formed a PAC (asterisks in A and B) lack nuclear Sox21a. The nuclei are outlined by white dashed lines. Note that the Adherens junctions (Armadillo; greyscale) still extend around the apical membrane of the enteroblast with unpolarised actin, but this signal has disappeared in the enteroblasts with apical actin (AMIS stage, arrowheads in B) and the pre-enterocytes with a PAC (*). The anti-Sox21a antiserum labels the septate junctions, but this is non-specific staining as it is still present in Sox21a mutant flies (see Figure 5—figure supplement 1A). (C) Pdm1+ (white) is expressed in a Pre-enterocyte with a PAC (asterisk); actin in green and αSpec in red. Scale bar = 5 µm. (D) Graph showing the levels of nuclear Sox21a staining relative to neighbouring enterocytes at different stages of enteroblast integration. The horizontal lines indicate the median values, which are significantly different by a two-tailed t test among three groups (**p<0.005, *p<0.05). n, the number of EB/neighbouring EC pairs. (E) Diagram showing the levels of nuclear Sox21a and Pdm1 during enteroblast integration.
-
Figure 5—source data 1
Source data for the graph as Figure 5D.
- https://cdn.elifesciences.org/articles/76366/elife-76366-fig5-data1-v2.xlsx
Figure 5—figure supplement 1
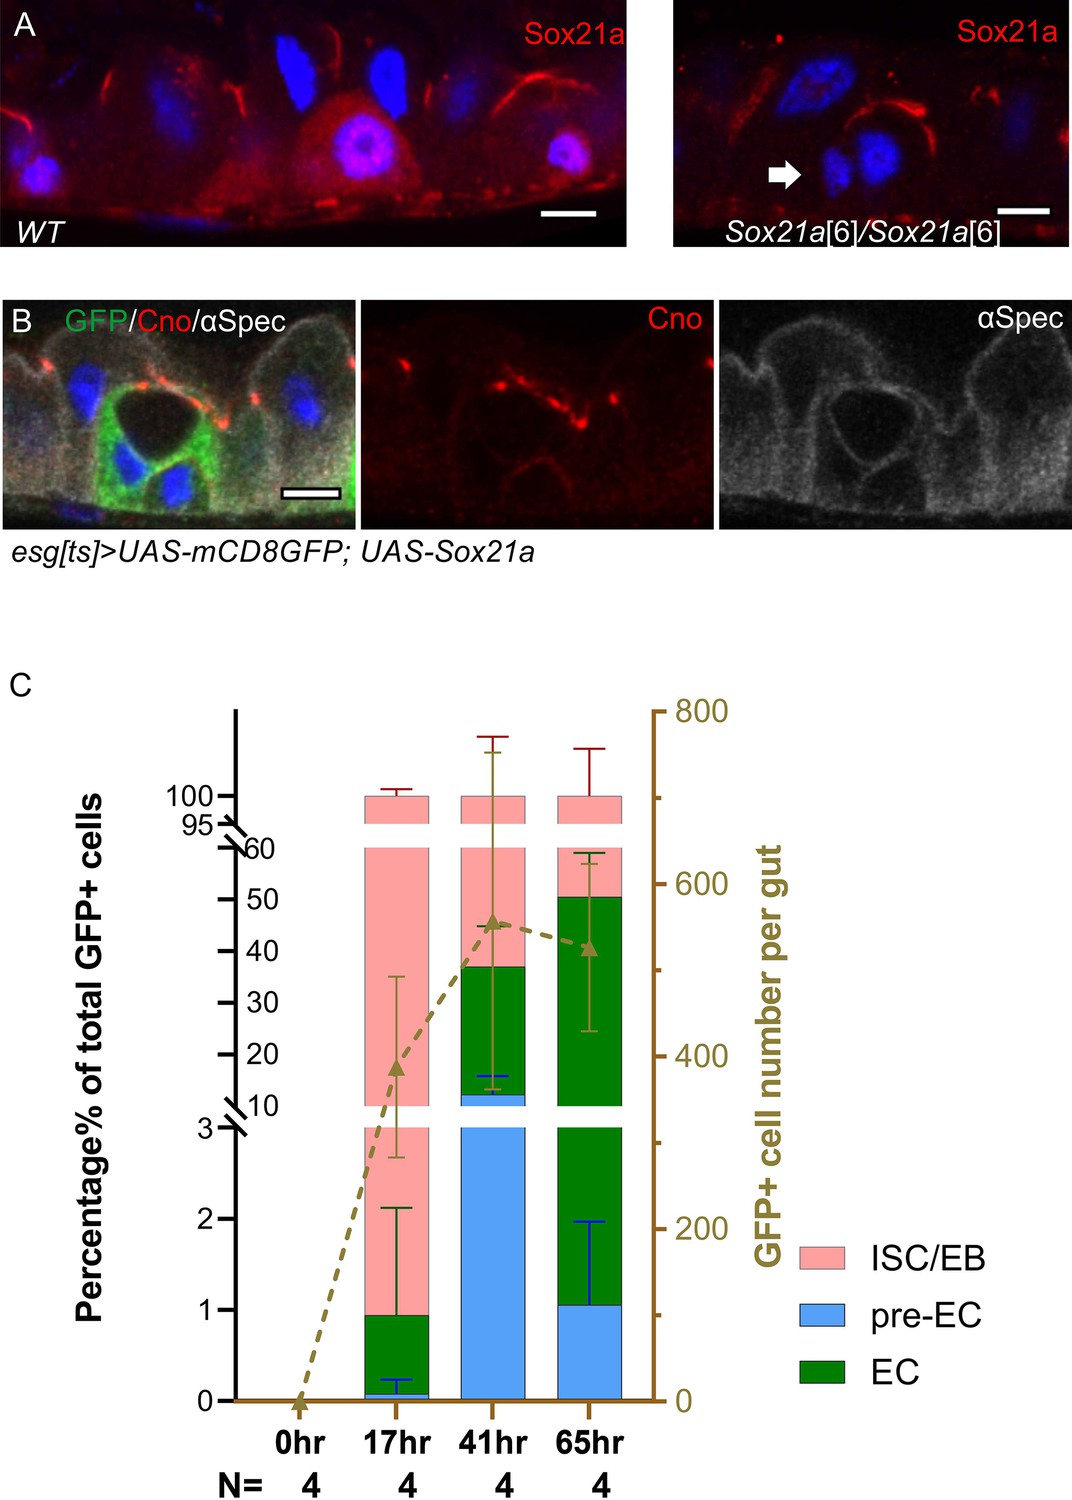
Activated enteroblasts take 1-2 days to become enterocytes.
(A) The Sox21a antiserum non-specifically stains the septate junctions. In the left hand panel, a wild-type Sqh::UtrABD-GFP gut stained for Sox21a shows nuclear staining in the two enteroblasts, as well as strong staining of the septate junctions. The righthand panel shows a gut from Sox21a6 homozygote, in which the nuclear signal is lost, but the septate junctions are still labelled. The arrow points to an enteroblast with no nuclear Sox21a signal. (B) An enteroblast over-expressing Sox21a that has formed a PAC, while remaining esgts >GFP positive (green). Canoe in red and α-spectrin in greyscale. Scale bars = 5 µm. (C) Graph showing the percentage (lefthand y axis) of GFP+ve cells without a PAC (pink), with a PAC (blue) and with a full apical domain (green) at 0 hr, 17 hrs, 41 hrs and 65 hrs after induction of Sox 21 a expression. esgts-Gal4, UAS-Sox21a, UAS-mCD8GFP flies were placed at 25 °C to deactivate tub>Gal80ts. N shows the number of midguts analysed. The graph also shows the total number of GFP+ve cells (righthand y axis) at each time point.
-
Figure 5—figure supplement 1—source data 1
Source data for the graph as Figure 5—figure supplement 1C.
- https://cdn.elifesciences.org/articles/76366/elife-76366-fig5-figsupp1-data1-v2.xlsx
Figure 6
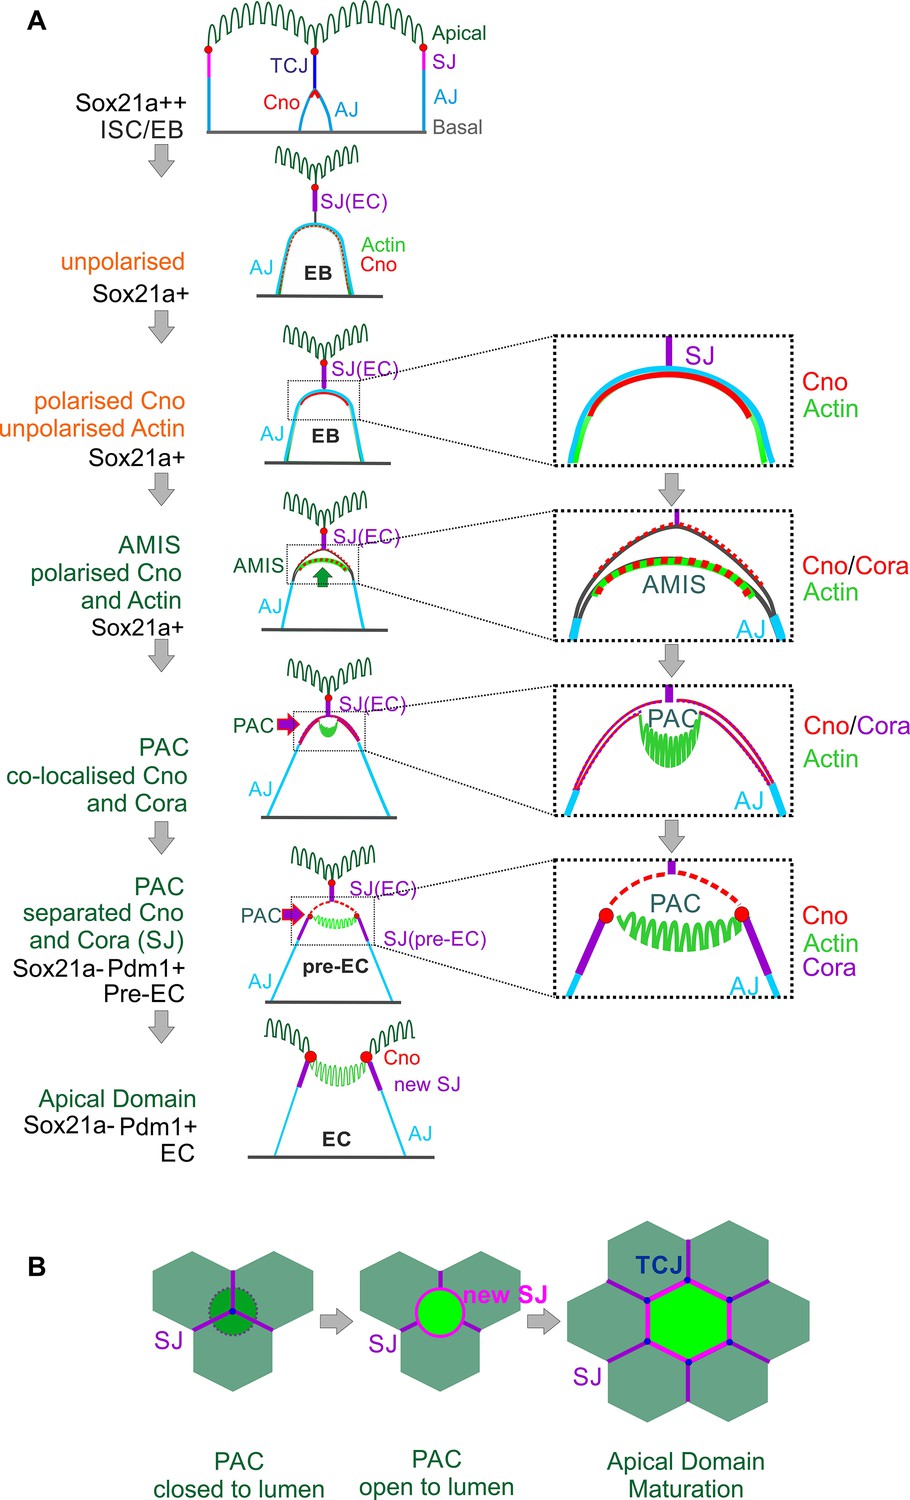
Diagram of the steps in enteroblast integration.
(A) Diagram shows the side view of the steps in enteroblast integration. ‘Unpolarised’ in the second panel of this figure indicates that the enteroblast has not formed a distinct apical domain. At this stage, no marker is clearly apically localised. ‘unpolarised’ or ‘polarised’ in the third and fourth panels describe the localisation of marker proteins such as Actin and Canoe. (B) Top view model of the last steps from ‘closed’ (dashed line) to ‘open’ lumen, and to the stage when the new EC forms a mature apical domain (green) and builds new SJs (purple) and tri-cellular junction (TCJ) (navy blue) with neighbouring ECs.
Figure 7 with 1 supplement
Neither Canoe or Coracle is required for PAC formation or enterocyte polarity.
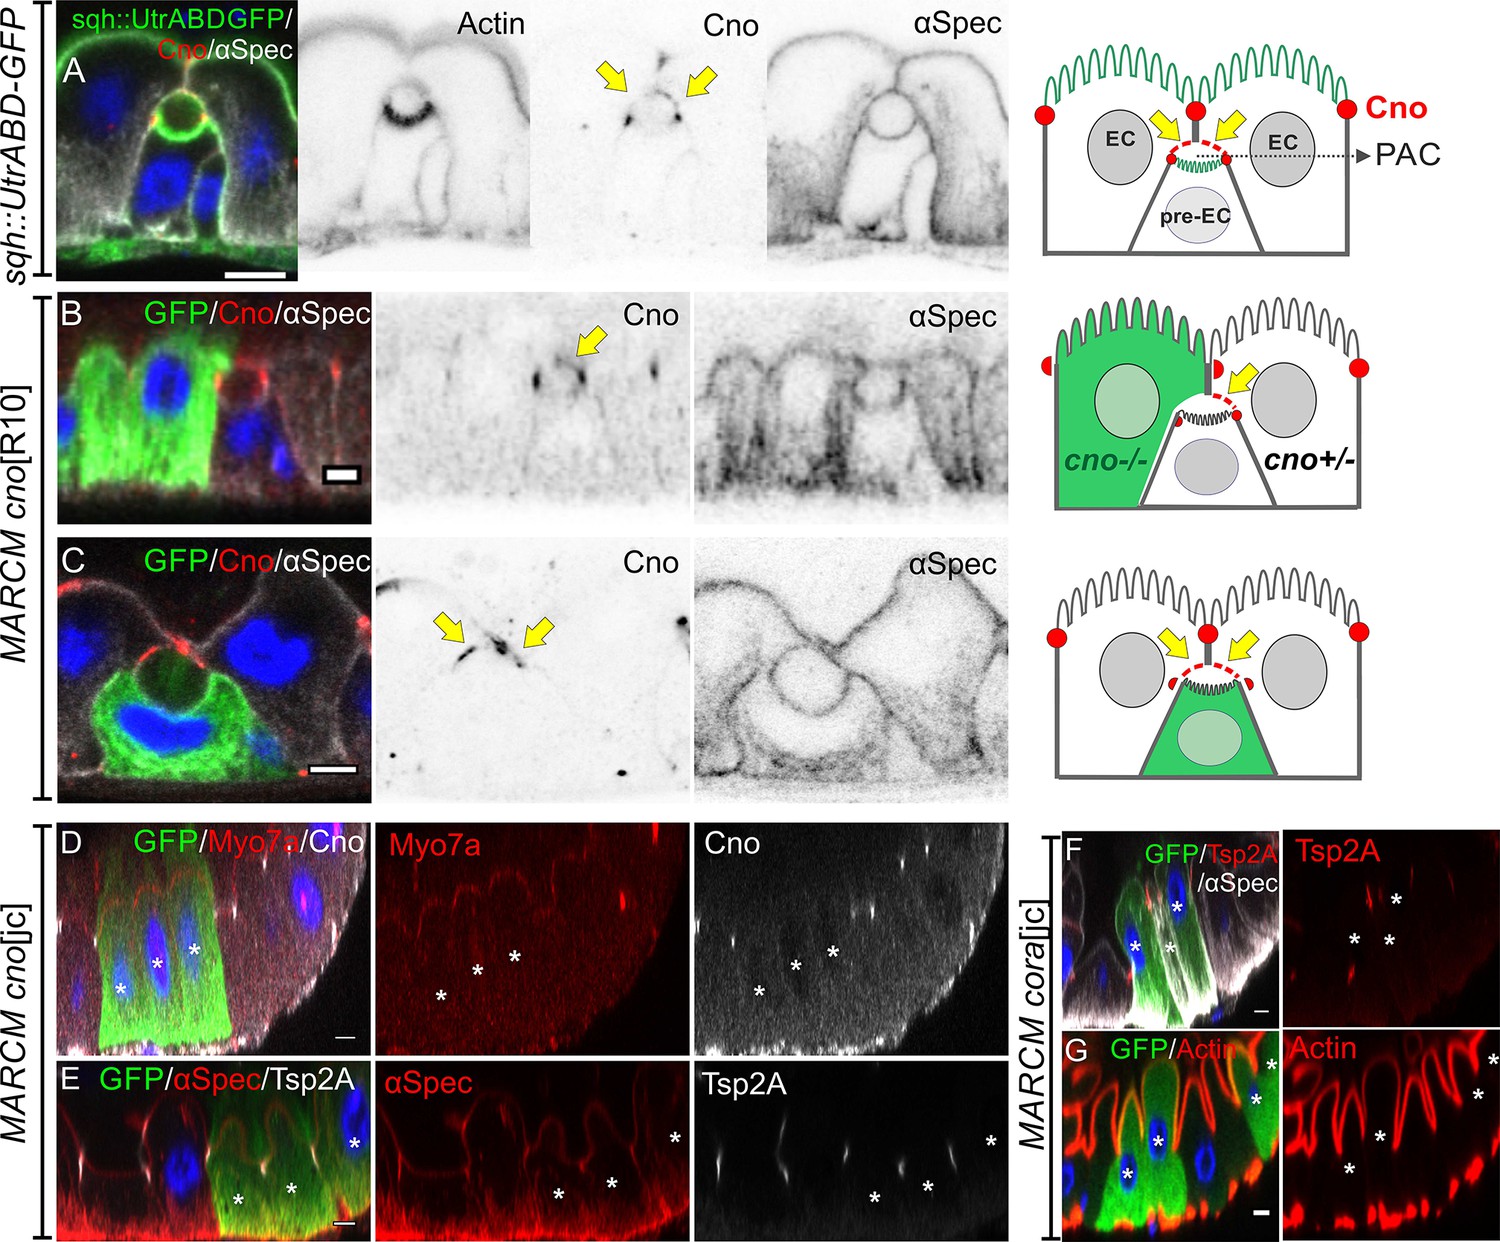
(A) Canoe (red) localises to the enterocyte membranes (yellow arrows) that face the lumen above an integrating pre-enterocyte, and to the marginal zone above the newly formed septate junctions between the pre-enterocyte and neighbouring enterocytes. Sqh >UtrABD GFP labelling of Actin in green and α-spectrin in greyscale. (B) An enteroblast integrating between a canoeR10 mutant enterocyte (green) and a heterozygous enterocyte. Canoe (red) is lost from the roof of the lumen on the side with the mutant enterocyte, but still marks the roof on the side with a non-mutant enterocyte (yellow arrow). (C) A canoeR10 mutant pre-enterocyte (green) integrating between two heterozygous enterocytes. The PAC still forms normally in the absence of Canoe (red). α-spectrin in greyscale. (D–E) MARCM clones of canoejc homozygous mutant cells stained for Myo7a (red; D), α-spectrin (red; E) and Tsp2A (greyscale; E). The mutant cells form normal apical domains and septate junctions in the absence of Canoe. (F–G) MARCM clones of coraclejc homozygous mutant cells stained for Tsp2a (red in F), α-spectrin (greyscale in F) and Actin (red in G). The mutant cells form normal apical domains and septate junctions in the absence of Coracle. * marks the homozygous mutant cells. Scale bar = 5 µm.
Figure 7—figure supplement 1
Canoe is not required for PAC formation.
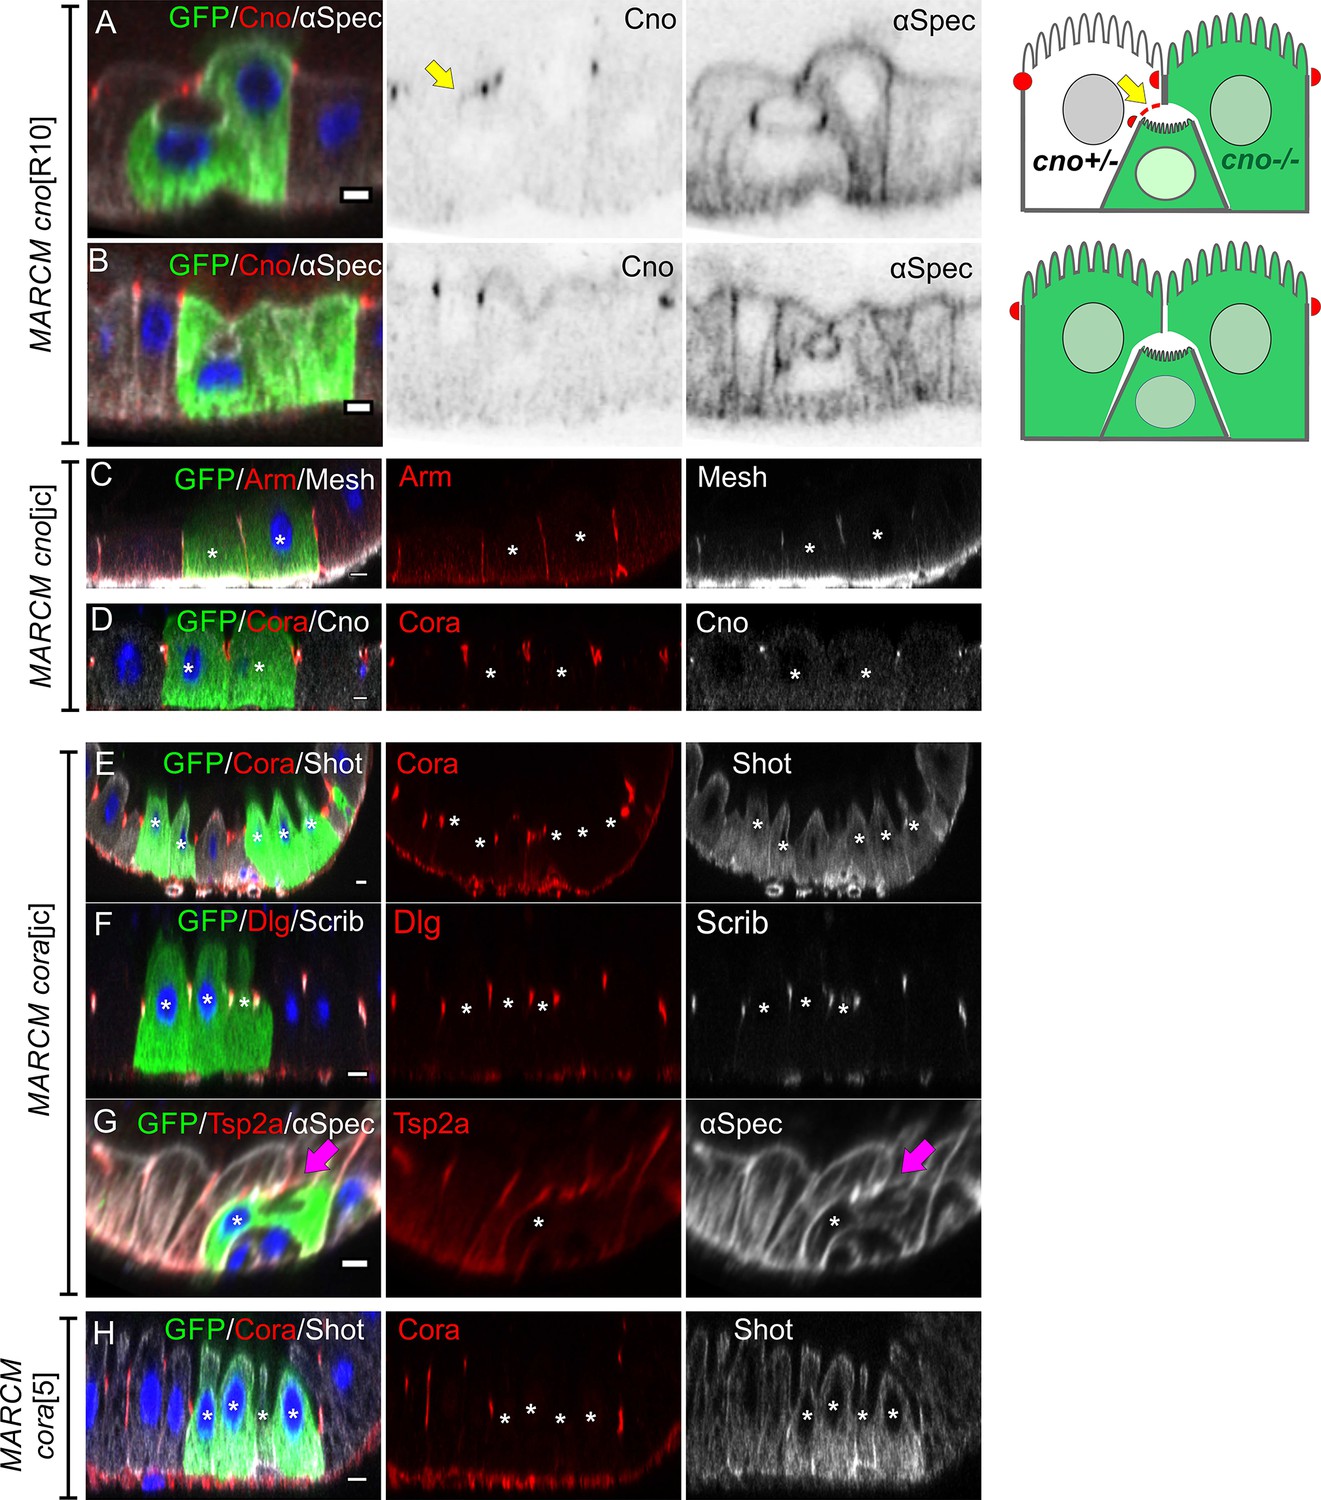
(A) A PAC still forms when both the pre-enterocyte and one of the neighbouring enterocytes are homozygous for canoeR10 (green). Canoe in red and α-spectrin in greyscale. (B) Canoe staining is lost completely in the PAC when all surrounding cells are canoeR10 mutant. (C–D) Adherens junctions (Arm, red in C) and septate junctions (Mesh, red in C; Cora, red in D) form normally in canoejc homozygous mutant cells (green). (E) Coracle (red) staining is lost in corajc homozygous mutant cells (green), while Shot (greyscale) is unaffected. (F) Dlg (red) and Scrib (greyscale) still localise to the septate junctions in corajc homozygous mutant cells (green). (G) A corajc homozygous pre-enterocyte (green) with a PAC (purple arrow) marked by α-spectrin staining (greyscale). (H) Coracle (red) staining is lost in cora5 homozygous mutant cells (green), while Shot (greyscale) is unaffected. * marks the homozygous mutant cells. Scale bars = 5 µm.
Figure 8 with 2 supplements

mesh mutants fail to form a PAC or form an internal PAC.
(A) A meshR2 homozygous MARCM clone marked by GFP (green). The mutant cells lack Mesh staining (red), fail to make septate junctions and do not reach the gut lumen. (B–C) meshR2 (B) and meshf04955 (C) homozygous mutant cells marked by the loss of GFP (green). The mutant cells form internal PACs that are marked by actin (red in B) and Myo7a (red in C). The cell in C has formed multiple internal PACs. (D) βH-spectrin (red) localises around the plasma membrane of meshR2 mutant enteroblasts (green), indicating that they do not polarise normally, but adherens junctions (Arm, greyscale) are still down-regulated at the apical surface. (E) meshR2 mutant enteroblasts (green) stained for Par-6 (red). Par-6 localises to the apical membrane (green arrow) in the enteroblast on the right, but localises around the internal PAC in the enteroblast on the left (green arrowhead). (F) A meshR2 mutant enteroblast stained for α-spectrin (greyscale) and Rab11 (red), which localises apically (green arrow). The α-spectrin staining reveals that a space has formed between the apical side of the integrating enteroblast and the neighbouring enterocytes. (G) A meshR2 mutant enteroblast stained for α-spectrin (greyscale) and Rab11 (red) that has formed an internal PAC. Rab11 decorates the surface of the internal PAC (green arrowhead). Note the younger, mutant enteroblast on the left (green arrow) localises Rab11 apically. (H) A meshR2 mutant enteroblast (green) with an internal PAC stained for Canoe (red) and α-spectrin (greyscale). Canoe does not localise to the internal PAC, which has no junctions. Scale bars = 5 µm. (I) Diagrams showing the distributions of Canoe, actin and adherens junctions in the three phenotypic classes of meshR2 mutant enteroblasts. The measurement of Canoe’s intensity in the WT and meshR2 mutant enteroblasts is shown in Figure 8—figure supplement 2 D&E. (J) Percentages of mesh, Tsp2a and ssk mutant enteroblasts in each of the classes in (I) compared to a wild-type control (FRT82B clones) based on actin in mutant cells (representative images in Figure 8—figure supplement 1E and F).
-
Figure 8—source data 1
Source data for the graph as Figure 8J.
- https://cdn.elifesciences.org/articles/76366/elife-76366-fig8-data1-v2.xlsx
Figure 8—figure supplement 1
Phenotypes of other septate junction mutants.
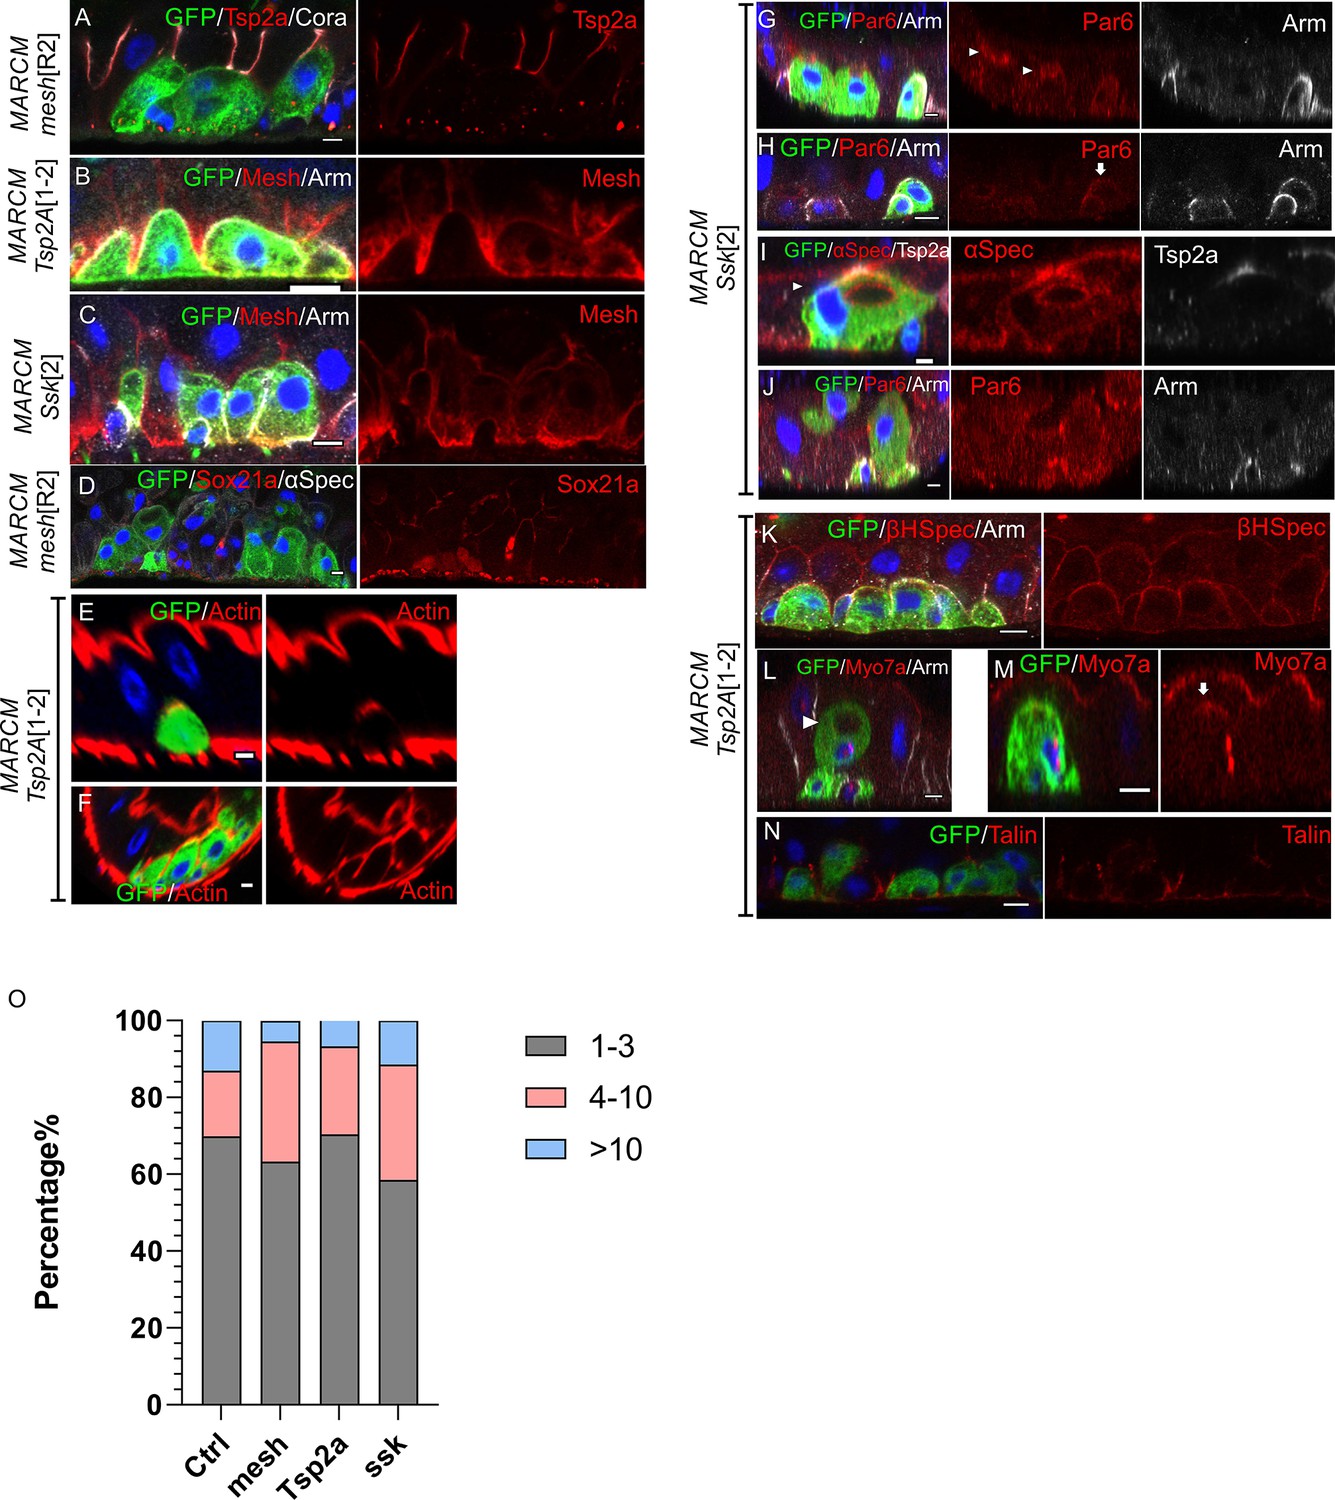
(A–C) The localisations of septate junction proteins are interdependent. Tsp2A (red) is lost from meshR2 mutant cells (green; A) and Mesh is not localised in Tsp2A1-2 (B) and ssk2 mutant cells (C). (D) Sox21a (red) is expressed and then down-regulated in meshR2 mutant enteroblasts as in wild-type. (E–F) Representative images showing actin in two phenotypic classes of Tsp2A1-2 mutant cells as in Figure 8J: actin in polarised cells (E) and unpolarised cells (F). (G–J) ssk2 mutant cells still polarise (H), form a PAC (arrowhead in G) or an internal PAC (arrowhead in I) and occasionally reach the gut lumen (J). Par-6, red. (K–M) Tsp2A1-2 mutant enteroblasts (green) fall into three phenotypic classes: unpolarised (K), with an internal PAC (L) and weakly polarised (M). (N) Tsp2A1-2 mutant enteroblasts (green) still localise Talin to the basal domain. Scale bars = 5 µm. (O) Graph showing the distribution of clone sizes in control FRT82B, mesh, ssk, and Tsp2a mutant MARCM flies. Mutant clones with 1–3 homozygous cells are shown in grey, 4–10 cells in pink and clones with over 10 cells in blue.
Figure 8—figure supplement 2
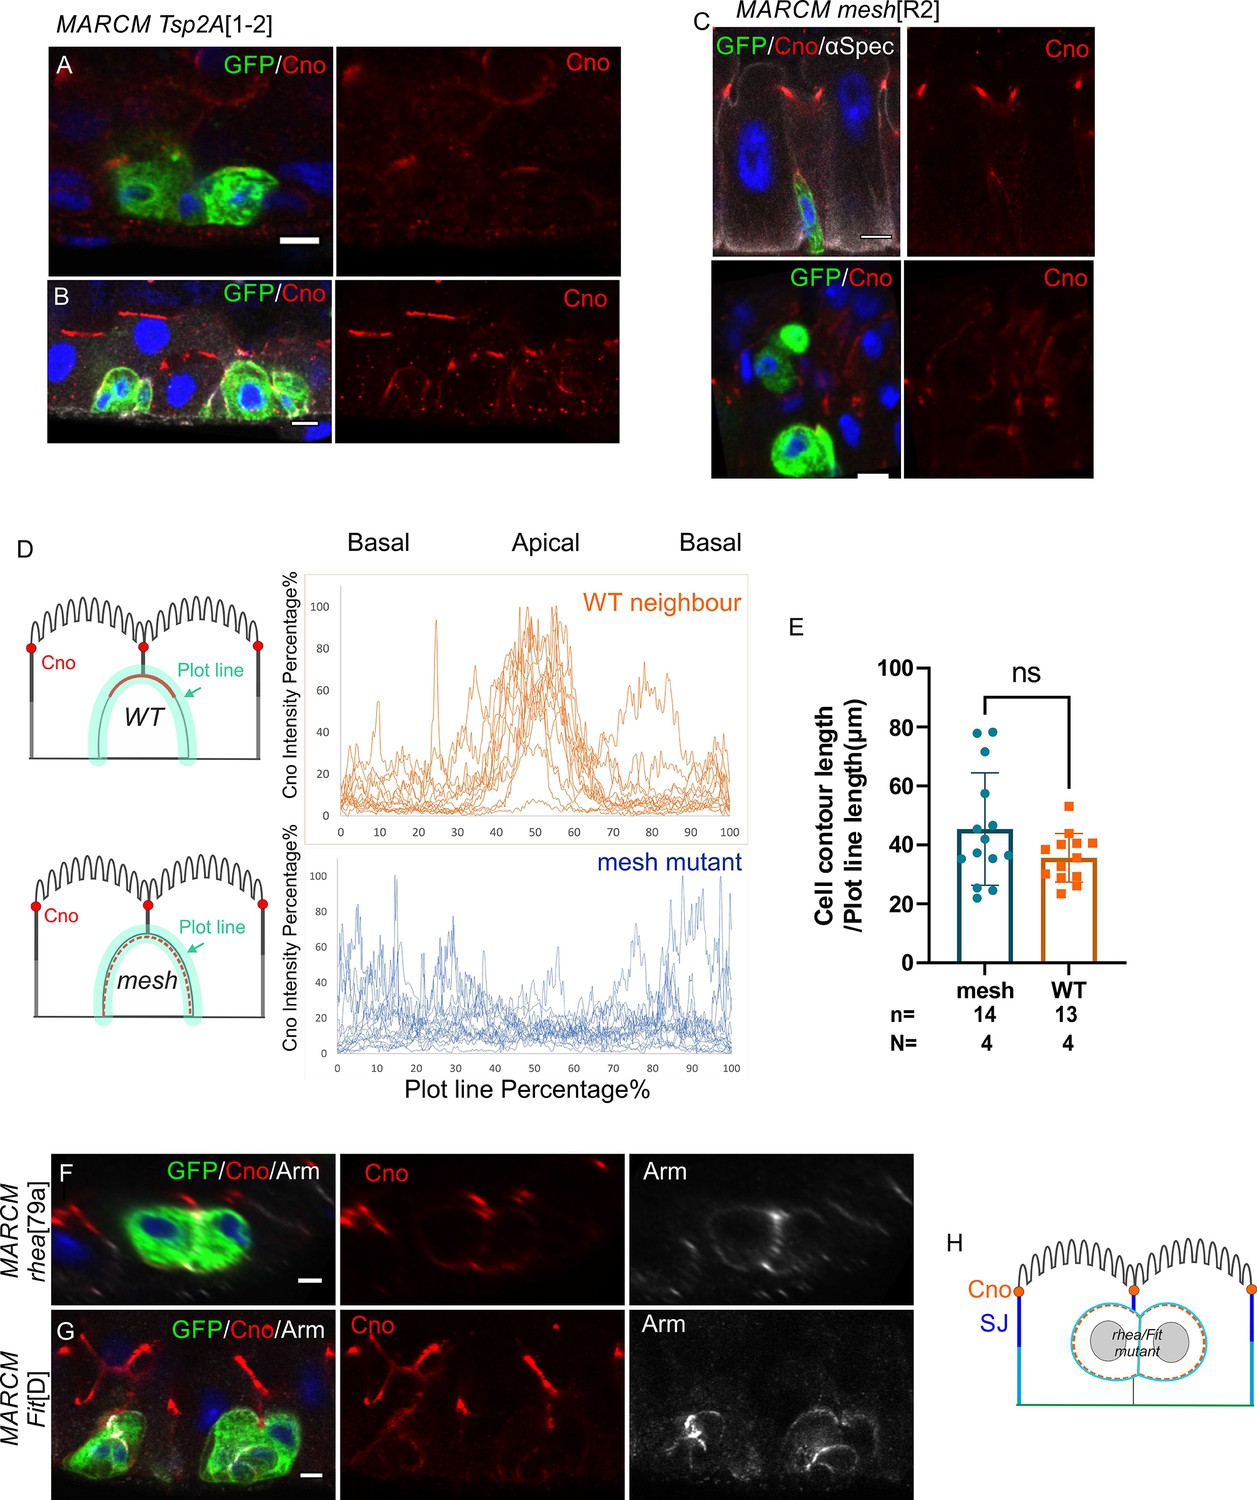
mesh and Tsp2a mutants disrupt the apical localisation on Canoe in integrating enteroblasts.
(A–C) Canoe (red) is polarised in early stage Tsp2A1-2 (A) and meshR2 mutant enteroblasts (C). As Tsp2A1-2 mutant cells differentiate and integrate, Canoe becomes diffuse and no longer forms a clear apical domain (B). (D) Graph showing the intensity of Canoe staining around the cell cortex from the basal (0% and 100%) to the apical side (50%) of 13 wild-type (brown) and 14 meshR2 mutant cells. Canoe is enriched apically in wild-type cells, but not in meshR2 mutant cells. (E) The measured meshR2 mutant cells are in matching size to the measured WT neighbouring cells. (F–H) Canoe (red) is not localised in rhea79a (F) and FitD (G) mutant cells. Scale bars = 5 µm.
-
Figure 8—figure supplement 2—source data 1
Source data for the graphs as Figure 8—figure supplement 2D and E.
- https://cdn.elifesciences.org/articles/76366/elife-76366-fig8-figsupp2-data1-v2.xlsx
Author response image 1
Additional files
Download links
A two-part list of links to download the article, or parts of the article, in various formats.
Downloads (link to download the article as PDF)
Open citations (links to open the citations from this article in various online reference manager services)
Cite this article (links to download the citations from this article in formats compatible with various reference manager tools)
De novo apical domain formation inside the Drosophila adult midgut epithelium
eLife 11:e76366.
https://doi.org/10.7554/eLife.76366


