A systematic, complexity-reduction approach to dissect the kombucha tea microbiome
- Department of Bioengineering, University of Illinois Urbana-Champaign, United States
- Carl R. Woese Institute for Genomic Biology, University of Illinois Urbana-Champaign, United States
- College of Food Science and Nutritional Engineering, China Agricultural University, China
- Department of Physics, University of Illinois Urbana-Champaign, United States
- Center for Biophysics and Quantitative Biology, University of Illinois Urbana-Champaign, United States
- National Center for Supercomputing Applications, United States
Figures
Figure 1
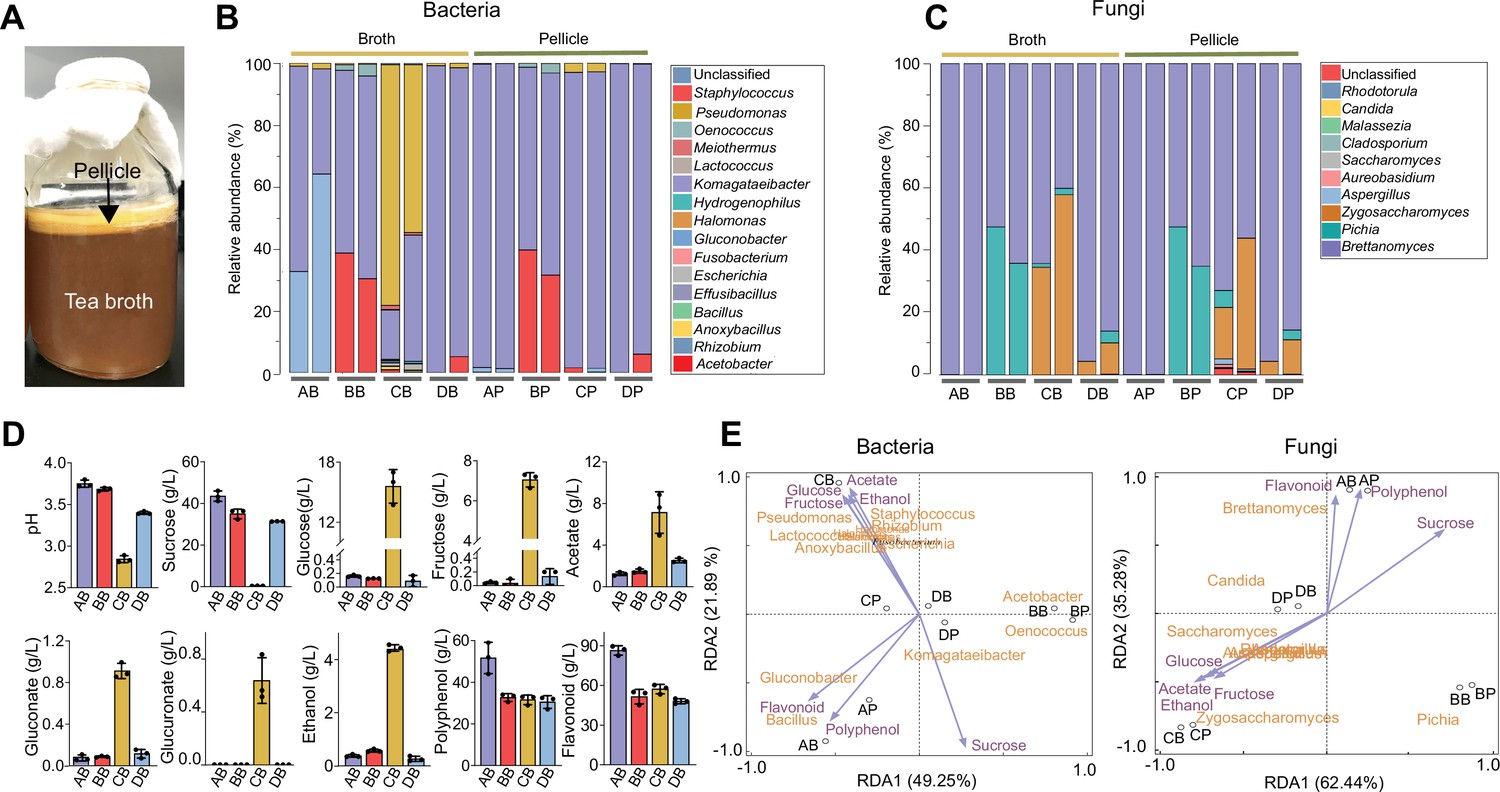
Characterization of the native KT microbiome.
(A) Image of a typical kombucha tea fermentation containing both broth and pellicle. (B, C) Microbial composition in the broths and pellicles of different kombucha teas at the bacterial (B) and fungal (C) genus levels. For the four tea samples (A, B, C and D), their broths are named AB, BB, CB, and DB whereas their pellicles are called AP, BP, CP and DP respectively. For each sample, two duplicates are presented. (D) Chemical properties of the kombucha tea broths at the end of fermentation (day 14). Measured variables include pH, sucrose, glucose, fructose, acetate, gluconate, glucuronate, ethanol, polyphenol, and flavonoid. Bars and error bars correspond to means and s.d. (E) Correlation between microbial composition with biochemical substances in the KTs uncovered by redundancy analysis. Purple arrows represent metabolites, black circles represent different tea samples.
Figure 2
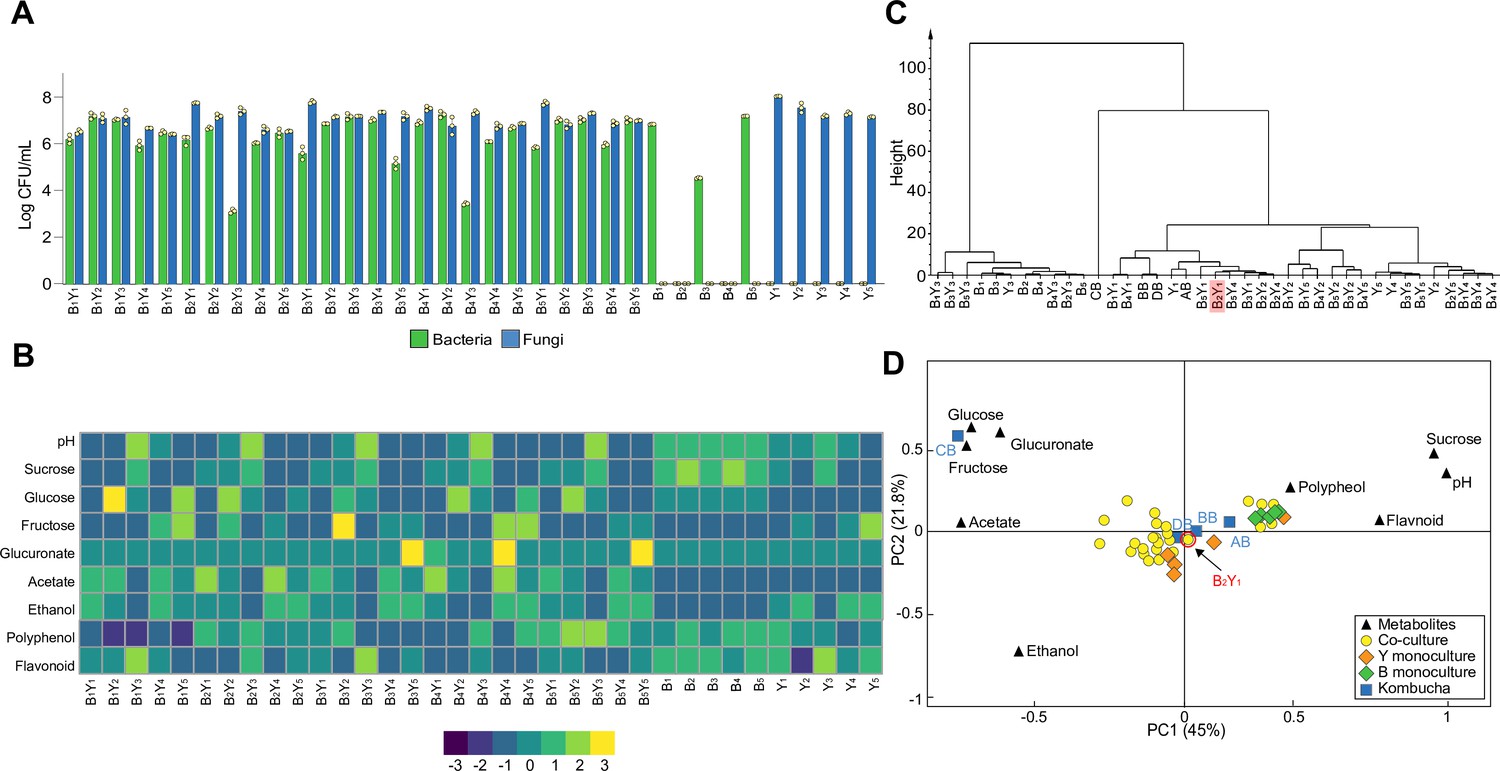
Population and metabolic quantification of two-species core candidates.
(A) Colony forming units (CFU) counting of 25 two-species core candidates and 10 monoculture controls upon fermentation. Each core candidate is composed of one bacterial and one fungal species selected from the 10 isolates: B1 (Komagataeibacter rhaeticus), B2 (Komagataeibacter intermedius), B3 (Gluconacetobacter europaeus), B4 (Gluconobacter oxydans), B5 (Acetobacter senegalensis), Y1 (Brettanomyces bruxellensis), Y2 (Zygosaccharomyces bailii), Y3 (Candida sake), Y4 (Lachancea fermentati), and Y5 (Schizosaccharomyces pombe). Each monoculture control is one of the ten isolates. (B) Chemical property analysis of the core candidates and their controls. Measured variables include pH, sucrose, glucose, fructose, glucuronate, ethanol, acetate, polyphenol, and flavonoid. Here, the heatmap illustrates the relative concentrations of metabolites compared to their means across all samples using the Z-score normalization (Quan et al., 2019). (C) Hierarchical cluster analysis of the metabolic properties of the samples. The candidate B2Y1 is highlighted. (D) Principal component analysis of the metabolic properties. The candidate B2Y1 is circled in red.
-
Figure 2—source data 1
List of isolated bacterial and fungal species.
- https://cdn.elifesciences.org/articles/76401/elife-76401-fig2-data1-v1.xlsx
-
Figure 2—source data 2
Counting data of different bacteria and yeasts co-cultures.
- https://cdn.elifesciences.org/articles/76401/elife-76401-fig2-data2-v1.xlsx
-
Figure 2—source data 3
Chemical property analysis of the core candidates.
- https://cdn.elifesciences.org/articles/76401/elife-76401-fig2-data3-v1.xlsx
-
Figure 2—source data 4
Statistics of HCA and PCA analysis.
- https://cdn.elifesciences.org/articles/76401/elife-76401-fig2-data4-v1.xlsx
Figure 3 with 1 supplement
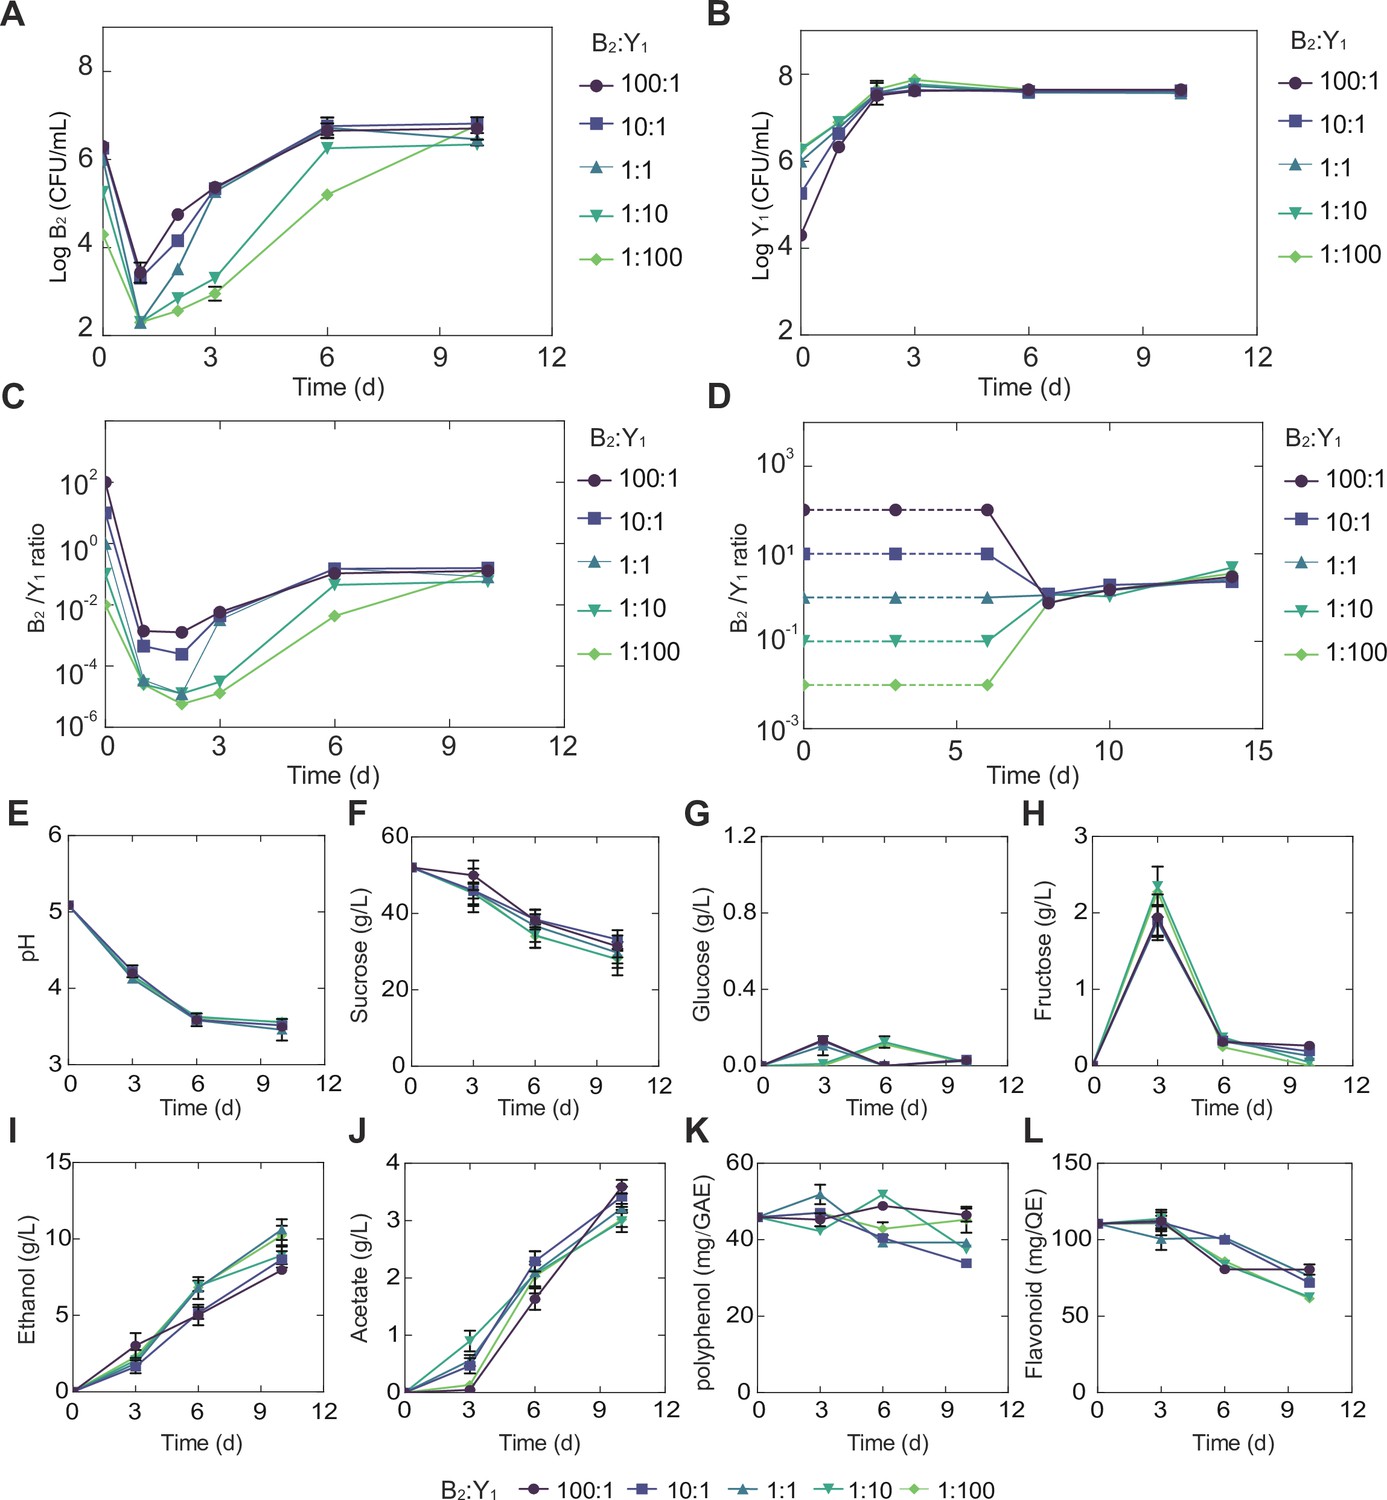
Temporal compositional and metabolic dynamics of the minimal core (B2Y1).
(A, B) Populations of B2 (A) and Y1 (B) in broth throughout the course of a fermentation starting with 50 g/L sucrose. (C) Bacterium-to-yeast population ratio of the microbes in broth. (D) Ratio of microbial populations in pellicle during the fermentation. Notably, pellicle formation was not observed until day 6. (E–L) pH, carbon sources and metabolites during the fermentation driven by the core. The concentrations of total polyphenols and total flavonoids were expressed as mg of gallic acid equivalent (GAE) per mL of kombucha tea (mg GAE/mL) and mg of quercetin equivalent (QE) per mL of kombucha tea (mg QE/mL) respectively. Bars and error bars correspond to means and s.d.
-
Figure 3—source data 1
Counting data of the minimal core.
- https://cdn.elifesciences.org/articles/76401/elife-76401-fig3-data1-v1.xlsx
-
Figure 3—source data 2
Chemical property analysis of the minimal core.
- https://cdn.elifesciences.org/articles/76401/elife-76401-fig3-data2-v1.xlsx
Figure 3—figure supplement 1
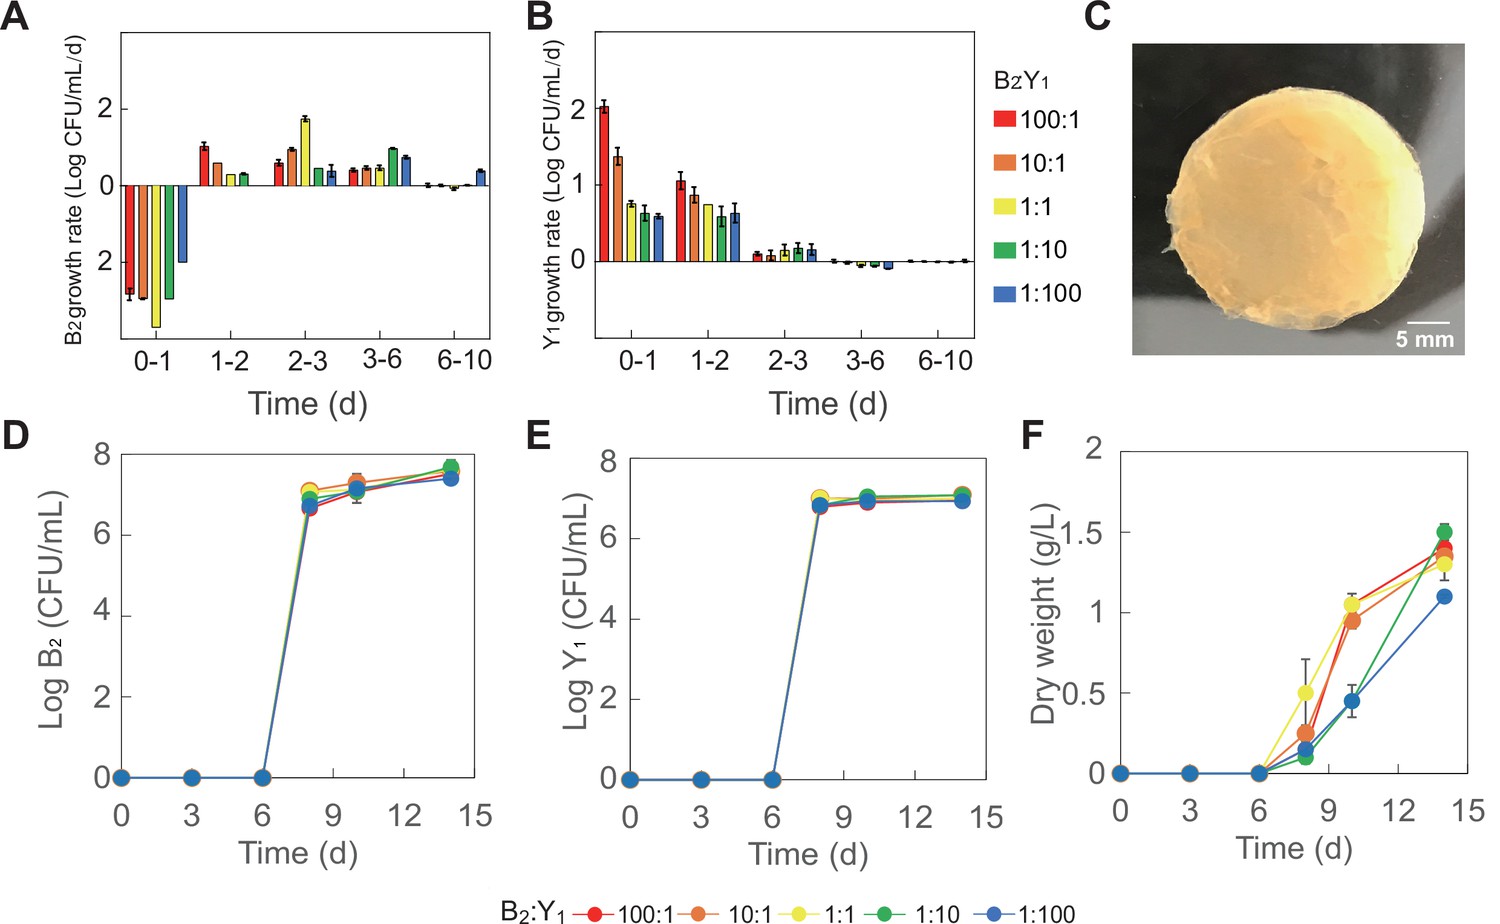
Population dynamics and pellicle formation of the minimal core (B2Y1).
(A, B) Growth rates of B2 (A) and Y1 (B) in tea broth during the KT fermentation with 50 g/L sucrose. (C) Image of a typical pellicle formed during the fermentation. (D, E) Populations of B2 (D) and Y1 (E) in pellicle during the fermentation. (F) Dry weight of pellicles during the fermentation. Five initial compositions were used for fermentation, including 100:1 to 10:1, 1:1, 1:10, and 1:100. Bars and error bars correspond to means and s.d., respectively.
Figure 4 with 1 supplement
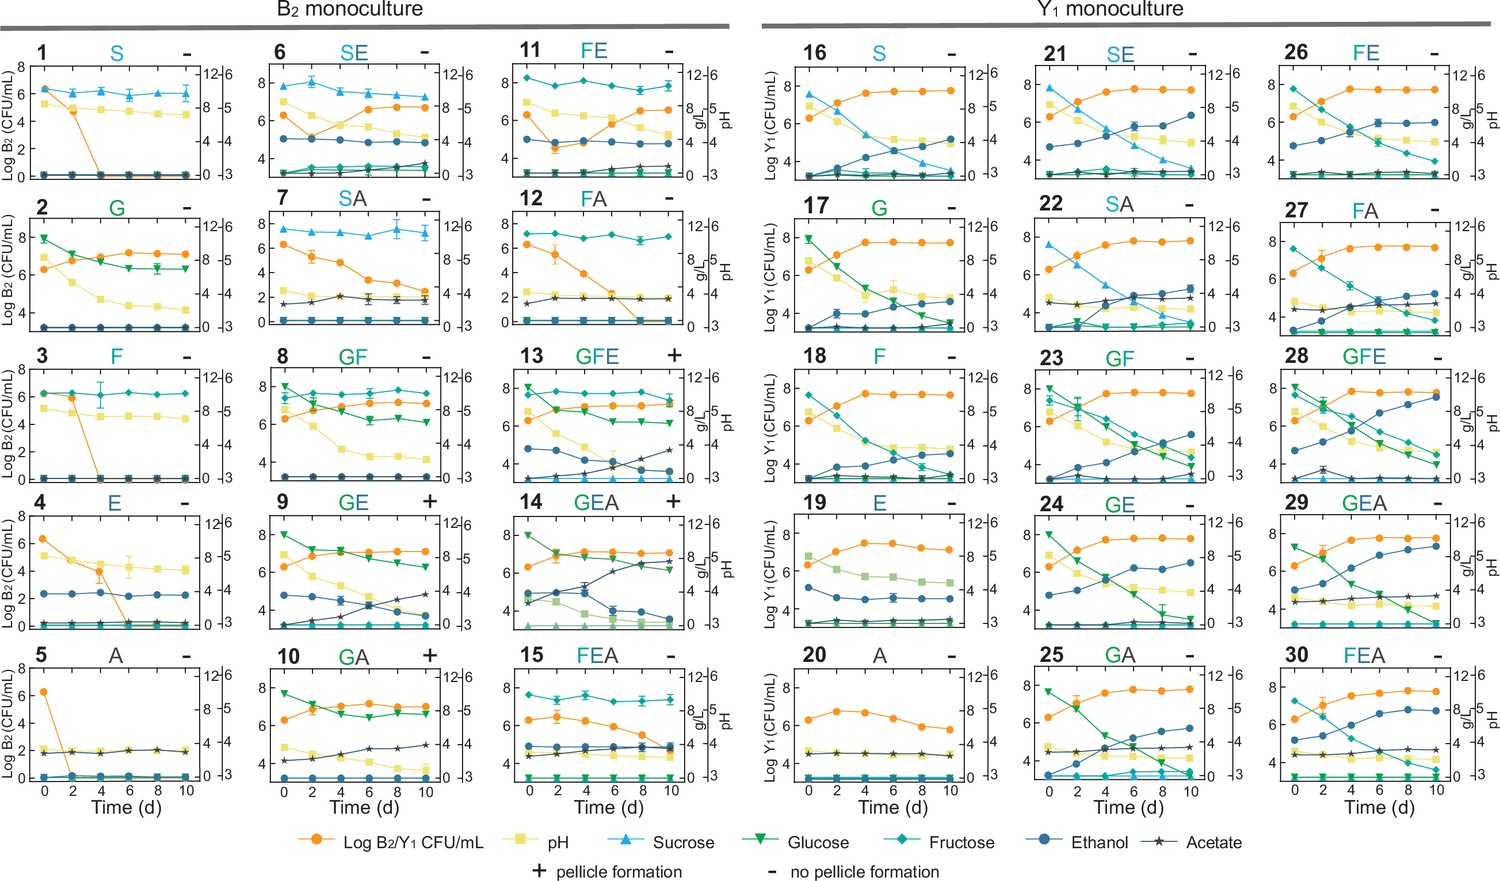
Comprehensive fermentation tests for the B2 and Y1 monocultures with different carbon sources.
Sucrose (abbreviated as S, 10 g/L), glucose (G, 10 g/L), fructose (F, 10 g/L), ethanol (E, 50 mL/L), and acetate (A, 2 g/L) were used alone or in combination for fermentation. The number on top left of each panel is the label of the experiment. The letters on top middle of each panel indicate specific carbon sources used in the corresponding experiment. The +or – sign on the top right indicates whether a pellicle was formed during the fermentation. Bars and error bars correspond to means and s.d.
-
Figure 4—source data 1
Counting and metabolic data of the B2 and Y1 monocultures.
- https://cdn.elifesciences.org/articles/76401/elife-76401-fig4-data1-v1.xlsx
Figure 4—figure supplement 1
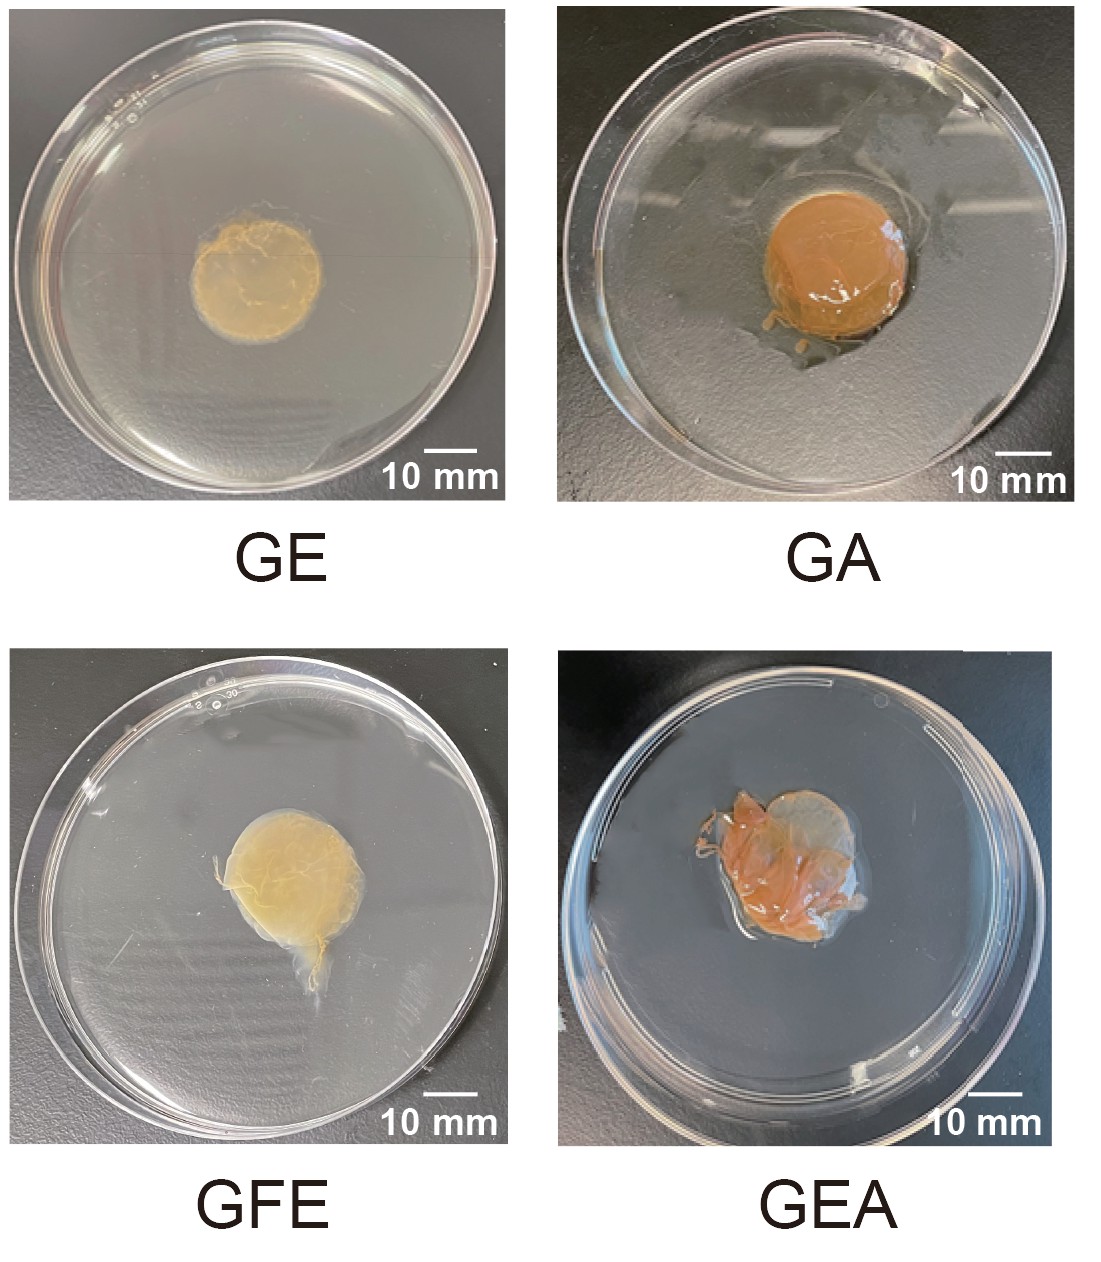
Images of pellicles formed by B2 monoculture with different carbon sources.
GE: glucose and ethanol; GA: glucose and acetate; GFE: glucose, fructose and ethanol; GEA: glucose, ethanol and acetate.
Figure 5 with 4 supplements
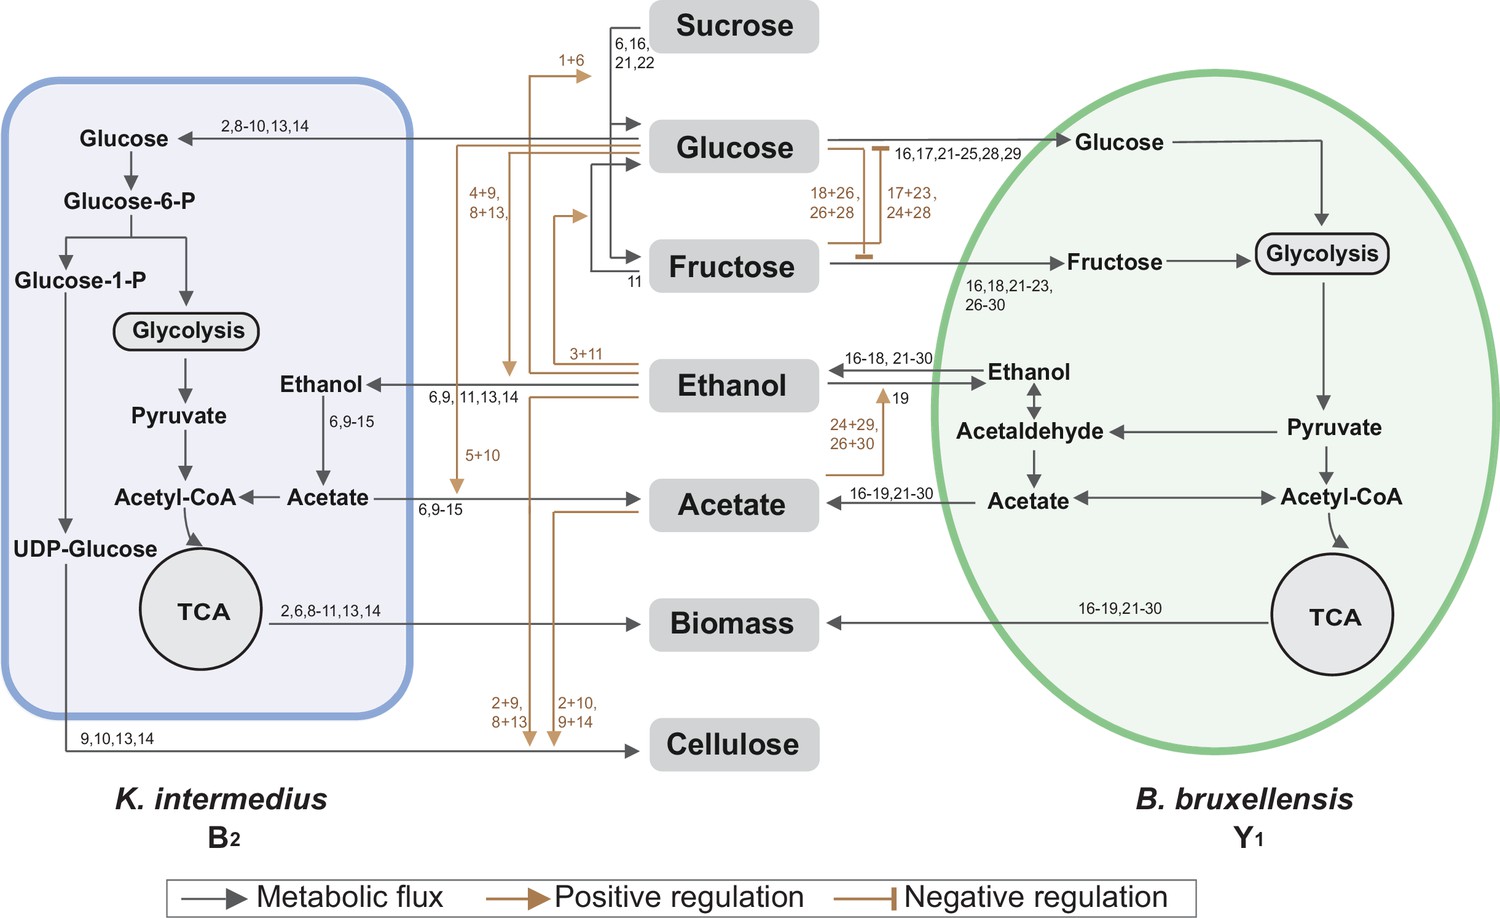
Summary of metabolic processes underlying the core.
Black arrows refer to metabolic fluxes while brown arrows correspond to positive or negative regulatory interactions. The numbers associated with each arrow are the corresponding fermentation assays in Figure 4 supporting the specific interaction.
Figure 5—figure supplement 1
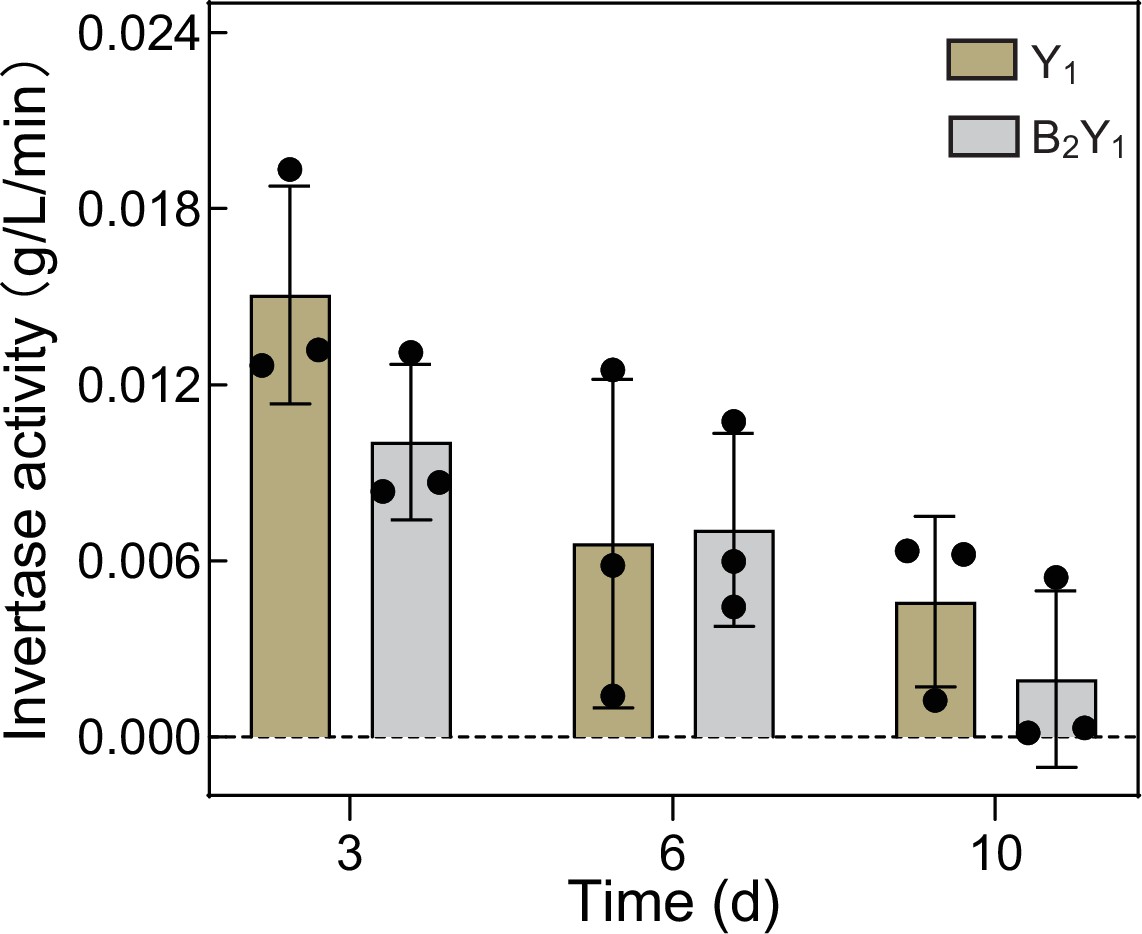
Sucrose invertase activity of Y1 monoculture and B2Y1 co-culture at different fermentation times.
The invertase activity is defined as the amount of sucrose reduction per minute for a given amount of yeast cells (inoculation amount: 1*106 CFU/mL). Bars and error bars correspond to means and s.d., respectively. T-test of paired samples in each time point did not show significant differences at p<0.05. (p=0.129732 on day 3; p=0.906200 on day 6; p=0.335084 on day 10.).
Figure 5—figure supplement 2
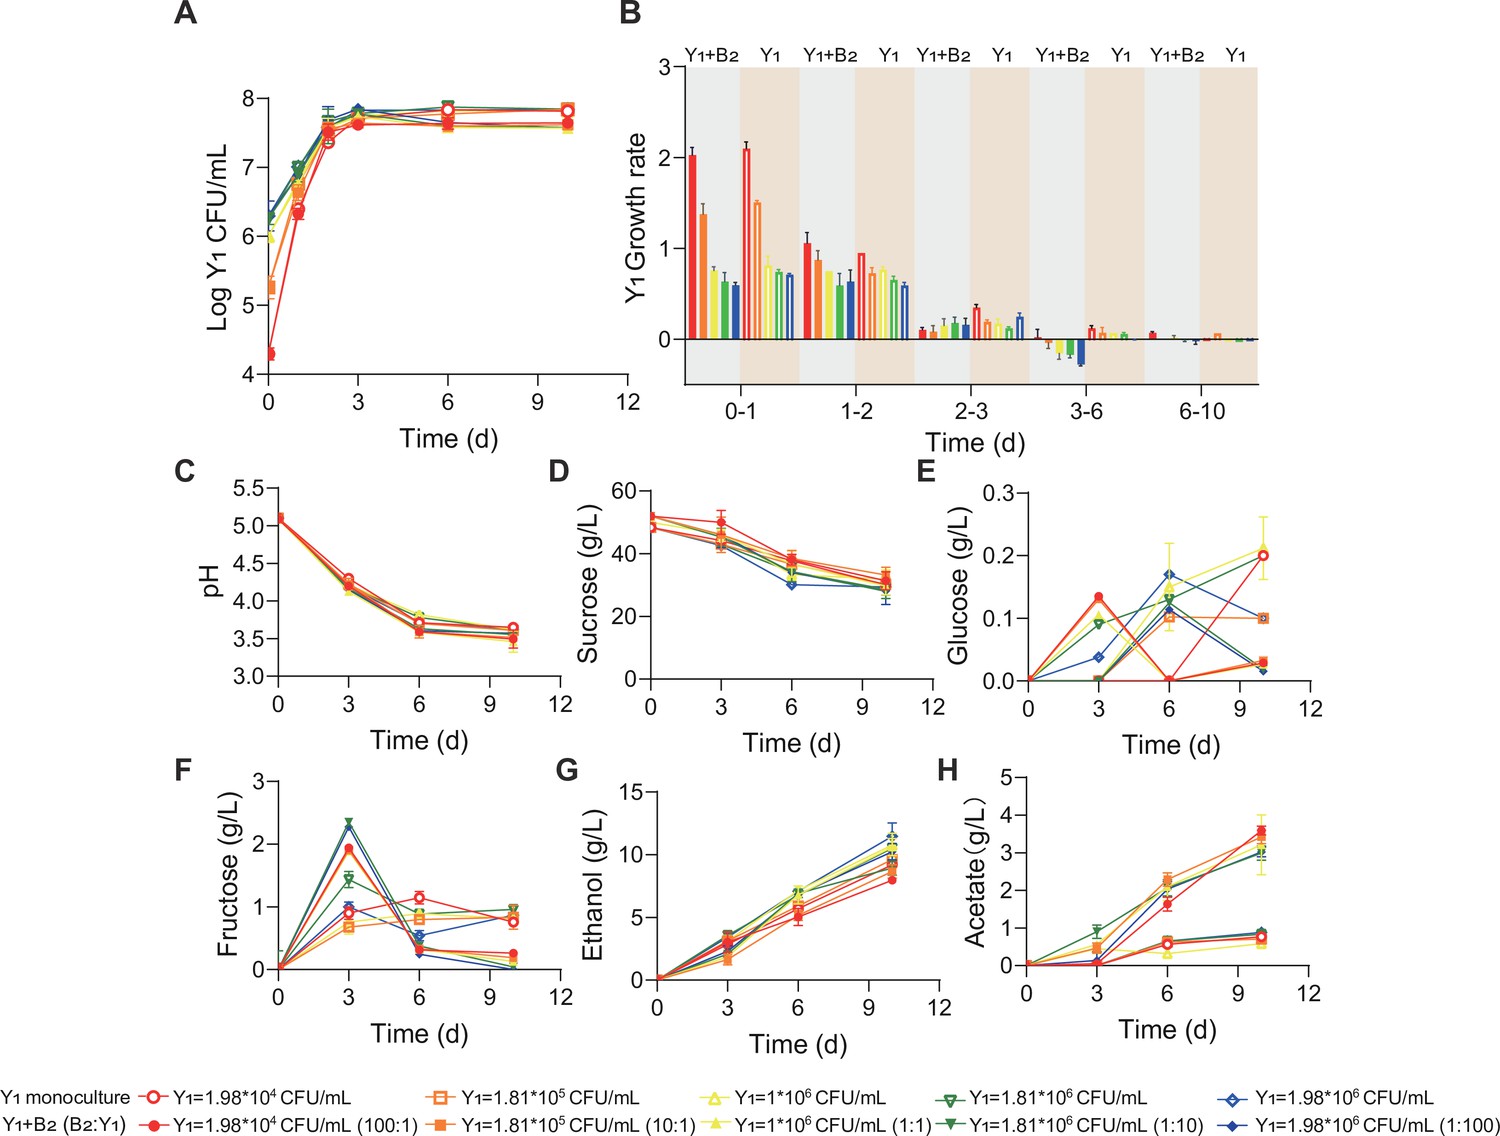
Comparation of the population and metabolic dynamics of Y1 monoculture and B2Y1 co-culture.
(A, B) Population (A) and growth rate (B) of Y1 in monoculture and in the B2Y1 co-culture. (C–H) pH, carbon sources and metabolites during the fermentations of the monoculture and the co-culture. Open and filled symbols correspond to the Y1 monoculture and the B2Y1 co-culture, respectively. For the co-culture, the total inoculation amount was fixed at 2*106 CFU/mL but the bacterium-yeast ratio was varied from 100:1 to 1:100. For the monoculture, the total bacterium population was varied in alignment with the bacterial population in the corresponding co-culture. Bars and error bars correspond to means and s.d., respectively.
Figure 5—figure supplement 3
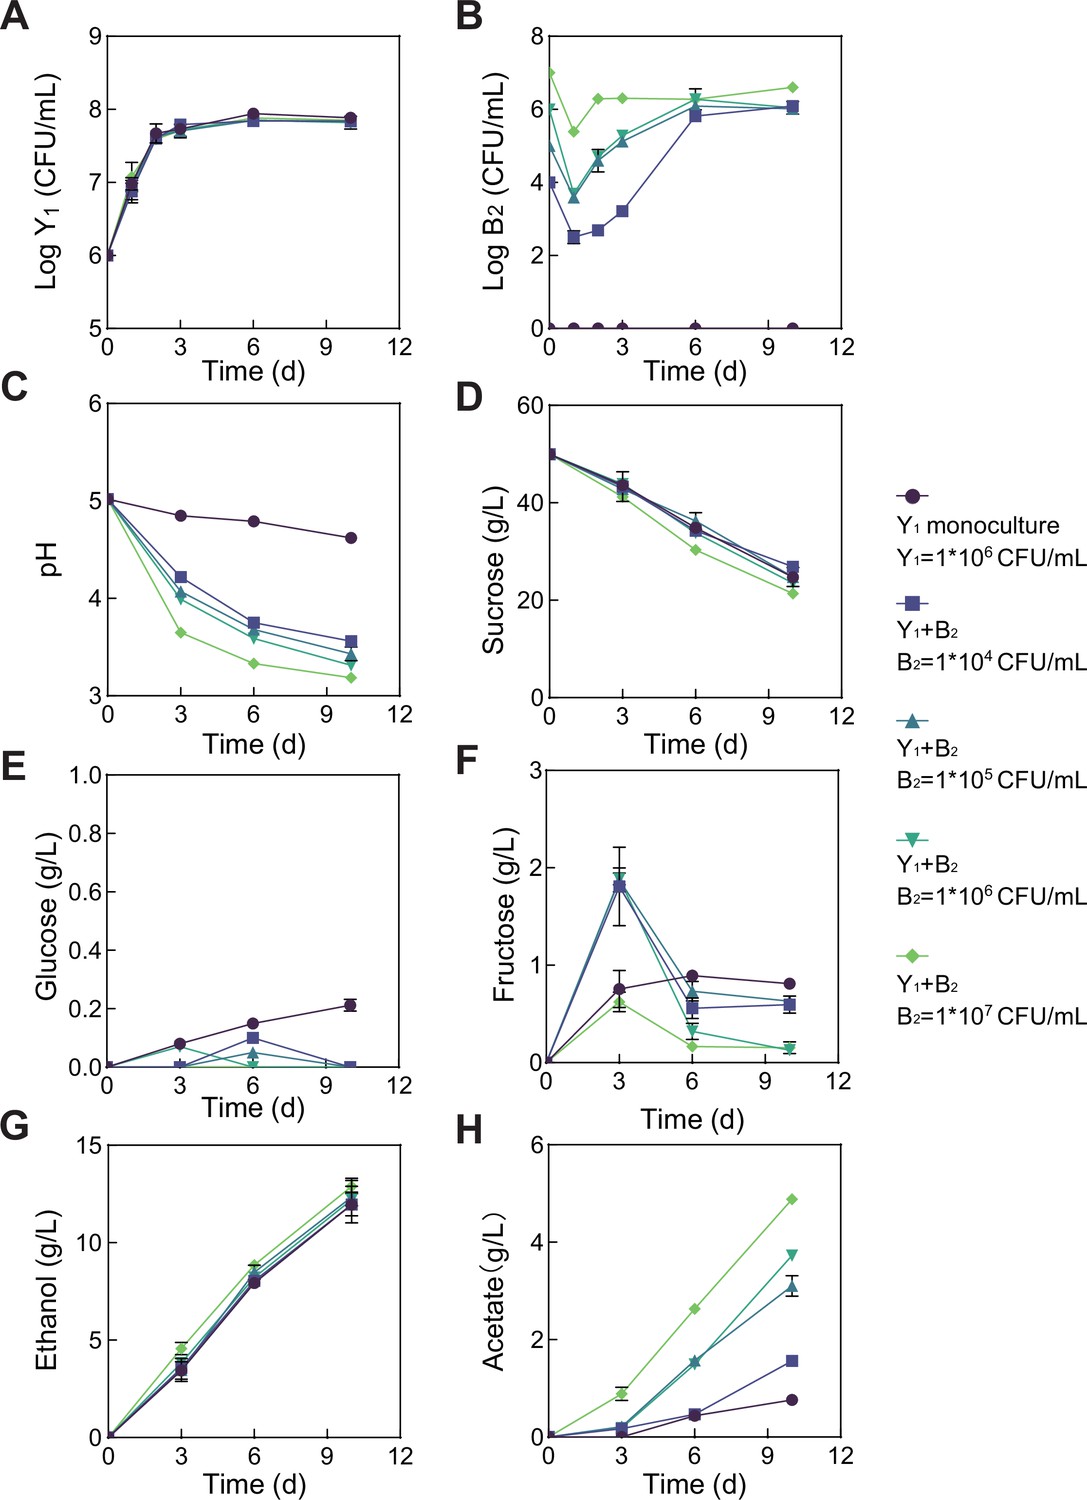
Population dynamics and metabolic profiles of the fermentations involving fixed Y1 and varied B2 initial abundances.
(A) Y1 population dynamics. (B) B2 population dynamics. (C–H) pH, carbon sources and metabolites during the fermentation. The initial Y1 inoculation was fixed as 1*106 CFU/mL but the B2 inoculation was varied from 0 to 1*104, 1*105, 1*106, and 1*107 CFU/mL. Bars and error bars correspond to means and s.d., respectively.
Figure 5—figure supplement 4
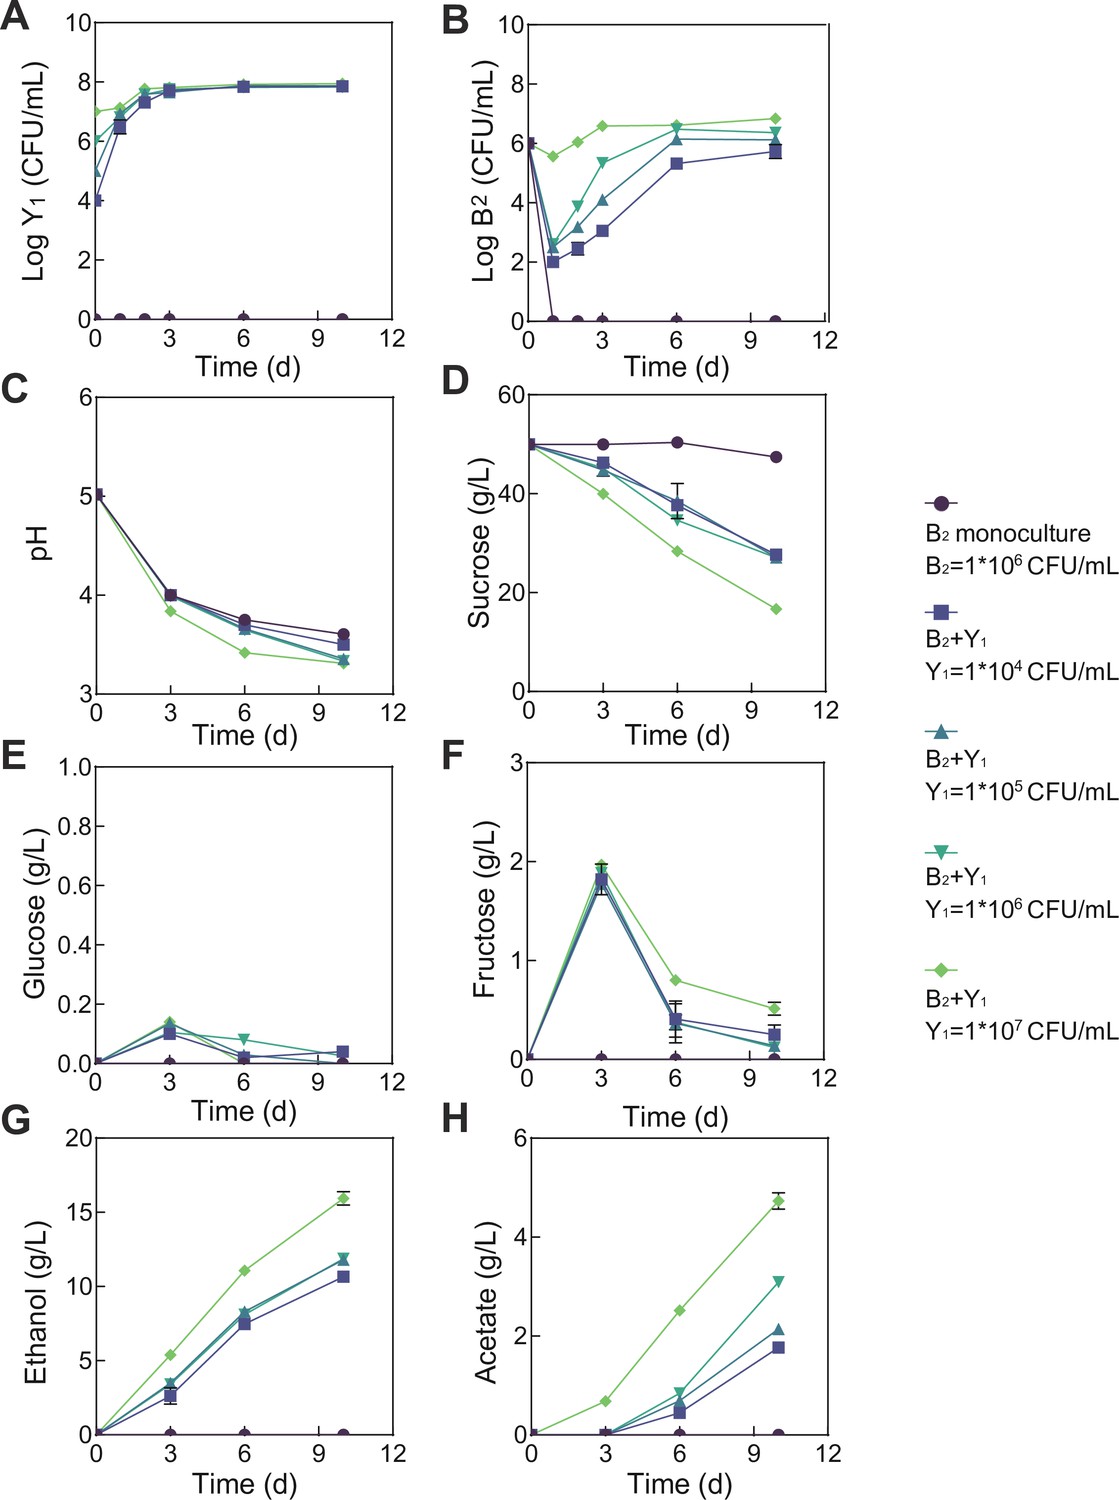
Population dynamics and metabolic profiles of the fermentations involving fixed B2 and varied Y1 initial abundances.
(A) Y1 population dynamics. (B) B2 population dynamics. (C–H) pH, carbon sources and metabolites during the fermentation. The initial B2 inoculation was fixed as 1*106 CFU/mL but the Y1 inoculation was varied from 0 to 1*104, 1*105, 1*106, and 1*107 CFU/mL. Bars and error bars correspond to means and s.d., respectively.
Figure 6 with 3 supplements
Fermentation by synthetic communities with increased complexity and altered conditions.
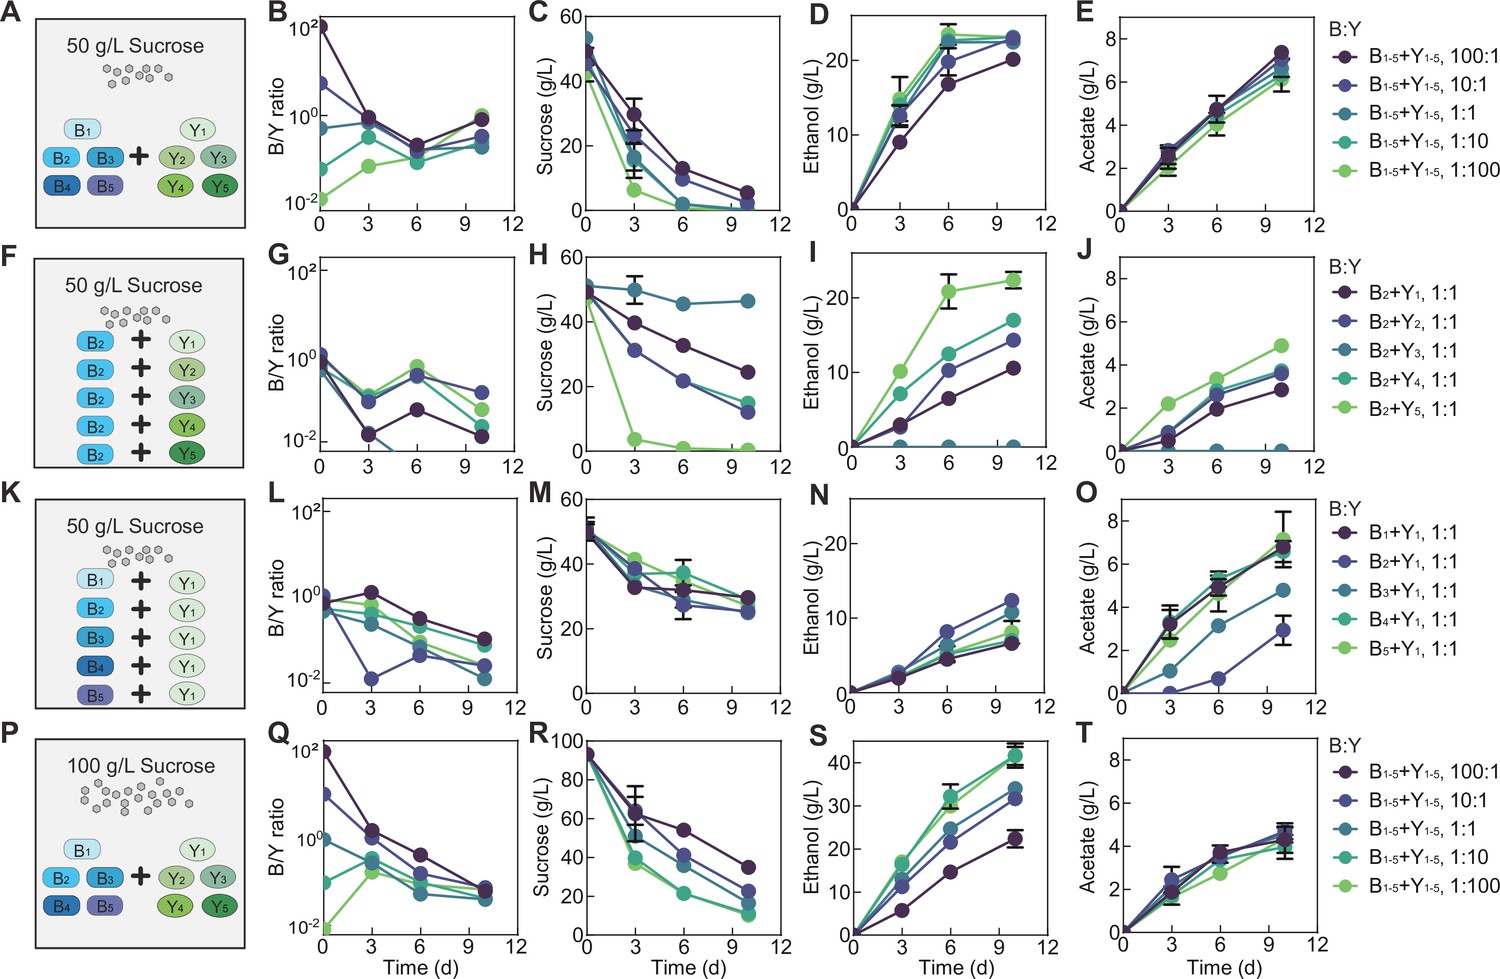
(A) Schematic illustration of a ten-species community involving B1-B5 and Y1-Y5 in a fermentation with 50 g/L of initial sucrose. (B–E) Population ratio (B), sucrose (C), ethanol (D), and acetate (E) throughout the course of the fermentation shown in (A). (F) Schematic illustration of 5 two-species communities with each involving B2 and one of the yeasts ( Y1-Y5) in a fermentation starting with 50 g/L sucrose. (G–J) Population ratio, sucrose, ethanol, and acetate during the fermentation illustrated in (F). (K) Schematic illustration of five two-species communities with each involving Y1 and one of the bacteria ( B1-B5) in a fermentation with 50 g/L of initial sucrose. (L–O) Population ratio, sucrose, ethanol and acetate during the course of fermentation illustrated in (K). (P) Schematic illustration of the ten-species community involving B1-B5 and Y1-Y5 in a fermentation starting with 100 g/L sucrose. (Q–T) Population ratio, sucrose, ethanol and acetate during the fermentation depicted in (P). Bars and error bars correspond to means and s.d.
-
Figure 6—source data 1
Counting and metabolic data of the ten-species communities.
- https://cdn.elifesciences.org/articles/76401/elife-76401-fig6-data1-v1.xlsx
-
Figure 6—source data 2
Counting and metabolic data of the two-species communities.
- https://cdn.elifesciences.org/articles/76401/elife-76401-fig6-data2-v1.xlsx
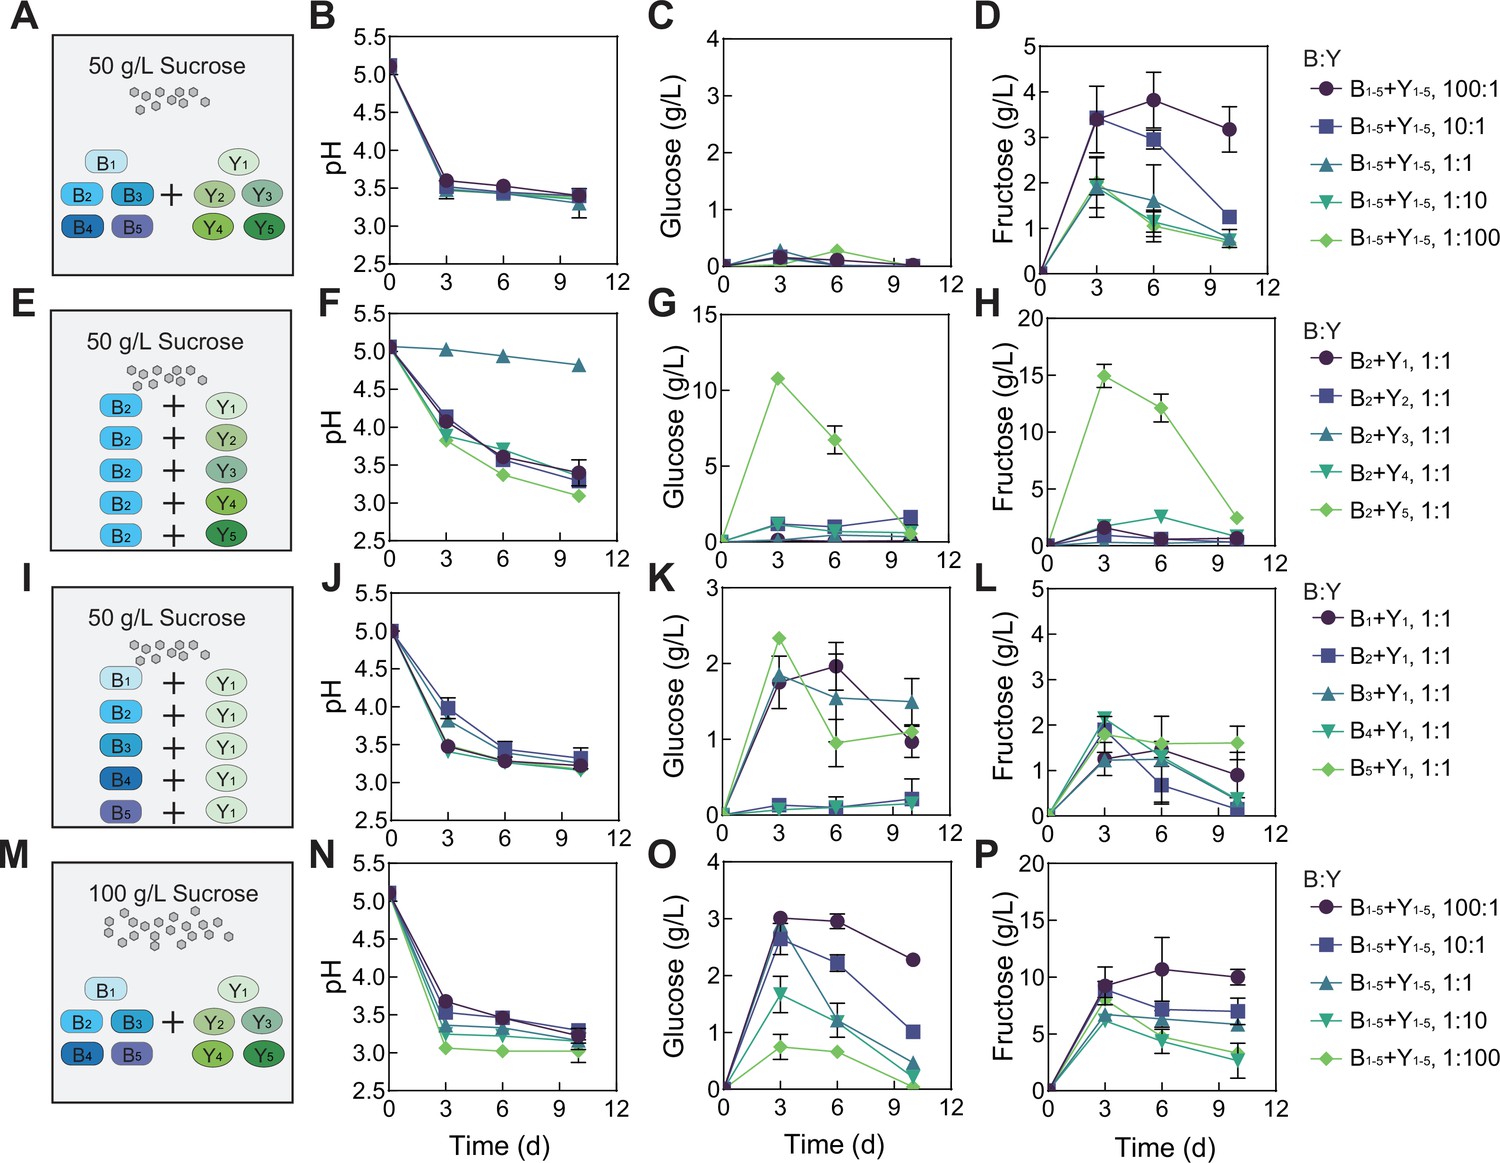
Figure 6—figure supplement 1
Fermentation by synthetic communities with increased complexity and altered conditions.
(A) Schematic illustration of a ten-species community involving B1-B5 and Y1-Y5 in a fermentation with 50 g/L of initial sucrose. (B–D) pH (B), glucose (C) and fructose (D) throughout the course of the fermentation shown in (A). (E) Schematic illustration of five two-species communities with each involving B2 and one of the yeasts (Y1-Y5) in a fermentation starting with 50 g/L sucrose. (F–H) pH, glucose and fructose during the fermentation illustrated in (E). (I) Schematic illustration of five two-species communities with each involving Y1 and one of the bacteria (B1-B5 B1–B5) in a fermentation with 50 g/L of initial sucrose. (J–L). pH, glucose and fructose during the fermentation illustrated in (I). (M) Schematic illustration of the ten-species community involving B1-B5 and Y1-Y5 in a fermentation starting with 100 g/L sucrose. (N–P) pH, glucose and fructose during the fermentation depicted in (M). Bars and error bars correspond to means and s.d., respectively.
Figure 6—figure supplement 2
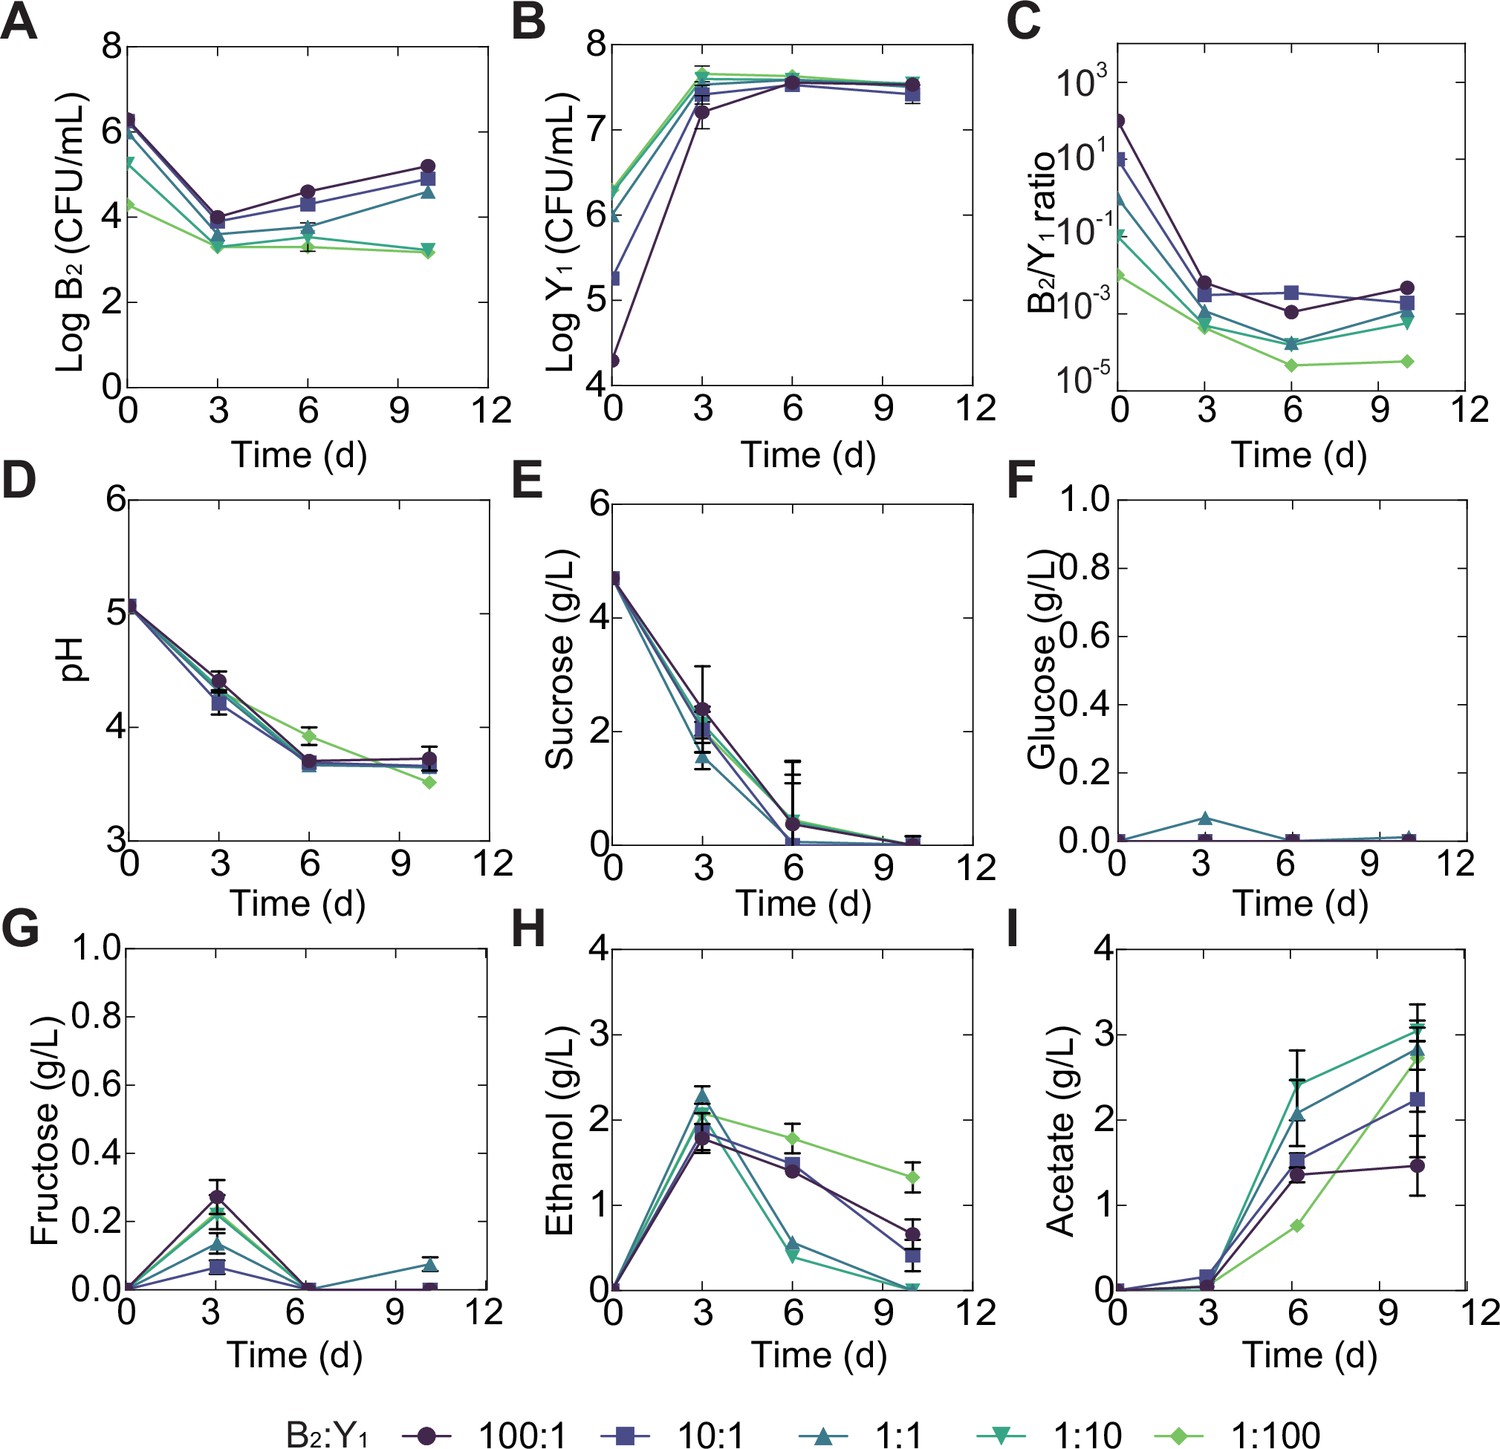
Temporal compositional and metabolic dynamics of the minimal core (B2Y1) during a fermentation with 5 g/L of initial sucrose.
(A, B) B2 (A) and Y1(B) population dynamics throughout the fermentation. (C) The B2-to-Y1 ratio in the fermentation. (D–I) pH, carbon sources and metabolites throughout the course of the fermentation. Bars and error bars correspond to means and s.d., respectively.
Figure 6—figure supplement 3
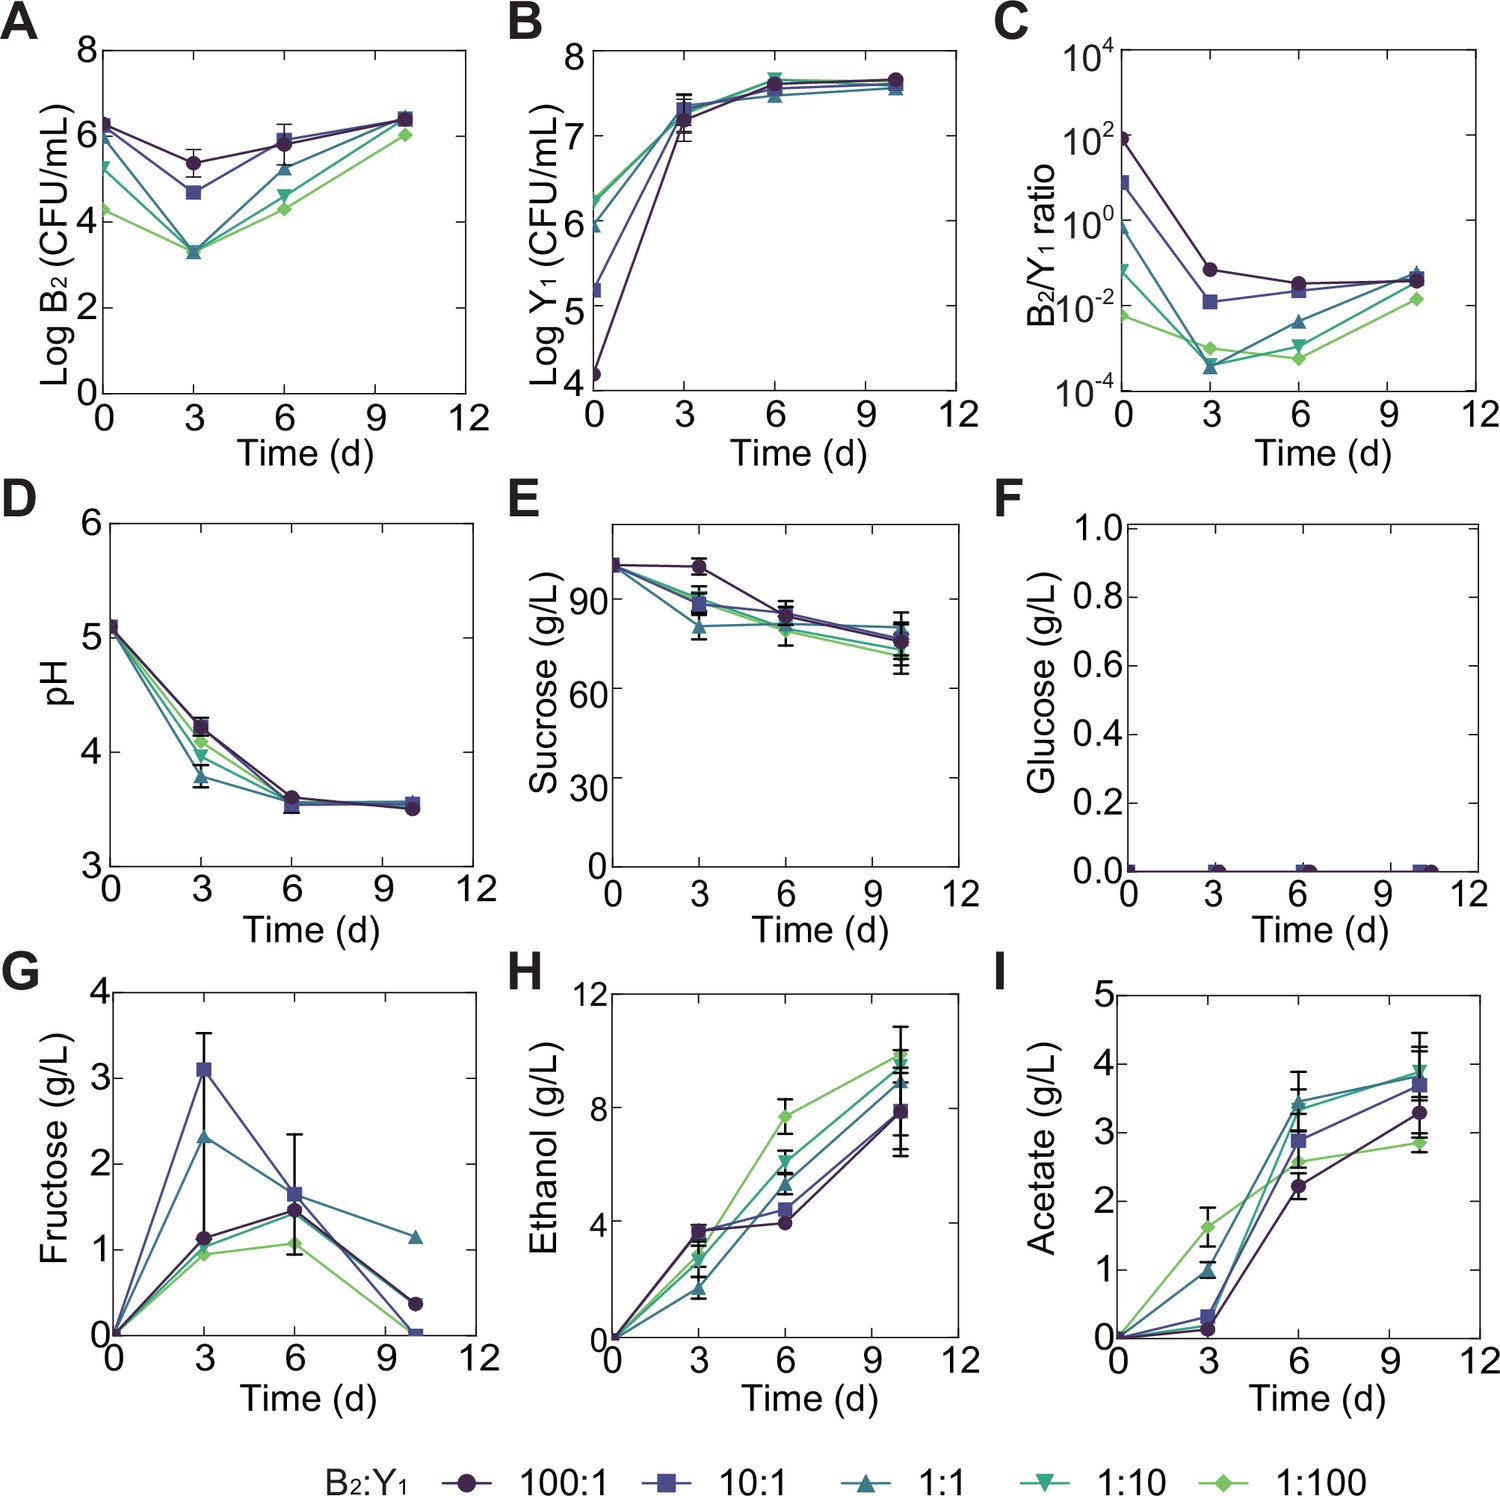
Temporal compositional and metabolic dynamics of the minimal core (B2Y1) during a fermentation with 100 g/L of initial sucrose.
(A, B) B2 (A) and Y1(B) population dynamics during the fermentation. (C) The B2-to-Y1 ratio in the fermentation. (D–I) pH, carbon sources and metabolites during the fermentation driven by the core. Bars and error bars correspond to means and s.d.
Figure 7

Summary of the overall concept and steps of our complexity-reduction approach for microbiome dissection.
Tables
Key resources table
| Reagent type (species) or resource | Designation | Source or reference | Identifiers | Additional information |
|---|---|---|---|---|
| Commercial assay or kit | Fecal/soil Microbe Miniprep kit | ZYMO | Cat No./ID:D6010 | |
| Commercial assay or kit | Gluconic acid Kit | Megazyme, Ireland | Cat No./ID:K-GATE | |
| Sequence-based reagent | B-f | Huang et al., 2021 | PCR Primer | Forward primer used for amplifying bacterial DNA for Sanger sequencing |
| Sequence-based reagent | B-r | Huang et al., 2021 | PCR Primer | Reverse primer used for amplifying bacterial DNA for Sanger sequencing |
| Sequence-based reagent | NL-1 | Coton et al., 2017 | PCR Primer | Forward primer used for amplifying yeast DNA for Sanger sequencing |
| Sequence-based reagent | NL-4 | Coton et al., 2017 | PCR Primer | Reverse primer used for amplifying yeast DNA for Sanger sequencing |
| Software, algorithm | Canoco | Microcomputer Power, Ithaca, NY | Version 5.0 | |
| Software, algorithm | SIMCA | Umetricus, Sweden | Version 14.1 |
Additional files
Download links
A two-part list of links to download the article, or parts of the article, in various formats.
Downloads (link to download the article as PDF)
Open citations (links to open the citations from this article in various online reference manager services)
Cite this article (links to download the citations from this article in formats compatible with various reference manager tools)
A systematic, complexity-reduction approach to dissect the kombucha tea microbiome
eLife 11:e76401.
https://doi.org/10.7554/eLife.76401


