Amoeboid-like migration ensures correct horizontal cell layer formation in the developing vertebrate retina
- Max Planck Institute of Molecular Cell Biology and Genetics, Germany
- Biotechnology Center, Center for Molecular and Cellular Bioengineering, Technische Universität Dresden, Germany
- Max Planck Institute for the Science of Light and Max-Planck-Zentrum für Physik und Medizin, Germany
- Physics of Life, Technische Universität Dresden, Germany
- Instituto Gulbenkian de Ciência, Rua da Quinta Grande 6, Portugal
Figures
Figure 1 with 1 supplement
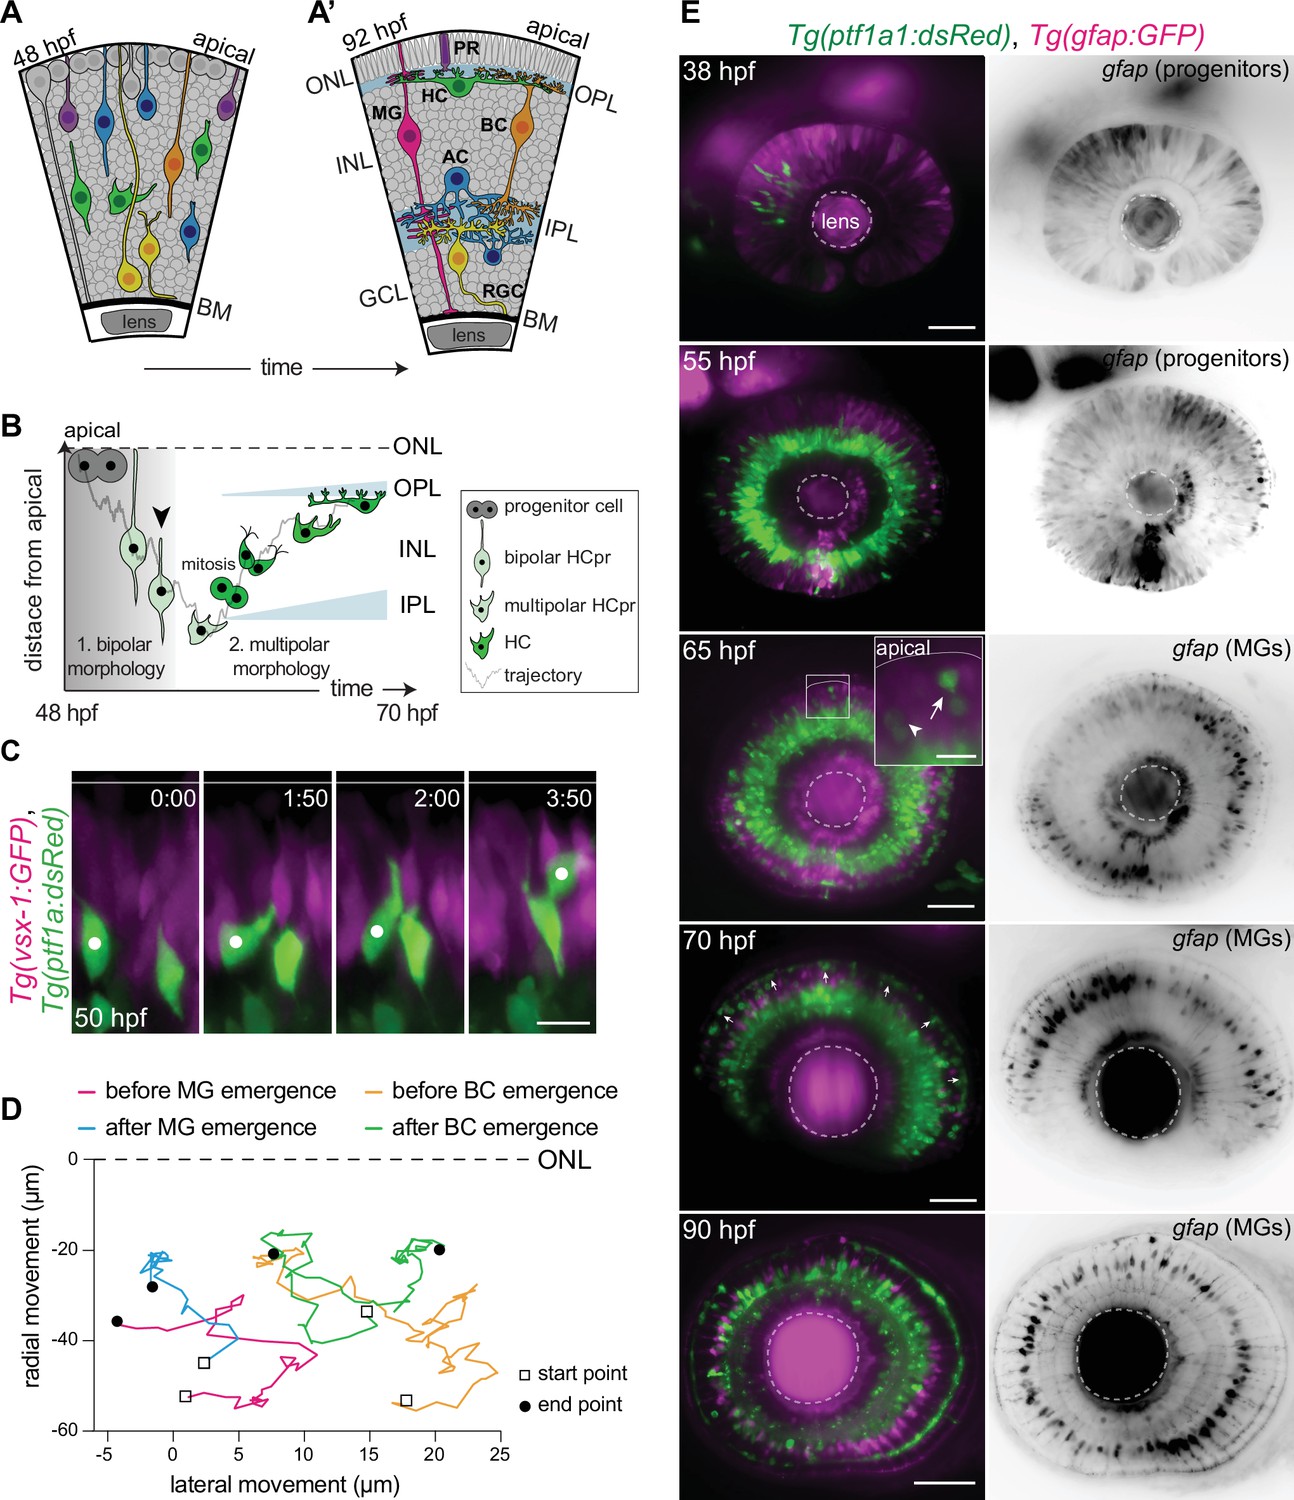
Migrating horizontal cells (HCs) do not use radially oriented Müller glia (MGs) or bipolar cells (BCs) for guidance.
(A–A’) Schematic representation of zebrafish retinal development: (A) Neuronal birth and migration (48 hours post fertilization [hpf]). Neuroepithelial progenitors (gray) divide at the apical side and give birth to five major neuron types:photoreceptor (PR), HC, bipolar cell (BC), amacrine cell (AC), retinal ganglion cell (RGC). (A’) The layered organization of the mature zebrafish retina (92 hpf). Retinal neurons and a single type of retina glial cell, MGs, are arranged in three nuclear layers from apical to basal: outer nuclear layer (ONL), inner nuclear layer (INL), ganglion cell layer (GCL). These layers are separated by two plexiform layers: outer plexiform layer (OPL) and inner plexiform layer (IPL). The basement membrane (BM) separates the GCL from the vitreous body. (B) Scheme of bidirectional and bimodal migration of an HC progenitor and its committed precursors. Division of neuroepithelial progenitor (gray) generates HC progenitors (HCprs) (light green). HCprs display a bipolar morphology and are attached to the apical surface during the first phase of migration. Upon apical detachment, HCprs show multipolar morphology. En route to their destination, multipolar HCprs undergo a terminal mitosis to generate two HCs (green), which migrate toward the HC layer. Arrowhead: detachment of HCpr from the apical surface and onset of multipolar migration. Gray line: a representative HC migration trajectory (see also stills and trajectory in Figure 1—figure supplement 1A-B). (C) Time-lapse of HC tangential migration before BC lamination (50 hpf). Tg(vsx-1:GFP) labels BCs (magenta) and Tg(ptf1a:DsRed) marks HCs (green). White dot: tracked HC. Time in h:min. Scale bar: 10 μm. (D) Basal-to-apical migration trajectories of HCs before and after emergence of mature radially oriented BCs and MGs. HCs use both radial (apical-basal) and tangential (lateral) routes to move within the INL. See Figure 1—source data 1. (E) Maximum projections of retinae at different developmental stages: 38, 55, 65, 70, and 90 hpf. Tg(ptf1a:dsRed) labels HCs and ACs (green) and Tg(gfap:GFP) labels MGs (magenta). 38 hpf: birth and initiation of HC basal migration. GFAP+ cells are progenitors. 55 hpf: initiation of HC apical migration. 65 hpf: peak of HC apical migration. Higher magnification inset of the outlined region shows an HC at its final destination (arrow), and a migrating HC en route to the apical side (arrowhead). 70 hpf: emergence of the HC layer and MG maturation. arrows: show HCs within the HC layer. 90 hpf: mature and fully laminated retina. Scale bars: 50 μm, inset 65 hpf: 10 μm. See also Figure 1—figure supplement 1.
-
Figure 1—source data 1
HC migration trajectories.
Figure 1D; Figure 1—figure supplement 1 -Panel B.
- https://cdn.elifesciences.org/articles/76408/elife-76408-fig1-data1-v2.xlsx
Figure 1—figure supplement 1
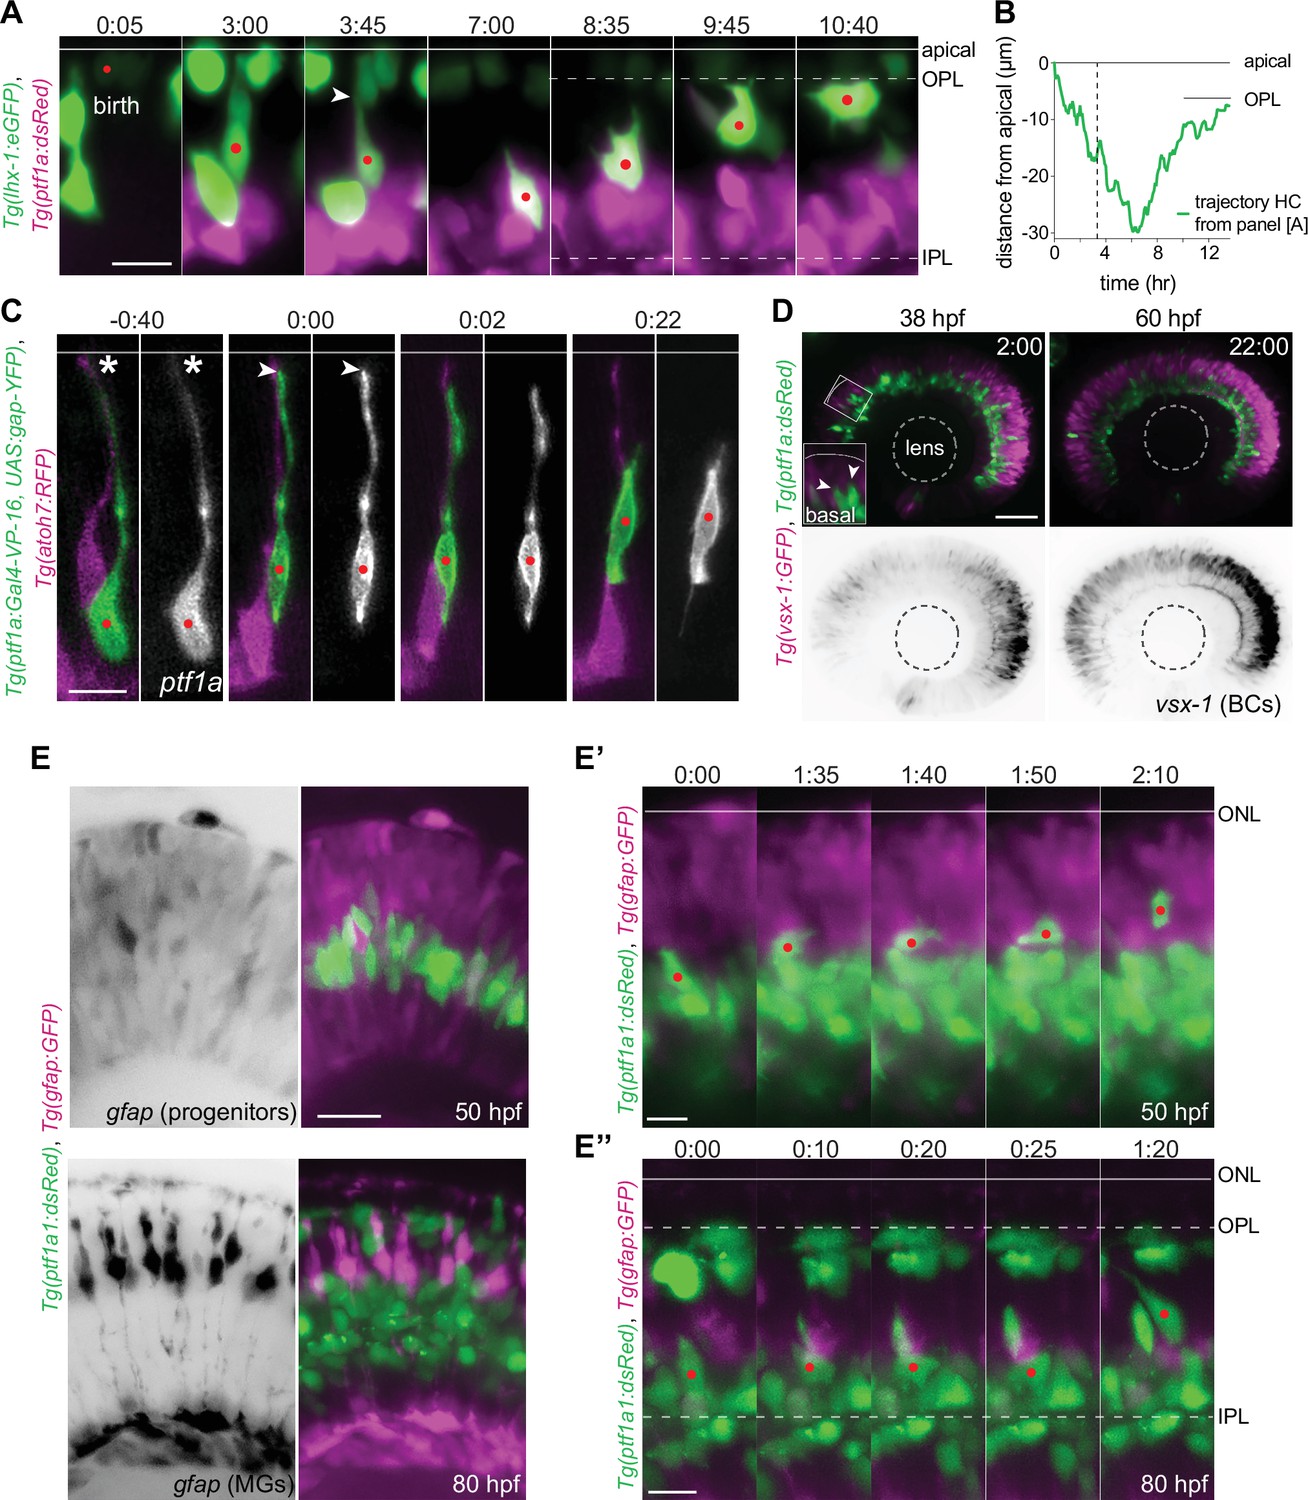
HC migration features are independent of radially oriented cells in the retina.
(A) Montage of bidirectional migration of a horizontal cell (HC) from birth to final positioning. Tg(lhx-1:eGFP) labels HCs (green), Tg(Ptf1a:dsRed) marks amacrine cells (ACs) and HCs (magenta). Red dot: tracked HC; arrowhead: HC detachment from the apical surface (line). Scale bar: 10 µm. Frames from Video 1. (B) Trajectory of a migrating HC (depicted in A) from birth to terminal position relative to the apical surface (0 µm). See Figure 1—source data 1. (C) Retraction of HC apical attachment. Tg(ptf1a:Gal4-VP-16, UAS:gap-YFP) labels membrane of HCs (green), and Tg(atoh7:RFP) labels membranes of photoreceptors (PRs) and retinal ganglion cells (RGCs) (magenta). The tracked HC was monitored until it reached the HC layer. Red dot: tracked HC; asterisk: apical attachment; arrowhead: tip of the retracted attachment; line: apical surface. Scale bar: 10 µm. (D) Stills from time-lapse images of a retina before (38 hours post fertilization [hpf]) and after (60 hpf) BC lamination. Tg(ptf1a:dsRed) labels HCs and ACs (green), Tg(vsx1:GFP) marks BCs (magenta). Scale bar: 50 μm. Higher magnification inset of the outlined region shows two HCs moving apically (arrowheads). (E–E”) HCs do not migrate along radially oriented progenitors or MGs. Tg(Ptf1a:dsRed) marks ACs and HCs (green), Tg(gfap:GFP) labels MGs (magenta). (E) Top: Prior to MG generation (50 hpf). GFAP+ cells are neurogenic progenitors. Bottom: Mature bipolar MG morphology (80 hpf). Scale bar: 20 µm. (E’) Montage of an HC migrating perpendicular to GFAP+ progenitors in 50 hpf. GFAP+ cells are neurogenic progenitors. (E’’) Stills of an HC migrating perpendicular to mature MGs in 80 hpf. Scale bar: 10 µm. Line: apical surface; red dot: migrating HC; dotted line: OPL (top), IPL (bottom). Time in h:min (A, C, D, E’–E’’).
Figure 2 with 1 supplement

The inner nuclear layer (INL) is a densely packed tissue not dominated by extracellular matrix (ECM).
(A–B) The INL is not dominated by ECM: (A) Tg(lhx-1:eGFP) labels horizontal cells (HCs) (green). Laminin α1 antibody marks laminin (magenta). (B) Tg(ptf1a:dsRed) marks HCs and amacrine cells (ACs) (green). Tg(HA:GFP) labels hyaluronic acid (HA) (magenta). Higher magnification insets show enrichment of anti-Laminin α1 and HA in the basement membrane (BM) (red arrowheads). Scale bars: 50 μm; insets 10 μm. (C–C’) Scheme of structural organization of the retina during development: (C) During HC migration at 48 hours post fertilization (hpf); (C’) after HC layer formation at 70 hpf. HCs (green); photoreceptors (PRs) and retinal ganglion cells (RGCs) (magenta). (D–E”) Brillouin shift maps (right) and their corresponding confocal images (left) of double-transgenic zebrafish of (D–D’’) retina 1 and (E-E’’) retina 2. Top: 48 hpf, and bottom: 70 hpf. Tg(lhx-1:eGFP) labels HCs and ACs (green), Tg(atoh7:RFP) is expressed in RGCs and PRs (magenta). Confocal images were obtained directly after the Brillouin shift measurements. The corresponding Brillouin shift maps of the nuclear layers (outer nuclear layer [ONL], inner nuclear layer [INL], ganglion cell layer [GCL]) show a higher Brillouin shift than the plexiform layers (outer plexiform layer [OPL], inner plexiform layer [IPL]) at 70 hpf. Red dashed boxes in D–E: imaged regions. Scale bar: 10 µm. See also Figure 2—figure supplement 1.
Figure 2—figure supplement 1
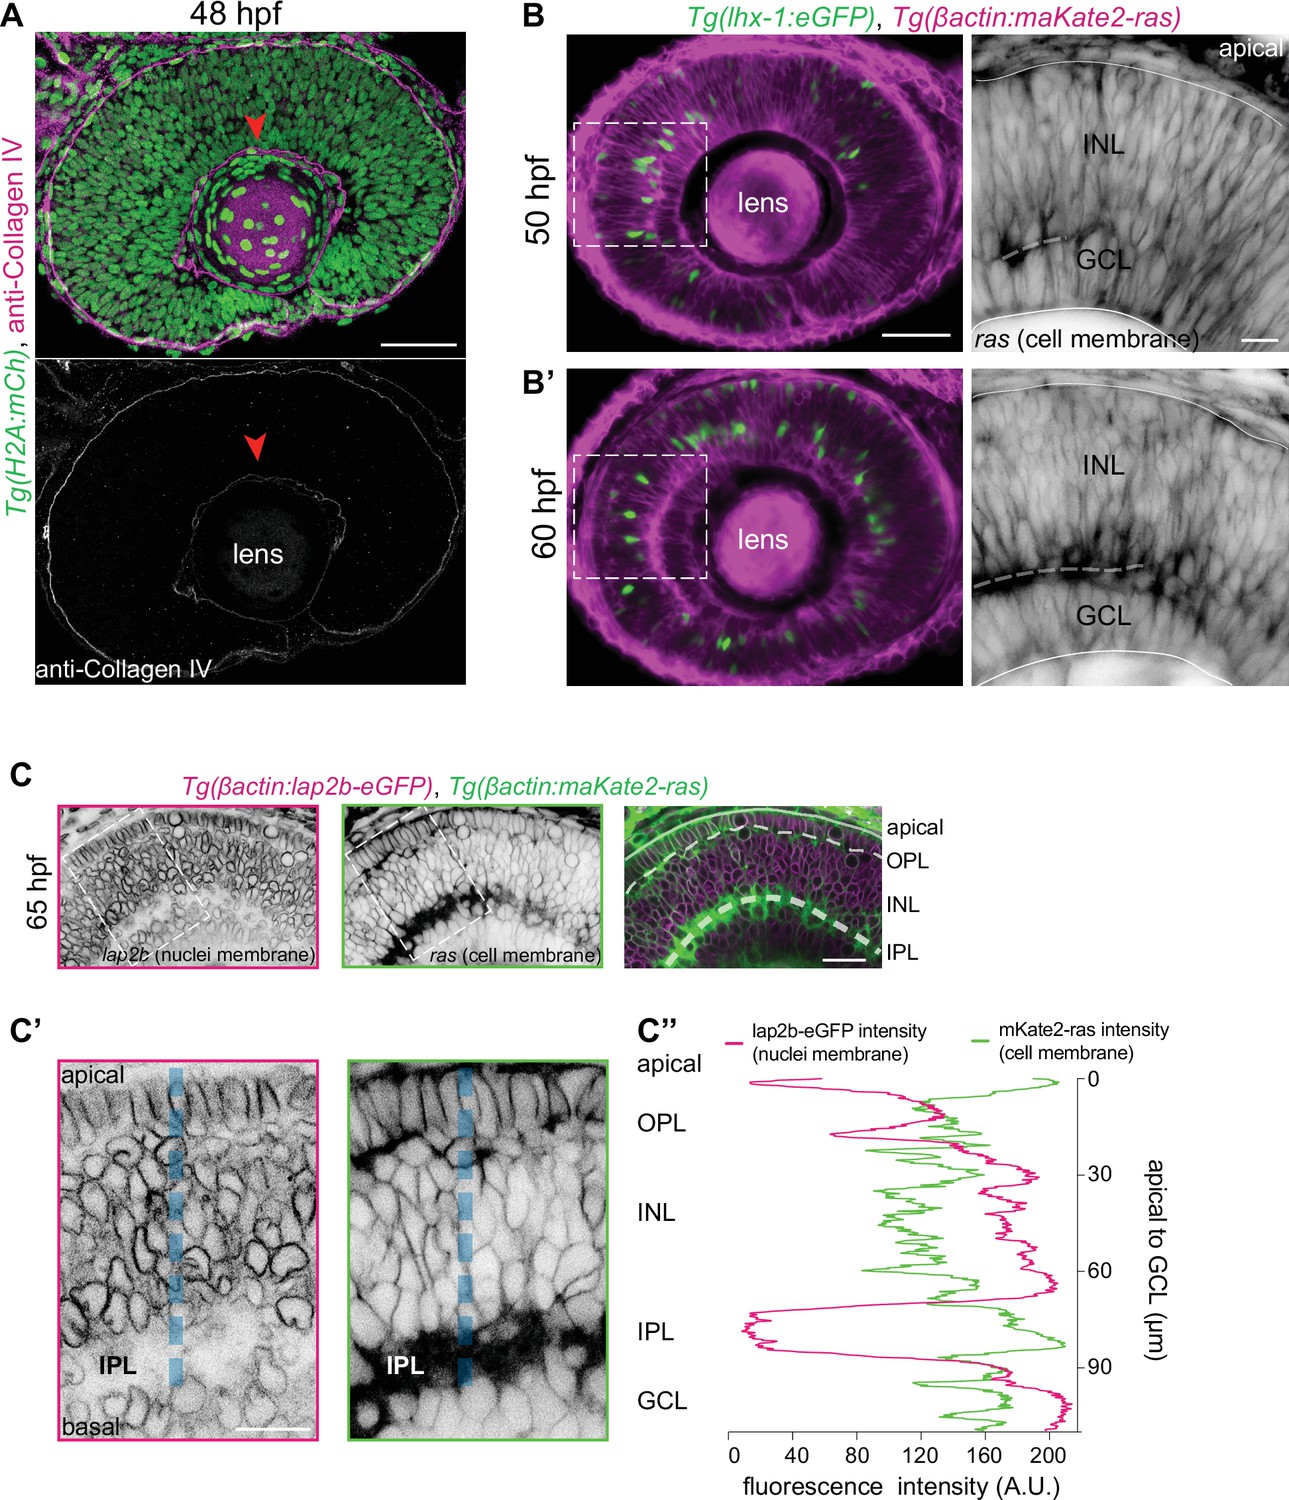
No collagen is found in the densely packed INL.
(A) Immunofluorescence image of a 48 hours post fertilization (hpf) retina.Tg(h2a:mCh) labels all retinal nuclei (green), and collagen antibody marks collagen type IV (magenta). Bottom panel: Higher magnification inset of the retina show anti-collagen IV (gray). Red arrowhead: basement membrane. Scale bar: 50 μm. (B–B’) Stills from time-lapse of a retina at 50 hpf (B) and 60 hpf (B’). Tg(lhx-1:eGFP) labels HCs (green), Tg(βactin:maKate2-ras) marks cell membranes of all retinal cells (magenta). Scale bar: 50 µm. Right panels: Higher magnification insets of the outlined regions show cell membranes (gray). Dashed line: forming inner plexiform layer (IPL). Scale bar: 10 μm. (C) Confocal sections of Tg(βactin:lap2b-eGFP) labeling nuclear envelopes of all retinal cells (magenta), and Tg(βactin:maKate2-ras) labeling membranes of all retinal cells (green) at 65 hpf. Scale bar: 20 µm. (C’) Higher magnification insets of the outlined region showing nuclear envelopes (left panel) and cell membranes (right panel). Blue dashed line: region for intensity profile measurement in C”. Scale bar: 10 μm. (C’’) Line scan average fluorescent intensity profiles of βactin:lap2b-eGFP (magenta) and βactin:maKate2-ras (green) along the blue dashed line. See Figure 2—source data 1.
Figure 3 with 2 supplements
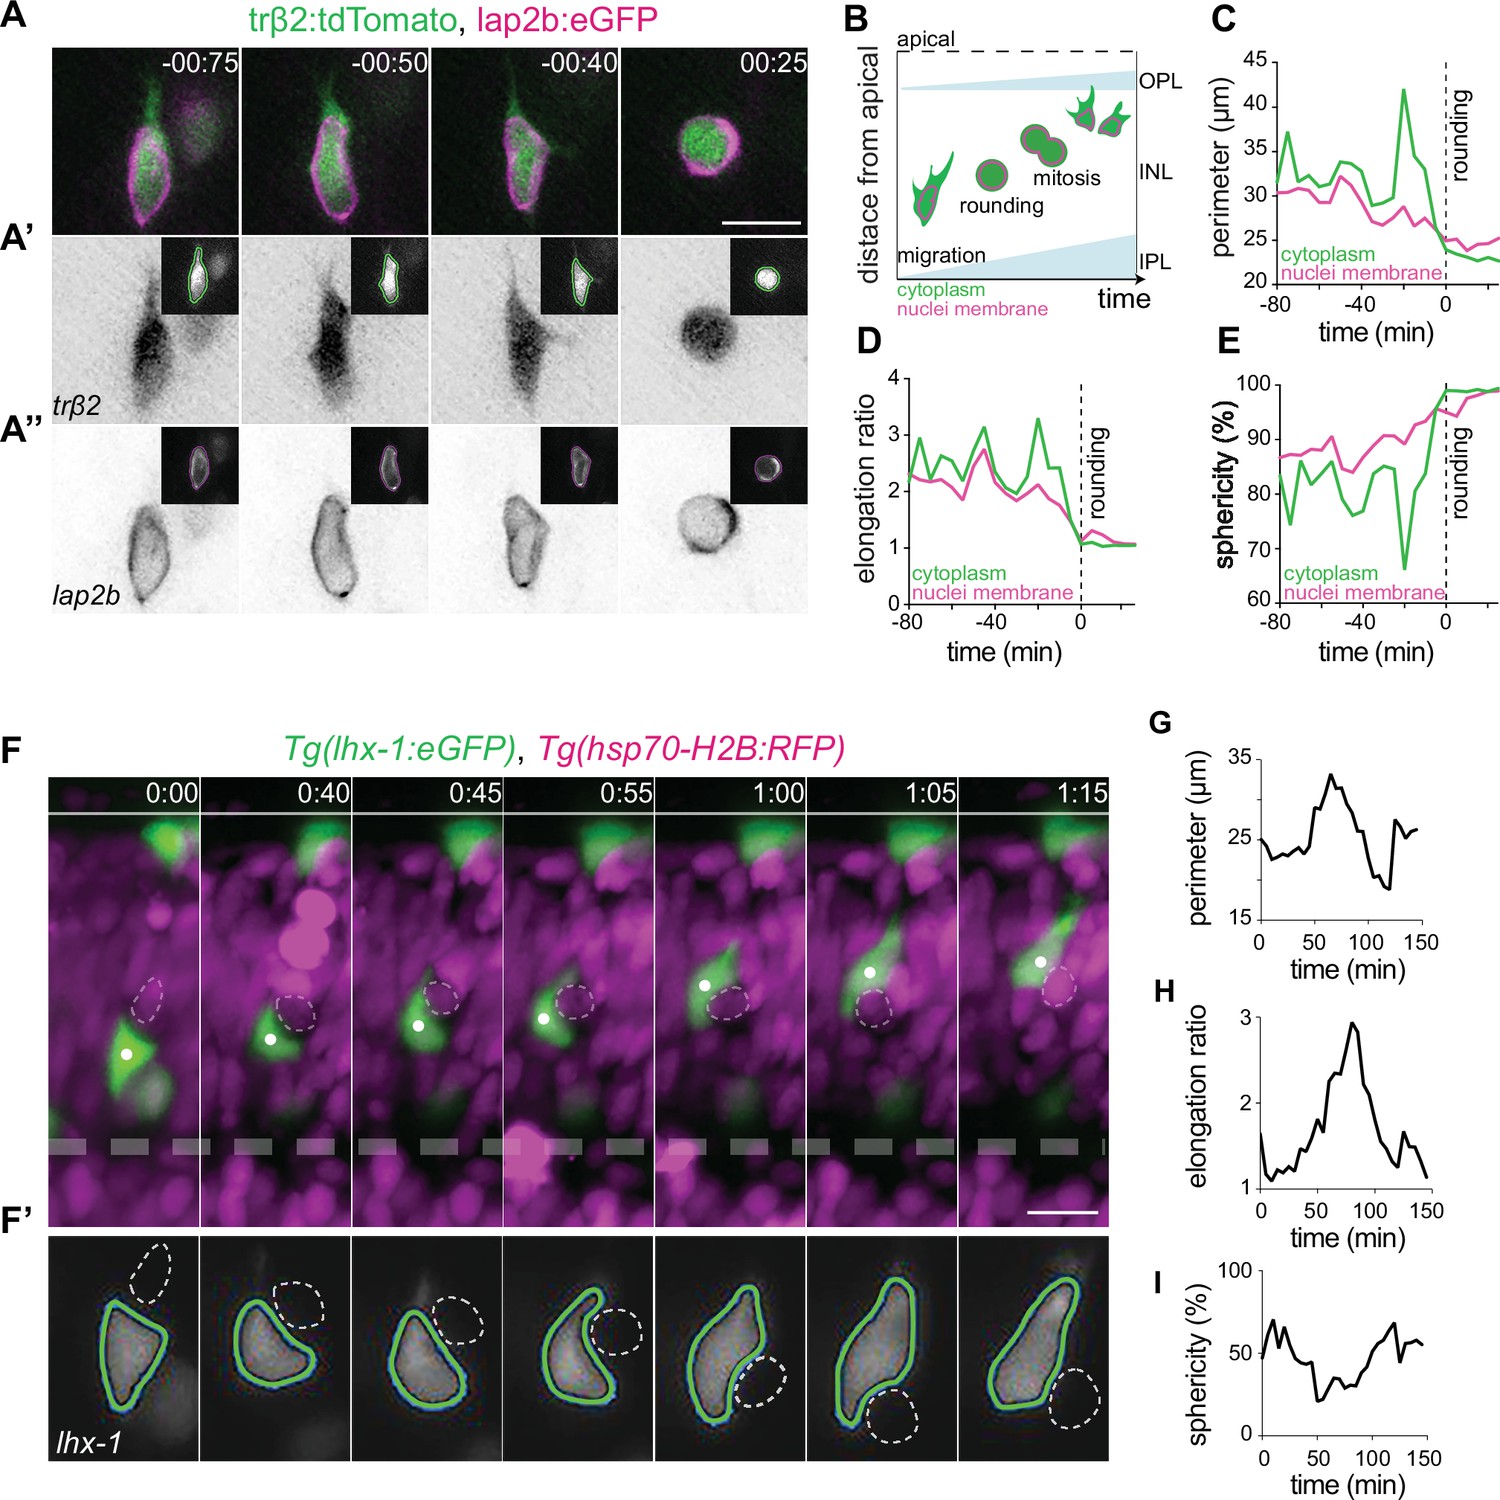
Horizontal cells undergo cell and nuclear deformations as they migrate through the crowded inner nuclear layer (INL).
(A–E) The cell bodies and nuclei of migrating horizontal cells (HCs) are deformable. (A) Time-lapse of an HC during migration and at entry into mitosis. The HC cell body is visualized by trβ2:tdTomato (green), and its nuclear envelope by lap2b:eGFP (magenta) DNA constructs. Insets show the corresponding segmented contours of the tracked HC’s generated by Icy: (A’) cell body (green lines) and (A’’) nucleus (magenta lines) which were used to extract cellular and nuclear morphodynamic features in (C–E). Scale bar: 10 µm. (B) Schematic representation of a typical basal-to-apical migration trajectory of an HC progenitor which undergoes mitosis en route. During mitosis, HCs switch from an elongated shape into a spherical morphology. (C–E) Graphs show quantification of the dynamics of the cell and nucleus shape changes of the migrating HC depicted in (A): (C) perimeter (μm), (D) elongation ratio, and (E) sphericity (%). Note that the minimal perimeter (μm), minimal elongation ratio, and maximal sphericity (%) are reached upon cell rounding during mitosis. Dashed lines: onset of HC rounding. See Figure 3—source data 1. (F–I) Migrating HCs squeeze in the crowded retina to overcome local physical obstacles. (F) Stills from light-sheet time-lapse imaging show that the migrating HC (green) undergoes cell-shape deformations to circumvent a mitotic neighboring cell (dashed circle). Tg(lhx-1:eGFP) labels HCs (green), Tg(hsp70-H2B:RFP) marks nuclei of all retinal cells (magenta). White dot: tracked HC; line: apical surface; dashed line: inner plexiform layer (IPL). Scale bar: 20 µm. (F’) The automated segmented contours of the cell body of the migrating HC (green line) generated by Icy. Dashed circle: the nucleus of the neighboring cell from (F). (G–I) Graphs represent quantifications of cell morphodynamic changes in HC from (F–F’): (G) perimeter (μm), (H) elongation ratio, and (I) sphericity (%). Time in h:min (A, F). See Figure 3—source data 1. See also Figure 3—figure supplements 1 and 2.
-
Figure 3—source data 1
Figure 3 Panel D-E; and G-I.
- https://cdn.elifesciences.org/articles/76408/elife-76408-fig3-data1-v2.xlsx
-
Figure 3—source data 2
- https://cdn.elifesciences.org/articles/76408/elife-76408-fig3-data2-v2.xlsx
-
Figure 3—source data 3
- https://cdn.elifesciences.org/articles/76408/elife-76408-fig3-data3-v2.xlsx
Figure 3—figure supplement 1
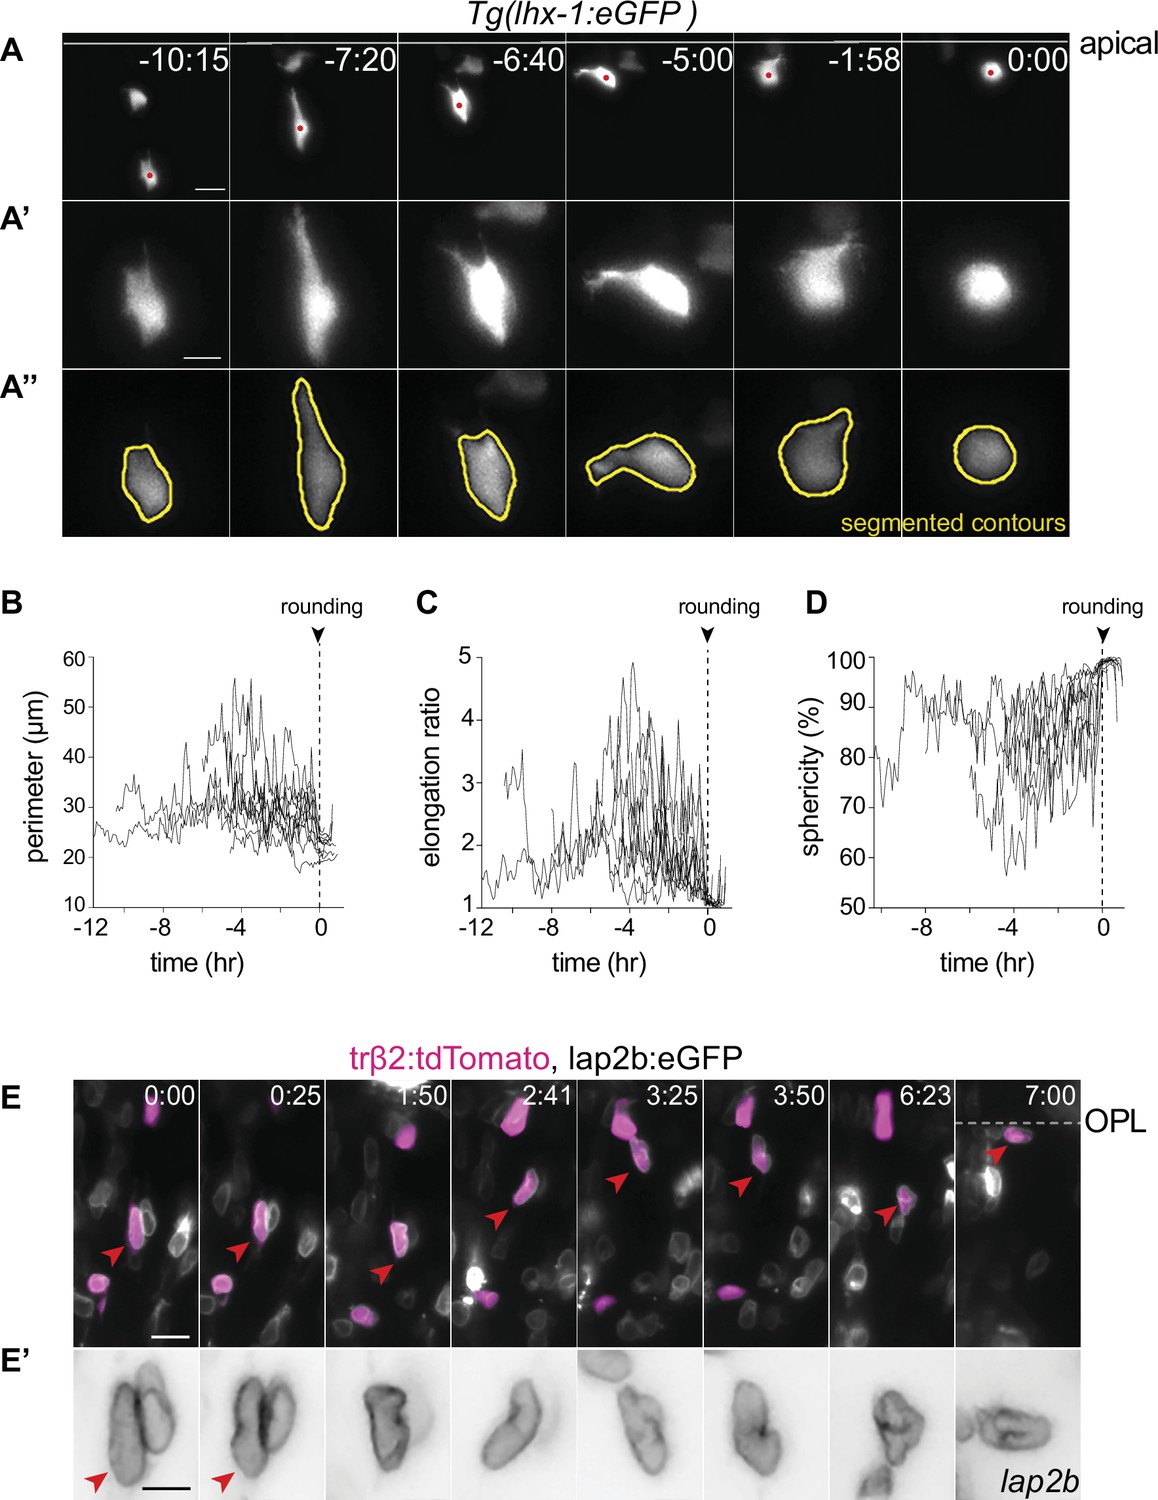
Analysis of cell and nuclear deformations of HC during migration.
(A) Cytoplasmic deformations of a horizontal cell (HC) migrating from the basal inner nuclear layer (INL) to the HC layer. Cells from Tg(lhx-1:eGFP) transgene embryo were transplanted into wild-type (WT) embryos. White line: apical surface; red dot: tracked HC. Scale bar: 10 μm. Frames from Video 4. (A’) Close-up of HC in (A). Scale bar: 5 μm. (A’’) Representative sequences of the automated segmented contours of the cell body (yellow line) generated by Icy. (B–D) Cell morphodynamic changes in 12 HCs from seven embryos; (B) perimeter (μm), (C) elongation ratio, (D) sphericity (%). See Figure 3—source data 2. (E-E’) HCs nuclei undergo deformations and exhibit different shapes as they move to their final position. Nuclear envelopes are labeled by lap2b:eGFP (gray), and HCs/PRs are labeled by trβ2:tdTomato (magenta) DNA constructs. Dashed line: outer plexiform layer (OPL); red arrowhead: tracked HC; scale bar: 10 μm. (E’) Close-up of HC in (E) showing nuclear envelopes (gray). Scale bar: 5 μm. Time in h:min (A, E).
Figure 3—figure supplement 2
Analysis of HC migration behaviour upon onstacle encounter.
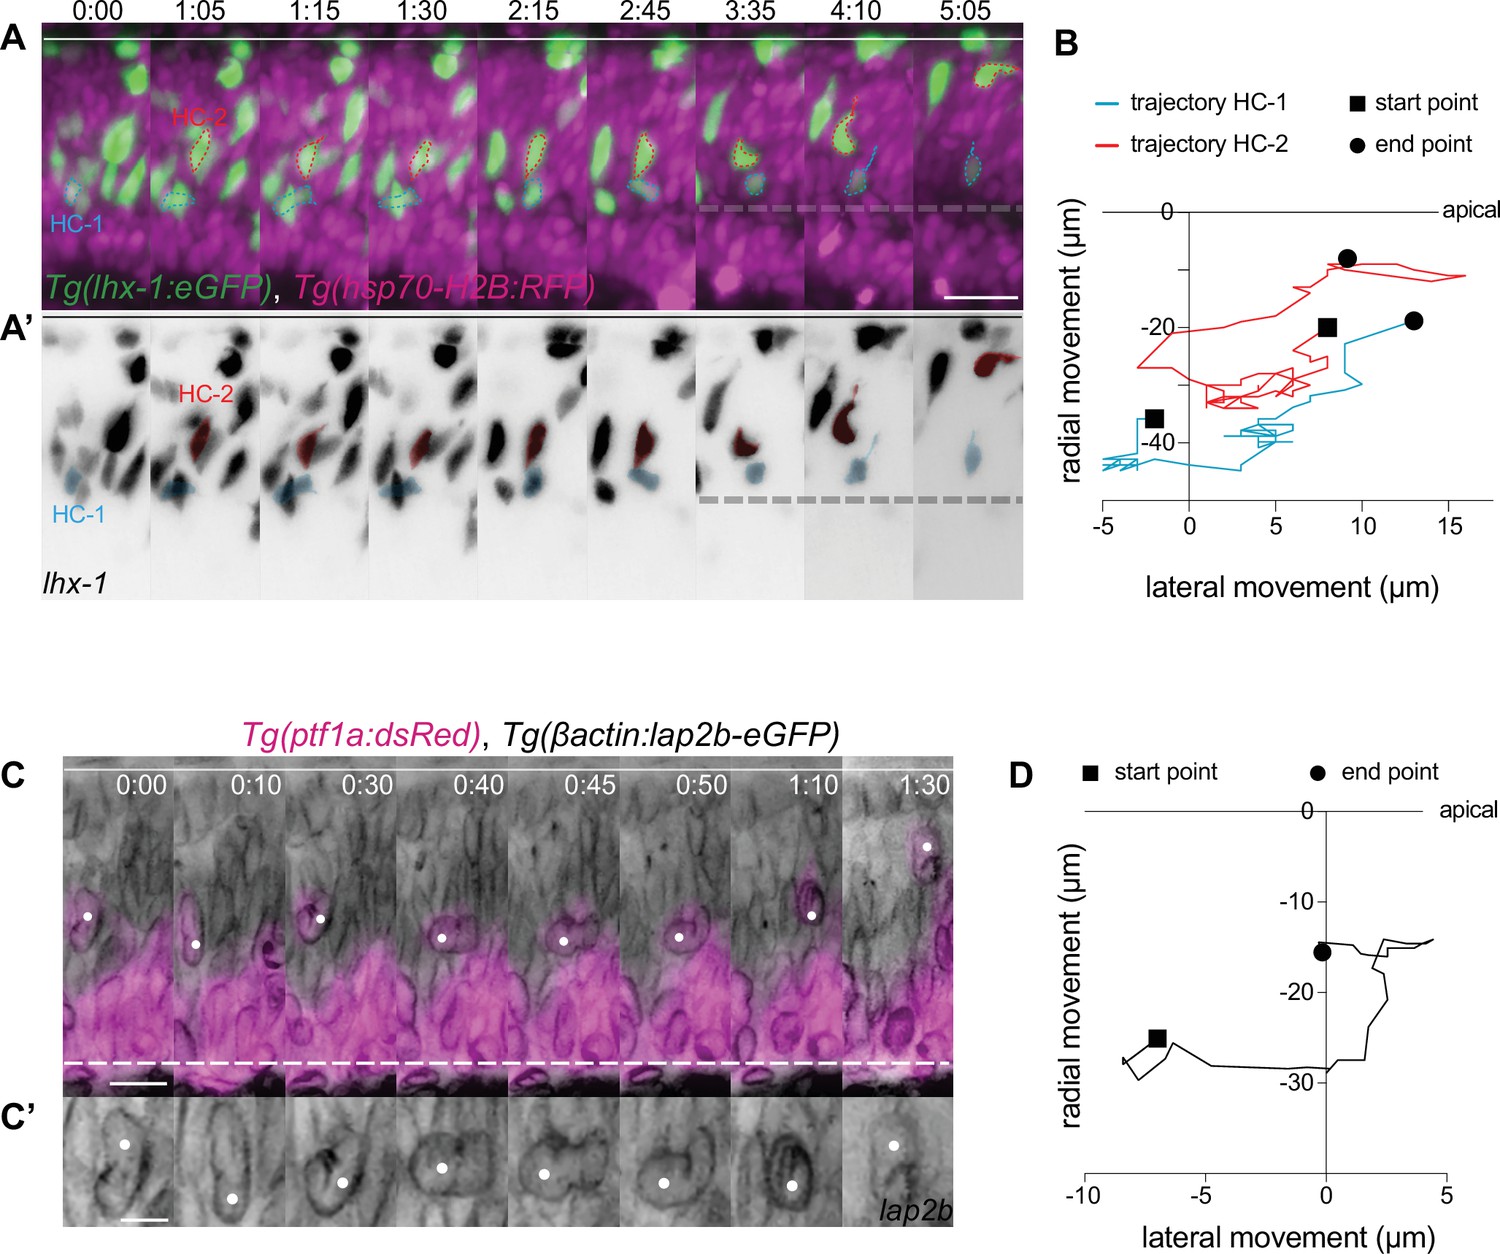
(A) Stills from time-lapse images of basal-to-apical migration trajectories of two horizontal cells (HCs): blue dashed line: HC-1; red dashed line: HC-2 in the crowded retina. Time series show that both HCs change direction and cell shape while moving toward their final position. Tg(lhx-1:eGFP) labels HC cytoplasm (green) and Tg(hsp70:H2B-RFP) is expressed in all retinal nuclei (magenta). Line: apical surface, dashed line: forming inner plexiform layer (IPL); scale bar: 20 μm. (A’) Insets of HC cytoplasm (gray) from (A). HC-1; blue contour: HC-1; red contour: HC-2. (B) Radial-tangential migration trajectories of HCs from (A-A’). Tracked HCs change direction in both radial (apical-basal) and tangential (lateral) axis while moving to their final laminar site. See Figure 3—source data 3. (C) Direction change and nuclear deformations of a tracked HC as it moves through the crowded retina. lap2b:eGFP DNA labels nuclear envelopes (gray). HCs and amacrine cells (ACs) are labeled in Tg(Ptf1a:dsRed) (magenta). Line: apical surface; white dot: tracked HC; dashed line: IPL; scale bar: 10 μm. (C’) Higher magnification insets of HC nuclei envelope from (C). Scale bar: 5 μm. (D) Radial-tangential migration trajectory of HC from (C). See Figure 3—source data 3. Time in h:min (A, C).
Figure 4 with 2 supplements
Horizontal cells feature hallmarks of protrusion-based amoeboid-like migration.
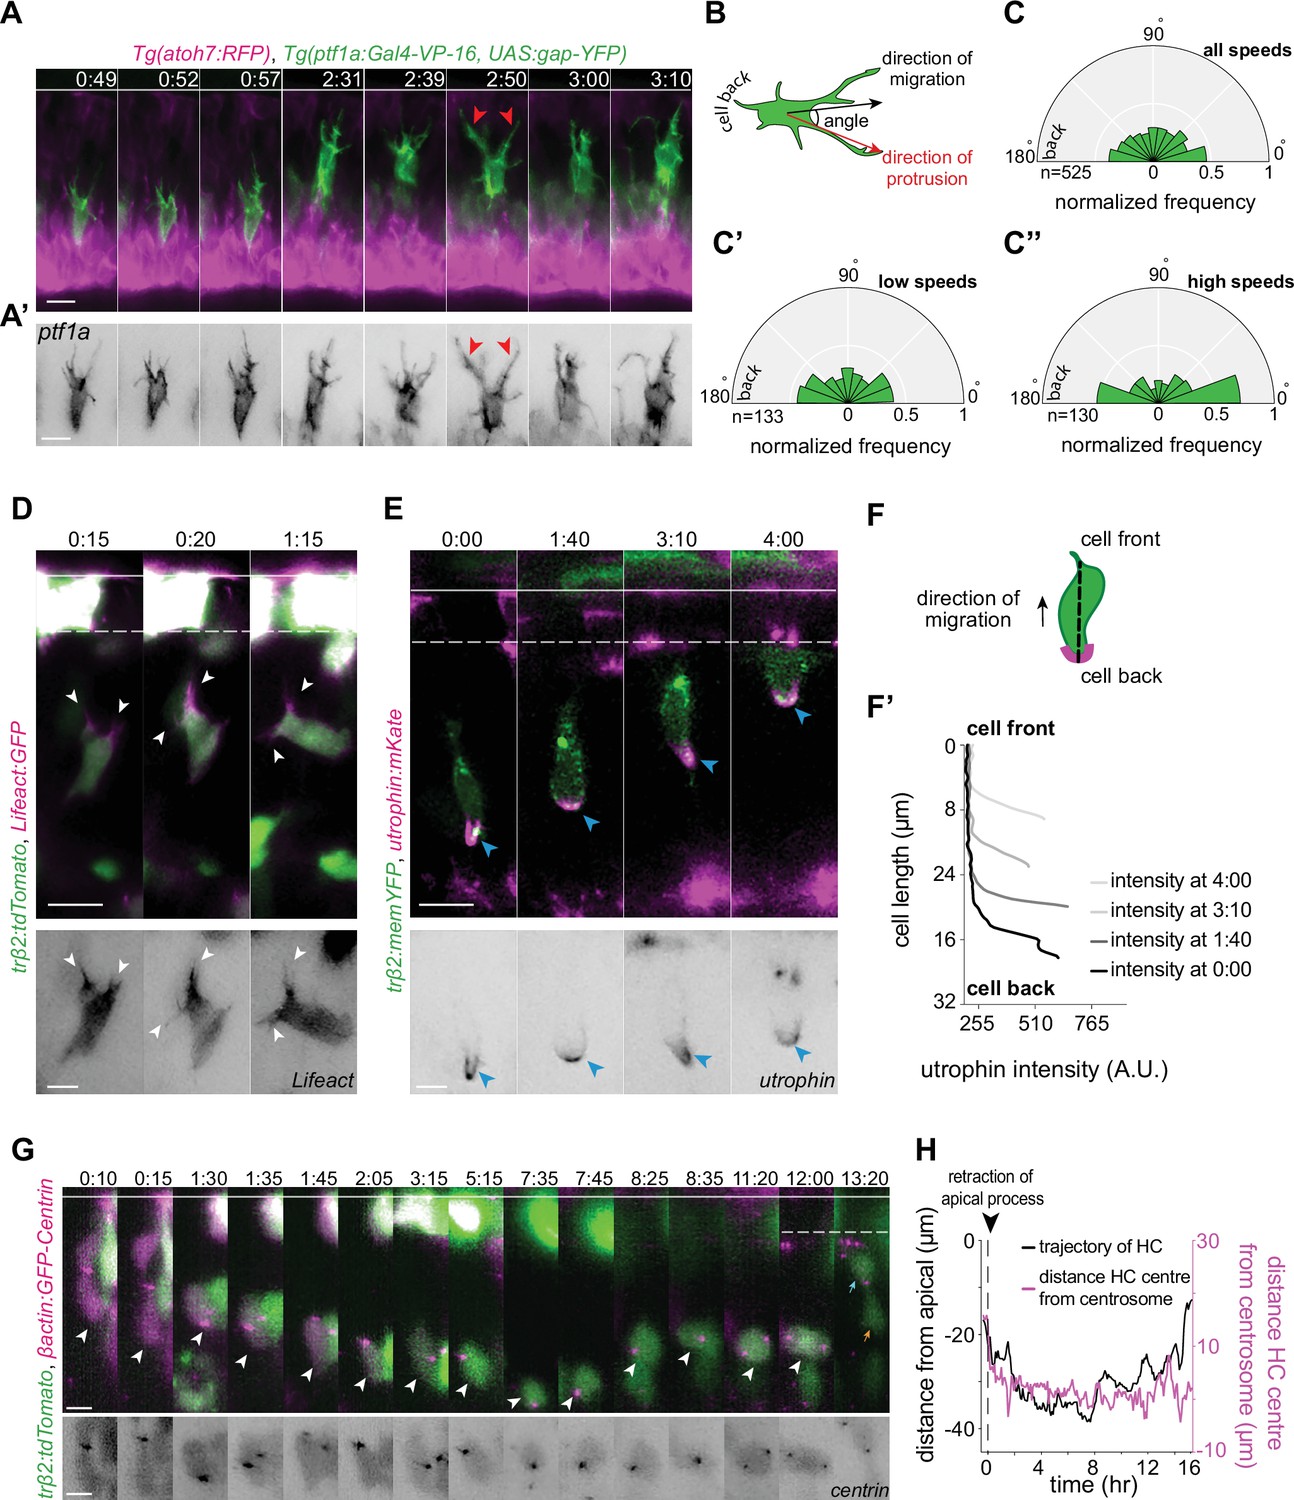
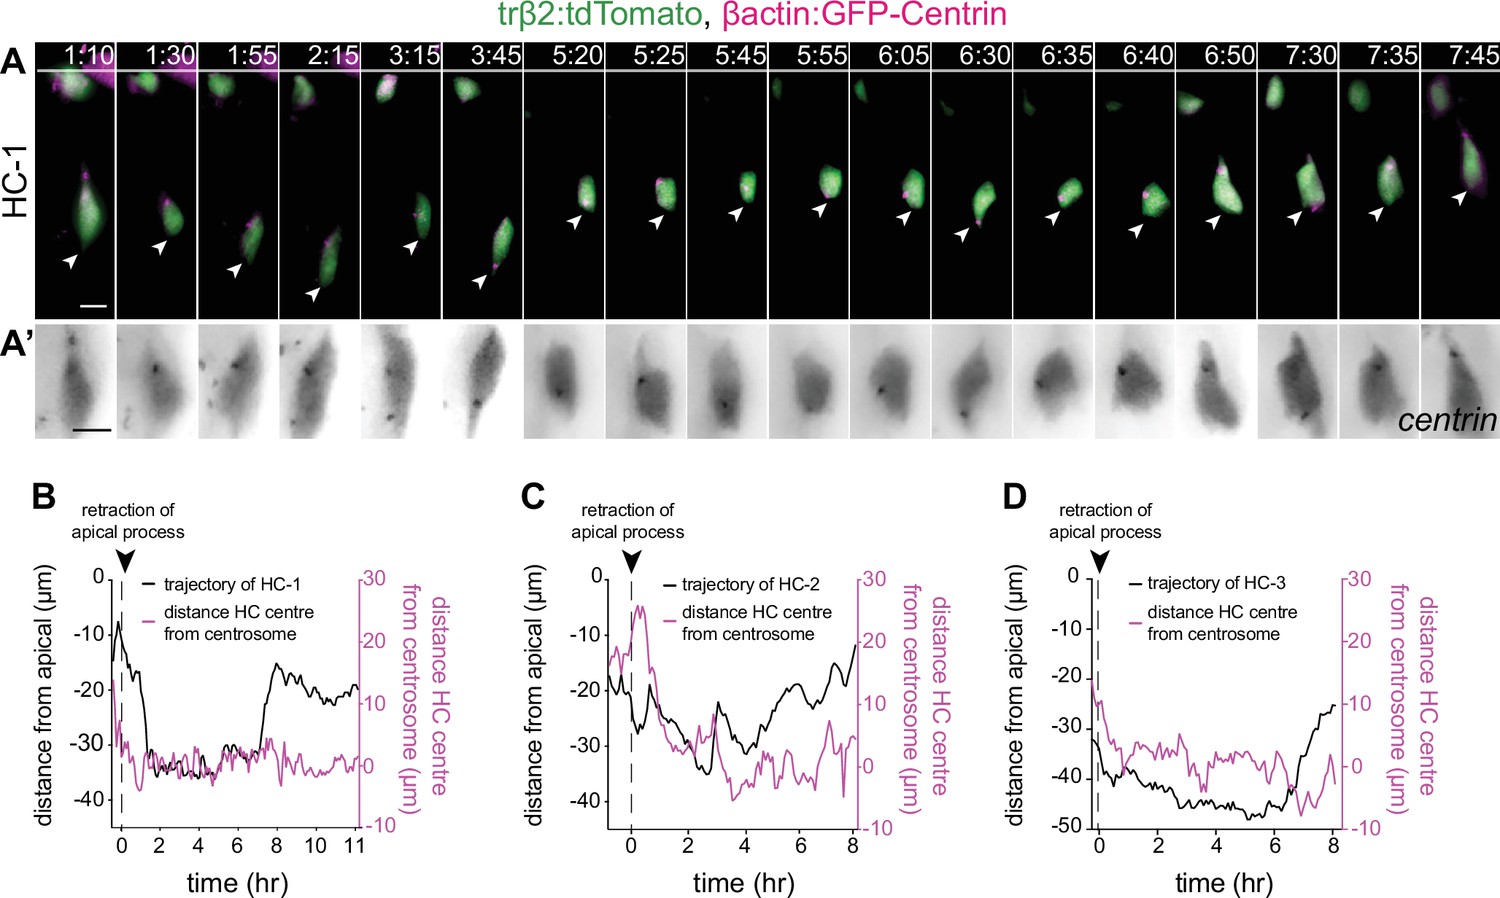
(A) Time-lapse sequence of highly dynamic membrane protrusions pointing in different directions (red arrowheads) in a migrating horizontal cell (HC). Tg(ptf1a:Gal4-VP-16,UAS:gap-YFP) labels membrane of HCs (green), Tg(atoh7:RFP) marks retinal ganglion cells (RGCs) and photoreceptors (PRs). Time interval = 1 min. Scale bar: 50 μm. (A’) Higher magnification insets of HC cell membrane from (A). Scale bar: 5 μm. (B) Scheme of protrusion angles measurements. (C–C’’) The frequency distribution of the angle between the direction of instantaneous movement of HC and its protrusions; (C) throughout the tracked basal-to-apical journey (t=4 hr), (C’) at low speeds: speeds below 25 percentile of this HC’s speed (<0.38 μm/min), (C’’) at high speeds: above 75 percentile of this HC’s speed (>0.93 μm/min). Minimum and maximum speeds observed for this cell are 0.06 and 4.44 µm/min, respectively. A protrusion pointing exactly toward the direction of cell movement exhibits an angle of 0°, and a protrusion pointing exactly opposite exhibits an angle of 180°. The radius indicates the normalized frequency for each angle bin, that is, the number of frames observed with the angle belonging to the particular angle bin for the given velocity condition normalized by the total number of frames observed in the given velocity condition. All measurements are from the migrating HC in (A–A’). See Figure 4—source data 1. (D–F’) F-actin distribution in migrating HCs: (D) trβ2:tdTomato and Lifeact-GFP DNA constructs mark HCs (green) and all filamentous F-actin (magenta), respectively. Lifeact-GFP is detected in the leading protrusions (white arrowheads) and the cell cortex. Scale bar: 20 μm. Bottom: close-up of Lifeact-GFP (gray) from (D). Scale bar: 5 μm. (E) trβ2:memYFP is expressed in HCs (green) and utrophin-mKate marks the stable filamentous F-actin (magenta). Utrophin is enriched at the cell back (blue arrowheads). Scale bar: 20 μm. Bottom: high magnification of utrophin:mKate (gray) in migrating HC from (E). Scale bar: 5 μm. (F) Scheme of line scan measurements of utrophin:mKate fluorescence intensity. (F’) Average utrophin:mKate fluorescent intensity profile of images at (E). Cell front and back are determined by the direction of HC movement. See Figure 4—source data 2. (G–H) Time series showing the dynamics of centrosome position in HCs from birth to final positioning. (G) β-actin:GFP-Centrin and trβ2:tdTomato DNA plasmids label centrosomes (magenta) and HCs (green), respectively. White arrowhead: HC. Cyan and orange arrows: sister HCs after mitosis. Bottom panel shows close-up of β-actin:GFP-Centrin (gray) in the tracked HC. White line: apical surface; dashed white line: HC layer. Scale bar: 20 μm. (H) Graph showing migration trajectory of the represented HC (black line) and the distance between its centrosome and center (magenta line) throughout migration. Arrowhead: time of detachment of the apical process. See Figure 3—source data 1, Figure 3—source data 2, Figure 3—source data 3. Time in h:min (A–G). See also Figure 4—figure supplements 1 and 2.
-
Figure 4—source data 1
- https://cdn.elifesciences.org/articles/76408/elife-76408-fig4-data1-v2.xlsx
-
Figure 4—source data 2
- https://cdn.elifesciences.org/articles/76408/elife-76408-fig4-data2-v2.xlsx
-
Figure 4—source data 3
Source data for Figure 4H and Figure 4—figure supplement 2B-D.
- https://cdn.elifesciences.org/articles/76408/elife-76408-fig4-data3-v2.xlsx
Figure 4—figure supplement 1
Analysis of HC protrusions.
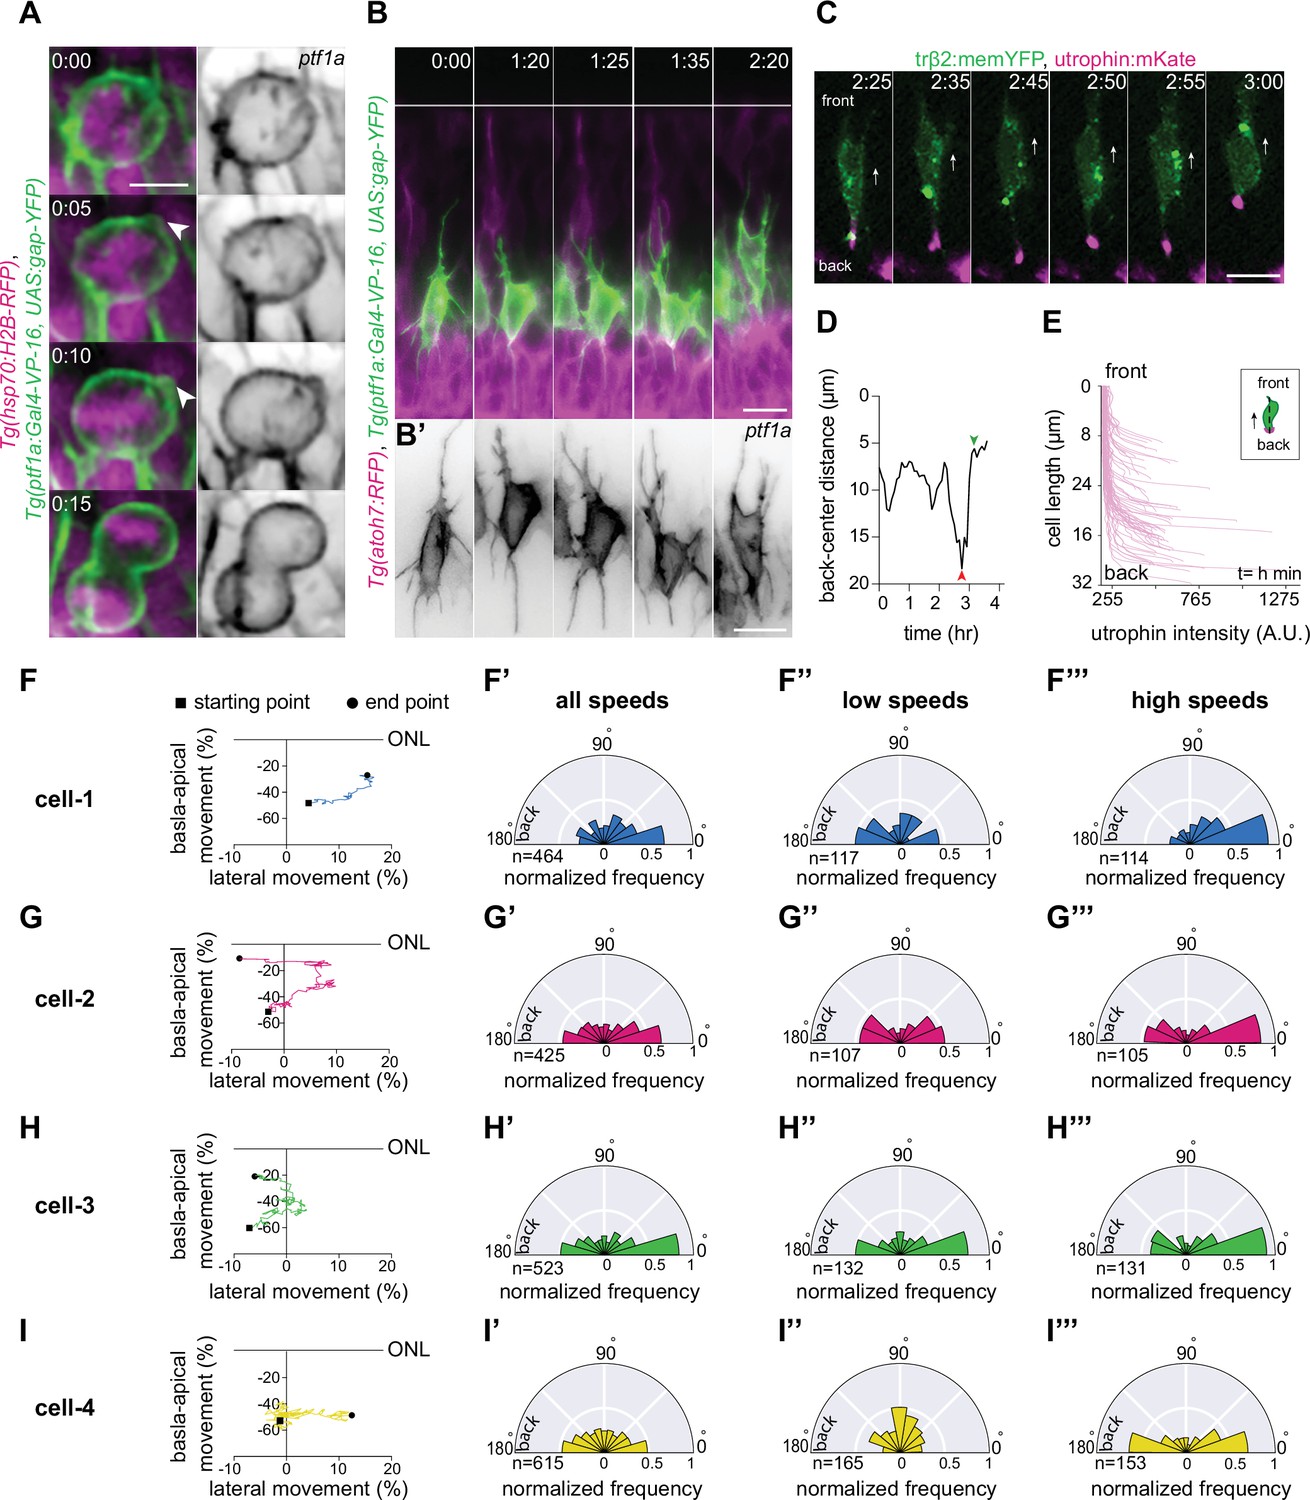
(A) Time-series of a horizontal cell (HC) during mitosis shows that HCs display membrane blebs (white arrowhead) during rounding.Tg(ptf1a:Gal4-VP-16,UAS:gap-YFP) labels HC membrane (green) and Tg(hsp70:H2B-RFP) is expressed in nuclei (magenta). Right panel: HC membrane (gray). Scale bar: 5 μm. (B) Time-lapse sequence of dynamic protrusions of a migrating HC. Protrusions display different morphologies and point in different directions. Tg(ptf1a:Gal4-VP-16,UAS:gap-YFP) labels HC membrane (green). Scale bar: 20 μm. Bottom: close-up of HC membrane (gray). Scale bar: 10 μm. White line: apical surface. (B’) Close-up of HC protrusions from (B). Scale bar: 5 μm. Frames from Video 7. (C) Time series of a migrating HC (green) (labeled by trβ2:memYFP DNA construct) and its dynamically changing uropod (magenta) (labeled by utrophin-mKate DNA construct). Frames from Video 10. (D) Measurements of the length of the uropod relative to HC centroid showing that it undergoes extension (red arrowhead) followed by retraction (green arrowhead). See Figure 4—source data 2. (E) Average utrophin:mKate fluorescent intensity profile of images at (E). See Figure 4—source data 2. (F–I) Migration trajectories and the frequency distribution of the angle between the direction of instantaneous HC movement and its protrusions in four HCs (cell-1, cell-2, cell-3, cell-4); (F’–I’) at all speeds, (F’’–I’’) at low speed: below 25 percentile of that cell’s speed, and (F’’’–I’'') at high speed: speeds above 75 percentile of the cell speed. A protrusion pointing exactly in the direction of cell movement has an angle of 0°, and a protrusion pointing exactly opposite has an angle of 180°. The numbers represent the number of angles observed for each category. The radius indicates the normalized frequency for each angle bin, that is, the number of frames observed with the angle belonging to the particular angle bin for the given velocity condition normalized by the total number of frames observed in the given velocity condition. See Figure 4—source data 1 for (F–I’’’). Time in h:min (A–F).
Figure 4—figure supplement 2
Analysis of HC centrosome position.
(A–A’) Time series showing the dynamics of centrosome position in a migrating horizontal cell (HC) (HC-1). β-Actin:GFP-Centrin and trβ2:tdTomato DNA plasmids label centrosomes (magenta) and HCs (green), respectively. Arrowhead: tracked HC; white line: apical surface. (A’) Close-up of β-actin:GFP-Centrin (gray) in HC from (A). Scale bar: 5 μm. Time in h:min. (B–D) Graphs showing migration trajectory of three tracked HCs (black line), and the distance between their centrosomes and center (magenta line) throughout migration. See Figure 4—source data 3. Arrowhead: time of detachment from the apical surface. (B) Representing HC-1 from (A).
Figure 5 with 1 supplement
Interference with nuclear properties impairs efficient horizontal cell migration and layer formation.
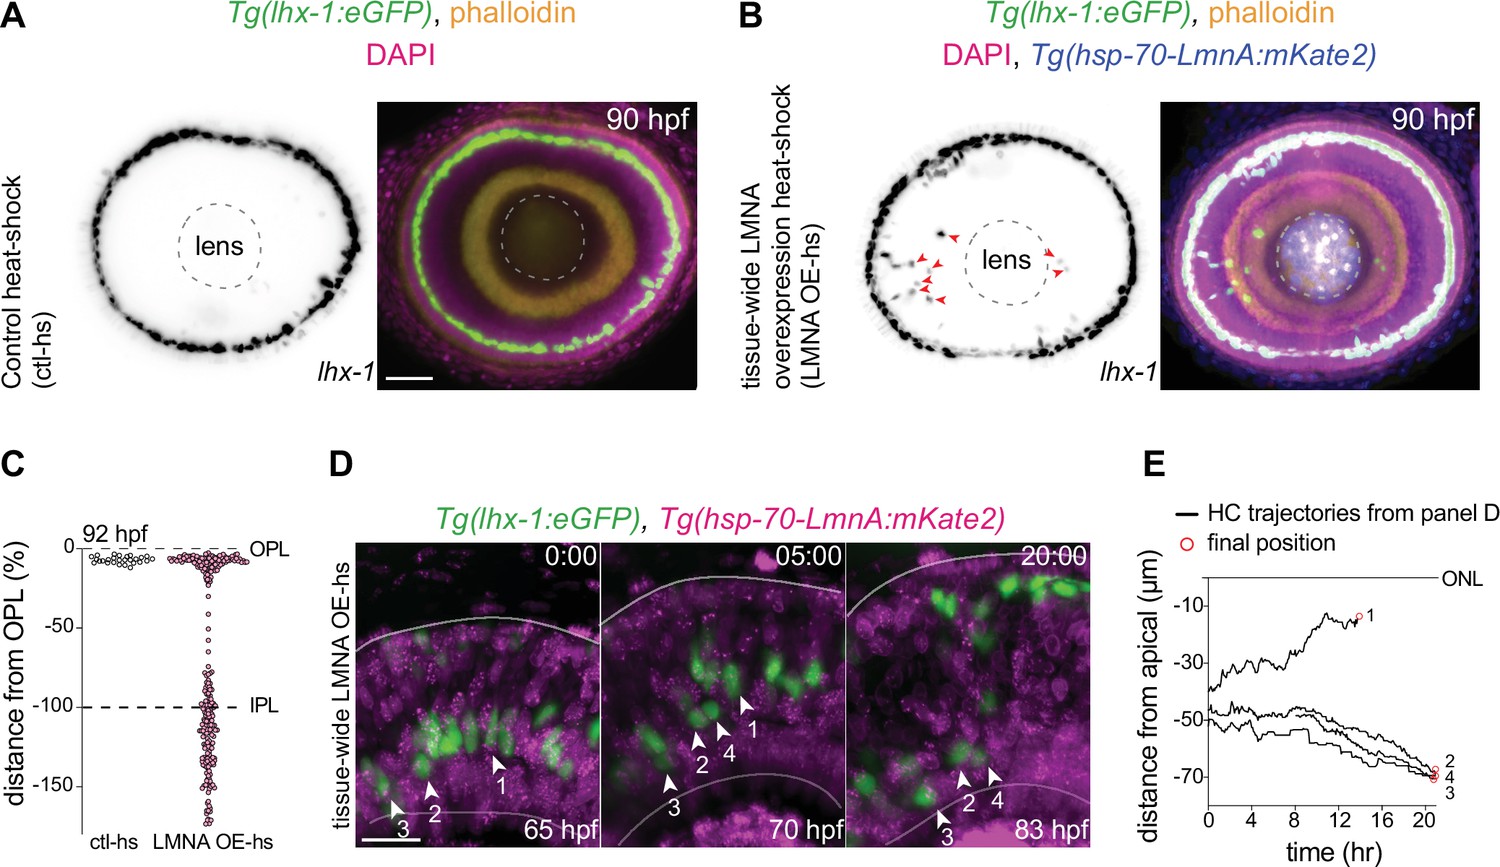
(A–B) Immunofluorescence images of (A) control heat-shocked (control-hs), and (B) LMNA overexpressing heat-shocked (LMNA OE-hs) at 90 hours post fertilization (hpf). Tg(lhx-1:eGFP) embryos were used for ctl-hs, and Tg(lhx-1:eGFP) × Tg(hsp70:LMNA-mKate2) double-transgene retinae for LMNA OE-hs experiments. Tg(lhx-1:eGFP) marks horizontal cells (HCs) (green), Tg(hsp70:LMNA-mKate2) is expressed in nuclear envelopes upon heat-shock (blue), DAPI labels nuclei (magenta), and phalloidin marks actin (yellow). Red arrowheads: ectopically positioned HCs, dashed circle: lens. Scale bar: 50 μm. (C) Position of HCs relative to outer plexiform layer (OPL) in control heat-shocked (ctl-hs) (n=27, N=5), and LMNA OE-hs (n=283, N=11) at 92 hpf. See Figure 5—source data 1. (D) Stills from a 20 hr time-lapse of Tg(lhx-1:eGFP) × Tg(hsp70:LMNA-mKate2) double-transgene retinae after heat-shock (LMNA OE-hs). Arrowheads: tracked HCs. Scale bar: 20 μm. (E) Migration trajectory of tracked HCs from (D). HC-2, HC-3, and HC-4 remained ectopically positioned in the basal part of the retina, while HC-1 successfully reached the HC layer. See Figure 5—source data 1. See also Figure 5—figure supplement 1.
Figure 5—figure supplement 1
Analysis of Laminin overexpression in HC mosaic and whole tissue.
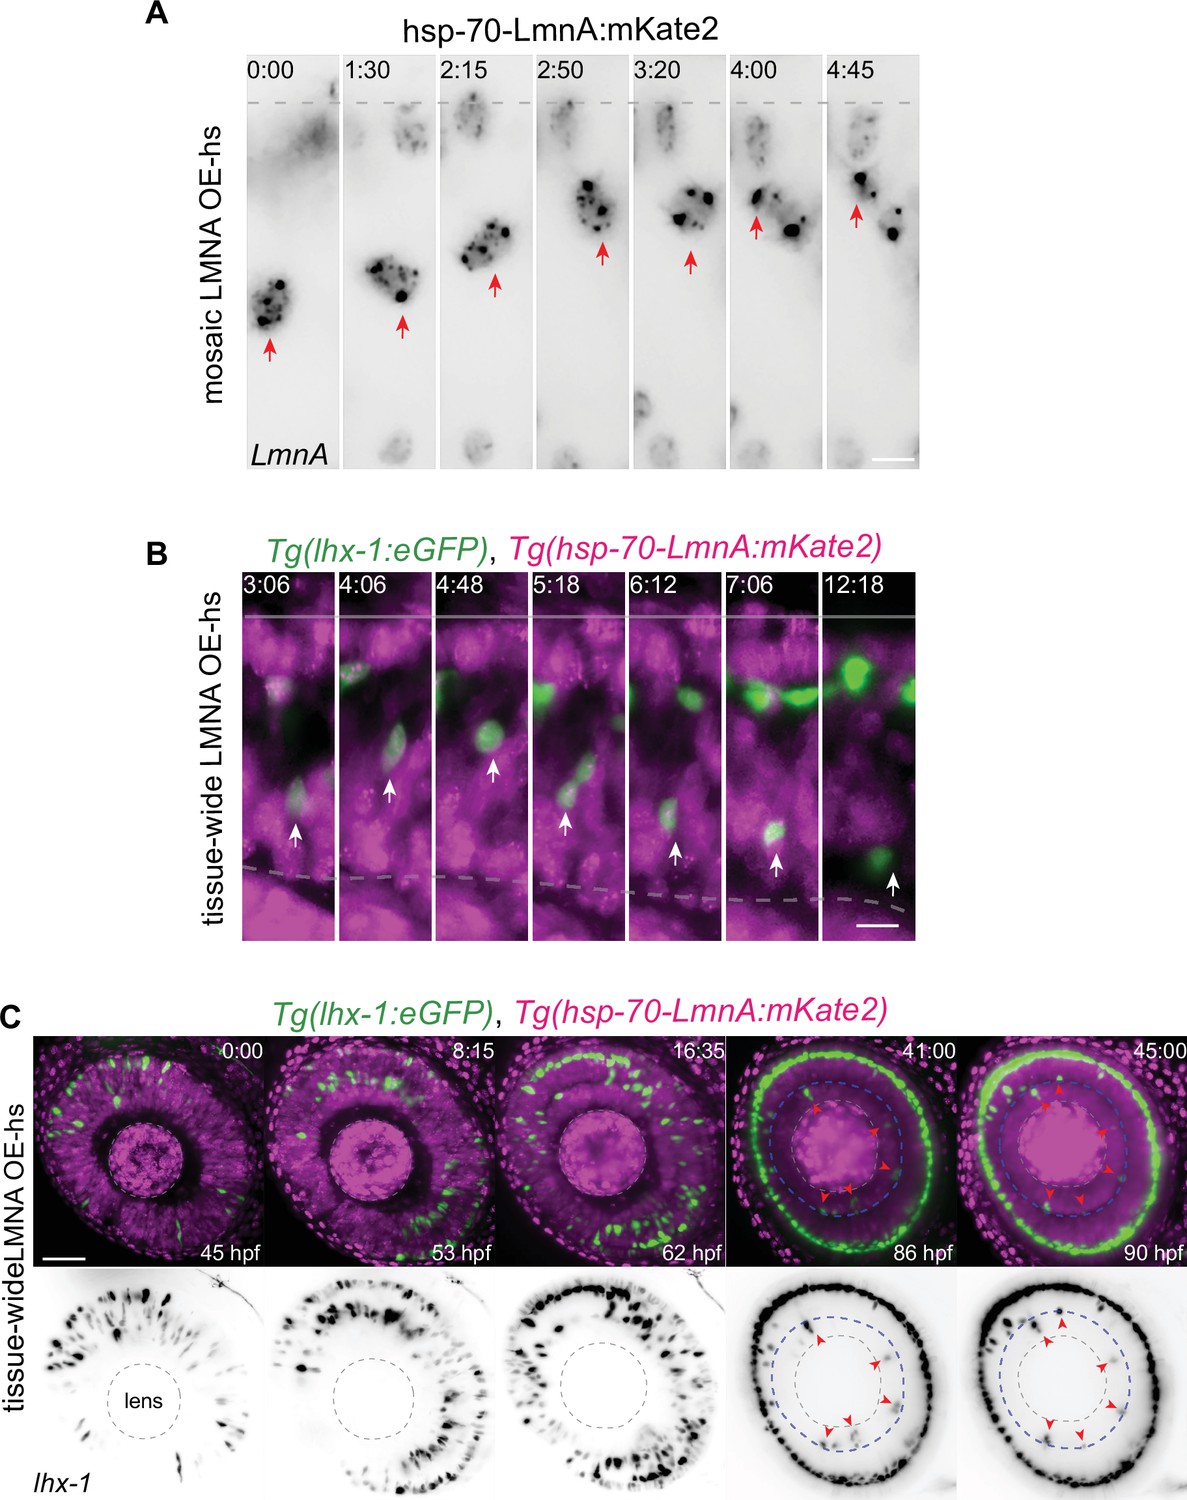
(A) Representative time series of migration dynamics of an LmnA-mKate2 overexpressing horizontal cell (HC), when its surrounding cells do not express LmnA-mKate2. LMNA overexpression of HCs at the single-cell level does not impede their migration and layer formation. hsp-70-LmnA:mKate2 DNA plasmid labels LMNA overexpressed nuclei upon heat-shock. Red arrows: tracked HC; dashed line: apical surface. Scale bar: 10 μm. (B) Representative time series of HCs in Tg(lhx-1:eGFP) × Tg(hsp70:LMNA-mKate2) double-transgene retinae. Tissue-scale LMNA overexpression after heat-shock (LMNA OE-hs) impairs HC migration and layer formation. White arrows: tracked HC; line: apical surface; dashed line: inner plexiform layer (IPL). Scale bar: 10 μm. (C) Representative time series of HC migration and layer formation in LmnA-mKate2 overexpressed retina for 45 hr from 45 hpf shows that tissue-scale LMNA overexpression impairs HC migration and layer formation. Tg(lhx-1:eGFP) labels HC (green) and Tg(hsp70:LMNA-mKate2) is expressed in nuclear envelopes upon heat-shock (magenta). Red arrowheads: trapped HCs, white dashed circle: lens, blue dashed line: IPL. Scale bar: 50 μm. Time in h:min (A–C).
Figure 6 with 1 supplement
The inner plexiform layer (IPL) poses a barrier for horizontal cell apical migration.
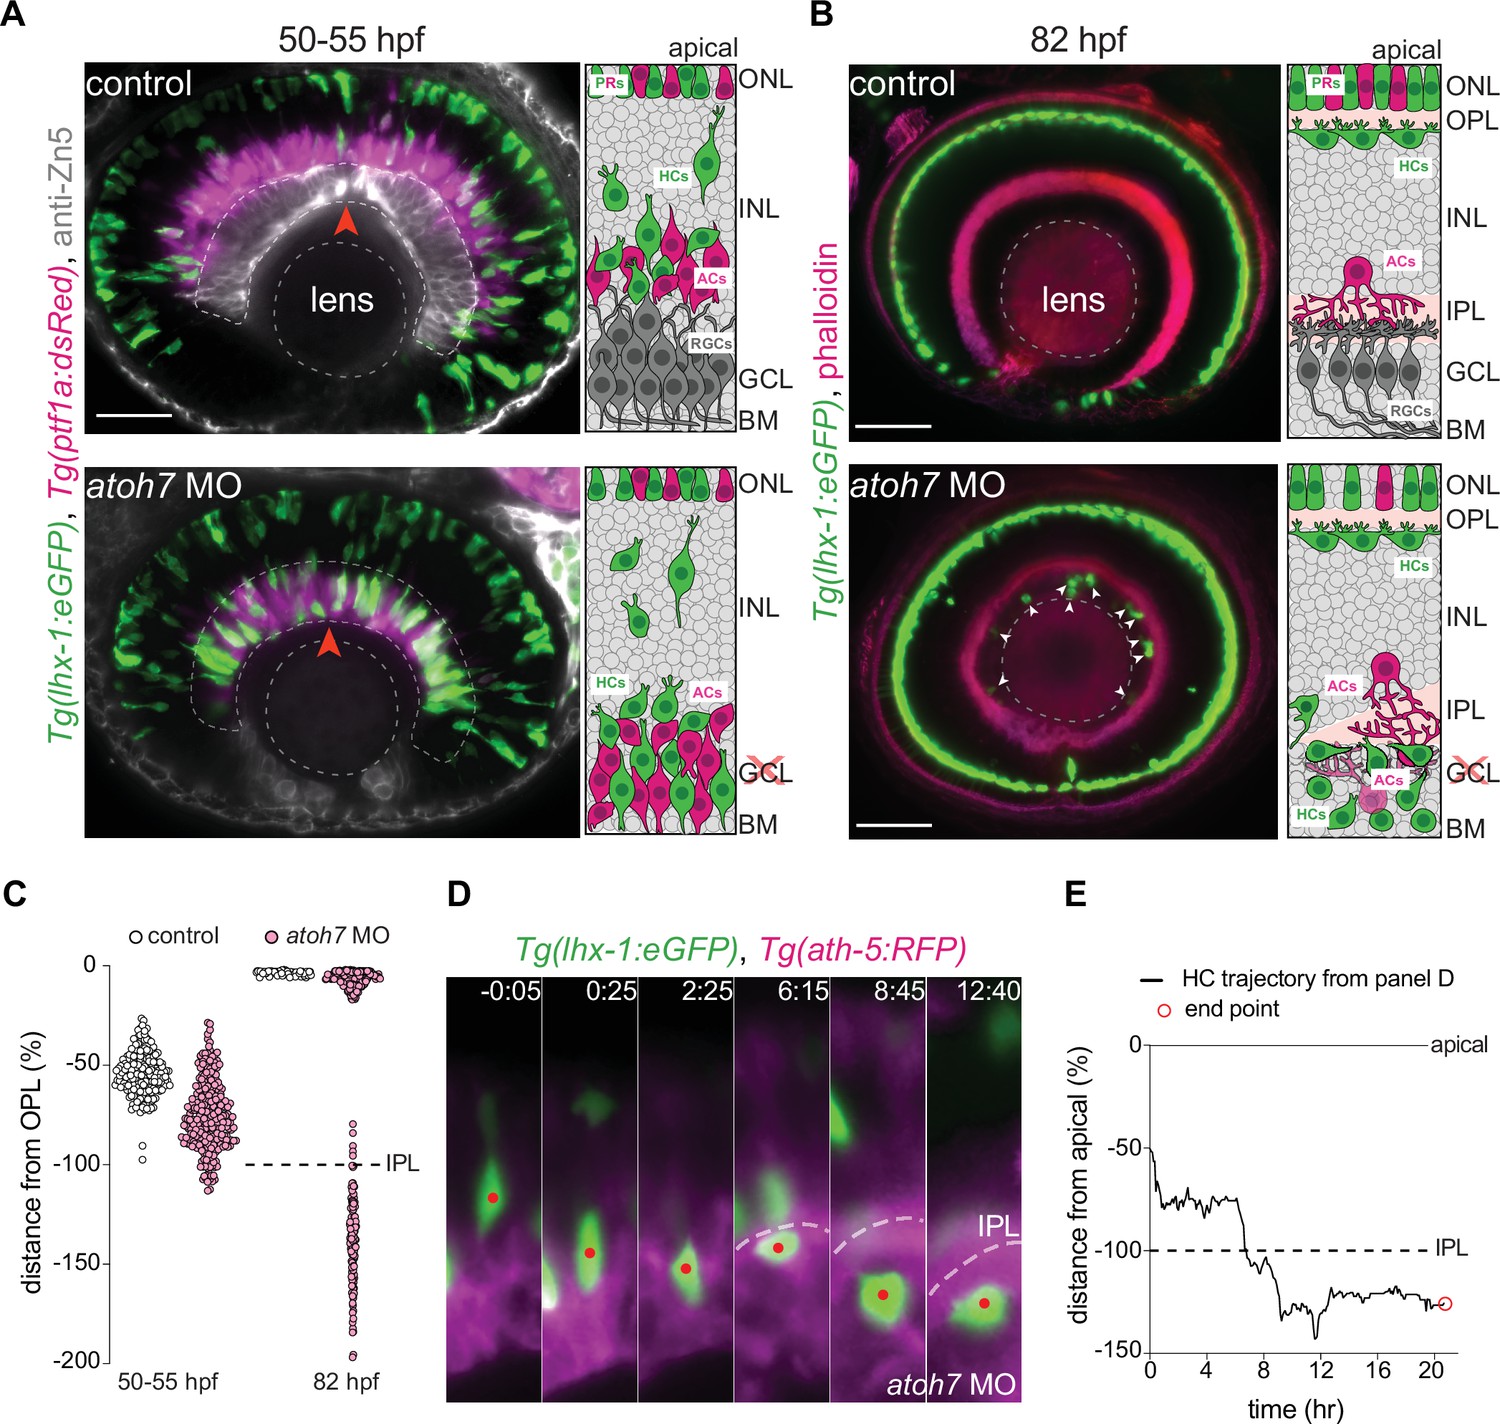
(A–B) Immunofluorescence images of control (top) and atoh7 morpholino (atoh7 MO) [bottom] at 50–55 hours post fertilization (hpf) (A), and at 82 hpf (B). Schemes of each condition are seen on the right. Tg(lhx-1:eGFP) is expressed in horizontal cells (HCs) (green), Tg(ptf1a1:dsRed) is expressed in amacrine cells (ACs) and HCs (magenta), anti-Zn5 marks retinal ganglion cells (RGCs) (gray), and phalloidin marks actin (magenta). In atoh7 MO retinae, the most basal layer is devoid of RGCs (gray in control) and is instead filled with ACs (magenta), and HCs (green). (A) HCs reach ectopic basal positions adjacent to the basement membrane (BM) in atoh7 MO retinae. Red arrowheads: BM. (B) Many HCs remain trapped beneath the IPL in atoh7 MO retinae. White arrowheads: trapped HCs; dashed circle: lens. Scale bar: 50 μm. (C) Position of HCs relative to the outer plexiform layer (OPL) in control (n=196, N=12) and atoh7 MO (n=261, N=14) retinae at 50–55 hpf, and control (n=76, N=11) and atoh7 MO (n=312, N=15) at 82 hpf. At 50–55 hpf, the depth of HC migration increases in atoh7 MO compared to controls. At 82 hpf, many HCs are ectopically located below the IPL in atoh7 MO, while in controls all HCs reached their layer. See Figure 6—source data 1. (D) Time series of an HC (red dot) in atoh7 MO retinae. Dashed line: the IPL. Scale bar: 20 μm. Time in h:min. (E) Migration trajectory of the tracked HC from (D). See Figure 6—source data 1.See also Figure 6—figure supplement 1.
Figure 6—figure supplement 1
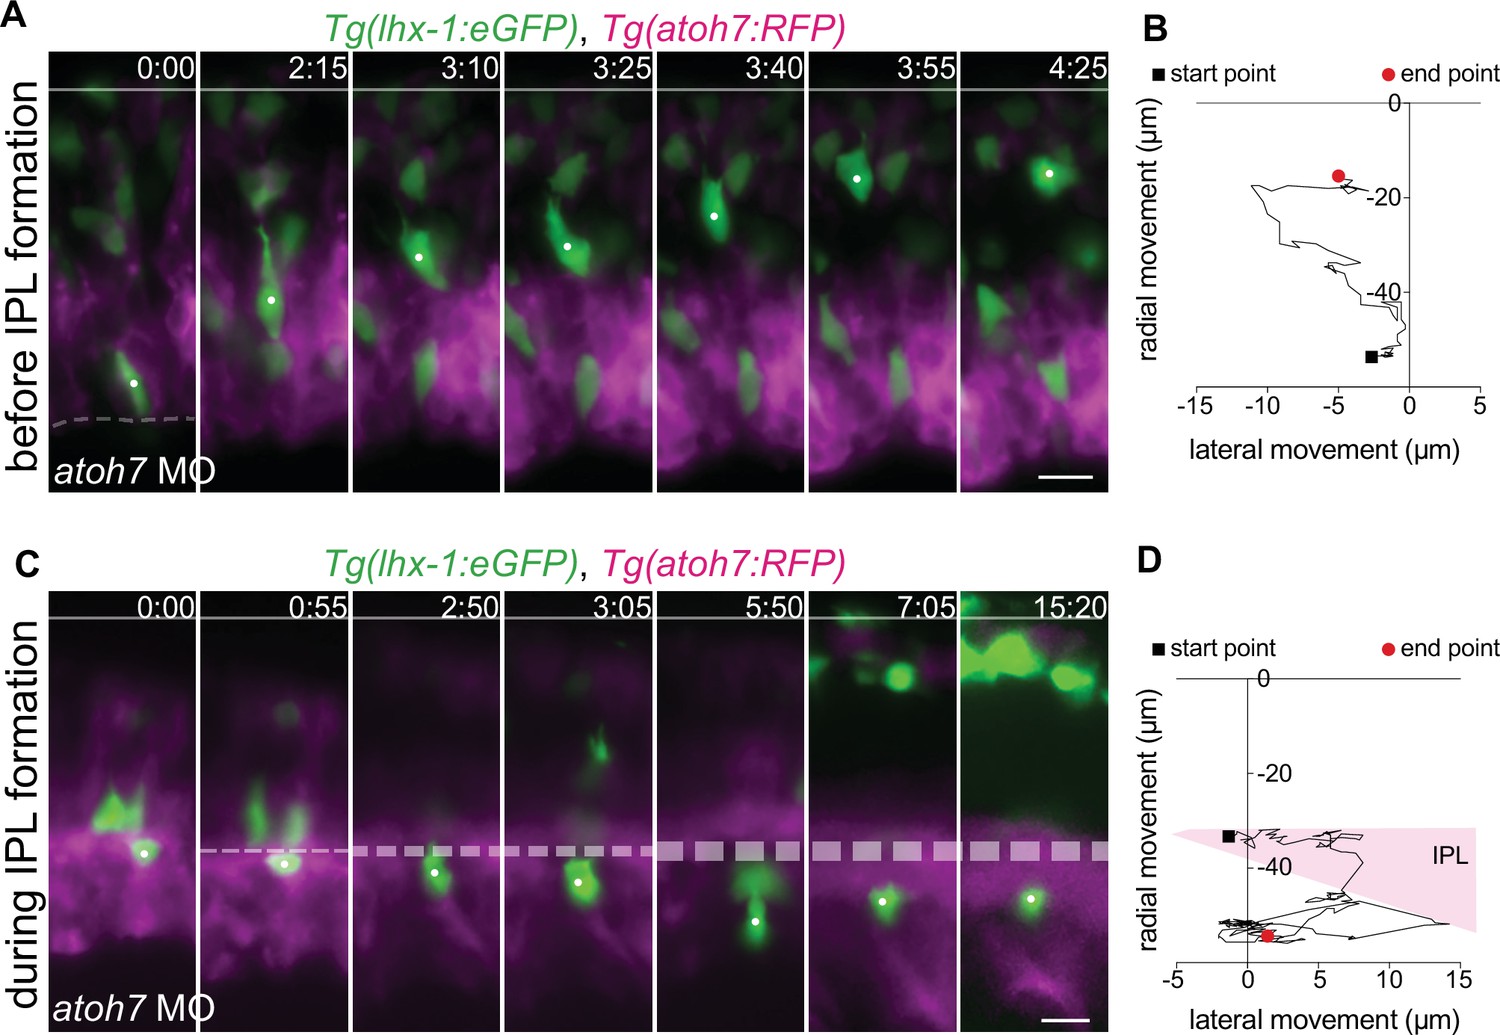
Analysis of role of IPL formation on HC migration.
(A–D) Representative time series of tracked horizontal cells (HCs) (white dot) and their respective trajectories in atoh7 MO retinae at different developmental stages: before inner plexiform layer (IPL) formation (A–B), and after maturation of IPL (C–D). Tg(lhx-1:eGFP) labels HCs (green), Tg(atoh7:RFP) labels membranes of photoreceptors (PRs) and basal neurons (magenta). (A) Before IPL formation, HCs successfully move toward the HC layer even when moving from more basal positions close to the lens. (B) Radial-tangential migration trajectories of the tracked HC from (A). See Figure 6—source data 1. (C) After IPL formation, HCs fail to move through the formed IPL and therefore remain ectopically trapped beneath the IPL. (D) Radial-tangential migration trajectories of the tracked HC from (C). See Figure 6—source data 1. Line: apical surface; dashed line: forming IPL (B). Scale bar: 10 μm. Time in h:min. (A,C).
Videos
Video 1
Bidirectional trajectory of a tracked horizontal cell (HC) from apical detachment to final positioning.
Time-lapse imaging of a typical bidirectional and bimodal migration of an HC. Upon retraction from the apical surface, HC enters a multipolar migration phase. Final mitosis occurs close to the HC layer. Tg(lhx-1:eGFP) labels HCs (green), Tg(Ptf1a:dsRed) marks amacrine cells (ACs) and HCs (magenta). Red dot: tracked HC; white and blue dots: sister cells of the tracked HC after division. Time in h:min. Scale bar: 5 µm.
Video 2
Retraction of horizontal cell (HC) apical attachment.
Tg(ptf1a:Gal4-VP-16, UAS:gap-YFP) labels membrane of HCs (green), and Tg(atoh7:RFP) labels membranes of photoreceptors (PRs) and retinal ganglion cells (RGCs) (magenta). White arrowhead: apical attachment; red arrowhead: tip of the retracted process. Time in h:min. Scale bar: 5 µm.
Video 3
Tangential migratory track of a horizontal cell (HC) after bipolar cell (BC) lamination.
Tg(vsx-1:GFP) labels BCs (magenta) and Tg(ptf1a:DsRed) marks HCs (green). White dot: tracked HC. Time in h:min. Scale bar: 20 μm.
Video 4
Horizontal cells (HCs) undergo frequent and reversible cell morphodynamic changes during migration.
Left: Time-lapse imaging shows basal-to-apical migration of an HC which was transplanted from Tg(lhx-1:eGFP) transgene embryo into wild-type (WT) embryos. HC rounds at the apical side (last frame). Right: Representative sequences of the automated segmented contours of the cell body (yellow line) generated by Icy. Red dot: tracked HC. Time in h:min. Scale bar: 10 μm.
Video 5
Nuclear deformations during horizontal cell (HC) migration.
Time-lapse imaging of an HC shows that it undergoes nuclear deformations while squeezing through the crowded retina. βactin:lap2b-eGFP labels nuclear envelopes (gray), trβ2:tdTomato is expressed in HCs (magenta). Black arrowhead: tracked HC. Time in h:min. Scale bars: 10 μm.
Video 6
Horizontal cell (HC) undergoes cell-shape deformations to bypass its neighboring cell.
Time-lapse imaging of an HC migration from basal-to-apical inner nuclear layer (INL). Tg(Ptf1a:dsRed) labels HCs and amacrine cells (ACs). Red dot: tracked HC. Time in h:min. Scale bar: 10 µm.
Video 7
Horizontal cells (HCs) send dynamic protrusions during migration and only form blebs prior to mitosis.
Time-lapse imaging of an HC migration shows that it sends dynamic protrusions while migrating. Upon rounding prior to mitosis, the tracked HC displays membrane blebbing. Tg(ptf1a:Gal4-VP-16,UAS:gap-YFP) labels HC membrane. Red dot: tracked HC, red arrowhead: blebs, white and black dots: sister cells of the tracked HC after division. Time in h:min. Scale bar: 20 µm.
Video 8
Angle distribution.
The frequency distribution of the angle between the direction of instantaneous horizontal cell (HC) movement and its protrusions. The radius indicates the normalized frequency for each angle bin.
Video 9
Lifeact-GFP is detected at the leading protrusions and the cell cortex of migrating horizontal cells (HCs).
Left: trβ2:tdTomato marks HCs (green) and Lifeact-GFP labels all filamentous F-actin (magenta). Time in h:min. Scale bar: 10 µm.
Video 10
Migrating horizontal cells (HCs) display a front-rear utrophin distribution.
trβ2:memYFP is expressed in HCs (green) and utrophin-mKate marks the stable filamentous F-actin (magenta).Time in h:min. Scale bar: 10 µm.
Additional files
-
MDAR checklist
- https://cdn.elifesciences.org/articles/76408/elife-76408-mdarchecklist1-v2.pdf
-
Supplementary file 1
Tables of: Transgenic lines; DNA constructs; Antibodies; and relevant links to Figures.
- https://cdn.elifesciences.org/articles/76408/elife-76408-supp1-v2.docx
Download links
A two-part list of links to download the article, or parts of the article, in various formats.
Downloads (link to download the article as PDF)
Open citations (links to open the citations from this article in various online reference manager services)
Cite this article (links to download the citations from this article in formats compatible with various reference manager tools)
Amoeboid-like migration ensures correct horizontal cell layer formation in the developing vertebrate retina
eLife 11:e76408.
https://doi.org/10.7554/eLife.76408


