The tetraspanin TSPAN5 regulates AMPAR exocytosis by interacting with the AP4 complex
- Institute of Neuroscience, CNR, Italy
- NeuroMI Milan Center for Neuroscience, University of Milano-Bicocca, Italy
- University of Bordeaux, Interdisciplinary Institute for Neuroscience, France
- Department of Life Sciences, University of Trieste, Italy
- IRCCS Ospedale Policlinico San Martino, Italy
- Center for Synaptic Neuroscience and Technology (NSYN), Istituto Italiano di Tecnologia (IIT), Italy
Figures
Figure 1
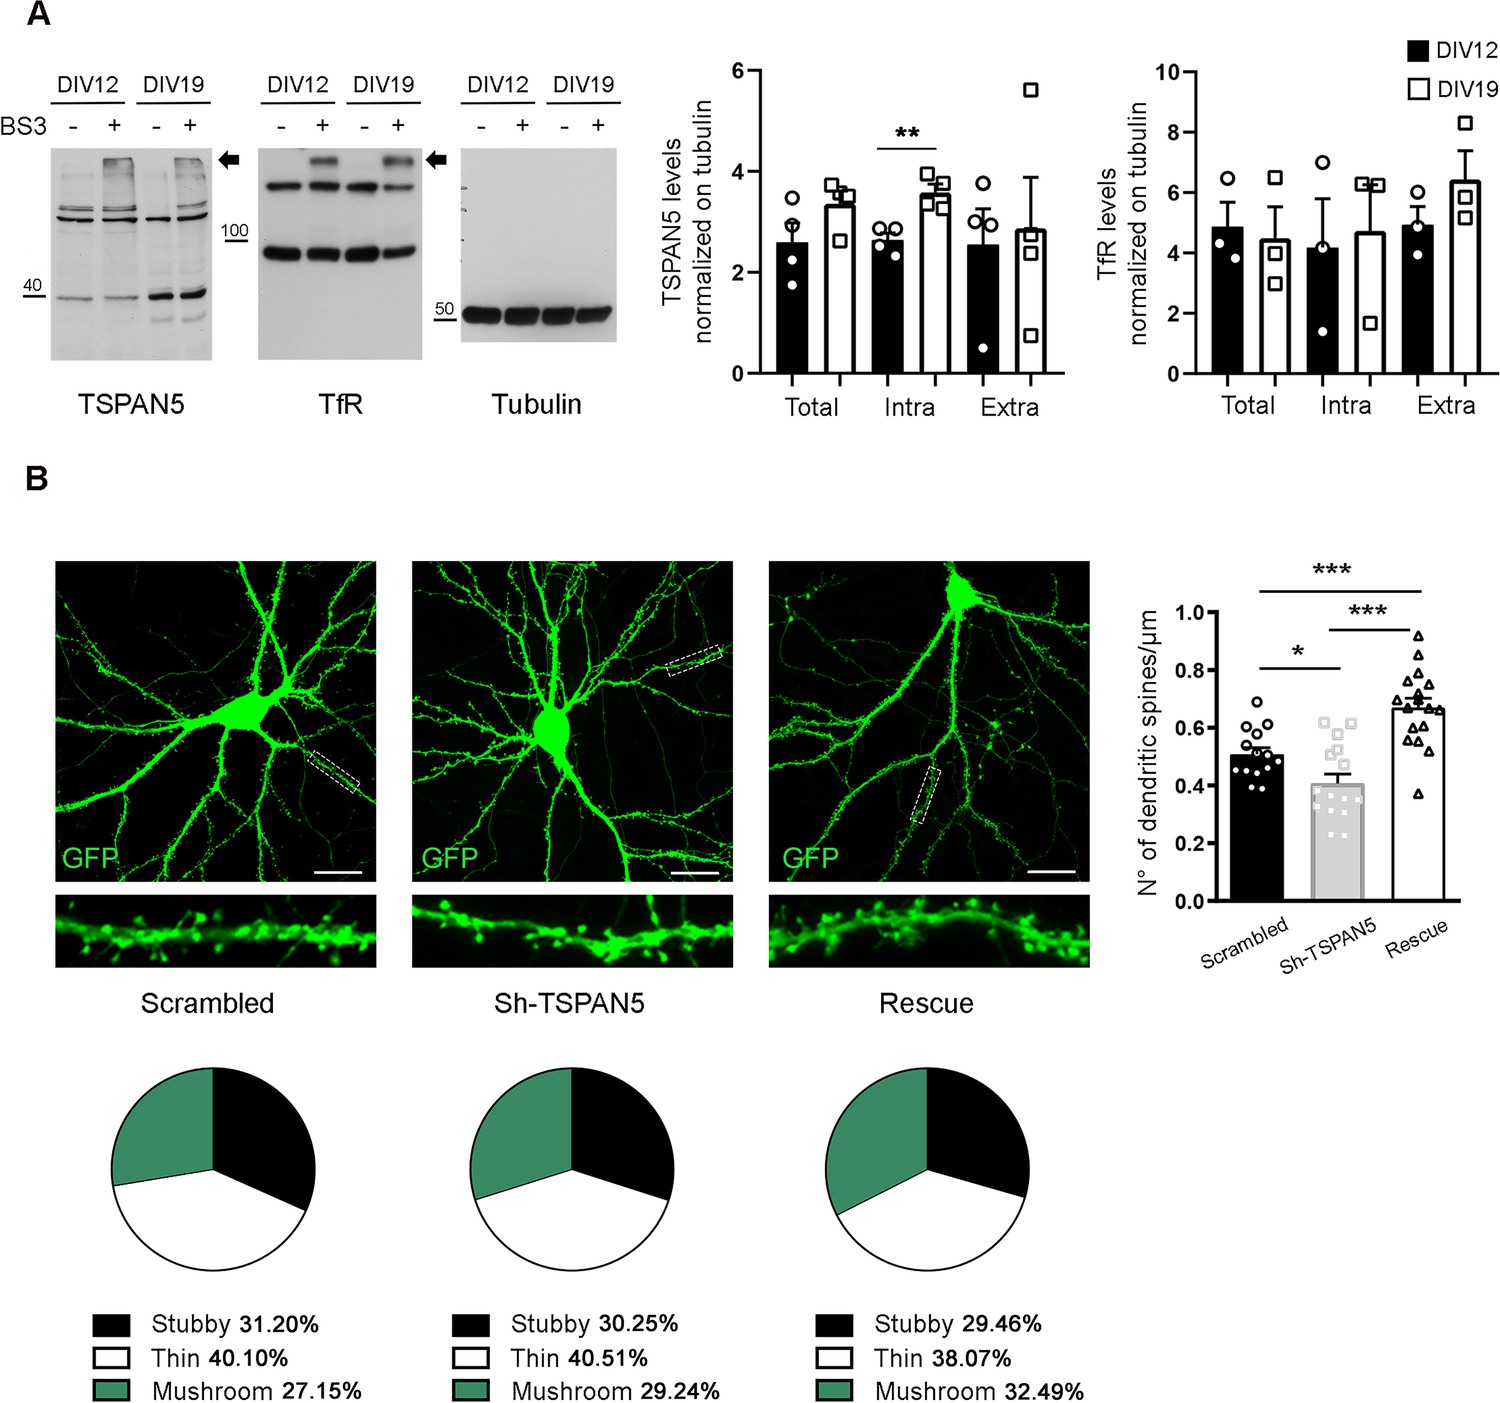
TSPAN5 intracellular levels increase with neuronal maturation.
(A) Bis(sulfosuccinimidyl)suberate (BS3) crosslinking experiment on cultured rat hippocampal neurons at DIV12 and -19 blotted for TSPAN5, transferrin receptor (TfR), and tubulin. Arrows indicate the higher molecular weight bands present in the BS3+lanes that represent the plasma membrane pool of the proteins. Tubulin was used as a loading control; TfR was used as a crosslinking positive control (TSPAN5: total/tubulin: DIV12 2.599±0.38, DIV19 3.357±0.25; intra/tubulin: DIV12 2.643±0.14, DIV19 3.582±0.16; extra/tubulin: DIV12 2.552±0.70, DIV19 2.871±1.01; TfR: total/tubulin: DIV12 4.87±0.81, DIV19 4.48±1.05; intra/tubulin: DIV12 4.18±1.61, DIV19 4.73±1.53; extra/tubulin: DIV12 4.94±0.6, DIV19 6.44±0.95). n = 3–4 independent cultures per condition. Unpaired Student T test. (B) Left panels: Confocal images of DIV20 cultured rat hippocampal neurons transfected at DIV13 with either scrambled, Sh-TSPAN5, or rescue (expressing simultaneously both the Sh-TSPAN5 and an ShRNA-resistant form of TSPAN5) constructs, all co-expressing GFP. Scale bar = 20 μm. Inserts (25 μm wide) show higher magnification of the dendrites highlighted in white. Right panel: Quantification of dendritic spine density represented as histograms. Dendritic spine density (no. of dendritic spines/μm: scrambled 0.51±0.02; Sh-TSPAN5 0.41±0.03; rescue 0.67±0.03). Pie charts (bottom panels) show quantification of dendritic spine morphology. Dendritic spine morphology (%: stubby: scrambled 31.20±1.52, Sh-TSPAN5 30.25±2.02, rescue 29.46±1.38; thin: scrambled 40.10±2.45, Sh-TSPAN5 40.51±1.96, rescue 38.07±2.5; mushroom: scrambled 27.15±2.25, Sh-TSPAN5 29.24, rescue 32.49±2.44). n = scrambled, 14; Sh-TSPAN5, 16; rescue, 17 neurons. One Way ANOVA, Newman-Kulspost hoc multiplecomparison test.
Values represent the mean ± SEM. *=p < 0.05, **=p < 0.01, ***=p < 0.001.
-
Figure 1—source data 1
individual data values for the bar graphs and pie charts in panels A and B.
- https://cdn.elifesciences.org/articles/76425/elife-76425-fig1-data1-v1.xlsx
-
Figure 1—source data 2
Raw images and images with cropped areas highlighted of the blots in panel A.
- https://cdn.elifesciences.org/articles/76425/elife-76425-fig1-data2-v1.zip
Figure 2 with 1 supplement
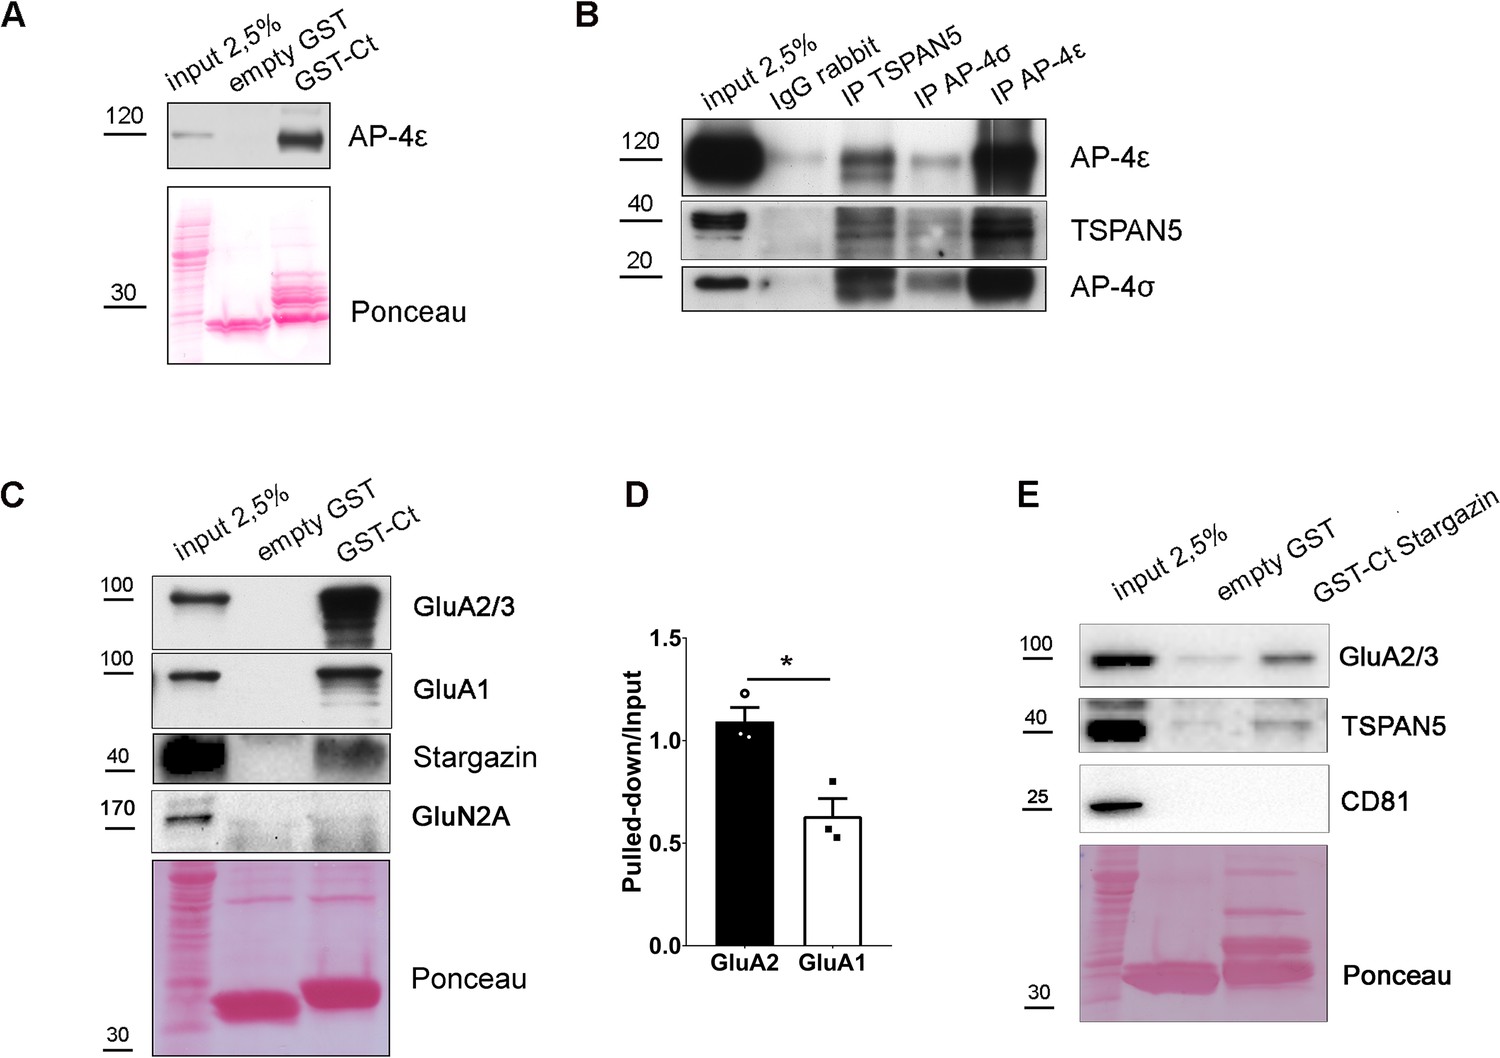
TSPAN5 interacts with AP4 and forms a complex with GluA2 and Stargazin.
(A) GST-pulldown experiment on adult rat hippocampus and cortex lysates using empty GST or GST fused to TSPAN5 C-terminus (GST-Ct). Input: 2.5% of pulldown volume. Blots probed for AP4ε. Red Ponceau shows the GST-bound fragments. (B) Co-immunoprecipitation experiment on adult rat hippocampus and cortex lysates. Input: 2.5% of the immunoprecipitated volume. Immunoprecipitation: α-rabbit IgG, α-TSPAN5, α-AP4σ, or α-AP4ε. Blots probed for TSPAN5, AP4σ, and AP4ε. (C) GST-pulldown experiments on adult rat hippocampus and cortex lysates using empty-GST or GST fused to the C-terminus of TSPAN5 (GST-Ct). Input: 2.5% of pulldown volume. Blots probed for GluA2/3, GluA1, Stargazin, and NMDAR subunit GluN2A. n = 3 independent experiments. Unpaired Student T test. (D) Quantification of experiment in panel C: intensity of the pulldown band for GluA2/3 and GluA1 each normalised on their input (pulldown/input: GluA2, 1.09±0.07; GluA1, 0.63±0.09). (E) GST-pulldown experiments on adult rat hippocampus and cortex lysates using empty-GST or GST-fused to the C-terminal of Stargazin (GST-Ct Stargazin). Input: 2.5% of pulldown volume. Blots probed for GluA2/3, TSPAN5, and CD81.
Values represent the mean ± SEM. *=p < 0.05, **=p < 0.01, ***=p < 0.001.
-
Figure 2—source data 1
List of the proteins identified with the yeast two-hybrid screening performed with full-length or C-terminal tail of TSPAN5 and individual data values for the bar graphs in panel D.
- https://cdn.elifesciences.org/articles/76425/elife-76425-fig2-data1-v1.xlsx
-
Figure 2—source data 2
Raw images and images with cropped areas highlighted of the blots in panels A, B, C, and E.
- https://cdn.elifesciences.org/articles/76425/elife-76425-fig2-data2-v1.zip
Figure 2—figure supplement 1
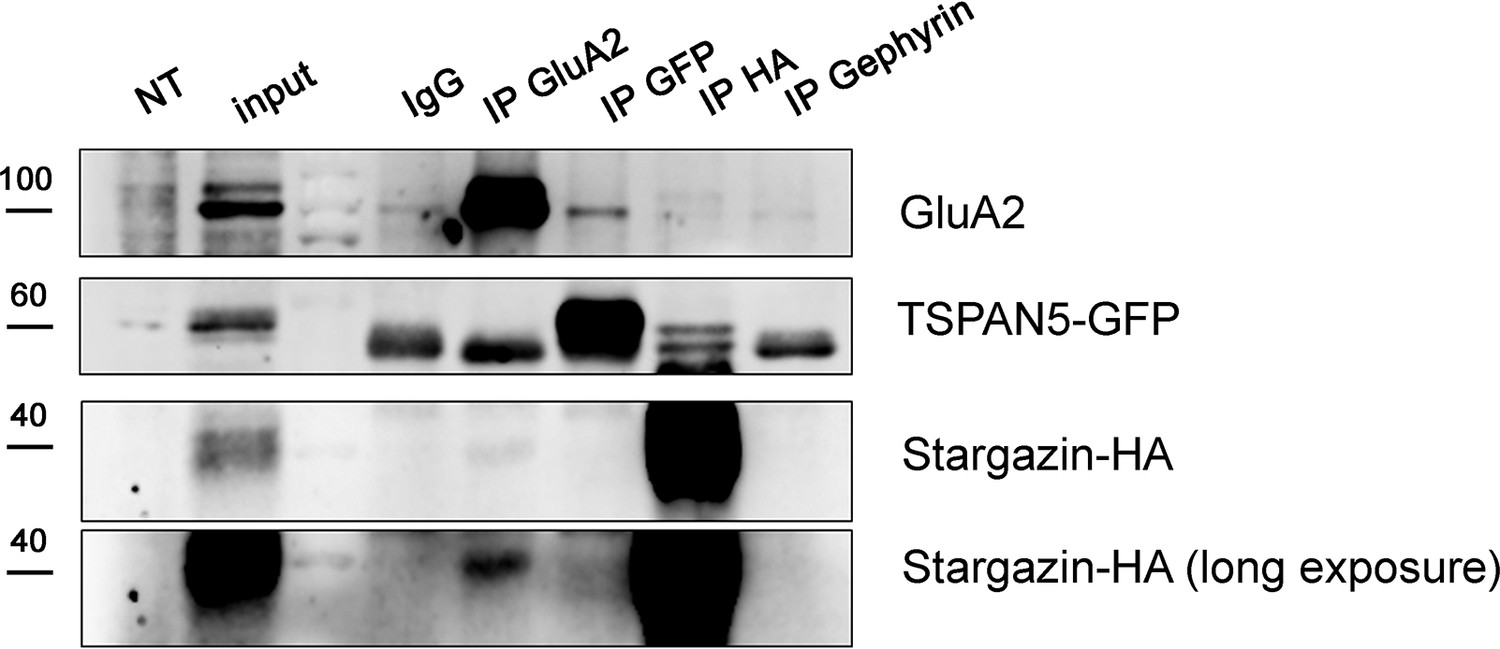
Immunoprecipitation experiment on Hela cells, transfected with TSPAN5-GFP, Stargazin-HA, and GluA2-myc.
NT, non-transfected control. Input: 5% of the immunoprecipitated volume. Immunoprecipitation: α-rabbit IgG, α-GluA2, α-GFP, α-HA. Blots probed for GluA2, GFP, and HA.
-
Figure 2—figure supplement 1—source data 1
Raw images and images with cropped areas highlighted of the blots presented.
- https://cdn.elifesciences.org/articles/76425/elife-76425-fig2-figsupp1-data1-v1.zip
Figure 3 with 1 supplement
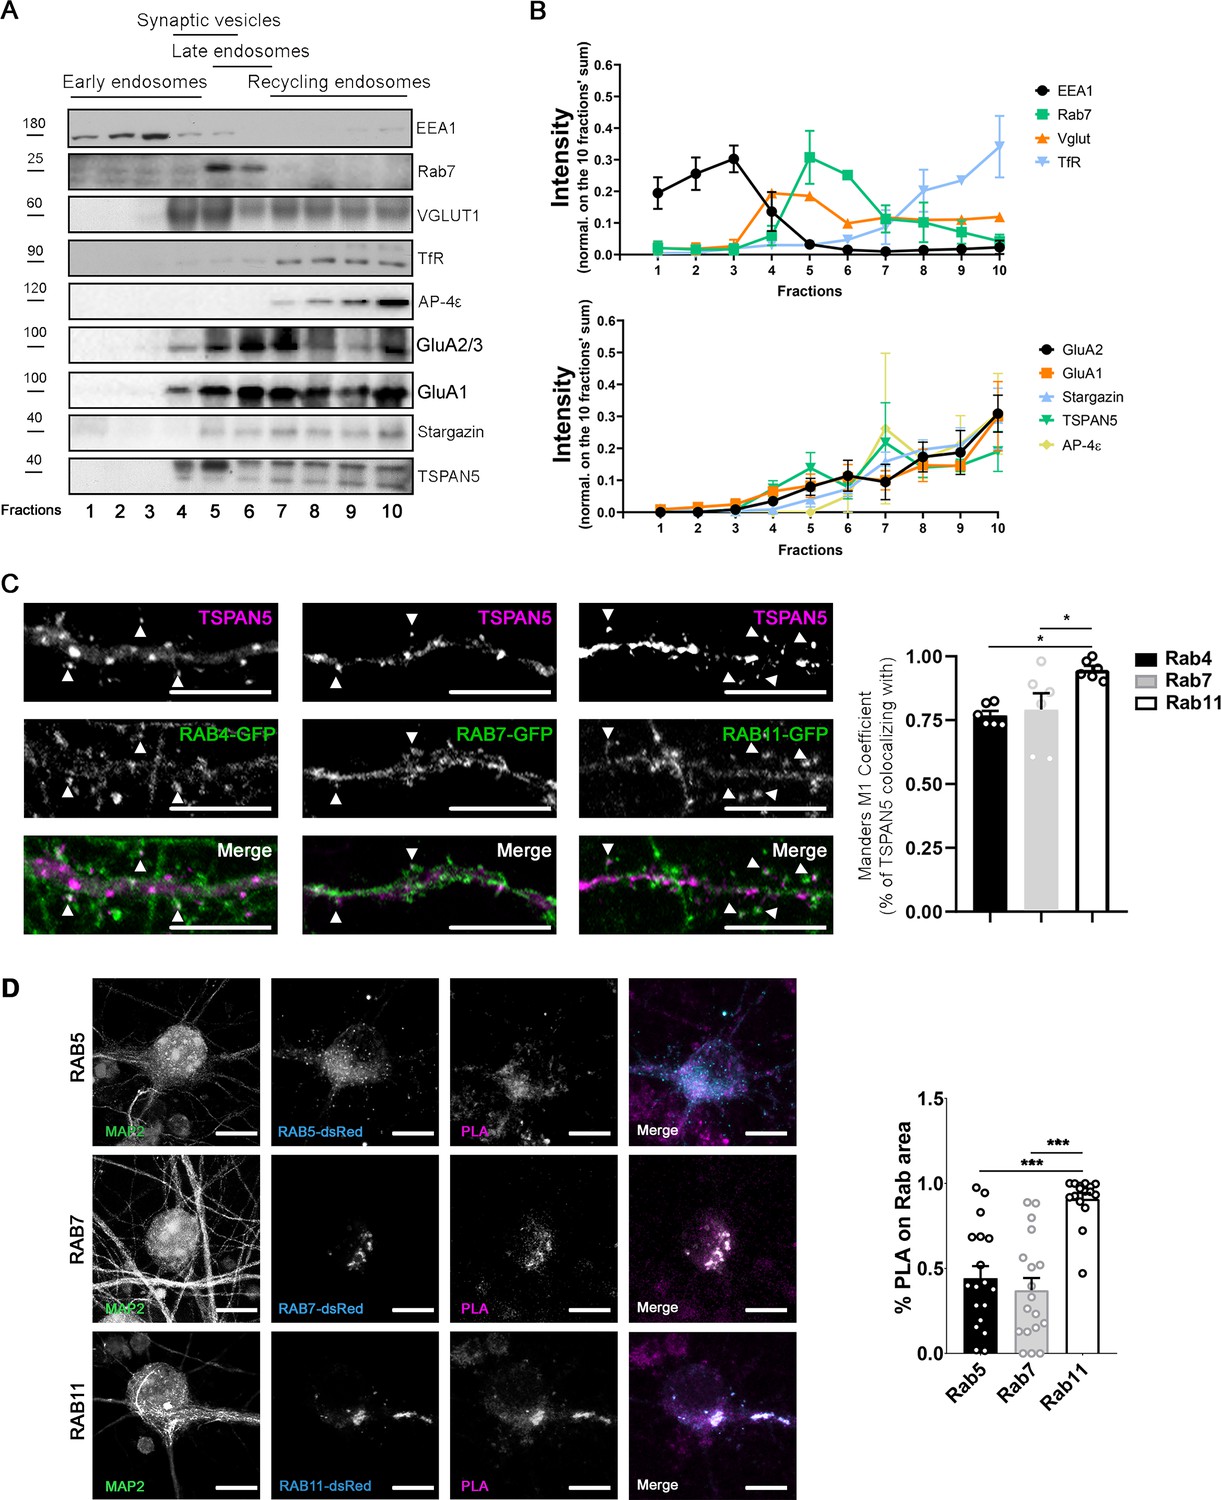
TSPAN5 complex with AP4, Stargazin, and α-amino-3-hydroxy-5-methyl-4-isoxazolepropionic acid receptors (AMPARs) localises in recycling endosomes.
(A) Vesicles fractionation from synaptosomes obtained from adult rat hippocampus and cortex. Ten isovolumetric fractions were isolated. Blots were probed for: EEA1 for early endosomes, Rab7 for late endosomes, VGLUT1 for synaptic vesicles, TfR for recycling endosomes, AP4ε, GluA1, GluA2/3, Stargazin, and TSPAN5. (B) Quantification of the experiment in panel A: the intensity of each band was normalised over the sum of the intensity of the bands in the 10 fractions. n = 3 separate experiments. (C) Top panel: Confocal images of DIV20 cultured rat hippocampal neurons transfected at DIV12 with plasmids encoding either Rab4-GFP, Rab7-GFP, or Rab11-GFP and immunolabelled for TSPAN5 (magenta). Colocalising puncta are highlighted by white arrowheads. Scale bar = 10 µm. Bottom panel: Quantification of TSPAN5 colocalisation (Mander’s M1 coefficient) with RAB4-GFP, RAB7-GFP, and RAB11-GFP (Mander’s M1 coefficient: Rab4, 0.77±0.02; Rab7, 0.79±0.06; 0.94±0.02). n = 6 neurons per condition. One Way ANOVA, Newman-Kulspost hoc multiple comparison test. (D) Left panel: Confocal images of DIV20 cultured mouse hippocampal neurons transfected at DIV12 with plasmids encoding either Rab5-DsRed, Rab7-DsRed, or Rab11-DsRed, immunolabelled for MAP2 (green) and subjected to proximity ligation assay (PLA) on TSPAN5 and GluA2 antibodies, with far red detection probe (magenta). DsRed signal is shown in cyan. Scale bar = 10 µm. Right panel: Quantification of PLA signal colocalisation with Rab5-DsRed, Rab7-DsRed, and Rab11-DsRed (Mander’s M1 coefficient: Rab5, 0.44±0.07; Rab7, 0.37±0.07; Rab11, 0.91±0.03). n = 16-18 neurons. One Way ANOVA, Newman-Kulspost hoc multiple comparison test.
Values represent the mean ± SEM. *=p < 0.05, **=p < 0.01, ***=p < 0.001.
-
Figure 3—source data 1
Individual data values for the graphs in panels B, C, and D.
- https://cdn.elifesciences.org/articles/76425/elife-76425-fig3-data1-v1.xlsx
-
Figure 3—source data 2
Raw images and images with cropped areas highlighted of the blots in panel A.
- https://cdn.elifesciences.org/articles/76425/elife-76425-fig3-data2-v1.zip
Figure 3—figure supplement 1
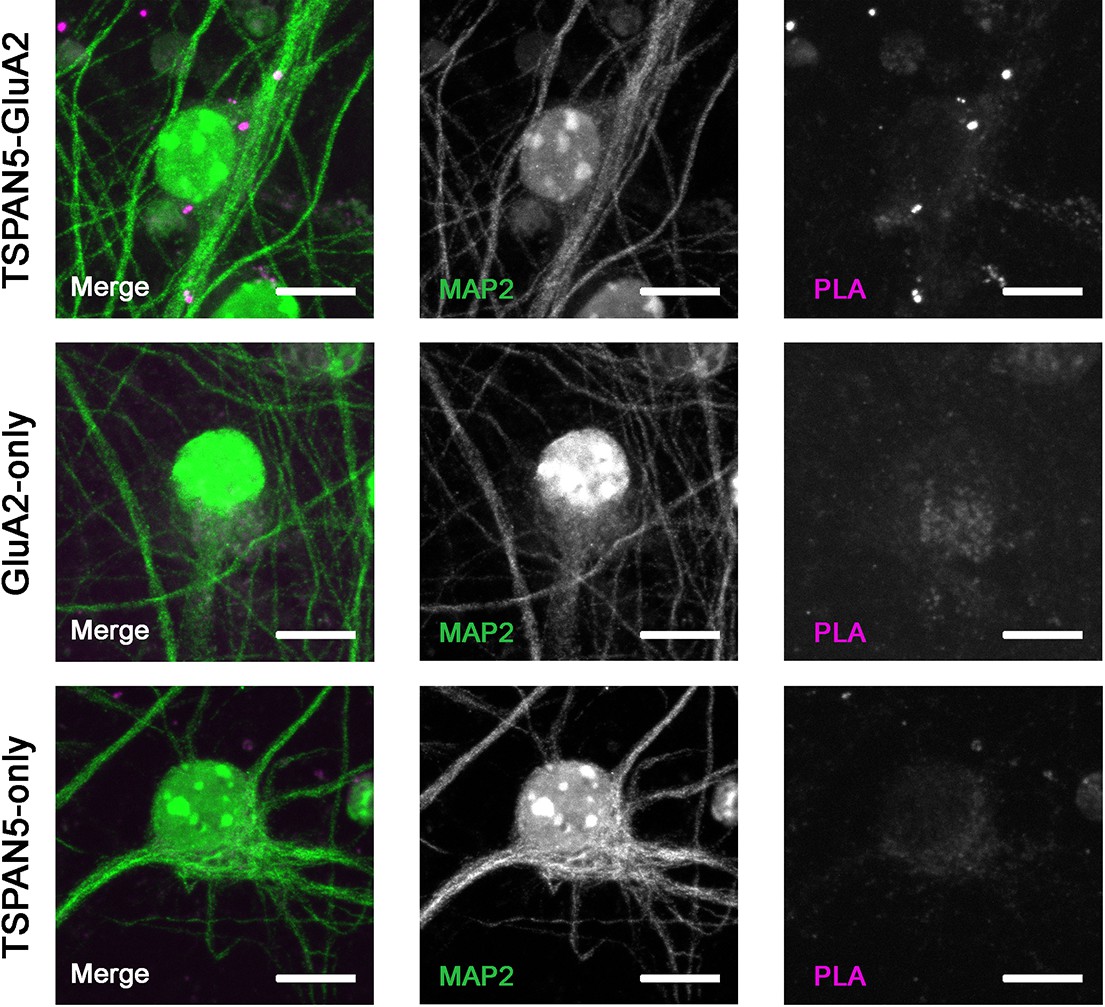
Control experiments for the proximity ligation assay (PLA).
The experiment was performed as described in the Methods section in the presence of both TSPAN5 and GluA2 antibodies or with TSPAN5 antibody only or with GluA2 antibody only and by incubation with both secondaries conjugated with DNA probes. The absence of PLA puncta in the two controls demonstrates the specificity of the signal. Scale bar = 10 µm.
Figure 4 with 1 supplement
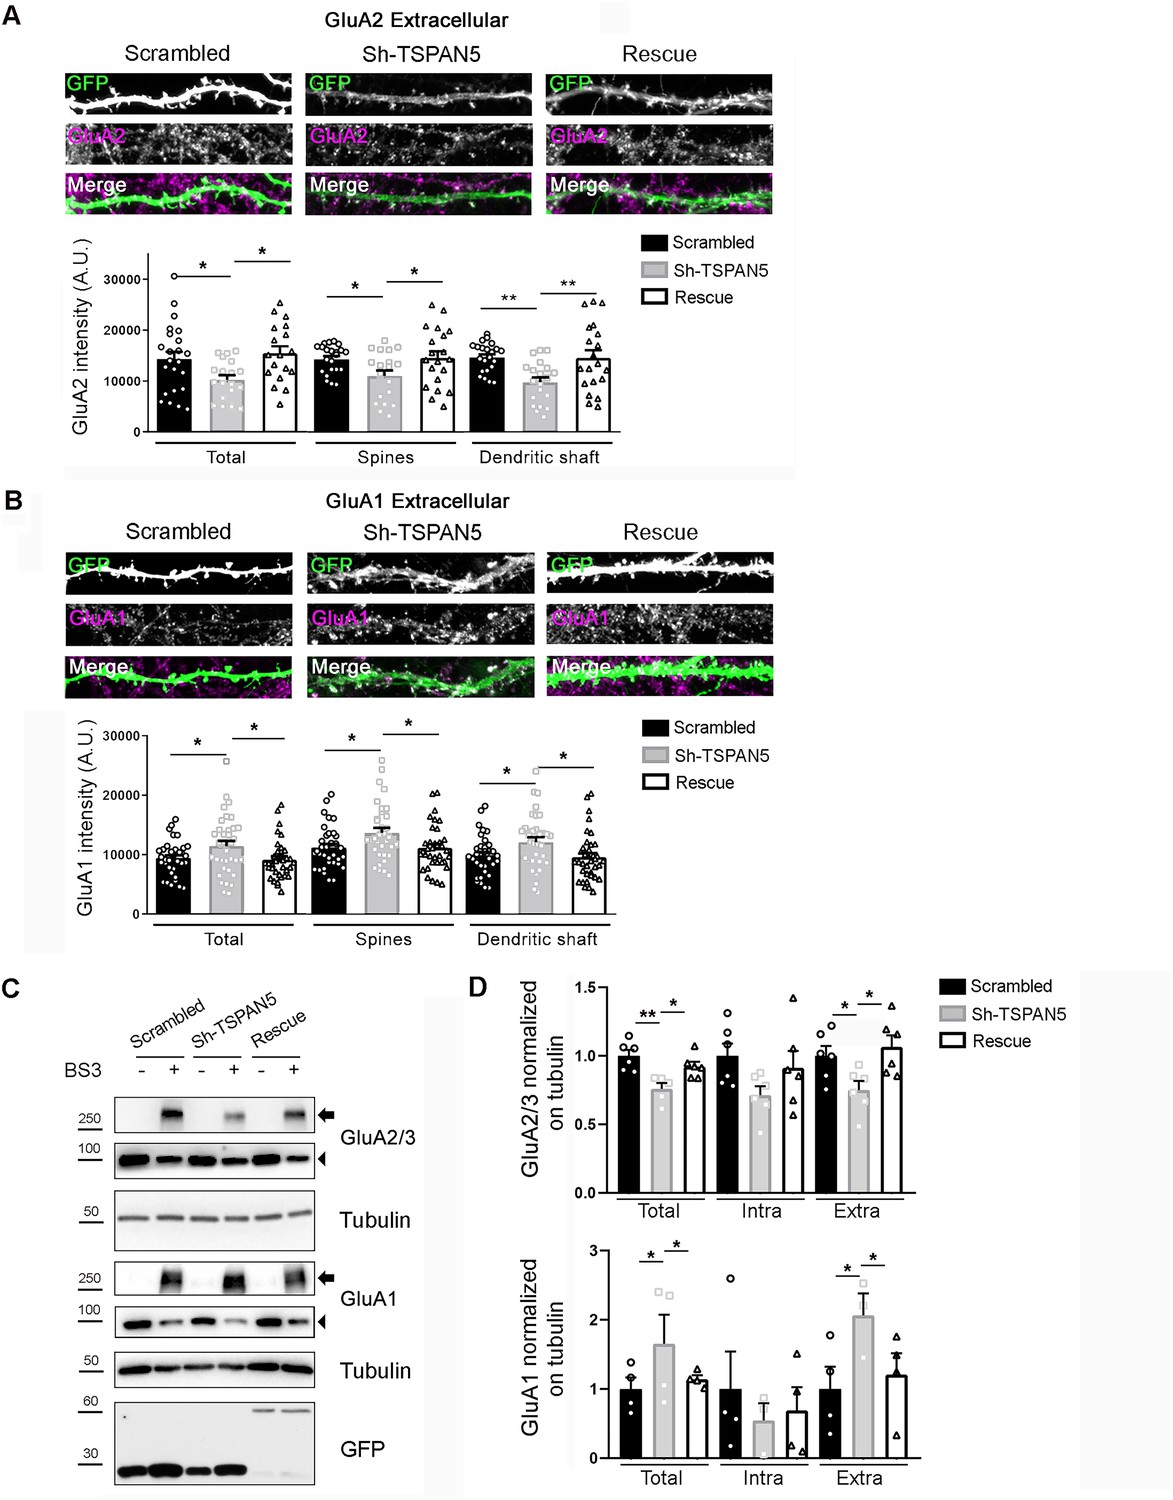
TSPAN5 depletion affects surface and total levels of the AMPAR subunits GluA2 and GluA1.
(A) Top panel: Confocal images of dendrites from cultured rat hippocampal neurons transfected at DIV12 with either scrambled, Sh-TSPAN5, or rescue constructs, all co-expressing GFP and immunostained at DIV20 with an antibody against an extracellular epitope of GluA2 (magenta) in non-permeabilising condition. Boxes are 20 μm wide. Full neurons are shown in Figure 4—figure supplement 1. Bottom panel: Quantification of surface GluA2 signal mean intensity on the whole GFP-positive area (GluA2 intensity [A.U.] total: scrambled 14302±1430, Sh-TSPAN5 10250±884, rescue 15476±1352); GluA2 mean intensity in dendritic spines (scrambled 14290±593; Sh-TSPAN5 11006±1055; rescue 14544±1293); GluA2 mean intensity in dendritic shafts (scrambled 14579±610; Sh-TSPAN5 9730±921; rescue 14512±1482). N = scrambled, 23; Sh-TSPAN5, 19; rescue, 18 neurons. One Way ANOVA, Newman-Kulspost hoc multiple comparison test. (B) Top panel: Confocal images of dendrites from cultured rat hippocampal neurons transfected at DIV12 with either scrambled, Sh-TSPAN, or rescue constructs, all co-expressing GFP and immunostained at DIV20 with an antibody against an extracellular epitope of GluA1 (magenta) in non-permeabilising condition. Boxes are 20 μm wide. Full neurons are shown in the Figure 4—figure supplement 1. Bottom panel: Quantification of GluA1 signal mean intensity on the whole GFP-positive area (GluA1 intensity [A.U.] total: scrambled 9404±494, Sh-TSPAN5 11492±817, rescue 9167±565); GluA1 mean intensity in dendritic spines (scrambled 11232±599; Sh-TSPAN5 13711±831; rescue 11185±634); GluA1 mean intensity in dendritic shafts (scrambled 9914±563; Sh-TSPAN5 12128±808; rescue 9610±678). N = scrambled, 35; Sh-TSPAN5, 36; rescue, 35 neurons. One Way ANOVA, Newman-Kulspost hoc multiple comparison test. (C) BS3 crosslinking on DIV20 cultured rat hippocampal neurons infected at DIV12 with lentiviral particles encoding for scrambled, Sh-TSPAN5, or rescue all co-expressing GFP. Blots probed for AMPARs subunits GluA2/3 and GluA1. Tubulin was used as a loading control, GFP was used as a control for infection. Arrowheads indicate total and intracellular bands, arrows indicate crosslinked plasma membrane bands. Full blots are shown in the Figure 4—figure supplement 1. (D) Quantification relative to panel C (GluA2/3: total/tubulin: scrambled 1±0.04, Sh-TSPAN5 0.76±0.06, rescue 0.91±0.04; intra/tubulin: scrambled 1±0.09, Sh-TSPAN5 0.71±0.09, rescue 0.91±0.14; extra/tubulin: scrambled 1±0.06, Sh-TSPAN5 0.75±0.09, rescue 1.08±0.08; GluA1: total/tubulin: scrambled 1±0.15, Sh-TSPAN5 1.65±0.22, rescue 1.14±0.0; intra/tubulin: scrambled 1±0.48, Sh-TSPAN5 0.5±0.4, rescue 0.69±0.44; extra/tubulin: scrambled 1±0.29, Sh-TSPAN5 2.06±0.14, rescue 1.21±0.23). n = 4/6 independent cultures. One Way ANOVA, Newman-Kulspost hoc multiple comparison test.
Values represent the mean ± SEM. *=p < 0.05, **=p < 0.01, ***=p < 0.001.
-
Figure 4—source data 1
Individual data values for the graphs in panels A, B, and D.
- https://cdn.elifesciences.org/articles/76425/elife-76425-fig4-data1-v1.xlsx
-
Figure 4—source data 2
Raw images and images with cropped areas highlighted of the blots in panel C.
- https://cdn.elifesciences.org/articles/76425/elife-76425-fig4-data2-v1.zip
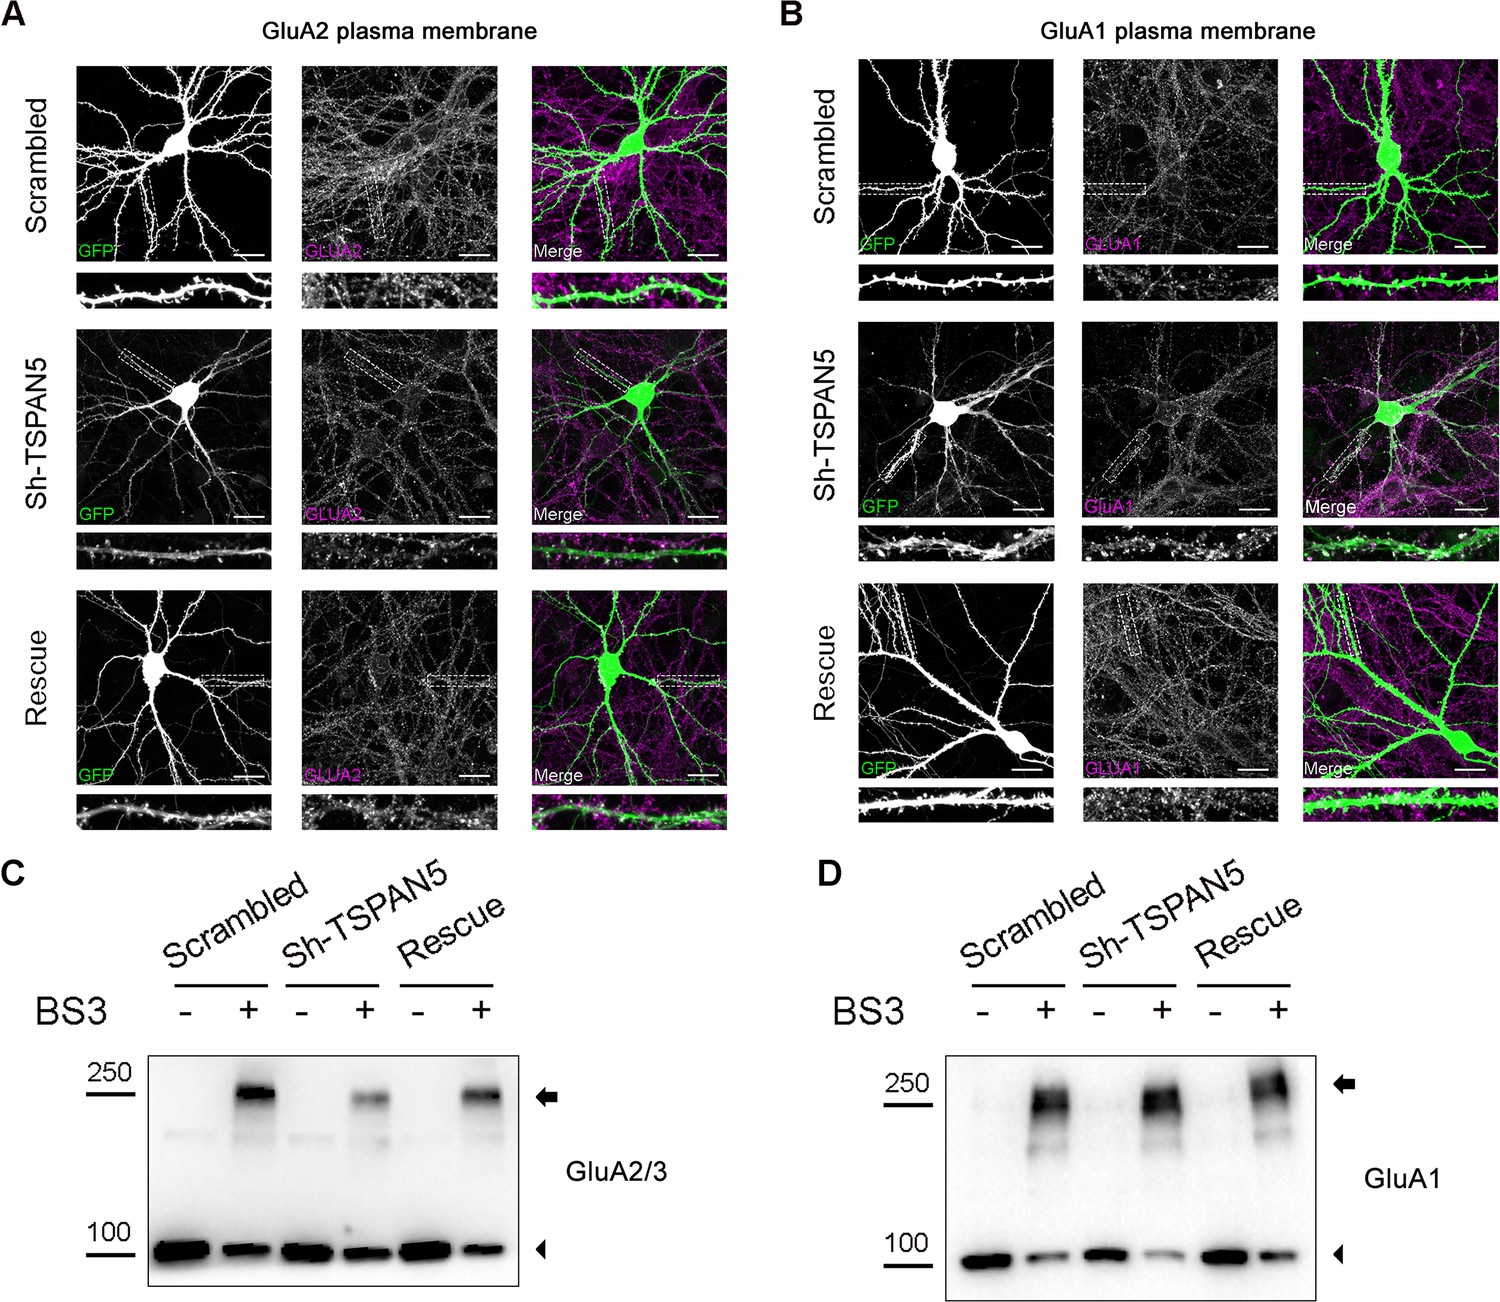
Figure 4—figure supplement 1
Full images and blots related to Figure 4.
(A) Confocal images of dendrites from cultured rat hippocampal neurons transfected at DIV12 with either scrambled, Sh-TSPAN5, or rescue constructs, all co-expressing GFP (green) and immunostained at DIV20 with an antibody against an extracellular epitope of GluA2 in non-permeabilised conditions (magenta). Inserts show higher magnification of the dendrites highlighted with a white dashed line, which are presented in Figure 4A. Scale bar = 20 µm. (B) Confocal images of dendrites from cultured rat hippocampal neurons transfected at DIV12 with either scrambled, Sh-TSPAN5, or rescue constructs all co-expressing GFP (green) and immunostained at DIV20 with an antibody against an extracellular epitope of GluA1 in non-permeabilised conditions (magenta). Inserts show higher magnification of the dendrites highlighted with a white dashed line, which are presented in Figure 4B. Scale bar = 20 µm. (C) Full blot for GluA2/3 from the experiment presented in Figure 4C. Arrowheads indicate total and intracellular bands, arrows indicate crosslinked plasma membrane bands. (D) Full blot for GluA1 from the experiment presented in Figure 4C. Arrowheads indicate total and intracellular bands, arrows indicate crosslinked plasma membrane bands.
Figure 5 with 2 supplements
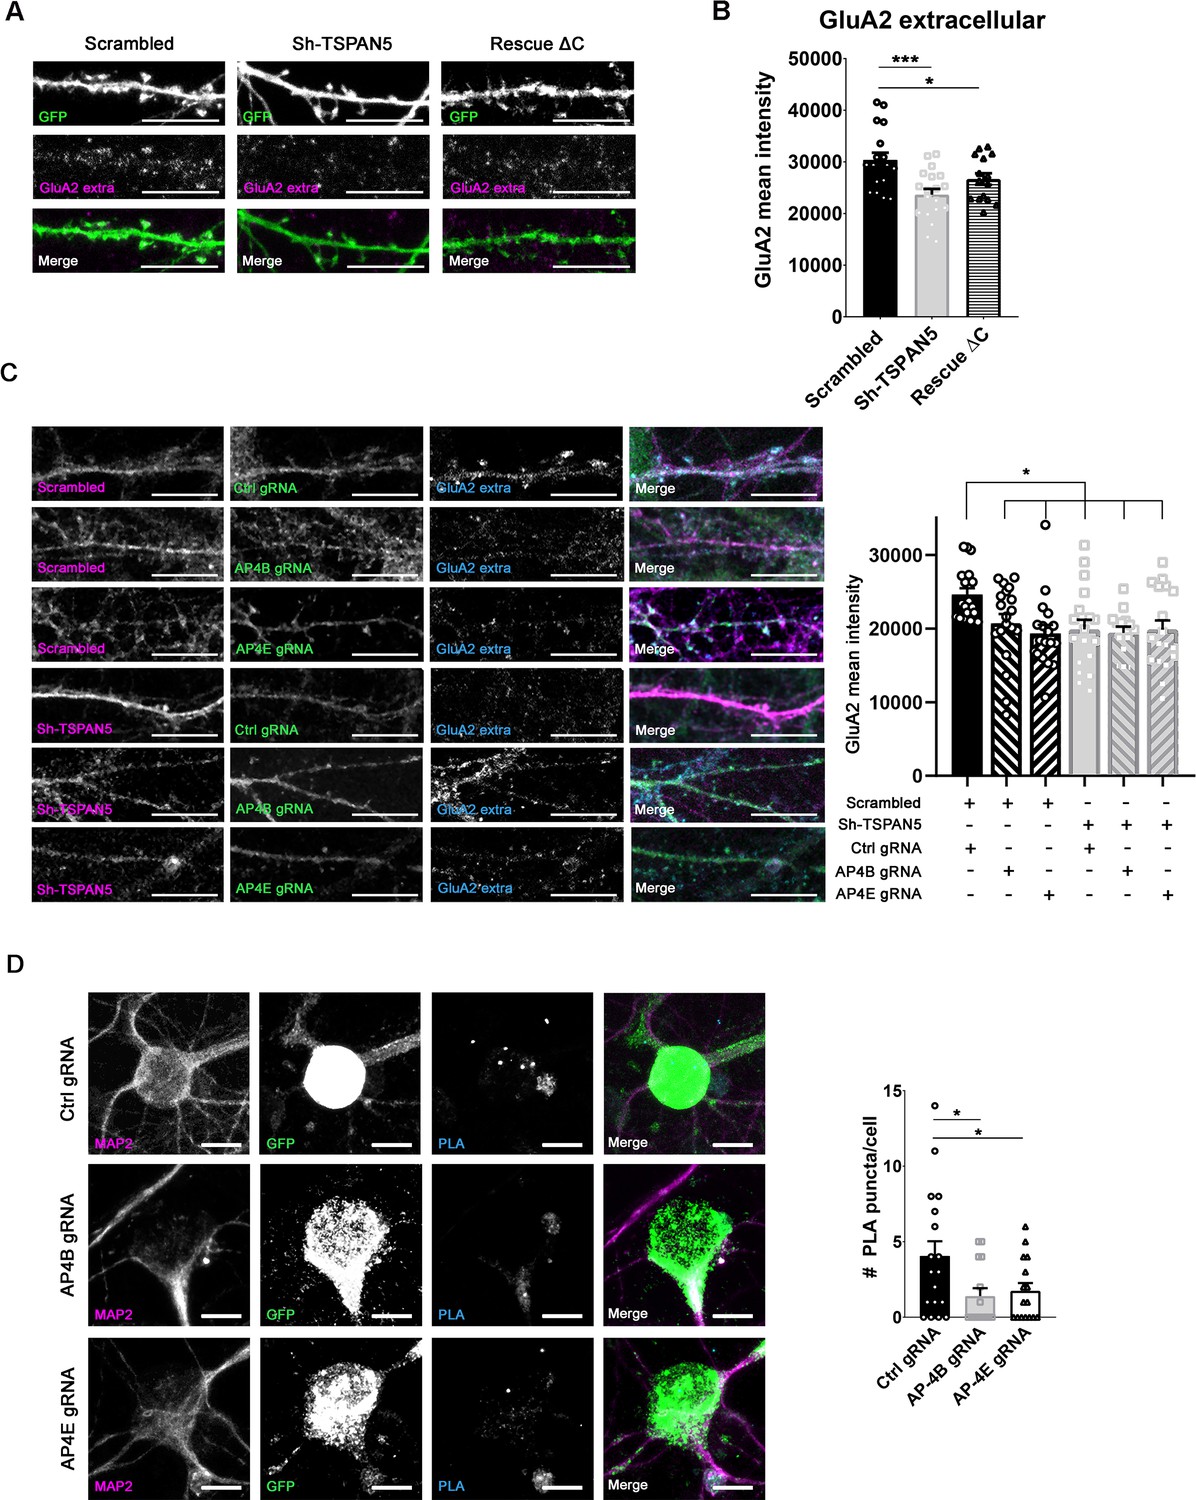
TSPAN5 and AP4 regulate surface GluA2 levels without affecting its internalisation.
(A) Confocal images of DIV20 cultured rat hippocampal neurons transfected with vectors coding for GFP (green) and either a scrambled ShRNA, the Sh-TSPAN5, and a construct carrying the ShTSPAN5 and the cDNA for TSPAN5 lacking the C-terminus (rescue ΔC), and surface stained at DIV20 for GluA2 (magenta). Scale bar = 10 µm. (B) Quantification of the intensity of the surface GluA2 signal: GluA2 mean intensity (scrambled 30384±1390; Sh-TSPAN5 23654±1113; rescue ΔC 26686±1116). n = 15/19 neurons. One Way ANOVA, Newman-Kulspost hoc multiple comparison test. (C) Left panel: Confocal images of DIV20 cultured rat hippocampal neurons transduced at DIV12 with lentiviral particles coding for an mCherry (magenta) and either scrambled or Sh-TSPAN5 and with lentiviral particles coding for a GFP (green), CRISPR/Cas9, and either a control guide RNA (Ctrl gRNA) or gRNAs directed against AP4B (AP4B gRNA) or AP4E (AP4E gRNA), respectively, and immunostained at DIV20 with an antibody against an extracellular epitope of GluA2 (cyan). Scale bar = 10 µm. Right panel: Quantification of the intensity of the GluA2 signal: GluA2 mean intensity (scrambled-Ctrl gRNA 24627±840; scrambled-AP4B gRNA 20737±1236; scrambled-AP4E gRNA 19339±1165; Sh-TSPAN5-Ctrl gRNA 19864±1331; Sh-TSPAN5-AP4B gRNA 19407±836; Sh-TSPAN5-AP4E gRNA 19836±1279). n = 18 neurons from three independent experiments. One Way ANOVA, Newman-Kulspost hoc multiple comparison test. (D) Left panel: Confocal images of DIV20 culture rat hippocampal neurons transfected at DIV12 with plasmid coding for a GFP (green), CRISPR/Cas9, and either a control guide RNA (Ctrl gRNA) or gRNAs directed against AP4B (AP4B gRNA) or AP4E (AP4E gRNA), respectively, immunostained for MAP2 (magenta) and subjected to proximity ligation assay (PLA) on TSPAN5 and GluA2 antibodies, with red detection probe (cyan). Scale bar = 10 µm. Right panel: Quantification of the density of PLA signal per cell (# PLA puncta/cell: Ctrl gRNA 4.1±1; AP4B gRNA 1.4±0.5; AP4E gRNA 1.8±0.5). n = 18, 15, 16 neurons, respectively from three independent experiments. One Way ANOVA, Newman-Kulspost hoc multiple comparison test.
Values represent the mean ± SEM. *=p < 0.05, **=p < 0.01, ***=p < 0.001.
-
Figure 5—source data 1
Individual data values for the graphs in panels B, C, and D.
- https://cdn.elifesciences.org/articles/76425/elife-76425-fig5-data1-v1.xlsx
Figure 5—figure supplement 1
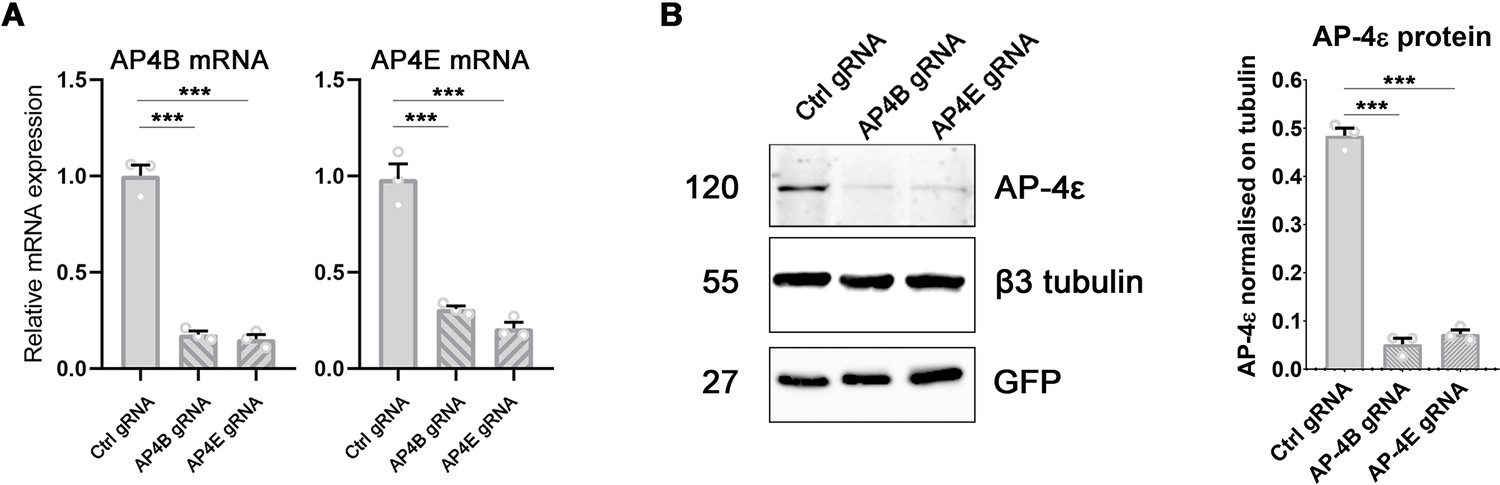
CRISPR/Cas9 knockdown of AP-4 subunits in hippocampal neurons.
(A) Real-time PCR quantification of the relative AP4B (left panel) and AP4E (right panel) mRNA levels in DIV20 cultured rat hippocampal neurons transduced at DIV12 with lentiviral particles coding for CRISPR/Cas9 and either a control guide RNA or guide RNAs directed against AP4B or AP4E, respectively. mRNA levels normalised to levels in Ctrl gRNA: AP4B (Ctrl gRNA 1±0.05; AP4B gRNA 0.18±0.02; AP4E gRNA 0.15±0.02); AP4E (Ctrl gRNA 1±0.08; AP4B gRNA 0.31±0.02; AP4E gRNA 0.21±0.03). n = 3 independent experiments. One Way ANOVA, Newman-Kulspost hoc multiple comparison test.(B) Left panel: Western blot of cultured rat hippocampal neurons lysed at DIV20 and transduced at DIV12 with lentiviral particles coding for GFP, CRISPR/Cas9, and either a control guide RNA or guide RNAs directed against AP4B or AP4E, respectively. Blots showing AP4ε, β3-tubulin as a loading control, and GFP as a control for infection. Right panel: Quantification of AP4ε intensity normalised on β3-tubulin: (AP4ε: Ctrl gRNA, 0.48±0.02; AP4B gRNA, 0.05±0.01; AP4E gRNA, 0.07±0.01). n = 3 independent experiments. One Way ANOVA, Newman-Kulspost hoc multiple comparison test.
Values represent the mean ± SEM. *=p < 0.05, **=p < 0.01, ***=p < 0.001.
-
Figure 5—figure supplement 1—source data 1
Individual data values for the graphs presented in panels A and B.
- https://cdn.elifesciences.org/articles/76425/elife-76425-fig5-figsupp1-data1-v1.xlsx
-
Figure 5—figure supplement 1—source data 2
Raw images and images with cropped areas highlighted of the blots in panel B.
- https://cdn.elifesciences.org/articles/76425/elife-76425-fig5-figsupp1-data2-v1.zip
Figure 5—figure supplement 2
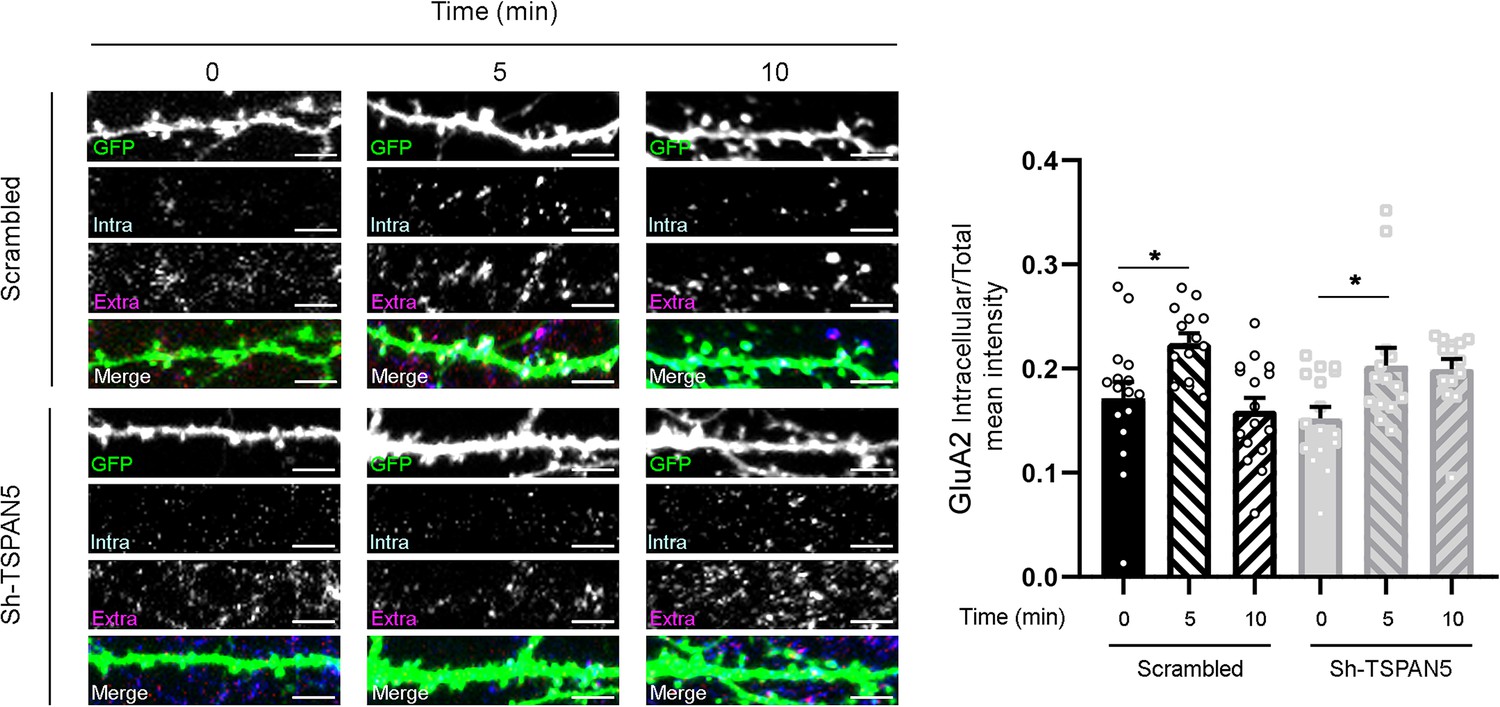
Left panel: Confocal images of secondary dendrites from DIV20 cultured rat hippocampal neurons transfected at DIV12 with either scrambled or Sh-TSPAN5 constructs, both co-expressing GFP.
After binding with α-GluA2 antibody, neurons were incubated for 0, 5, or 10 min. Secondary antibody was applied in non-permeabilising conditions for the extracellularly retained antibody (extra, magenta) and in permeabilising condition for the internalised one (Iintra, cyan). Scale bar = 5 μm. Right panel: Quantification of GluA2 intracellular level normalised on total level (intracellular + extracellular). (GluA2 intracellular/total mean intensity: scrambled 0 min 0.18±0.01, scrambled 5 min 0.22±0.01, scrambled 10 min 0.20±0.01, Sh TSPAN5 0 min 0.16±0.01, Sh-TSPAN5 5 min 0.20±0.02, Sh-TSPAN5 10 min 0.21±0.01). n = scrambled 0 min, 14; scrambled 5 min, 14; scrambled 10 min, 16 Sh-TSPAN5 0 min, 16; Sh TSPAN5 5 min, 14; Sh-TSPAN5 10 min, 14 neurons. One Way ANOVA, Newman-Kulspost hoc multiple comparison test.
Values represent the mean ± SEM. *=p < 0.05, **=p < 0.01, ***=p < 0.001.
-
Figure 5—figure supplement 2—source data 1
Individual data values for the graphs presented.
- https://cdn.elifesciences.org/articles/76425/elife-76425-fig5-figsupp2-data1-v1.xlsx
Figure 6 with 1 supplement
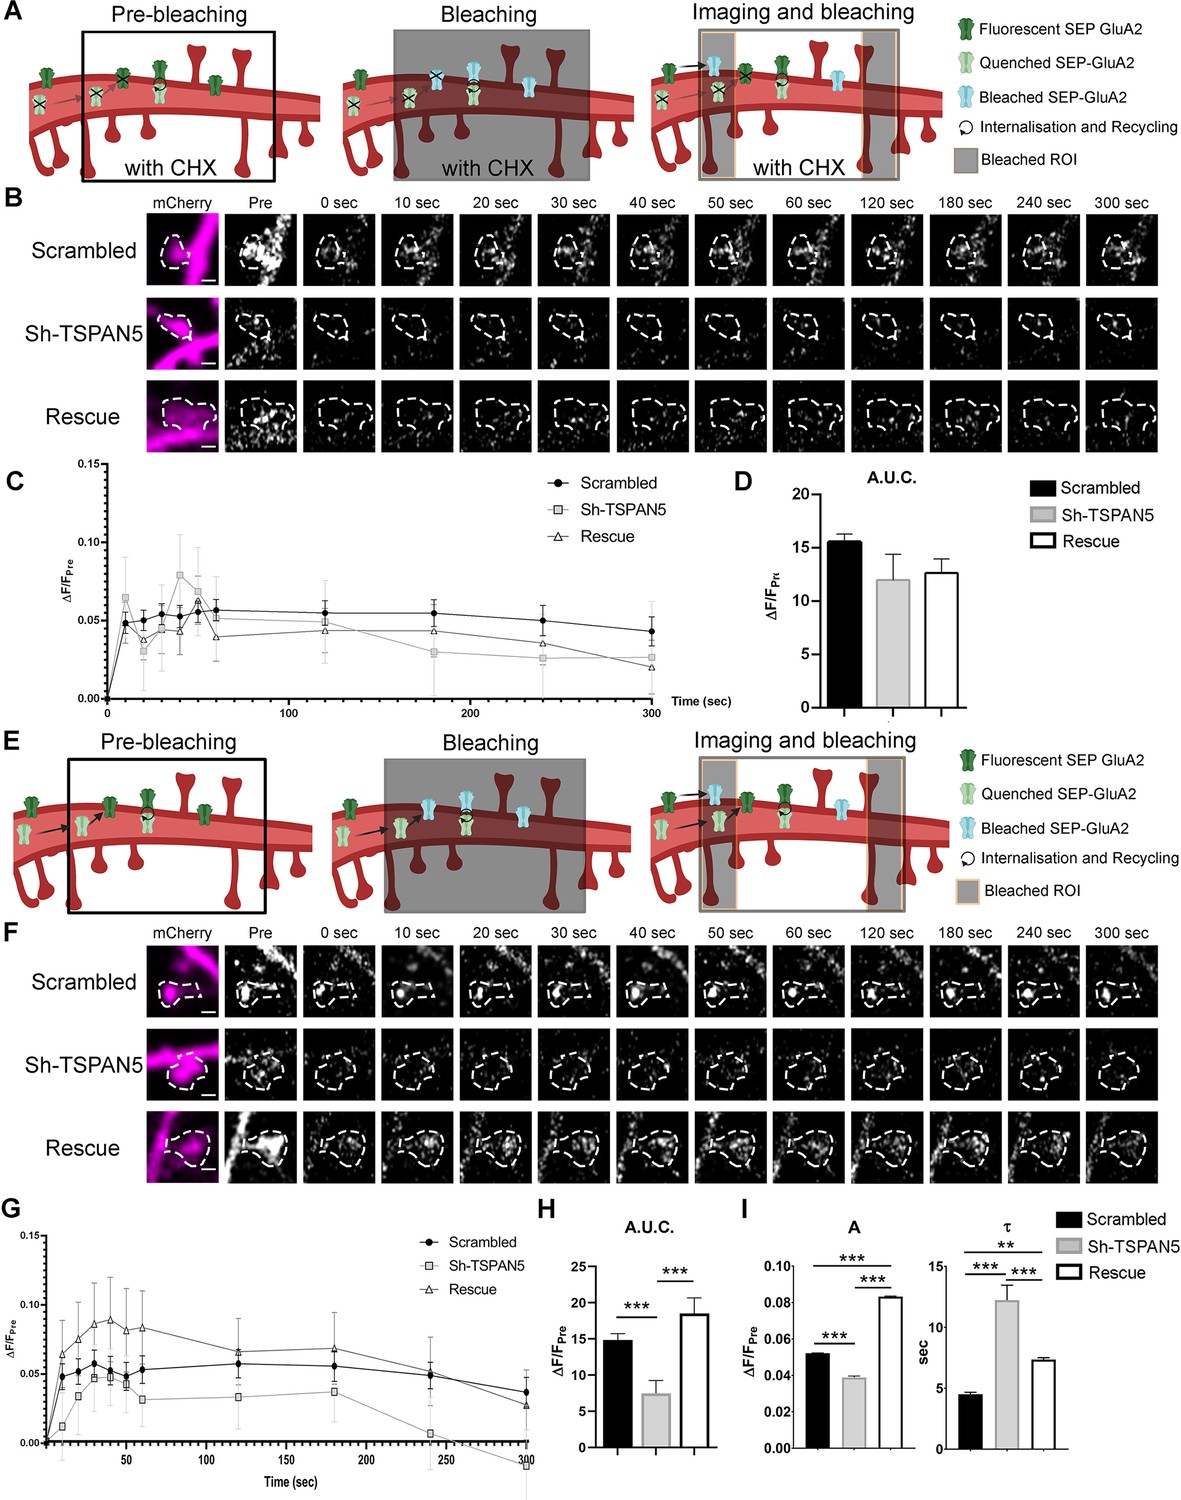
TSPAN5 regulates exocytosis of GluA2-containing α-amino-3-hydroxy-5-methyl-4-isoxazolepropionic acid receptors (AMPARs).
(A) Schematic of the FRAP-FLIP experiment presented in panel B. SEP-GluA2 in pre-bleaching condition is either fluorescent (green) if exposed to the extracellular media or quenched (light green) if in intracellular compartments. A region of the dendrite is bleached (black box). SEP-GluA2 that was fluorescent (and so extracellularly exposed) at the time of bleaching becomes bleached (light blue). Quenched SEP-GluA2 is not affected by the bleaching. During imaging, the ROI flanking regions are continuously bleached (black lateral boxes), thus lateral diffusing SEP-GluA2 will be bleached. Receptors that have been internalised and directed for recycling are exocytosed and become fluorescent. Newly synthesised receptors would not be present due to the application of cycloheximide (CHX) (crossed out receptors). Controls for pH sensitivity of the SEP signal are shown in Figure 6—figure supplement 1. (B) Live confocal images of individual dendritic spines from DIV20 cultured rat hippocampal neurons transfected at DIV12 with SEP-GluA2 and either scrambled, Sh-TSPAN5, or rescue construct co-expressing mCherry. Neurons were treated for 2 hr with 200 μg/ml of cycloheximide to inhibit protein synthesis and then imaged under a FRAP-FLIP protocol for 5 min to isolate the recycling receptors. mCherry (magenta) and SEP-GluA2 (white) images (time points: prebleach, postbleach, 10, 20, 30, 60, 120, 180, 240, and 300 s) are shown. The dendritic spine mask is depicted with white dashed line. Scale bar =1 µm. (C) Quantification of the ΔF/Fpre for SEP-GluA2 over time for scrambled-, Sh-TSPAN5-, and rescue-transfected neurons. (D) Quantification of the area under the curve relative to panel B (area under the curve [A.U.]: scrambled 15.56±0.74, Sh-TSPAN5 11.99±2.51, rescue 11.77±1.31). n = scrambled, 56; Sh-TSPAN5, 53; rescue, 53 dendritic spines. One Way ANOVA, Newman-Kulspost hoc multiple comparison test.(E) Schematic of the FRAP-FLIP experiment presented in panel F. SEP-GluA2 at basal condition is either fluorescent (green) if exposed to the extracellular media or quenched (light green) if in intracellular compartments. A region of the dendrite is bleached (black box). SEP-GluA2 that was fluorescent (and so extracellularly exposed) at the time of bleaching becomes bleached (light blue). Quenched SEP-GluA2 is not affected by the bleaching. During imaging the ROI flanking regions are continuously bleached (black box), thus lateral diffusing SEP-GluA2 will be bleached. Receptors that have been internalised and directed for recycling are exocytosed and become fluorescent. Newly synthesised receptors could also travel in intracellular vesicles to be exocytosed and become fluorescent. (F) Confocal images of individual dendritic spines from DIV20 cultured rat hippocampal neurons transfected at DIV12 with SEP-GluA2 and either scrambled, Sh-TSPAN5, or rescue construct co-expressing mCherry. Neurons were imaged under a FRAP-FLIP protocol for 5 min to analyse receptor exocytosis. mCherry (magenta) and SEP-GluA2 (white) images (time points: prebleach, postbleach, 10, 20, 30, 60, 120, 180, 240, and 300 s) are shown. The dendritic spine mask is depicted with white dashed line. Scale bar =1 µm. (G) Quantification of the ΔF/Fpre for SEP-GluA2 over time for scrambled-, Sh-TSPAN5-, and rescue-transfected neurons. (H) Quantification of the area under the curve relative to panel E (area under the curve [A.U.]: scrambled 14.85±0.89, Sh-TSPAN5 7.49±1.77, rescue 18.5±2.18). One Way ANOVA, Newman-Kulspost hoc multiple comparison test. (I) Quantification of the parameters A and τ, representative of the steady state ΔF/Fpre and of the time constant of the exocytosis kinetics, based on the fitting of the first eight time points with the exponential function ( a (ΔF/Fpre): scrambled, 0.0522±0.0002; Sh-TSPAN5, 0.0388±0.0008; rescue, 0.0832±0.0003). (τ (s): scrambled, 4.5±0.2; Sh-TSPAN5, 12.2±1.2; rescue, 7.4±0.2). n = scrambled, 56; Sh-TSPAN5, 35; rescue, 29 dendritic spines. One Way ANOVA, Newman-Kulspost hoc multiple comparison test.
Values represent the mean ± SEM. *=p < 0.05, **=p < 0.01, ***=p < 0.001.
-
Figure 6—source data 1
Individual data values for the graphs presented in panels C and G.
- https://cdn.elifesciences.org/articles/76425/elife-76425-fig6-data1-v1.xlsx
Figure 6—figure supplement 1
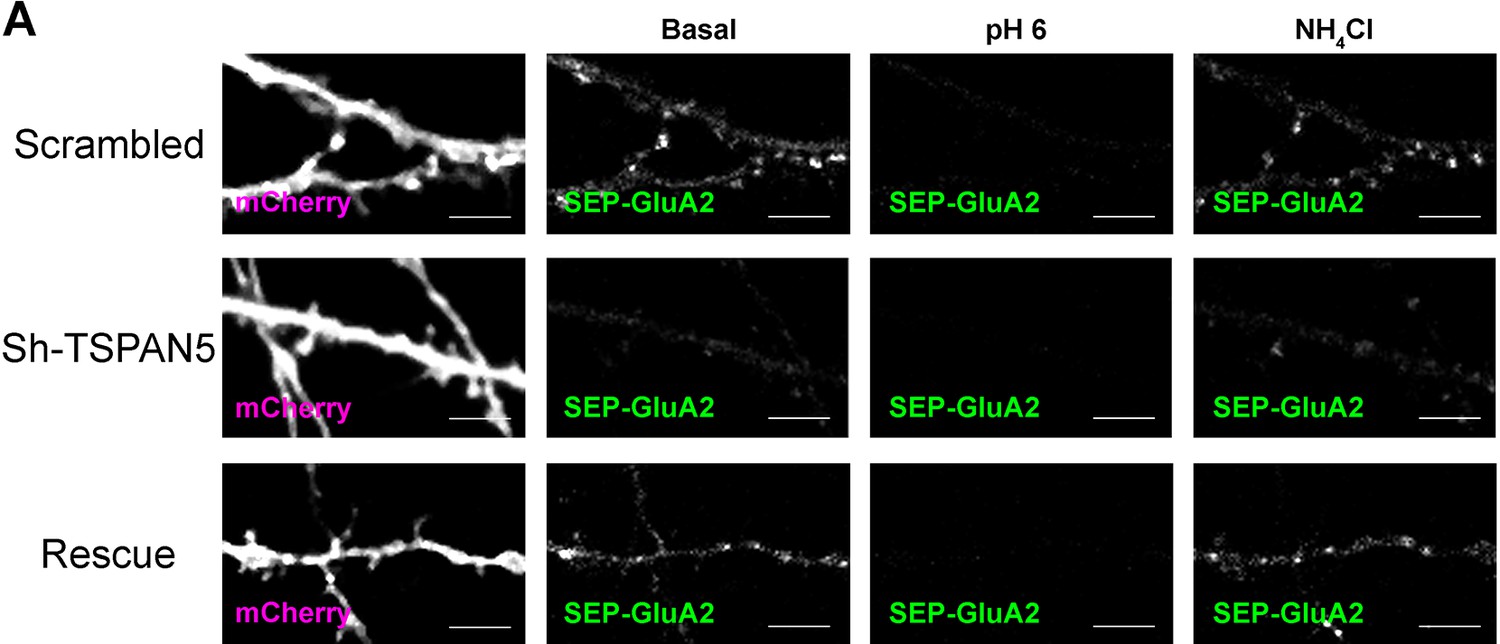
Control experiments for SEP-GluA2 sensitivity to pH.
(A) Live confocal images of DIV20 culture rat hippocampal neurons transfected with SEP-GluA2 (green) and either scrambled, Sh-TSPAN5, or rescue construct co-expressing mCherry (magenta). Neurons were imaged in basal conditions, after exposure to pH 6 imaging media or after exposure to media containing 5 mM NH4Cl, to alkalinise intracellular compartments. Scale bar = 5 µm.
Figure 7 with 1 supplement

TSPAN5 regulates exocytosis of newly synthesised α-amino-3-hydroxy-5-methyl-4-isoxazolepropionic acid receptors (AMPARs), possibly by preventing their degradation via the lysosomal pathway.
(A) Schematic of the ARIAD-GluA2 construct. (B) In basal conditions (Berditchevski, 2001), ARIAD-GluA2 is retained in the endoplasmic reticulum (ER) due to the self-assembly properties of the conditional aggregation domain (CAD). Upon application (Charrin et al., 2002), the ARIAD ligand binds to CAD, inhibits self-assembly and allows the ARIAD-GluA2 to move to the Golgi where the endogenous Furin protease cleaves the CAD. ARIAD-GluA2 can now be loaded onto secretory vesicles (Charrin et al., 2014), transported along the dendrites, and subsequently exocytosed (Hemler, 2005). Application of an anti-myc antibody in the culture medium allows for the detection of the plasma membrane pool of GluA2 that was released from the ER after application of the ARIAD ligand. (C) Left panel: Confocal images of DIV20 rat cultured hippocampal neurons transfected at DIV12 with the ARIAD-myc-GluA2 construct and with a plasmid coding for GFP (green) and either scrambled, Sh-TSPAN5, or rescue, and immunostained with an anti-myc antibody in live staining conditions (magenta) 90 min after the application of the ARIAD ligand. Scale bar = 5 µm. Right panel: Quantification of the surface anti-myc mean intensity normalised to scrambled (scrambled 100±7.14; Sh-TSPAN5 71.44±6.81; rescue 101.4±7.92). n = 27–31 neurons per condition. One Way ANOVA, Newman-Kulspost hoc multiple comparison test.(D) Confocal images of secondary dendrites from DIV20 rat cultured hippocampal neurons transfected at DIV12 with either scrambled or Sh-TSPAN5 constructs, both co-expressing GFP. Neurons were treated for 90 min with either vehicle (H2O) or leupeptin (100 μM), fixed and immunostained for GLUA2/3 (magenta). Scale bar = 5 μm. (E) Relative quantification of GluA2/3 staining mean intensity (GluA2/3 mean intensity: scrambled vehicle 31.25±2.43; scrambled leupeptin: 36.95±2.25: Sh-TSPAN5 vehicle: 24.51±1.35; Sh-TSPAN5 leupeptin 33.3±2.22). n = scrambled vehicle, 20; scrambled leupeptin, 20; Sh-TSPAN5 vehicle, 20; Sh-TSPAN5 leupeptin, 20 neurons. One Way ANOVA, Newman-Kulspost hoc multiple comparison test. (F) Left panel: Confocal images of DIV20 rat cultured hippocampal neurons transfected at DIV12 with the ARIAD-myc-GluA1 construct and with a plasmid coding for GFP (green) and either scrambled, Sh-TSPAN5, or rescue, and immunostained with an anti-myc antibody in live staining conditions (magenta) 90 min after the application of the ARIAD ligand. Scale bar = 5 µm. Right panel: Quantification of the surface anti-myc mean intensity normalised to scrambled (scrambled 95.32±5.07; Sh-TSPAN5 52.49±4.95; rescue 81.064±6.2). n = 27–29 neurons per condition. One Way ANOVA, Newman-Kulspost hoc multiple comparison test.
Values represent the mean ± SEM. *=p < 0.05, **=p < 0.01, ***=p < 0.001.
-
Figure 7—source data 1
Individual data values for the graphs presented in panels C, E, and F.
- https://cdn.elifesciences.org/articles/76425/elife-76425-fig7-data1-v1.zip
Figure 7—figure supplement 1
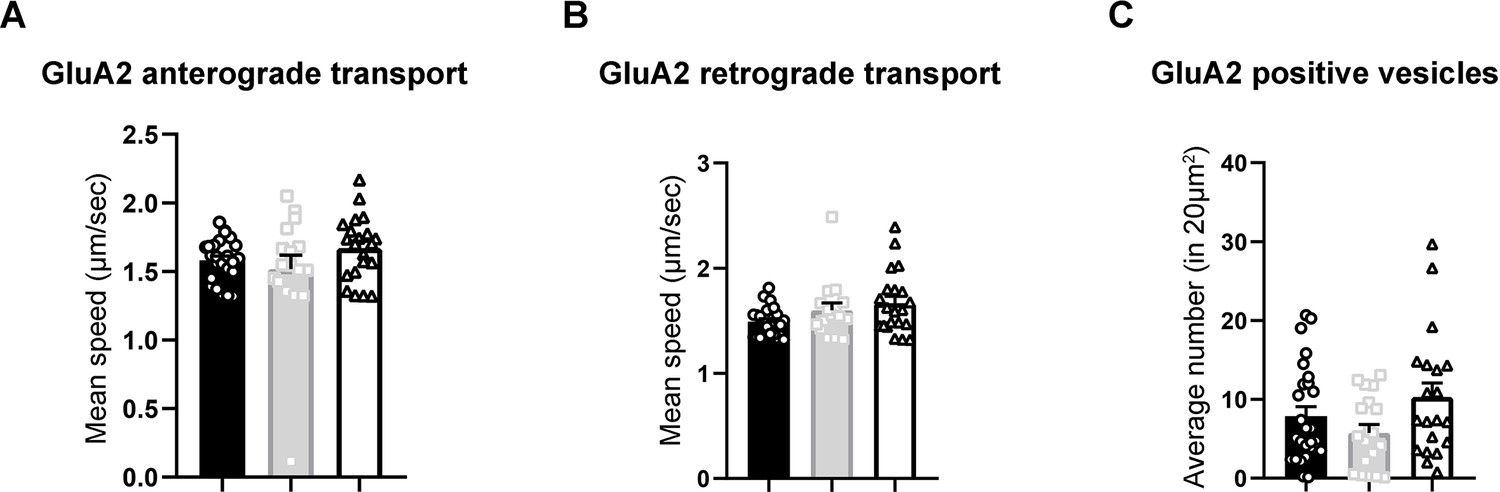
TSPAN5 knockdown does not affect intracellular transport speed or number of vesicles containing GluA2.
(A) Quantification of the average speed of tdTomato-positive organelles moving from the soma outwards along dendrites after application of the ARIAD ligand in DIV20 rat cultured hippocampal neurons transfected with ARIAD-tdTomato-GluA2 and with either scrambled, Sh-TSPAN5, or rescue. Mean speed (µm/s) (scrambled 1.58±0.03; Sh-TSPAN5 1.52±0.1; rescue 1.67±0.05). n = 17/25 neurons. One Way ANOVA, Newman-Kulspost hoc multiple comparison test. (B) Quantification of the average speed of tdTomato-positive organelles moving from the dendrites towards the soma after application of the ARIAD ligand in DIV20 rat cultured hippocampal neurons transfected with ARIAD-tdTomato-GluA2 and with either scrambled, Sh-TSPAN5, or rescue. Mean speed (µm/s) (scrambled 1.67±0.21; Sh TSPAN5 1.81±0.22; rescue 1.67±0.07). n = 17/27 neurons. One Way ANOVA, Newman-Kulspost hoc multiple comparison test. (C) Quantification of the average number of tdTomato-positive vesicles in a 20 µm2 stretch of a dendrite after application of the ARIAD ligand in DIV20 rat cultured hippocampal neurons transfected with ARIAD-tdTomato-GluA2 and with either scrambled, Sh-TSPAN5, or rescue. Average number per 20 µm2 (scrambled 7.9±1.2; Sh TSPAN5 5.8±1.1; rescue 10.3±1.8). n = 19/27 neurons. One Way ANOVA, Newman-Kulspost hoc multiple comparison test.
Values represent the mean ± SEM. *=p < 0.05, **=p < 0.01, ***=p < 0.001.
-
Figure 7—figure supplement 1—source data 1
Individual data values for the graphs presented in panels A, B, and C.
- https://cdn.elifesciences.org/articles/76425/elife-76425-fig7-figsupp1-data1-v1.xlsx
Figure 8
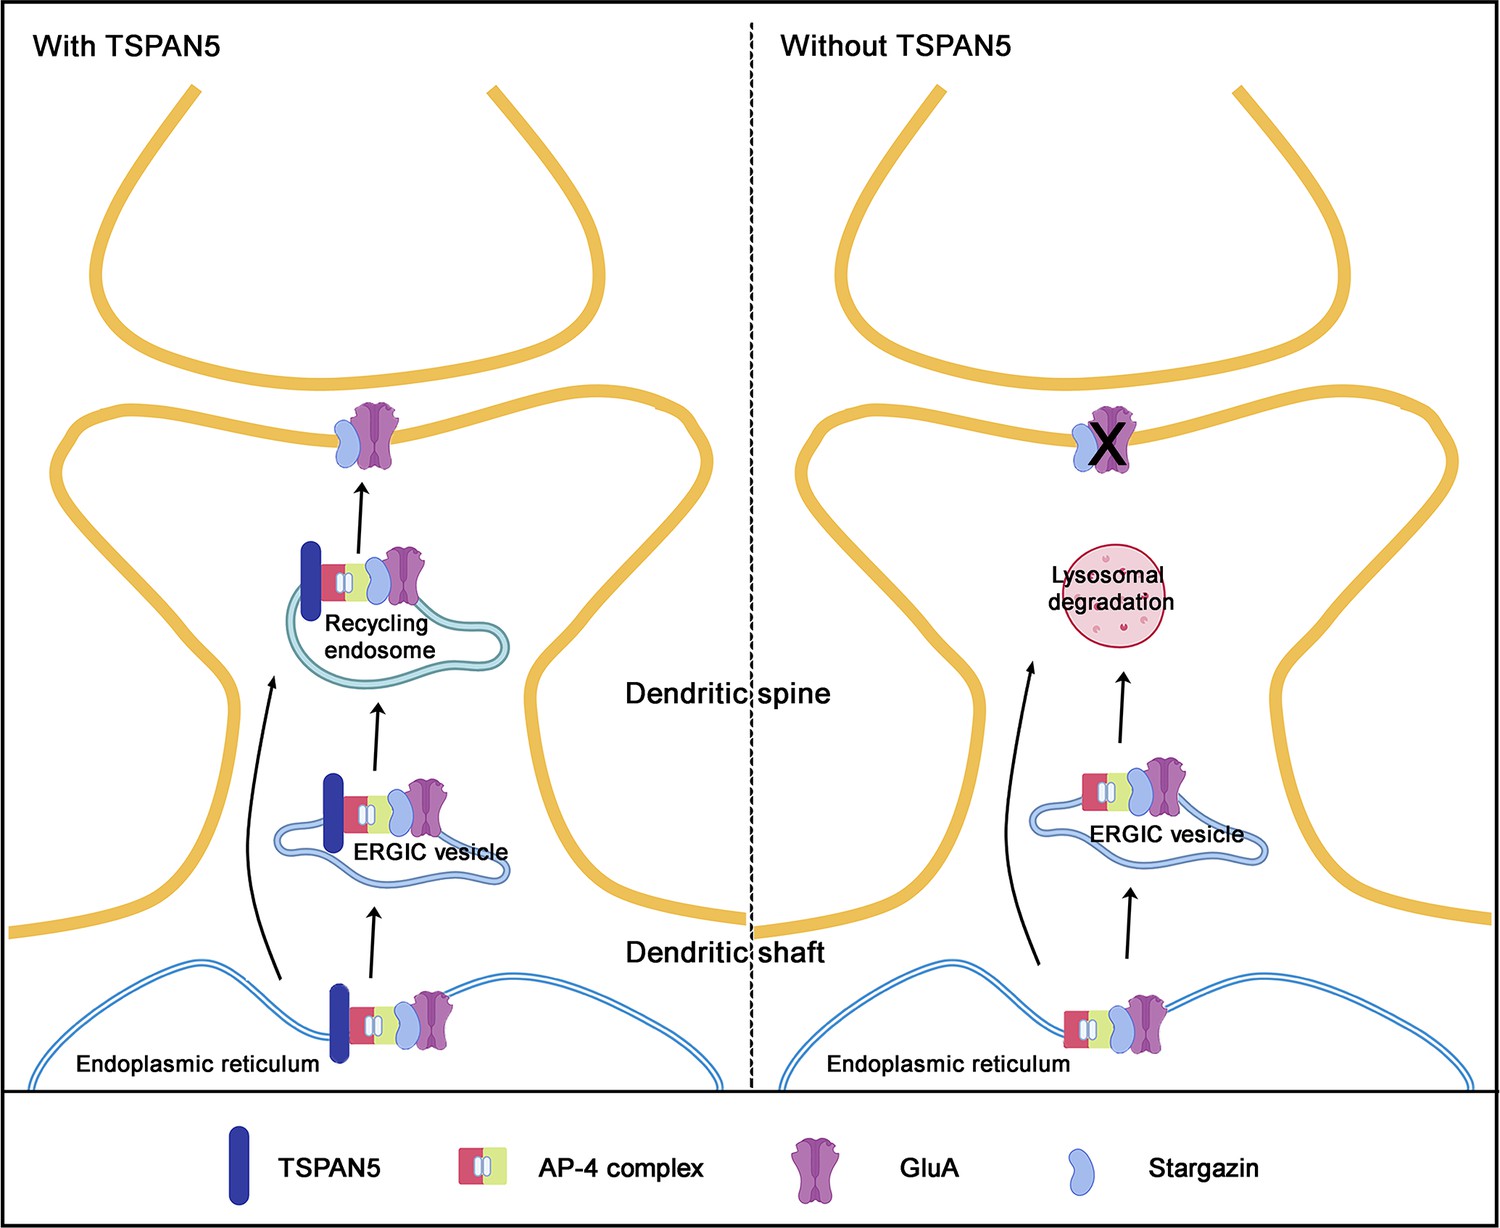
TSPAN5 regulates α-amino-3-hydroxy-5-methyl-4-isoxazolepropionic acid receptors (AMPARs) exocytosis through recycling endosomes by the formation of a tetrameric complex with AP4 and Stargazin.
Working model of TSPAN5 function in mature neurons (left) and TSPAN5 silencing effects (right). TSPAN5 forms a complex with Stargazin and AMPARs in the endoplasmic reticulum or in endoplasmic reticulum-Golgi intermediate compartment (ERGIC) vesicles. The presence of TSPAN5 is necessary to direct the GluA2 and Stargazin complex to the plasma membrane. TSPAN5 silencing in neurons induces the redirection of GluA2-containing vesicles to lysosomal degradation.
Additional files
Download links
A two-part list of links to download the article, or parts of the article, in various formats.
Downloads (link to download the article as PDF)
Open citations (links to open the citations from this article in various online reference manager services)
Cite this article (links to download the citations from this article in formats compatible with various reference manager tools)
The tetraspanin TSPAN5 regulates AMPAR exocytosis by interacting with the AP4 complex
eLife 12:e76425.
https://doi.org/10.7554/eLife.76425


