Paracrine signalling between intestinal epithelial and tumour cells induces a regenerative programme
- Institut Curie, Laboratory of Genetics and Developmental Biology, PSL Research University, INSERM U934, CNRS UMR3215, France
- Sorbonne University, UPMC University of Paris VI, France
- IGF, University of Montpellier, CNRS, INSERM, France
- Institut Curie, PSL Research University, CNRS UMR 144, France
- Institut Curie, PSL Research University, Laboratory of Mass Spectrometry and Proteomics, France
Figures
Figure 1 with 1 supplement
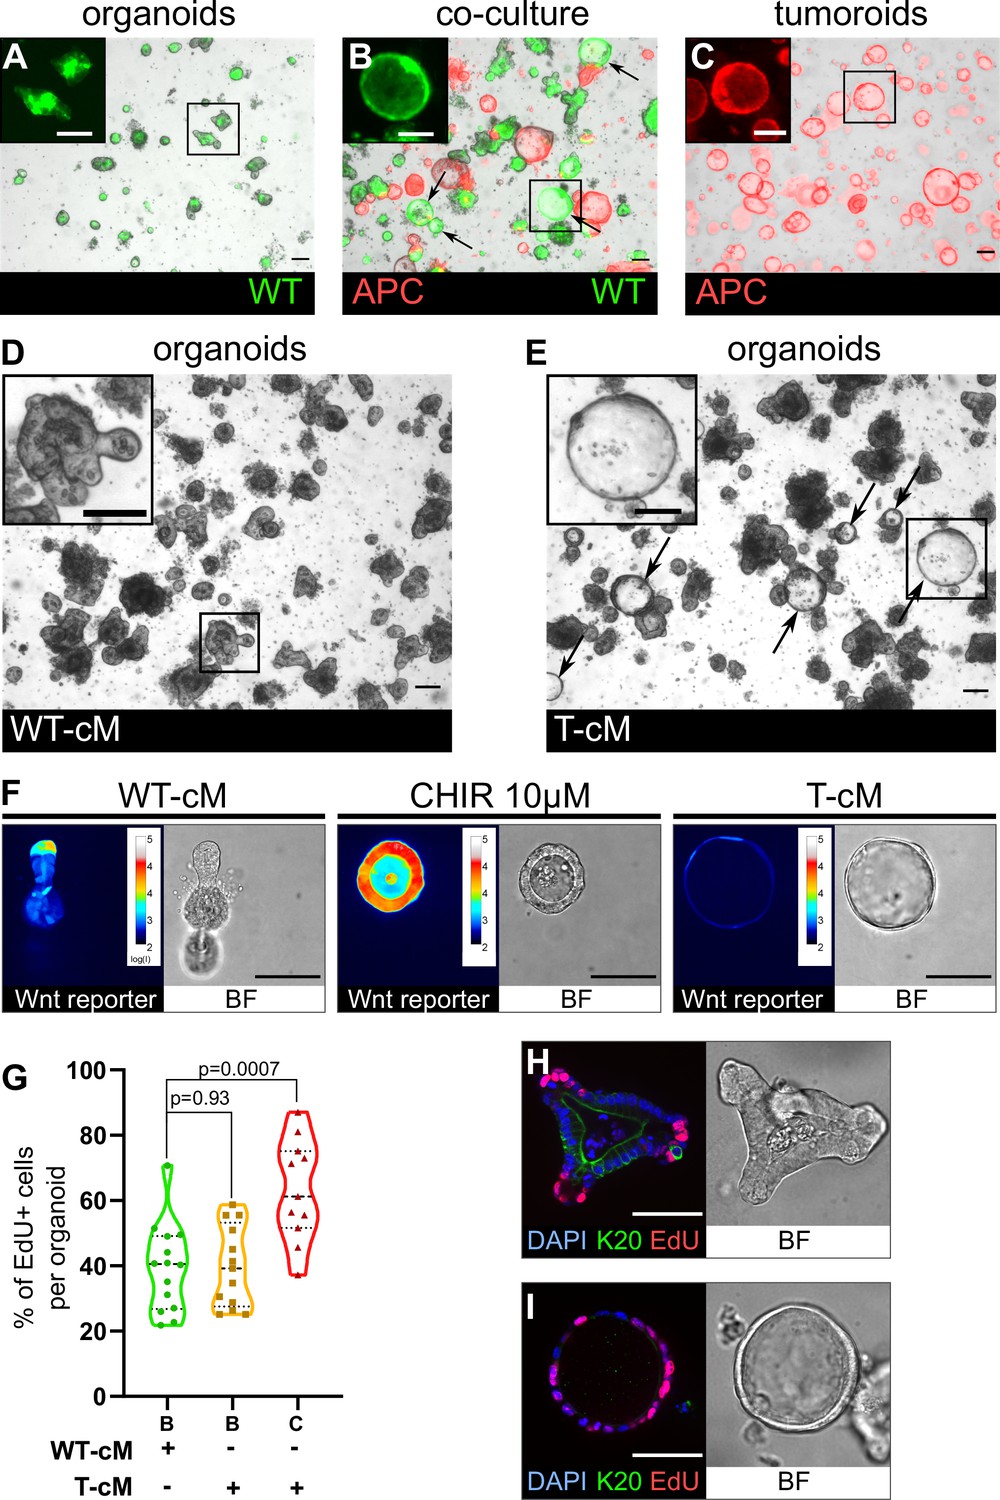
Tumoroids secrete soluble factors that induce a tumour-like cystic morphology in wildtype (WT) organoids.
(A) WT budding organoids marked by LifeAct-GFP (in green) after 24 hr in culture in organoid medium (ENR). (B) WT organoids marked by LifeAct-GFP after 24 hr in co-culture with tdTomato-expressing tumoroids in ENR. Arrows indicate WT (green) cystic organoids. (C) APC mutant cystic tumoroids marked by tdTomato after 24 hr in culture. (D, E) WT budding organoids cultured for 24 hr in conditioned medium from WT organoids (WT-cM in D) or tumoroids (T-cM in E). Arrows indicate WT cystic organoids in (E). (F) Representative images of WT organoids expressing the Wnt reporter 7TG exposed to WT-cM, 10 µM CHIR99021 (CHIR 10 µM) or T-cM for 24 hr. Pseudo-colour shows log10 intensities of the reporter fluorescence. (G) Quantification of the percentage of EdU+ cells per organoid for budding organoids grown in WT-cM (B – WT-cM, n = 14), budding organoids grown in T-cM (B – T-cM, n = 13), or cystic organoids grown in T-cM (C – T-cM, n = 9). (H, I) Immunofluorescence for proliferative cells (EdU in red) and differentiated cells (anti-Keratin 20 in green) in WT organoids grown in WT-cM (H) or T-cM (I) for 24 hr. The corresponding bright-field (BF) images are shown in the right panels. DAPI stains DNA in blue. Scale bar = 100 µm. Statistical analysis was performed with two-tailed unpaired Welch’s t-tests.
-
Figure 1—source data 1
Source data related to Figure 1G.
- https://cdn.elifesciences.org/articles/76541/elife-76541-fig1-data1-v1.xlsx
Figure 1—figure supplement 1
Related to Figure 1.
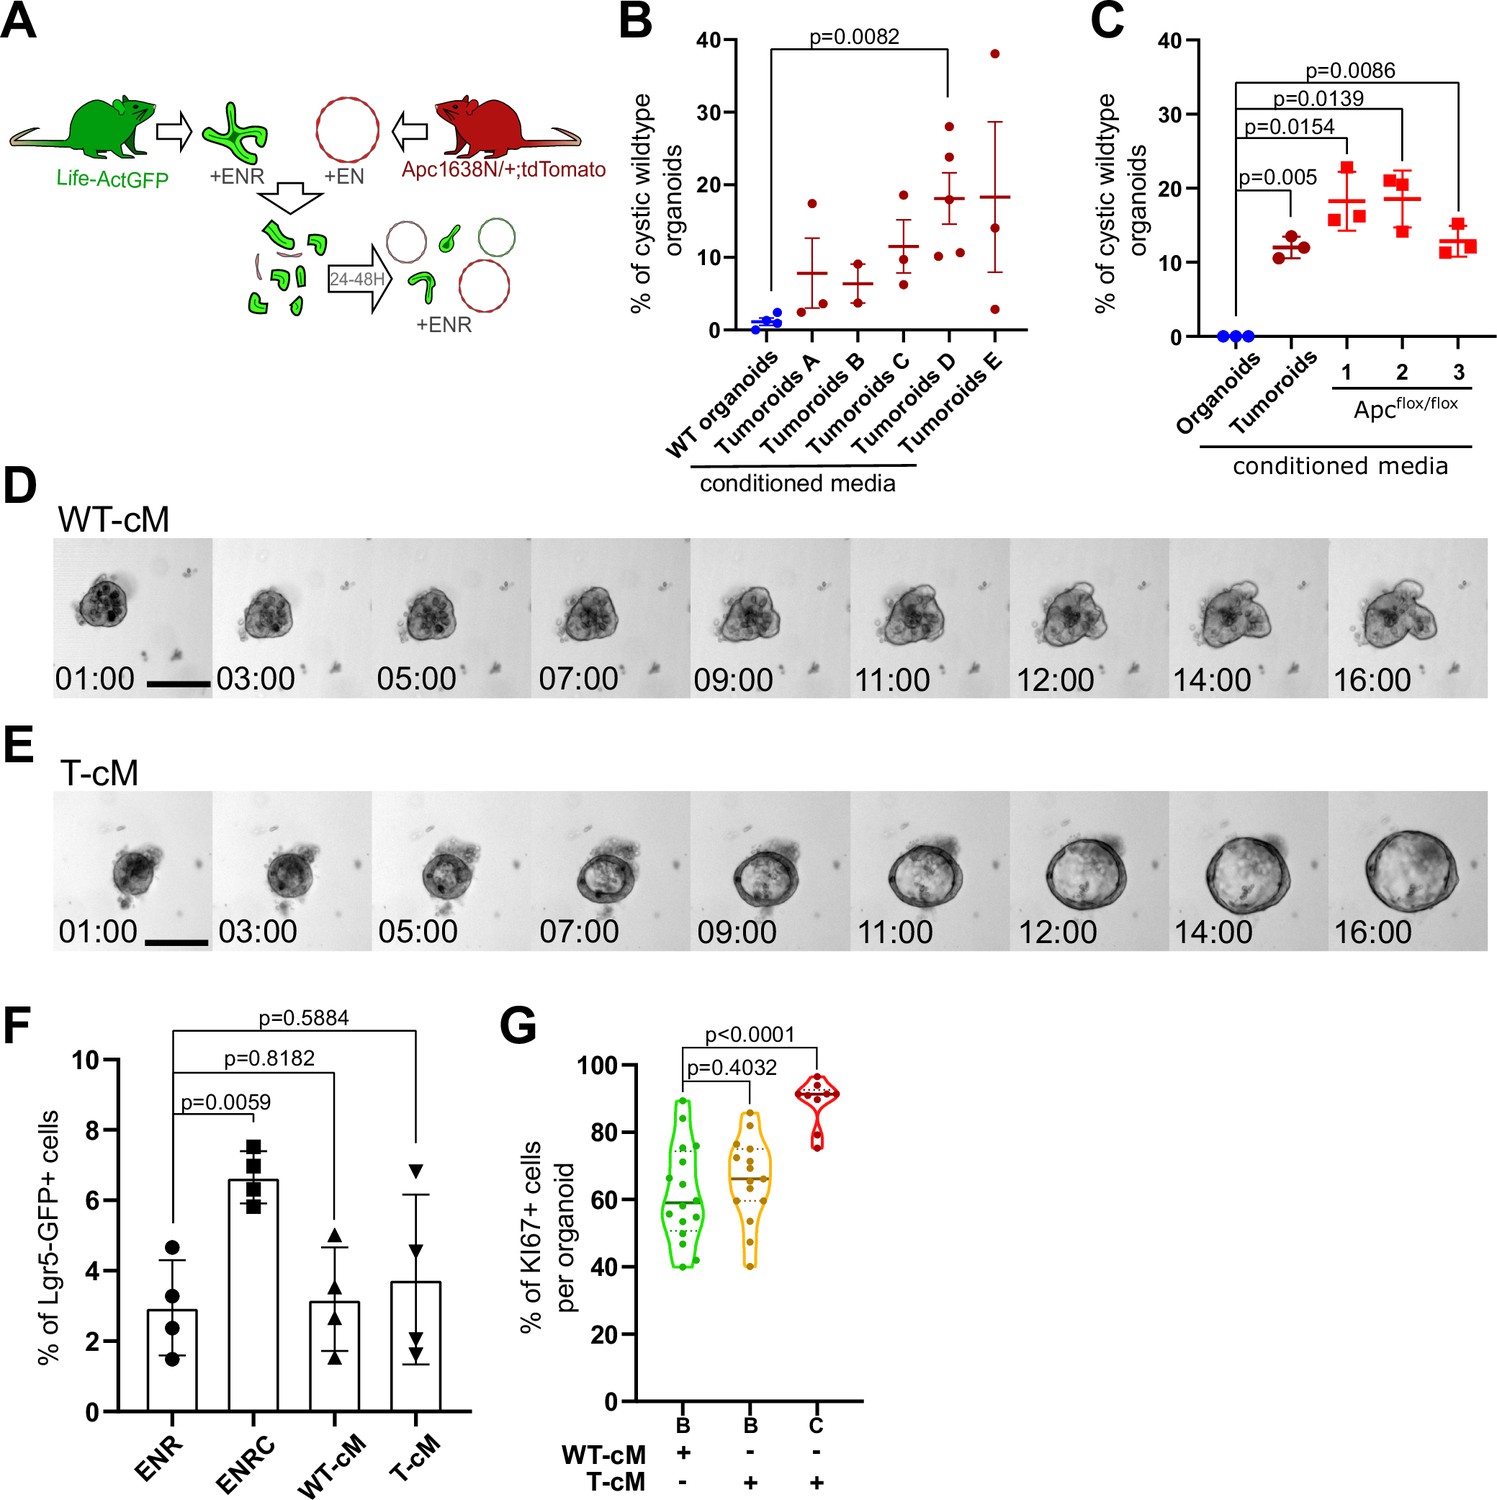
(A) Experimental design of co-culture experiments with green organoids and red tumoroids at 3:1 ratio (wildtype [WT] organoids:tumoroids). ENR: medium containing EGF, Noggin, and R-spondin1. (B) Quantification of the percentage of WT cystic organoids in the presence of conditioned medium (cM) derived from the indicated cultures. (C) Quantification of the percentage of WT cystic organoids in the presence of cM derived from WT organoids, tumoroids, or three different Apc-/- organoids generated from hyperplastic small intestine of VillinCreERT2;Apcflox/flox mice. (D, E) Time-lapse analysis of the growth of WT organoids in the presence of WT-cM (D) or T-cM (E) (in hours:minutes). (F) Quantification of the percentage of Lgr5-GFP+ cells in WT organoids treated with ENR, ENR+CHIR99021 (ENRC), WT-cM or T-cM (n = 4 for each condition). (G) Quantification of the percentage of Ki67+ proliferative cells per organoid for budding organoids grown in WT-cM (B – WT-cM, n = 16), budding organoids grown in T-cM (B – TcM, n = 15) or cystic organoids grown in T-cM (C – T-cM, n = 9). Scale bar = 100 µm. Graphs indicate average values ± SD. Statistical analysis was performed with two-tailed unpaired Welch’s t-tests.
-
Figure 1—figure supplement 1—source data 1
Source data related to Figure 1—figure supplement 1B.
- https://cdn.elifesciences.org/articles/76541/elife-76541-fig1-figsupp1-data1-v1.xlsx
-
Figure 1—figure supplement 1—source data 2
Source data related to Figure 1—figure supplement 1C.
- https://cdn.elifesciences.org/articles/76541/elife-76541-fig1-figsupp1-data2-v1.xlsx
-
Figure 1—figure supplement 1—source data 3
Source data related to Figure 1—figure supplement 1F.
- https://cdn.elifesciences.org/articles/76541/elife-76541-fig1-figsupp1-data3-v1.xlsx
-
Figure 1—figure supplement 1—source data 4
Source data related to Figure 1—figure supplement 1G.
- https://cdn.elifesciences.org/articles/76541/elife-76541-fig1-figsupp1-data4-v1.xlsx
Figure 2 with 1 supplement
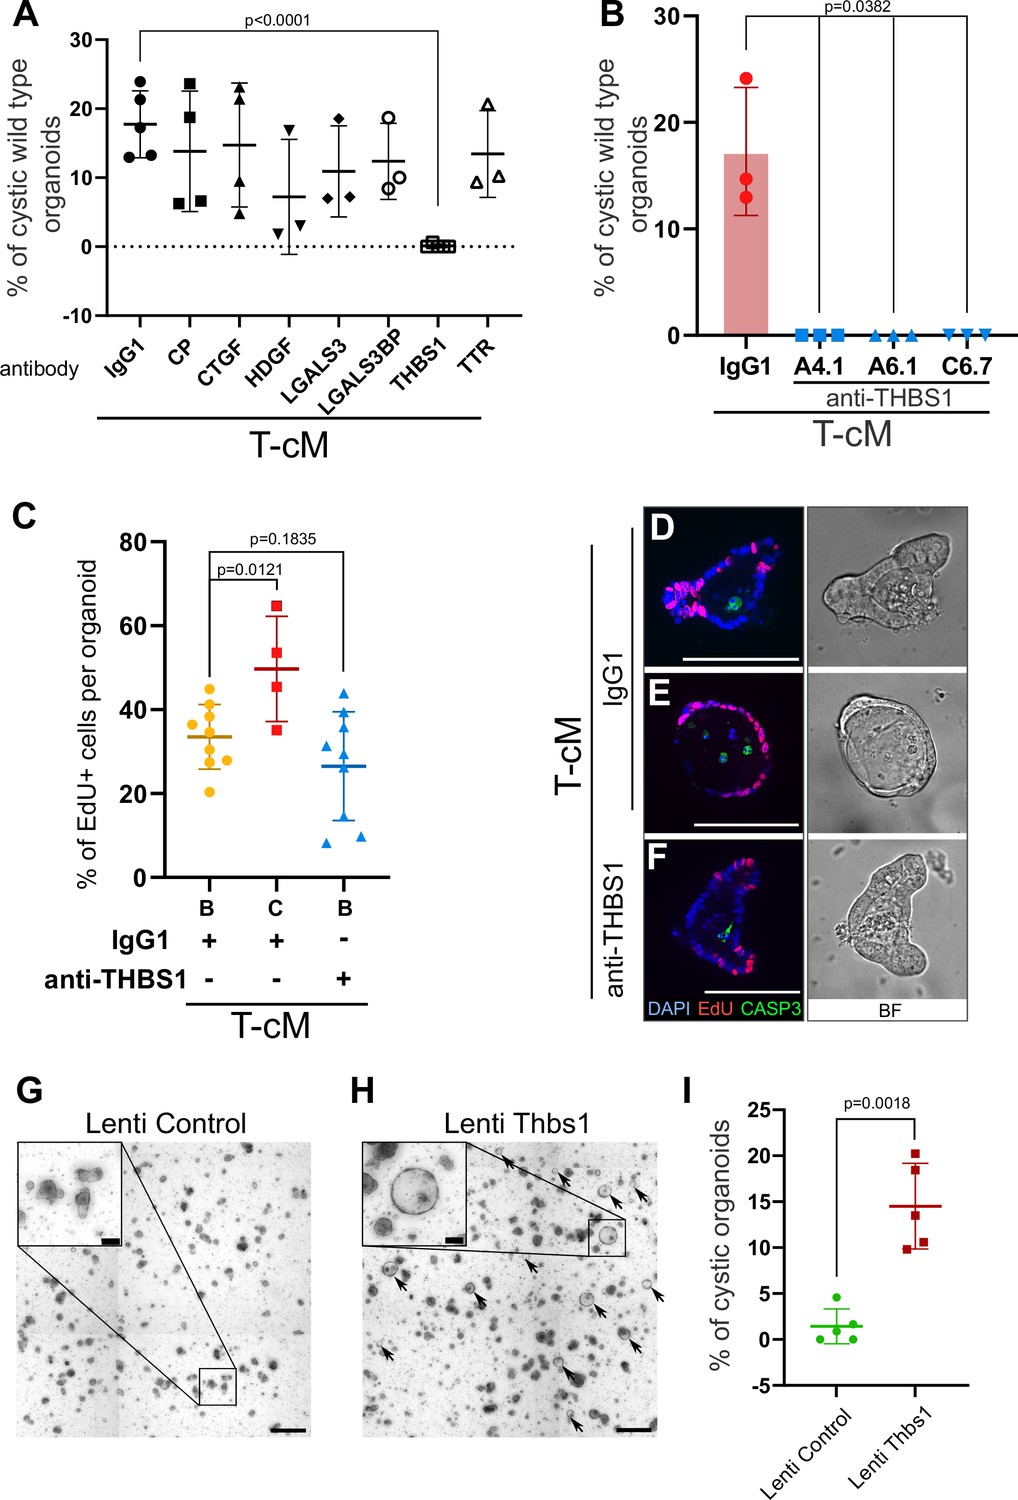
Thrombospondin-1 (THBS1) is necessary and sufficient for the morphological ‘transformation’ of wildtype (WT) organoids.
(A) Quantification of the percentage of WT cystic organoids in T-cM upon neutralisation with blocking antibodies against ceruloplasmin (CP), connective tissue growth factor (CTGF), hepatoma-derived growth factor (HDGF), galectin-3 (LGALS3), galectin-3 binding protein (LGALS3BP), thrombospondin-1 (THBS1), and transthyretin (TTR) (5 µg/ml). (B) Quantification of the percentage of WT cystic organoids in T-cM upon neutralisation with three different blocking antibodies against THBS1 (clones A4.1, A6.1, and C6.7 at 5 µg/ml). (C) Quantification of the percentage of EdU+ cells (2 hr pulse) per organoid for WT budding (B – IgG1, n = 9) or cystic organoids (C – IgG1, n = 4) exposed to T-cM in the presence of IgG1 or antibodies anti-THBS1 (B – anti-THBS1, n = 9). (D–F) Whole-mount immunostaining for proliferation (EdU in red) and apoptosis (anti-cleaved caspase-3, CASP3 in green) of WT organoids exposed to T-cM with anti-IgG1 control (D, E) or anti-THBS1 (F) antibodies. DAPI stains DNA in blue. The corresponding bright-field (BF) images are shown on the right panels. (G, H) Representative pictures of self-transformed WT organoids overexpressing Thbs1 (Lenti-Thbs1 in H) and control organoids infected with an empty vector (Lenti-Control in G). Black arrows indicate cystic organoids. (I) Quantification of the percentage of cystic organoids in Thbs1-expressing cultures (Lenti-Thbs1) versus control cultures (Lenti-Control) grown for 24 hr in ENR medium (n = 5). Scale bars = 100 µm in (D–F) and in the insets of (G, H) and 500 µm in (G, H) low magnification. Graphs indicate average values ± SD. Statistical analysis was performed with two-tailed unpaired Welch’s t-tests.
-
Figure 2—source data 1
Source data related to Figure 2A.
- https://cdn.elifesciences.org/articles/76541/elife-76541-fig2-data1-v1.xlsx
-
Figure 2—source data 2
Source data related to Figure 2B.
- https://cdn.elifesciences.org/articles/76541/elife-76541-fig2-data2-v1.xlsx
-
Figure 2—source data 3
Source data related to Figure 2C.
- https://cdn.elifesciences.org/articles/76541/elife-76541-fig2-data3-v1.xlsx
-
Figure 2—source data 4
Source data related to Figure 2I.
- https://cdn.elifesciences.org/articles/76541/elife-76541-fig2-data4-v1.xlsx
Figure 2—figure supplement 1
Related to Figure 2.
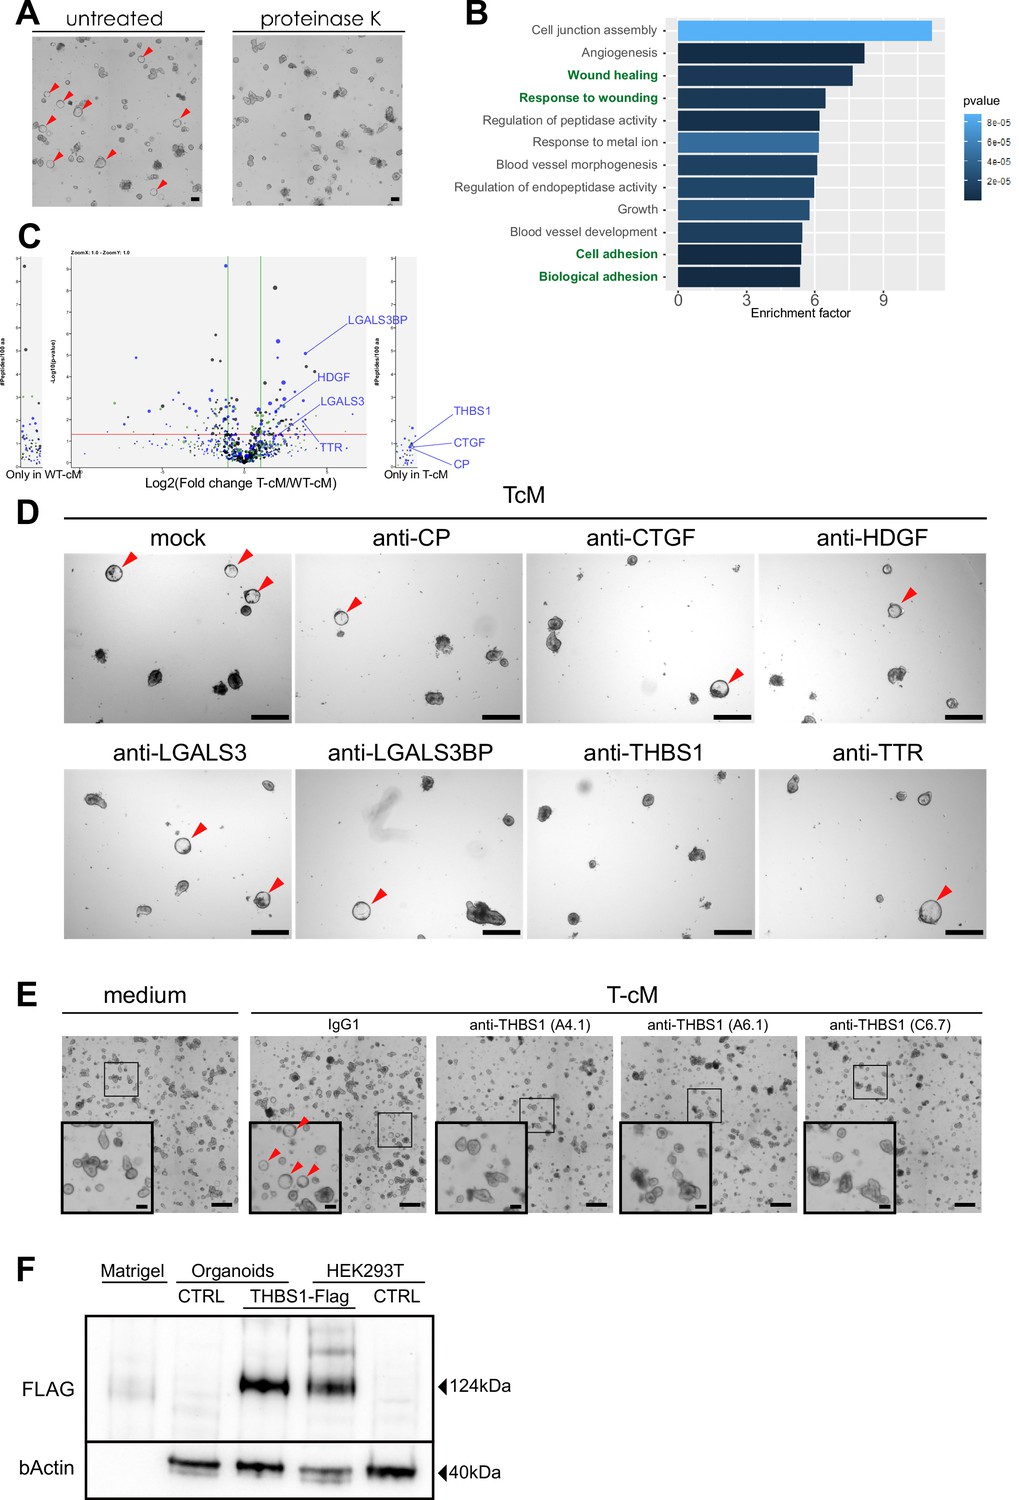
(A) Proteinase K treatment of tumour conditioned medium (T-cM) abolished the cystic transformation. (B) Gene Ontology (GO) analysis of significantly enriched or unique proteins in T-cM compared to wildtype conditioned medium (WT-cM). (C) Volcano plot showing differential enrichment of proteins in T-cM compared to WT-cM by Stable Isotope Labelled Amino acids in Culture (SILAC)-based mass spectrometry. The selected candidates are indicated for one of the replicates in blue. The three different colours (black, blue, and green dots) correspond to three replicates (n = 3). (D) Representative bright-field images of WT organoids grown in T-cM upon neutralisation with blocking antibodies against the indicated proteins. (E) Representative bright-field images of WT organoids grown in normal medium (left panel) or T-cM upon neutralisation with control IgG1 or three different blocking antibodies against THBS1 (clones A4.1, A6.1, and C6.7). (F) Western blot anti-FLAG (targeting overexpressed THBS1-FLAG) and β-actin (loading control) in pure Matrigel, WT organoids infected with a control lentivirus (CTRL) or with lenti-Thbs1 (THBS1-Flag), HEK293T cells infected with lenti-Thbs1 (THBS1-Flag) or control lentivirus (CTRL). Scale bar = 100 µm in (A), 500 µm in (D, E) (100 µm in insets in E). Cystic organoids are indicated by red arrowheads in (A), (D), and (E).
-
Figure 2—figure supplement 1—source data 1
Original image of the complete gel for the Western blot presented in Figure 2—figure supplement 1F.
- https://cdn.elifesciences.org/articles/76541/elife-76541-fig2-figsupp1-data1-v1.pdf
-
Figure 2—figure supplement 1—source data 2
Original image of the complete gel for the Western blot presented in Figure 2—figure supplement 1F.
- https://cdn.elifesciences.org/articles/76541/elife-76541-fig2-figsupp1-data2-v1.zip
Figure 3 with 1 supplement
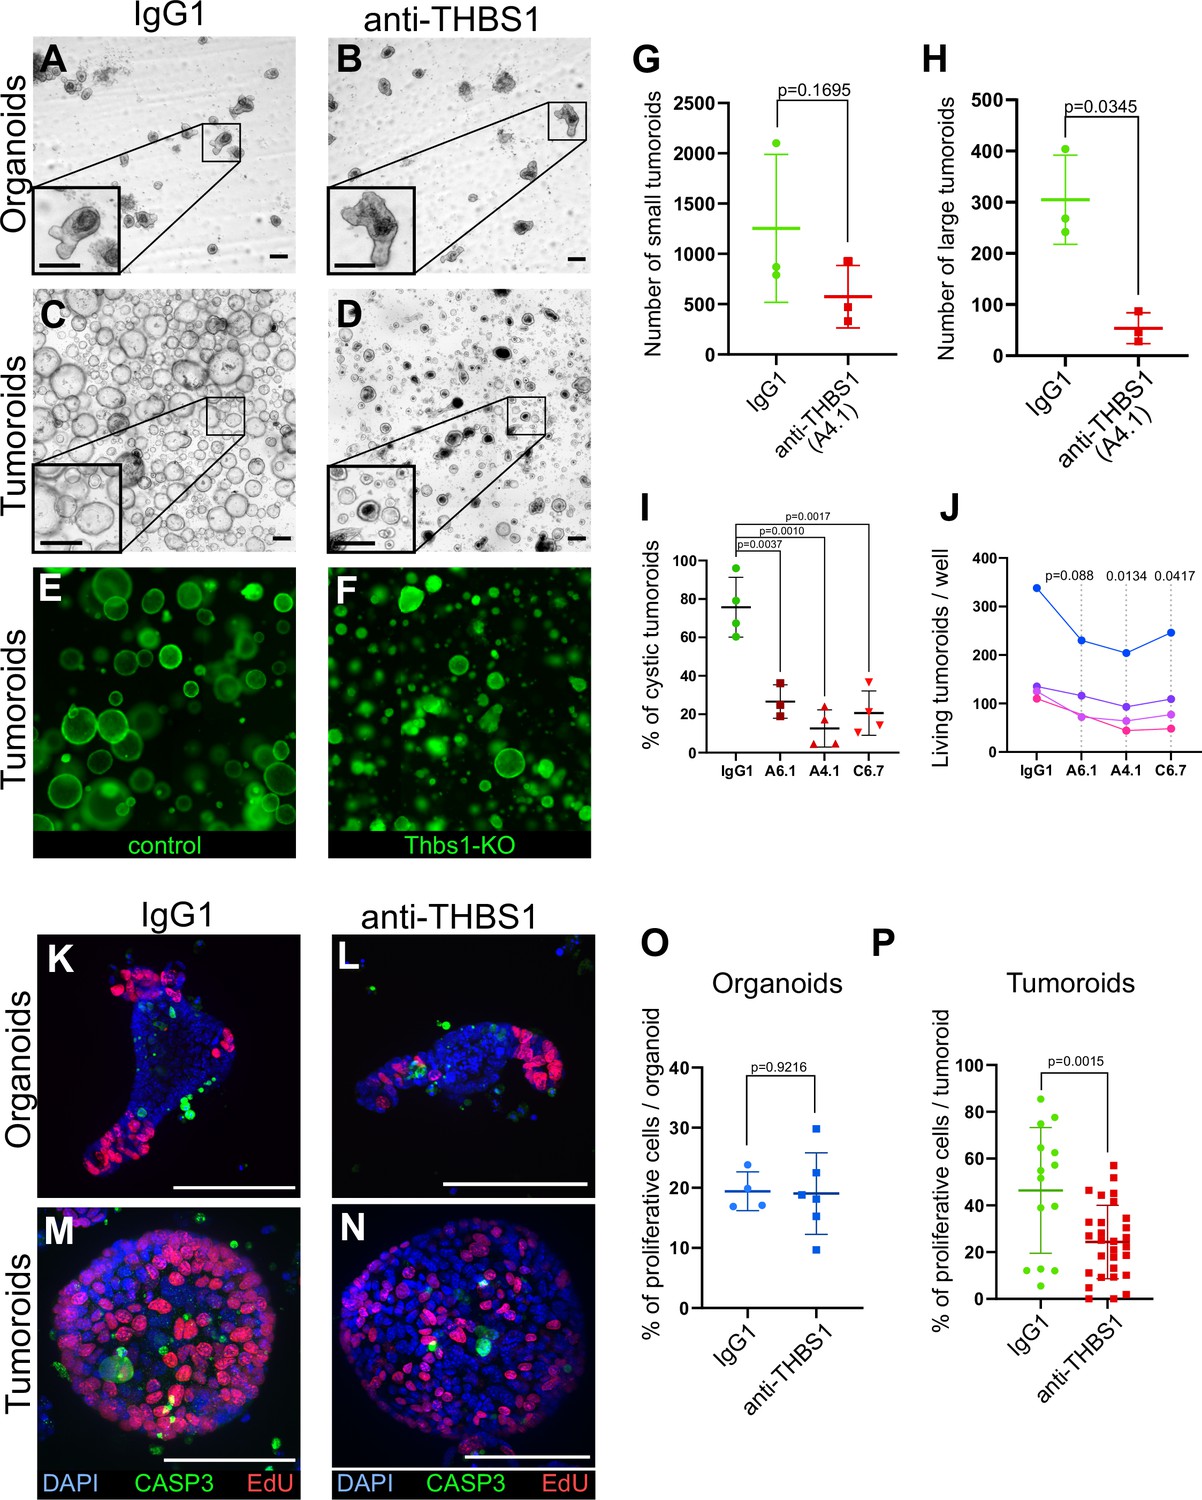
Thrombospondin-1 (THBS1) is essential for the growth of tumoroids.
(A–D) Representative bright-field images of wildtype (WT) organoids (A, B) or tumoroids (C, D) incubated with IgG1 isotype control antibodies (A, C) or anti-THBS1 A6.1-neutralising antibody (B, D) (10 µg/ml). (E, F) Representative images of tumoroids infected with a lentivirus CRISPR-GFP without sgRNA (control in E) or with an sgRNA targeting Thbs1 (Thbs1-KO in F) 48 hr after replacement of single-cell seeding medium (ENRC) by tumoroid medium (EN). (G, H) Quantification of the number of tumoroids upon antibody neutralisation relative to their size: small tumoroids between 30 and 150 µm in (G); large tumoroids of more than 150 µm diameter in (H). (I) Quantification of the percentage of cystic tumoroids upon treatment by IgG1 isotype control antibodies or three different neutralising antibodies targeting THBS1 (as indicated) for 48 hr. (J) Paired quantification of the number of living tumoroids derived from four independent tumours (from four mice) upon treatment with three neutralising antibodies targeting THBS1 for 48 hr. Antibody concentration: 10 µg/ml. (K–N) Immunofluorescence staining for proliferative cells (EdU in red) and apoptosis (anti-cleaved caspase-3, CASP3 in green) in WT organoids (K, L) or tumoroids (M, N) exposed to IgG1 isotype control antibodies (K, M) or to anti-THBS1 A6.1-neutralising antibody (L, N). (O, P) Quantification of EdU+ cells per organoid (O) or tumoroid (P) in the presence of IgG1 control or anti-THBS1 (A6.1) antibodies. Scale bars = 100 µm. Graphs indicate average values ± SD. Statistical analysis was performed with paired Student’s t-test in (G–J) and two-tailed unpaired Welch’s t-tests in (O) and (P).
-
Figure 3—source data 1
Source data related to Figure 3G.
- https://cdn.elifesciences.org/articles/76541/elife-76541-fig3-data1-v1.xlsx
-
Figure 3—source data 2
Source data related to Figure 3H.
- https://cdn.elifesciences.org/articles/76541/elife-76541-fig3-data2-v1.xlsx
-
Figure 3—source data 3
Source data related to Figure 3I.
- https://cdn.elifesciences.org/articles/76541/elife-76541-fig3-data3-v1.xlsx
-
Figure 3—source data 4
Source data related to Figure 3J.
- https://cdn.elifesciences.org/articles/76541/elife-76541-fig3-data4-v1.xlsx
-
Figure 3—source data 5
Source data related to Figure 3O.
- https://cdn.elifesciences.org/articles/76541/elife-76541-fig3-data5-v1.xlsx
-
Figure 3—source data 6
Source data related to Figure 3P.
- https://cdn.elifesciences.org/articles/76541/elife-76541-fig3-data6-v1.xlsx
Figure 3—figure supplement 1
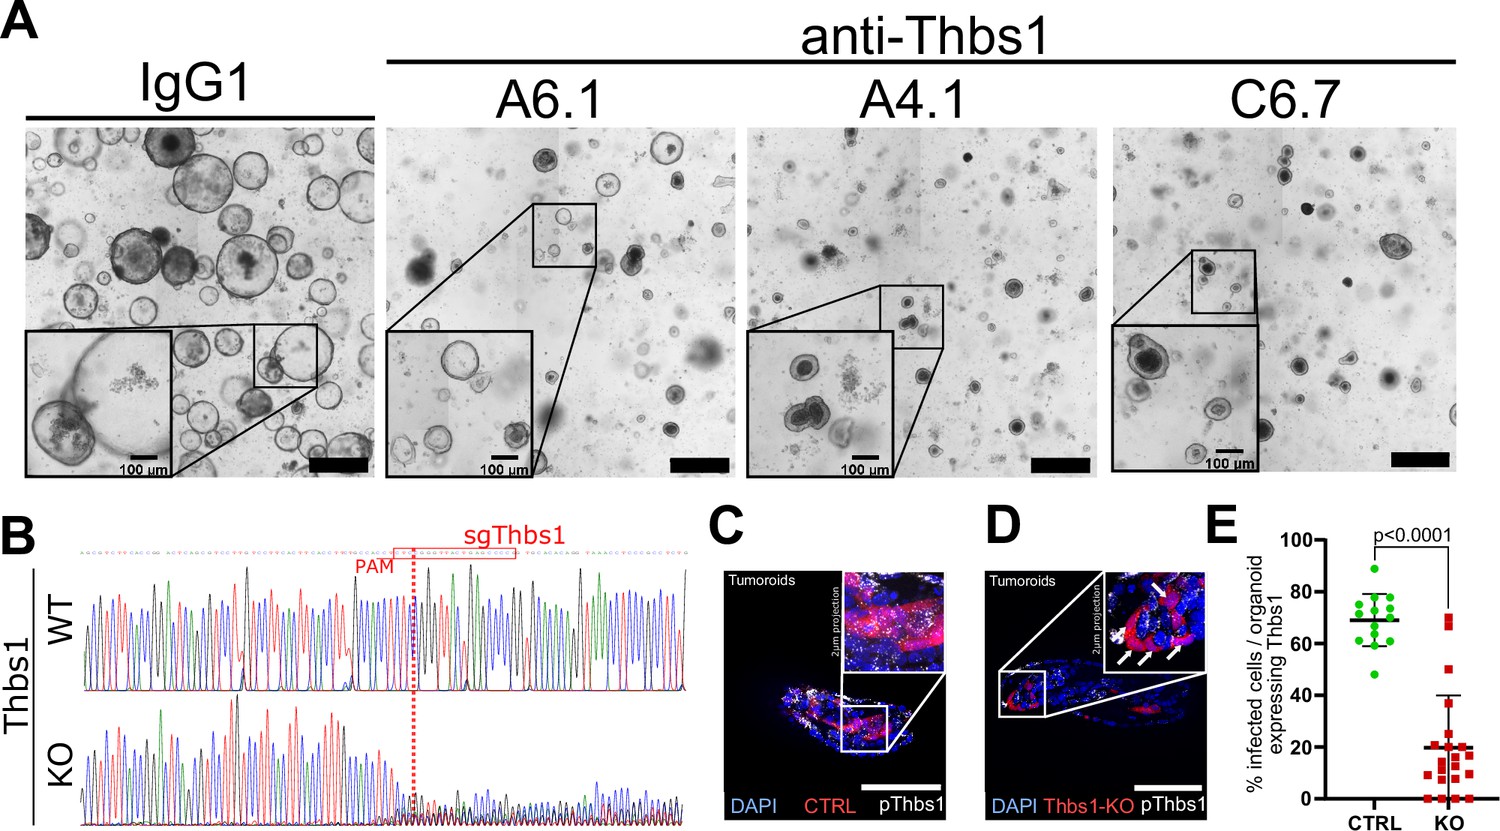
Related to Figure 3.
(A) Representative images of tumoroids cultures grown for 48 hr in EN medium in the presence of control IgG1 or anti-THBS1-neutralising antibodies A6.1, A4.1, C6.7, as indicated. (B) Analysis of CRISPR edits from Sanger sequencing of DNA at the expected cut site for Cas9 in wildtype (WT) or THBS1 KO mouse embryonic fibroblasts infected with no sgRNA or sgRNA targeting Thbs1, respectively. Red boxes indicate the sgRNA sequences with the PAM sequence underlined in red; red vertical dashed lines indicate the expected cut site. (C, D) Representative images of tumoroids infected with lenti-CRISPR expressing no sgRNA (CTRL in C) or sgThbs1 (KO in D) probed for Thbs1 expression using single-molecule RNA fluorescence in situ hybridisation (smRNA FISH) with a probe recognising Thbs1 (pThbs1 in white). Red fluorescence indicates infected cells and DAPI stains the nuclei. (E) Quantification of the percentage of infected cells (red) expressing Thbs1 per organoid (n = 3). Scale bar = 500 µm in (A) and 100 µm in (C, D) and insets in (A). Statistical analysis was performed with two-tailed unpaired Welch’s t-tests.
-
Figure 3—figure supplement 1—source data 1
Source data related to Figure 3—figure supplement 1E.
- https://cdn.elifesciences.org/articles/76541/elife-76541-fig3-figsupp1-data1-v1.xlsx
Figure 4 with 1 supplement
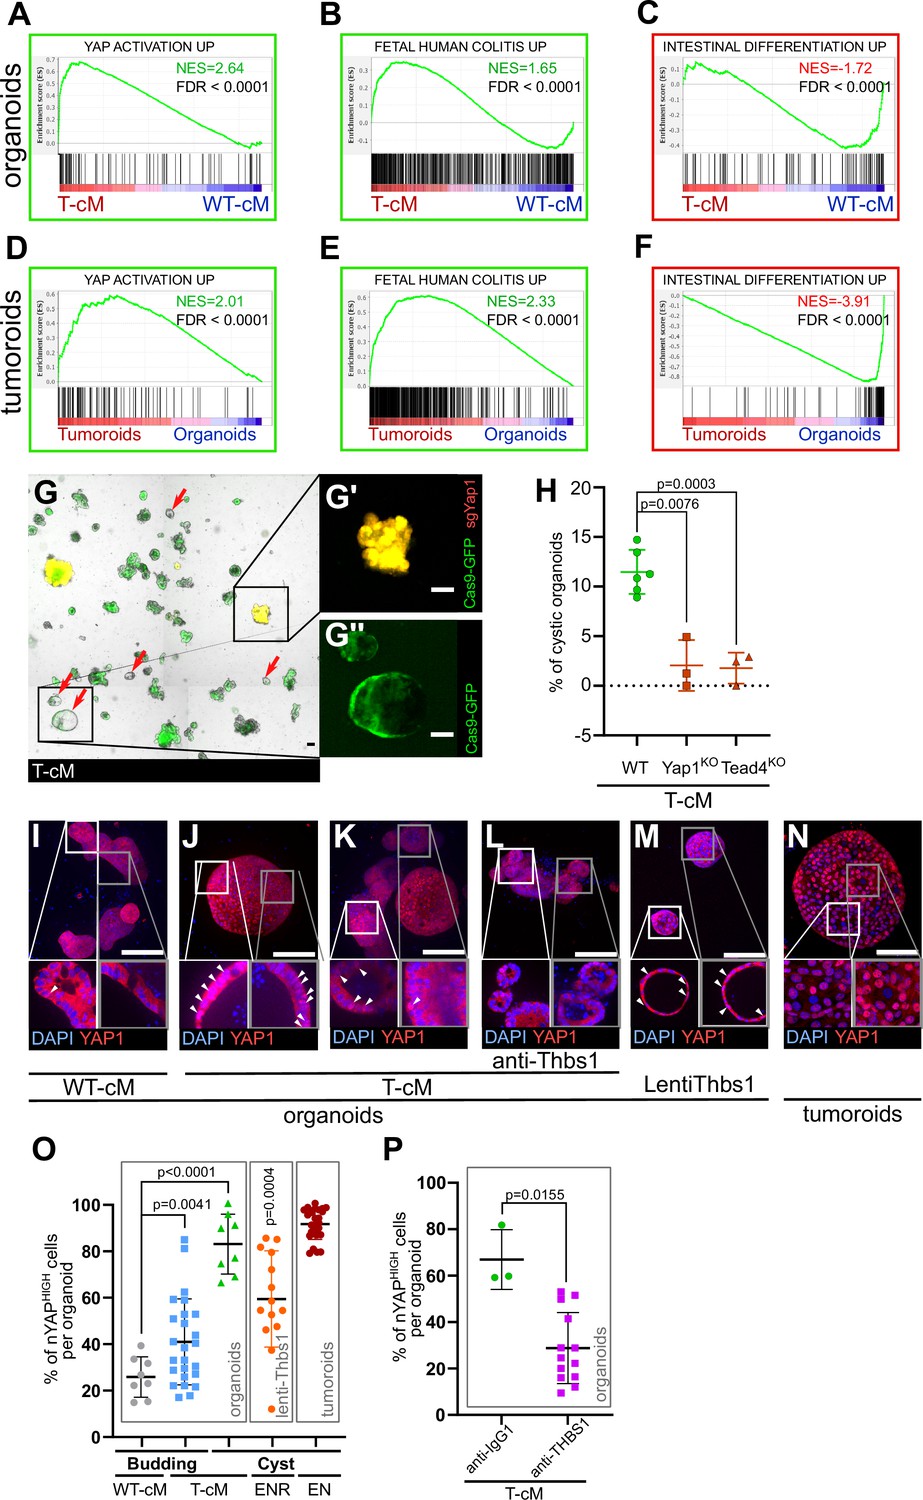
Tumour conditioned medium (T-cM) induces YAP pathway activation and a foetal-like state in wildtype (WT) organoids.
Gene Set Enrichment Analyses (GSEA) showing the correlation between differentially expressed genes in WT organoids cultured in T-cM (A–C) or tumoroids (D–F) and the indicated transcriptional signatures. NES: Normalised Enrichment Score; green NES: positive correlation; red NES: inverse correlation. (G) Representative image of WT organoids expressing Cas9-GFP (in green) transduced with an sgRNA targeting Yap1 (sgYap1 in red). Higher magnification of a budding Yap1KO organoid (in yellow in G′) and a cystic Yap1WT organoid expressing only Cas9-GFP but no sgRNA (in green in G′′). (H) Percentage of cystic organoids induced by exposure to T-cM in WT, Yap1KO or Tead4KO organoids, as indicated. (I–N) Max projections of immunostaining for YAP1 (in red) of WT organoids exposed to WT-cM (I), or T-cM (J–L) for 24 hr presenting cystic (J) or budding (K, L) morphologies. Organoids in (L) are treated by neutralising antibodies targeting THBS1 (A6.1), which rescues the budding morphology. Organoids in (M) overexpress THBS1 (LentiThbs1) and tumoroids are shown in (N). DAPI stains DNA in blue. White arrowheads pinpoint YAPHIGH cells in Z-section insets. (O) Quantification of the percentage of nuclear YAP (nYAPHIGH) cells/organoid based on the ratio of nuclear vs. cytoplasmic YAP1 in cystic and budding WT organoids grown in WT-cM or T-cM for 24 hr, in WT organoids overexpressing Thbs1 (lenti-Thbs1) or tumoroids, as indicated. (P) Quantification of the percentage of nYAPHIGH cells/organoid in WT organoids cultured with T-cM and control IgG1 or anti-THBS1 (A6.1) antibodies for 24 hr. Scale bars correspond to 100 µm in (G, I–N). Graphs indicate average values ± SD. Statistical analysis was performed with two-tailed unpaired Welch’s t-tests. For the lenti-Thbs1 sample, a Welch’s corrected t-test was applied to compare the percentage of nYAPHIGH cells/organoid between Thbs1-expressing organoids and WT organoids infected with an empty lentivirus.
-
Figure 4—source data 1
Source data related to Figure 4H.
- https://cdn.elifesciences.org/articles/76541/elife-76541-fig4-data1-v1.xlsx
-
Figure 4—source data 2
Source data related to Figure 4O.
- https://cdn.elifesciences.org/articles/76541/elife-76541-fig4-data2-v1.xlsx
-
Figure 4—source data 3
Source data related to Figure 4P.
- https://cdn.elifesciences.org/articles/76541/elife-76541-fig4-data3-v1.xlsx
Figure 4—figure supplement 1
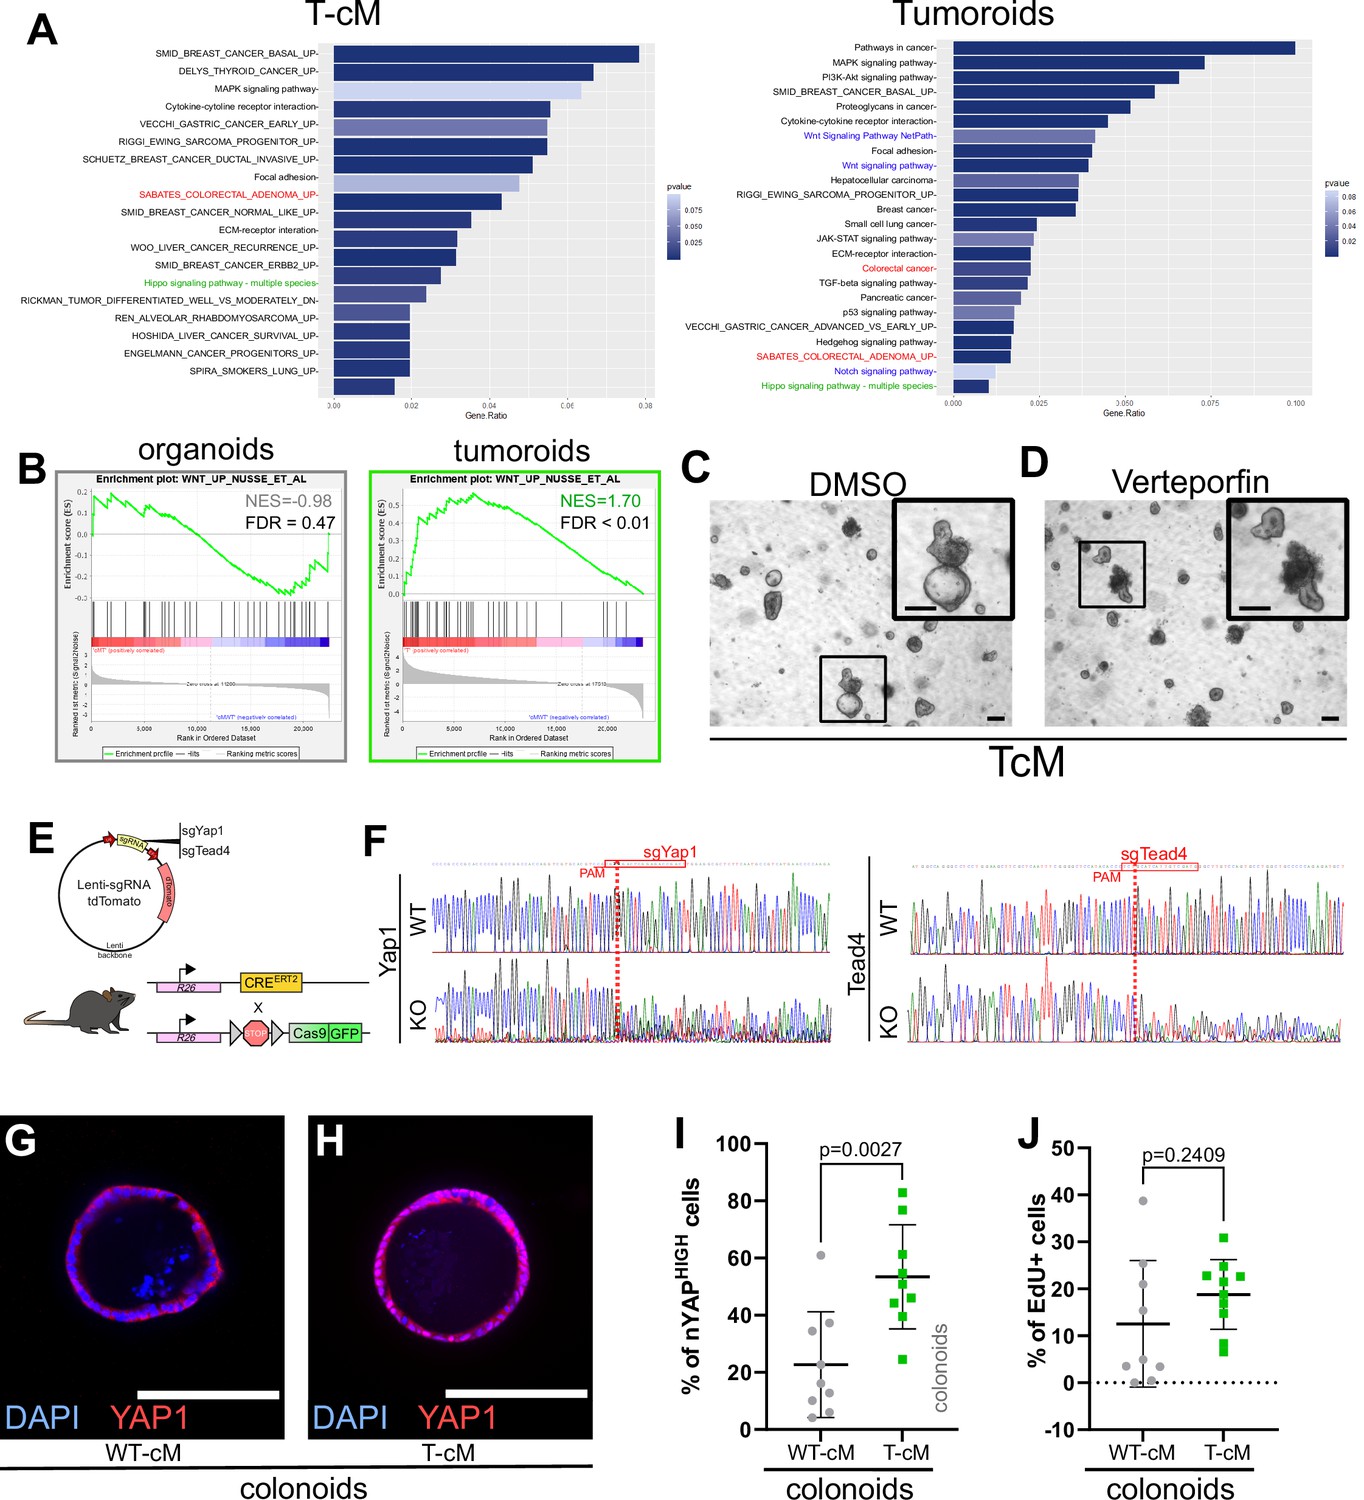
Related to Figure 4.
(A) Pathway analysis of selected KEGG and GSEA-MSigDB terms enriched in the signatures of organoids grown in tumour conditioned medium (T-cM) (left panel) or tumoroids (right panel). (B) Gene Set Enrichment Analysis (GSEA) comparing differentially expressed genes in wildtype (WT) organoids exposed to T-cM or in tumoroids with the WNT signature (Nusse Lab). Green NES: positive correlation; grey NES: non-significant correlation. (C, D) Representative bright-field images of WT organoids grown in T-cM in the presence of DMSO (C) or the YAP inhibitor verteporfin (D). (E) Map of the lenti-sgRNA-tdTomato lentiviral vector used for knockout experiments and schematic diagram of the RosaCREERT2;Cas9-GFP mouse line used to derive WT organoids. (F) Analysis of CRISPR edits from Sanger sequencing of DNA at the expected cut site for Cas9 in mouse embryonic fibroblasts infected with no sgRNA (WT) or sgRNAs targeting Yap1 (KO in F, left) and Tead4 (KO in F, right). Red boxes indicate the sgRNA sequences with the PAM sequence underlined in red; red vertical dashed lines indicate the expected cut site. (G, H) Representative immunofluorescence against YAP1 (in red) of colonoids exposed to WT-cM (G) or T-cM (H) for 24 hr. DAPI stains DNA in blue. (I, J) Quantification of the percentage of YAPHIGH cells/organoid based on the ratio of nuclear vs. cytoplasmic YAP1 (I) or of EdU+ cells/organoid (J) in WT colonoids grown in WT-cM or T-cM. Scale bar = 100 µm. Statistical analysis was performed with two-tailed unpaired Welch’s t-tests.
-
Figure 4—figure supplement 1—source data 1
Source data related to Figure 4—figure supplement 1I.
- https://cdn.elifesciences.org/articles/76541/elife-76541-fig4-figsupp1-data1-v1.xlsx
-
Figure 4—figure supplement 1—source data 2
Source data related to Figure 4—figure supplement 1J.
- https://cdn.elifesciences.org/articles/76541/elife-76541-fig4-figsupp1-data2-v1.xlsx
Figure 5 with 1 supplement
Thbs1 is expressed by Lgr5+ cancer stem cells in vivo and induces YAP activation in neighbouring epithelial cells.
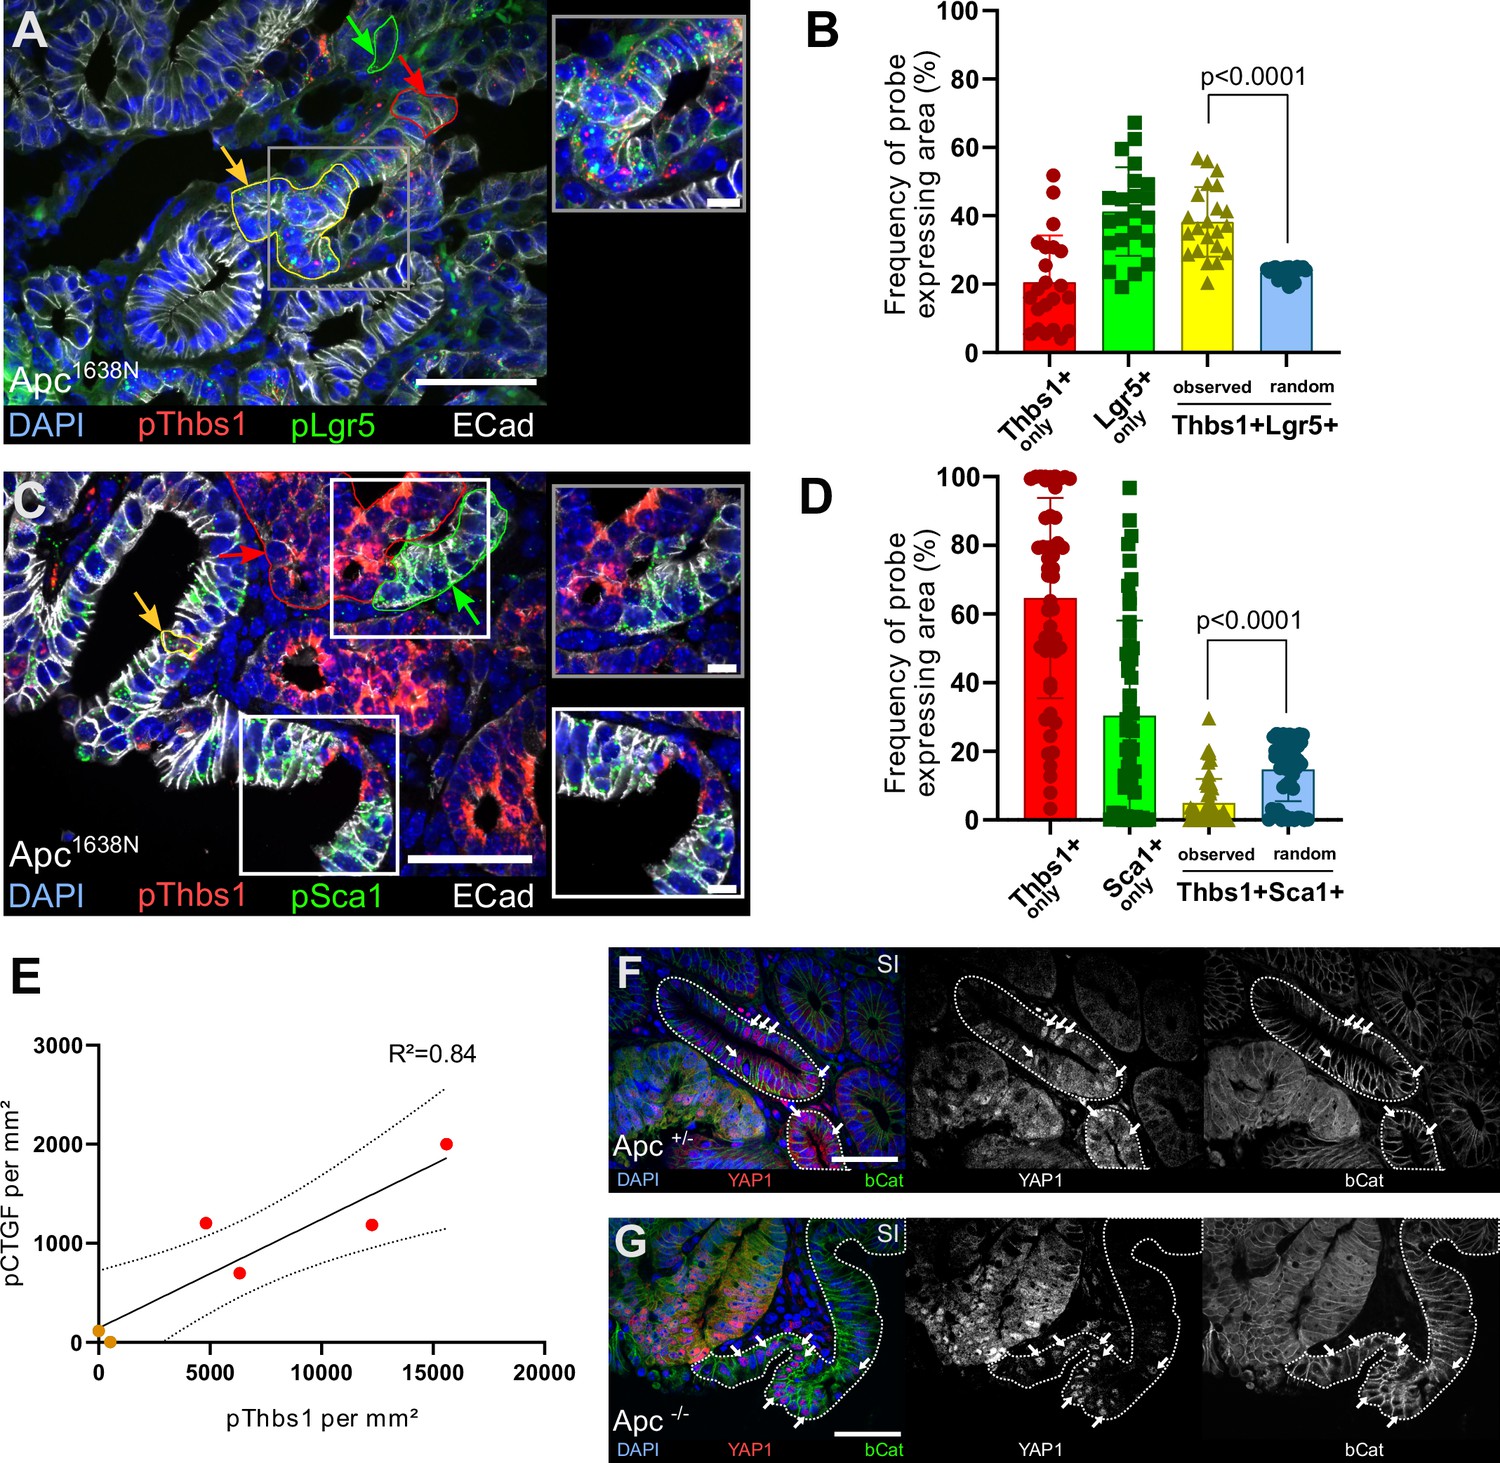
(A, C) Representative section of Apc mutant intestinal tumours analysed by single-molecule fluorescence in situ hybridisation (smFISH) for Thbs1 (pThbs1, red dots) and Lgr5 (pLgr5, green dots in A) or the YAP target Sca1 (pSca1, green dots in C). Examples of segmented and processed region of interest (ROI) that were automatically counted as co-localisation (Thbs1+/Lgr5+ in A or Thbs1+/Sca1+ cells in C outlined in yellow and indicated by yellow arrows) or single-probe expression (outlined in red or green and indicated by arrows of the corresponding colour) are shown. E-cadherin demarcates epithelial cells in white and DAPI labels nuclei in blue in (A) and (C). (B, D) Quantification of the frequency of tumour regions expressing exclusively one probe or co-expressing two probes (yellow): Thbs1 only in red or Lgr5 only in green (B); Thbs1 only in red or Sca1 only in green (D). The observed frequencies of co-localisation (yellow in B) or mutual exclusion (yellow in D) are statistically significant compared to the calculated probability of random co-expression (blue columns) (n = 22 sections from two tumours in B and n = 51 sections from five tumours in D). (E) Correlation of the number of RNA molecules (dots/mm²) detected by single-molecule RNA fluorescence in situ hybridisation (smRNA FISH) for the YAP target CTGF and Thbs1 in mouse intestinal tumours. Red dots indicate large tumours (≥ 8 mm), orange dots small tumours (<8 mm). Dashed lines indicate 95% confidence intervals. (F, G) Representative sections of tumours derived from VillinCreERT2;Apcflox/+ (Apc+/- in F) or VillinCreERT2;Apcflox/flox (Apc-/- in G) immunostained for YAP1 (in red) and β-catenin (in green). Wildtype (WT) glands displaying membrane-bound β-catenin, adjacent to mutant areas presenting diffuse cytoplasmic/nuclear β-catenin expression are demarcated by dashed lines. White arrows indicate examples of cells showing high levels of nuclear YAP. Scale bars = 50 µm and 10 µm in insets. Statistical analysis was performed with Wilcoxon test in (B–D) and linear regression test with 95% confidence in (E).
-
Figure 5—source data 1
Source data related to Figure 5B.
- https://cdn.elifesciences.org/articles/76541/elife-76541-fig5-data1-v1.xlsx
-
Figure 5—source data 2
Source data related to Figure 5D.
- https://cdn.elifesciences.org/articles/76541/elife-76541-fig5-data2-v1.xlsx
-
Figure 5—source data 3
Source data related to Figure 5E.
- https://cdn.elifesciences.org/articles/76541/elife-76541-fig5-data3-v1.xlsx
Figure 5—figure supplement 1
Related to Figure 5.
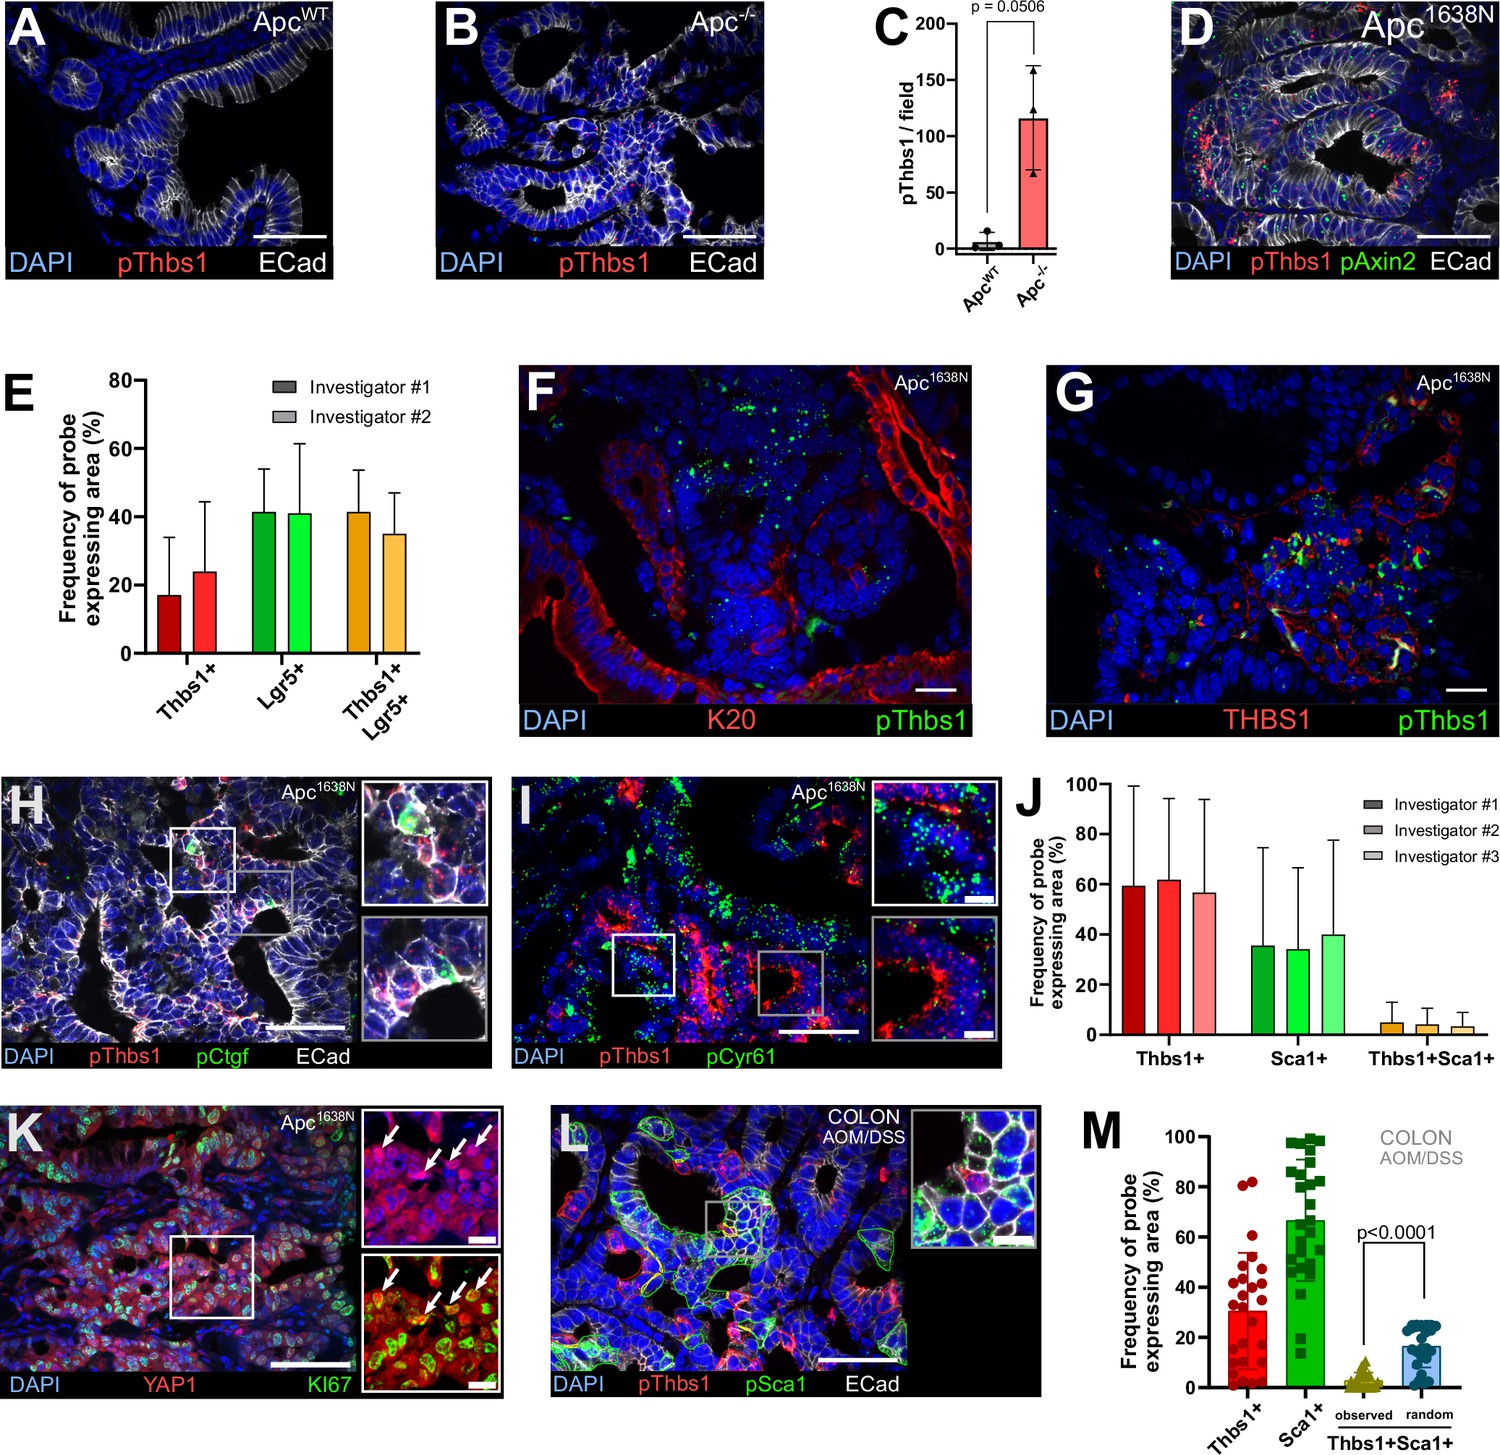
(A, B) Representative sections of single-molecule RNA fluorescence in situ hybridisation (smRNA FISH) targeting Thbs1 (pThbs1, red dots) in the small intestine of wildtype (WT) mice (ApcWT in A) or VillinCreERT2;Apcflox/flox mice (Apc-/- in B). (C) Quantification of the number of Thbs1 dots per field in ApcWT or Apc-/- small intestine. (D) Representative sections of smRNA FISH targeting Thbs1 (pThbs1, red dots) and the Wnt target Axin2 (pAxin2, green dots) in mouse intestinal tumours (Apc1638N). (E) Quantification of the percentage of probe-expressing area reflecting cells expressing Thbs1 only (red), Lgr5 only (green), or co-expressing both (yellow) annotated by three independent and double-blinded investigators, corresponding to Figure 5A and B. (F, G) Representative sections of mouse intestinal tumours analysed by smRNA FISH for Thbs1 (pThbs1, green dots) and immunostained with an antibody against the epithelial marker Keratin 20 (K20 in red in F) or with anti-THBS1 antibody (in red in G). (H, I) Representative sections of Apc mutant intestinal tumours analysed by smRNA FISH for the YAP target genes Ctgf (pCtgf, green dots in H) or Cyr61 (pCyr61, green dots in I) and Thbs1 (pThbs1, red dots). (J) Quantification of the percentage of probe-expressing area reflecting cells expressing Thbs1 only (red), Sca1 only (green), or co-expressing both (yellow) annotated by three independent and double-blinded investigators, corresponding to Figure 5C and D. (K) Representative sections of Apc mutant intestinal tumours immunostained for YAP1 (in red) and KI67 (in green). White arrows in insets show nuclear YAP1HIGH/Ki67+ cells (n = 6 sections from three tumours). (L) Representative sections of chemically induced colon tumours analysed by smRNA FISH for expression of Thbs1 (pThbs1, red dots) and the YAP target gene Sca1 (pSca1, green dots); regions presenting co-localisation of Thbs1 and Sca1 are outlined in yellow. (M) Quantification of the percentage of probe-expressing area reflecting cells expressing Thbs1 only (red), Sca1 only (green), or both (yellow). The observed mutual exclusion of red and green regions is statistically significant compared to the calculated probability of random co-expression (blue column) (n = 30 sections from five tumours). E-cadherin antibody in white demarcates epithelial cells in (A, B, D, H, L). DAPI labels nuclei in blue. Scale bar = 50 µm (10 µm in the insets). Statistical analysis was performed with two-tailed unpaired Welch’s t-tests in (C) (p=0.0506) and Wilcoxon test in (M).
-
Figure 5—figure supplement 1—source data 1
Source data related to Figure 5—figure supplement 1E.
- https://cdn.elifesciences.org/articles/76541/elife-76541-fig5-figsupp1-data1-v1.xlsx
-
Figure 5—figure supplement 1—source data 2
Source data related to Figure 5—figure supplement 1J.
- https://cdn.elifesciences.org/articles/76541/elife-76541-fig5-figsupp1-data2-v1.xlsx
-
Figure 5—figure supplement 1—source data 3
Source data related to Figure 5—figure supplement 1M.
- https://cdn.elifesciences.org/articles/76541/elife-76541-fig5-figsupp1-data3-v1.xlsx
Figure 6
The THBS1-YAP pathway operates in human low-grade adenomas.
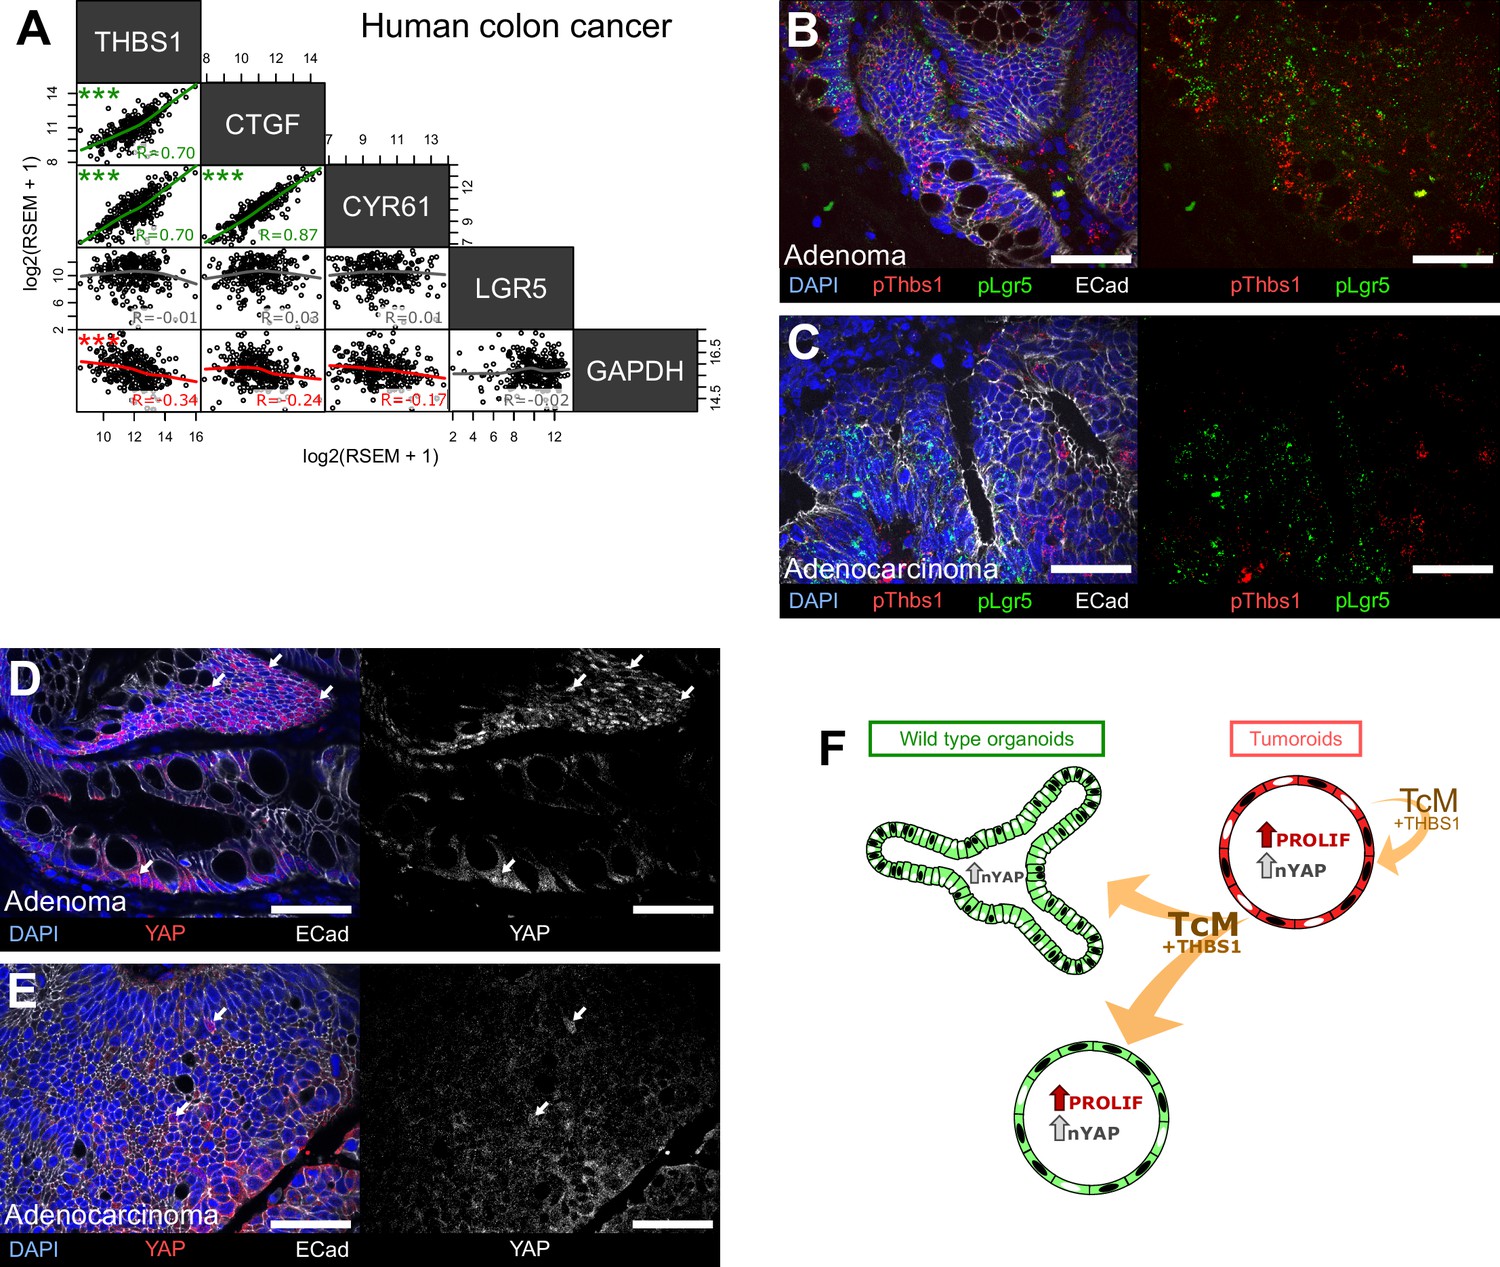
(A) Correlation matrix between the expression levels of THBS1 and the YAP targets CTGF, CYR61, and LGR5 in human colon tumours from the TCGA colon cancer bulk datasets. R indicates Spearman’s coefficient. (B–E) Representative sections of low-grade human adenomas (B, D) or advanced human carcinomas (C, E) processed by single-molecule RNA fluorescence in situ hybridisation (smRNA FISH) for Thbs1 (pThbs1, red dots) and Lgr5 (pLgr5, green dots in B, C) or immunostained with anti-YAP1 antibodies (D, E). White arrows highlight tumour cells presenting high nuclear YAP in (D, E). n = 5 human low-grade adenomas in (B, D) and n = 5 advanced human adenocarcinomas in (C, E). (F) Graphical summary of paracrine interactions between wildtype (WT) organoids and tumoroids along the THBS1-YAP axis. Mutant tumoroids ‘corrupt’ genetically WT organoids by secreting THBS-1 (orange arrows). This results in YAP1 nuclear translocation (black nuclei in organoids or tumoroids) and ectopic proliferation as well as cystic morphology in a subset of organoids.
Tables
Appendix 1—key resources table
| Reagent type (species) or resource | Designation | Source or reference | Identifiers | Additional information |
|---|---|---|---|---|
| Antibody | Anti-mouse Alexa Fluor 488 (donkey polyclonal) | Jackson ImmunoResearch | 715-546-150 | (1:500) |
| Antibody | Anti-mouse Alexa Fluor 488 (donkey polyclonal) | Jackson ImmunoResearch | 711-546-152 | (1:500) |
| Antibody | Anti-rabbit Alexa Fluor 488 (donkey polyclonal) | Thermo Fisher Scientific | A21206 | (1:300) |
| Antibody | Anti-mouse Alexa Fluor 633 (donkey polyclonal) | Thermo Fisher Scientific | A21202 | (1:300) |
| Antibody | Anti-rabbit Alexa Fluor 633 (goat polyclonal) | Thermo Fisher Scientific | A21071 | (1:300) |
| Antibody | Anti-rabbit Cy3 (goat polyclonal) | Thermo Fisher Scientific | A10520 | (1:300) |
| Antibody | Anti-rabbit Cy5 (goat polyclonal) | Thermo Fisher Scientific | A10523 | (1:300) |
| Antibody | Anti-β-catenin (mouse monoclonal) | BD Transduction Laboratories | 610153 | (1:200) |
| Antibody | Anti-ANG (mouse monoclonal) | Abcam | ab10600 | (2.5–25 μg/ml) |
| Antibody | Anti-E-cadherin (mouse monoclonal) | BD Transduction Laboratories | 610182 | (1:400) |
| Antibody | Anti-E-cadherin (rabbit monoclonal) | Cell Signaling Technology | 3195 | (1:300) |
| Antibody | Anti-FLAG (mouse monoclonal) | MilliporeSigma | F1804 | (1 μg/ml) |
| Antibody | Anti-LGALS3 (mouse monoclonal) | Abcam | ab2785 | (2.5–25 μg/ml) |
| Antibody | Anti-THBS1 (mouse monoclonal) | Novus Biologicals | 2059SS | (1:100) |
| Antibody | Anti-THBS1 A4.1 (mouse monoclonal) | Thermo Fisher Scientific | MA5-13377 | (5–20 μg/ml) |
| Antibody | Anti-THBS1 A6.1 (mouse monoclonal) | Novus Biologicals | NB100-2059 | (5–20 μg/ml) |
| Antibody | Anti-THBS1 C6.7 (mouse monoclonal) | Thermo Fisher Scientific | MA5-13390 | (5–20 μg/ml) |
| Antibody | IgG1 isotype control (MG1K) (mouse monoclonal) | Novus Biologicals | NBP1-96983 | (5–20 μg/ml) |
| Antibody | Anti-cleaved Caspase3 (rabbit polyclonal) | Cell Signaling Technology | 9661 | (1:200) |
| Antibody | Anti-CP (rabbit polyclonal) | Abcam | ab48614 | (2.5–25 μg/ml) |
| Antibody | Anti-CTGF (rabbit monoclonal) | R&D Systems | MAB91901-100 | (1.25–12.5 μg/ml) |
| Antibody | Anti-HDGF (rabbit polyclonal) | Novus Biologicals | NBP1-71926 | (0.5–5 μg/ml) |
| Antibody | Anti-Keratin 20 (rabbit monoclonal) | Cell Signaling Technology | 13063 | (1:200) |
| Antibody | Anti-Ki67 (rabbit polyclonal) | Abcam | ab15580 | (1:200) |
| Antibody | Anti-LGALS3BP (rabbit polyclonal) | Abcam | ab217760 | (2.5–25 μg/ml) |
| Antibody | Anti-YAP (rabbit monoclonal) | Cell Signaling Technology | 14074 | (1:100) |
| Antibody | Anti-TTR (sheep polyclonal) | Abcam | ab9015 | (63–120 μg/ml) |
| Biological sample (Homo sapiens) | CRC adenocarcinoma | Centre of Biological Resources of Institut Curie | ||
| Biological sample (H. sapiens) | Low-grade CRC adenoma | Centre of Biological Resources of Institut Curie | ||
| Cell line (H. sapiens) | HEK293T | ATCC | 12022001 | |
| Cell line (Mus musculus) | MEF | PMID:34782763 | MEFs derived from E13 wt embryo, a gift from Dr. Raphael Margueron | |
| Chemical compound, drug | Aqua poly/mount | Tebu Bio | 18606-5 | Pure |
| Chemical compound, drug | [13C6]-arginine (Arg6) | MilliporeSigma | 643440 | 1 µl/ml |
| Chemical compound, drug | [13C615N4]-arginine (Arg10) | MilliporeSigma | 608033 | 1 µl/ml |
| Chemical compound, drug | B27 | Thermo Fisher Scientific | 12587-010 | 1× |
| Chemical compound, drug | Cell Recovery Solution | Corning | 354253 | 1× |
| Chemical compound, drug | CHIR99021 | AMSBIO | 1677-5 | 5 μM |
| Chemical compound, drug | Citrate-based solution | Vector Laboratories | H-3300 | 1× |
| Chemical compound, drug | Cryostor10 | Stem Cell Technologies | 07930 | 1× |
| Chemical compound, drug | DMEM | Thermo Fisher Scientific | 31053028 | 1× |
| Chemical compound, drug | DMEM-F12 | Thermo Fisher Scientific | 11039-047 | 1× |
| Chemical compound, drug | DMEM F-12 FOR SILAC | Thermo Fisher Scientific | D1801047 | 1× |
| Chemical compound, drug | EDTA | MilliporeSigma | E6765 | 2 mM |
| Chemical compound, drug | EdU | Carbosynth Limited | NE08701 | 10 μM |
| Chemical compound, drug | FBS | Thermo Fisher Scientific | 10500064 | Pure |
| Chemical compound, drug | Fluoromount Aqueous Mounting Medium | MilliporeSigma | F4680 | Pure |
| Chemical compound, drug | GlutaMAX | Thermo Fisher Scientific | 35050038 | 1× |
| Chemical compound, drug | Glycerol | Euromedex | 15710 | 50% |
| Chemical compound, drug | hiFBS | Thermo Fisher Scientific | 10500064 | 10% |
| Chemical compound, drug | [²H4]-lysine (Lys4) | MilliporeSigma | 616192 | 1 µl/ml |
| Chemical compound, drug | [13C615N2]-lysine (Lys8) | MilliporeSigma | 608041 | 1 µl/ml |
| Chemical compound, drug | [13C615N4]-arginine (Arg10) | MilliporeSigma | 608033 | 1 µl/ml |
| Chemical compound, drug | NaCl | MilliporeSigma | S9888 | 150 mM |
| Chemical compound, drug | Non-Essential Amino Acids | Thermo Fisher Scientific | 11140035 | 1× |
| Chemical compound, drug | Paraformaldehyde | Euromedex | 15710 | 4% |
| Chemical compound, drug | PEI | Tebu bio | 24765-2 | 1 µg/µl |
| Chemical compound, drug | Penicillin-Streptomycin | Thermo Fisher Scientific | 15140122 | 200 U/ml |
| Chemical compound, drug | ProLong Gold Antifade Reagent | Thermo Fsher Scientific | P36930 | Pure |
| Chemical compound, drug | TransDux | System Biosciences | LV850A-1 | 1× |
| Chemical compound, drug | Triton X-100 | Euromedex | 2000C | 1% |
| Chemical compound, drug | TrypLE | Gibco | 12605 | 0.3× |
| Chemical compound, drug | TSA Plus Cyanine-3 | Akoya Biosciences | NEL744001KT | 1/750 |
| Chemical compound, drug | TSA Plus Cyanine-5 | Akoya Biosciences | NEL741001KT | 1/750 |
| Chemical compound, drug | TSA Plus Fluorescein | Akoya Biosciences | NEL766001KT | 1/750 |
| Chemical compound, drug | UEA | Vector Laboratories | RL-1062 | 1/50 |
| Chemical compound, drug | Verteporfin | MilliporeSigma | SML0534 | 5–10 μM |
| Chemical compound, drug | Y27632 | MilliporeSigma | Y0503 | 10 μM |
| Commercial assay or kit | EdU click-it kit | Thermo Fisher Scientific | C10340 | |
| Commercial assay or kit | RNAscope Multiplex Fluorescent Detection Kit v2 | ACD | 323110 | |
| Commercial assay or kit | RNAscope Probe Hs-LGR5-C3 | ACD | 311021-C3 | |
| Commercial assay or kit | RNAscope Probe Hs-THBS1-C2 | ACD | 426581-C2 | |
| Commercial assay or kit | RNAscope Probe Mm-CTGF | ACD | 314541 | |
| Commercial assay or kit | RNAscope Probe Mm-Lgr5 | ACD | 312171 | |
| Commercial assay or kit | RNAscope Probe Mm-Thbs1-C3 | ACD | 57891-C3 | |
| Gene (H. sapiens) | Lgr5 | Ensembl | ENSG00000139292 | |
| Gene (H. sapiens) | Thbs1 | Ensembl | ENSG00000137801 | |
| Gene (H. sapiens) | Yap1 | Ensembl | ENSG00000137693 | |
| Gene (M. musculus) | Cp | Ensembl | ENSMUSG00000003617 | |
| Gene (M. musculus) | Ctgf (CCN2) | Ensembl | ENSMUSG00000019997 | |
| Gene (M. musculus) | Hdgf | Ensembl | ENSMUSG00000004897 | |
| Gene (M. musculus) | Lgals-3 | Ensembl | ENSMUSG00000050335 | |
| Gene (M. musculus) | Lgals-3bp | Ensembl | ENSMUSG00000033880 | |
| Gene (M. musculus) | Lgr5 | Ensembl | ENSMUSG00000020140 | |
| Gene (M. musculus) | Tead4 | Ensembl | ENSMUSG00000030353 | |
| Gene (M. musculus) | Thbs1 | Ensembl | ENSMUSG00000040152 | |
| Gene (M. musculus) | Ttr | Ensembl | ENSMUSG00000061808 | |
| Gene (M. musculus) | Yap1 | Ensembl | ENSMUSG00000053110 | |
| Other | Amicon Ultra Centrifugal Filters | MilliporeSigma | UFC910024 | Filters used to concentrate the viral preparations |
| Peptide, recombinant protein | mEGF | Thermo Fisher Scientific | 315-09 | (50 ng/ml) |
| Peptide, recombinant protein | mNoggin | PeproTech | 250-38 | (100 ng/ml) |
| Peptide, recombinant protein | mRspo1 | PeproTech | 3474-RS | (500 ng/ml) |
| Peptide, recombinant protein | rmTHBS1 | R&D Systems | 7859-TH-050 | (1–5 μg/ml) |
| Peptide, recombinant protein | Wnt3A | R&D Systems | 1324-WN-002 | (5 ng/ml) |
| Sequence-based reagent | STead4F | Eurofins Genomics | This paper | CTCTAACAGG TCCAACGGGC |
| Sequence-based reagent | STead4R | Eurofins Genomics | This paper | CAGCTCAGAC AGGCTCCTTAC |
| Sequence-based reagent | SThbs1F | Eurofins Genomics | This paper | GCGGGAGGTT TACCTGTGTG |
| Sequence-based reagent | SThbs1R | Eurofins Genomics | This paper | CCTCTTTAAAA GGTCCTGGGCT |
| Sequence-based reagent | SYap1F | Eurofins Genomics | This paper | GCCGCATGG GCACGGTCT |
| Sequence-based reagent | SYap1R | Eurofins Genomics | This paper | TGCGGGCG CGCGTCGC |
| Sequence-based reagent | Tead4-2 sgRNA | Eurofins Genomics | This paper | CCCATCGACA ATGATGCAGA |
| Sequence-based reagent | Thbs 1-1 sgRNA | Eurofins Genomics | This paper | CGGGGCTCA GTAACCCGGAG |
| Sequence-based reagent | Yap1-1 sgRNA | Eurofins Genomics | This paper | AGTCGGTCTC CGAGTCCCCG |
| Software, algorithm | ApE | https://jorgensen.biology.utah.edu/ | v2.0.61 | |
| Software, algorithm | clusterProfiler | R package | v3.14.3 | |
| Software, algorithm | edgeR | PMID:19910308 | v3.25.9 | |
| Software, algorithm | Fiji | https://imagej.net/ | v1.53c | |
| Software, algorithm | GSEA | https://gsea-msigdb.org/ | v4.0.3 | |
| Software, algorithm | Ilastik | https://www.ilastik.org/ | v1.3.2 | |
| Software, algorithm | Limma | PMID:25605792 | ||
| Software, algorithm | msigdbr | R package | v7.1.1 | |
| Software, algorithm | PerformanceAnalytics | R package | v2.0.4 | |
| Software, algorithm | STAR mapper | PMID:23104886 | v2.5.3a | |
| Software, algorithm | Thermo Scientific Proteome Discoverer | Thermo Fisher Scientific | v2.1 | |
| Software, algorithm | UniProt-GOA Mouse | v.20181203 | ||
| Software, algorithm | Xcalibur | Thermo Fisher | OPTON-30965 | v3.0 |
| Strain, strain background (M. musculus) | Apc1638N | PMID:8090754 | MGI:1857951 | |
| Strain, strain background (M. musculus) | ApcΔ14 | PMID:15563600 | MGI:3521822 | |
| Strain, strain background (M. musculus) | C57BL/6 | Charles Rivers | C57BL/6NCrl | Strain maintained in Institut Curie Mouse Facility |
| Strain, strain background (M. musculus) | Lgr5-GFP | PMID:17934449 | MGI:3833921 | |
| Strain, strain background (M. musculus) | LifeAct-GFP | PMID:18536722 | MGI:6335778 | |
| Strain, strain background (M. musculus) | R26CreERT2 | PMID:17251932 | MGI:3790674 | |
| Strain, strain background (M. musculus) | R26-LSL-Cas9-GFP | PMID:25263330 | MGI:25263330 | |
| Strain, strain background (M. musculus) | R26mTmG | PMID:17868096 | MGI:3722404 | |
| Transfected construct | Lenti-7TG | Addgene | 24314 | |
| Transfected construct | LentiCas9Blast | Addgene | 52962 | |
| Transfected construct | Lenti-CRISPRv2 | Addgene | 82416 | |
| Transfected construct | Lenti-sgRNA-GFP | Addgene | 65656 | |
| Transfected construct | Lenti-sgRNA-mTomato | This paper | Derived from Lenti-sgRNA-GFP | |
| Transfected construct | LentiThbs1-FLAG | Origene | MR211744L3V | |
| Transfected construct | pMD2.G | Addgene | 12259 | |
| Transfected construct | psPAX2 | Addgene | 12260 |
Additional files
Download links
A two-part list of links to download the article, or parts of the article, in various formats.
Downloads (link to download the article as PDF)
Open citations (links to open the citations from this article in various online reference manager services)
Cite this article (links to download the citations from this article in formats compatible with various reference manager tools)
Paracrine signalling between intestinal epithelial and tumour cells induces a regenerative programme
eLife 11:e76541.
https://doi.org/10.7554/eLife.76541


