Gut microbial trimethylamine is elevated in alcohol-associated hepatitis and contributes to ethanol-induced liver injury in mice
- Department of Cardiovascular and Metabolic Sciences, Lerner Research Institute of the Cleveland Clinic, United States
- Center for Microbiome and Human Health, Lerner Research Institute, Cleveland Clinic, United States
- Department of Pediatrics, Division of Pediatric Gastroenterology, Hepatology, and Nutrition, College of Medicine, University of Kentucky, United States
- Department of Inflammation and Immunity, Lerner Research Institute, Cleveland Clinic, United States
- Department of Quantitative Health Sciences, Lerner Research Institute, Cleveland Clinic, United States
- Department of Medicine, University of Louisville, United States
- Department of Internal Medicine, University of Texas Southwestern Medical Center, United States
- National Institute on Alcohol Abuse and Alcoholism, United States
- Department of Population and Quantitative Health Sciences, University of Massachusetts Medical School, United States
- Department of Medicine, Beth Israel Deaconess Medical Center and Harvard Medical School, United States
- Life Sciences Transformative Platform Technologies, Procter & Gamble, United States
- Department of Anatomical Pathology, Cleveland Clinic, United States
- Department of Cardiovascular Medicine, Heart and Vascular and Thoracic Institute, Cleveland Clinic, United States
Figures
Figure 1 with 1 supplement

The gut microbial volatile metabolite trimethylamine (TMA) is elevated in alcohol-associated hepatitis (AH).
Plasma TMA (A) and trimethylamine N-oxide (TMAO) (B) levels in patients considered healthy (n = 13 for TMA and 20 for TMAO), or who have moderate (MELD < 20) (n = 52 for TMA and 111 for TMAO) or severe (MELD > 20) (n = 83 for TMA and 152 for TMAO) AH. (C) RNA sequencing results from liver tissues of patients with different pathologies, including: healthy controls (HC, n = 10), early AH (EAH, n = 12; MELD 7–8), AH with liver failure (AHL, n = 18; MELD 22–28), explant tissue from patients with severe AH with emergency liver transplants (ExAH, n = 10; MELD 18–21), non-alcohol-associated fatty liver disease (NAFLD; n = 8), hepatitis C virus (HCV; n = 9), and hepatitis C virus with cirrhosis (HCV_Cirr, n = 9). Gene expression was measured by transcripts per million (TPM). Boxplots of average expression for Fmo3 in different disease groups; error bars indicate SD (q < 0.05 in comparison to healthy controls). (D) Liver FMO3 protein expression measured by Western blot from healthy patients and patients with severe AH undergoing emergency liver transplant (Maddrey’s discriminant function 45–187). (E) Liver Tnfa, Il1b, Fmo3, and Taar5 transcript levels were measured by qPCR from female WT mice injected with either saline or lipopolysaccharide (LPS) for 6 hr. N = 6; unpaired Student’s t-test. *p ≤ 0.05; ***p ≤ 0.001.
-
Figure 1—source data 1
Demographic and clinical parameters for entire cohort of healthy controls and patients with AH.
- https://cdn.elifesciences.org/articles/76554/elife-76554-fig1-data1-v3.docx
-
Figure 1—source data 2
Demographic and clinical parameters for subset of healthy controls and patients with AH included in TMA assay.
- https://cdn.elifesciences.org/articles/76554/elife-76554-fig1-data2-v3.docx
-
Figure 1—source data 3
Liver flavin-containing monooxygenase 3 (FMO3) protein expression measured by Western blot from healthy patients (HC) and patients with severe alcohol-associated hepatitis (AH) undergoing emergency liver transplant (Maddrey’s discriminant function 45–187).
These data are showing the entire blot.
- https://cdn.elifesciences.org/articles/76554/elife-76554-fig1-data3-v3.zip
-
Figure 1—source data 4
Liver flavin-containing monooxygenase 3 (FMO3) protein expression measured by Western blot from healthy patients (HC) and patients with severe alcohol-associated hepatitis (AH) undergoing emergency liver transplant (Maddrey’s discriminant function 45–187).
These data are showing the cropped version of the blot.
- https://cdn.elifesciences.org/articles/76554/elife-76554-fig1-data4-v3.zip
-
Figure 1—source data 5
Liver HSC70 protein expression measured by Western blot from healthy patients (HC) and patients with severe alcohol-associated hepatitis (AH) undergoing emergency liver transplant (Maddrey’s discriminant function 45–187).
These data are showing the entire blot.
- https://cdn.elifesciences.org/articles/76554/elife-76554-fig1-data5-v3.zip
-
Figure 1—source data 6
Liver HSC70 protein expression measured by Western Blot from healthy patients (HC) and patients with severe alcohol-associated hepatitis (AH) undergoing emergency liver transplant (Maddrey’s discriminant function 45–187).
These data are showing the cropped version of the blot.
- https://cdn.elifesciences.org/articles/76554/elife-76554-fig1-data6-v3.zip
Figure 1—figure supplement 1
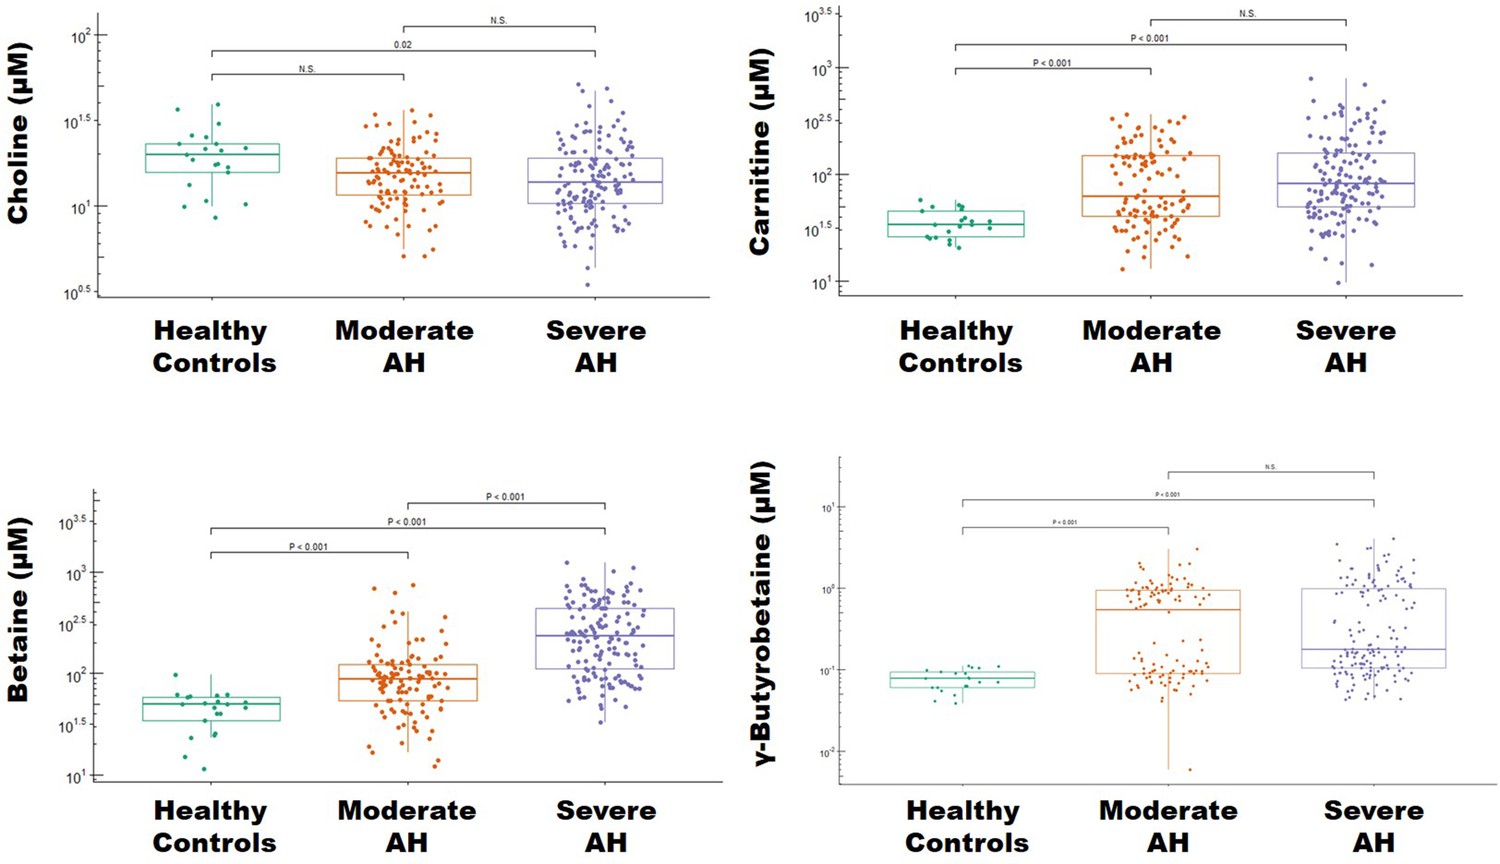
Levels of trimethylamine (TMA)-related metabolites in alcohol-associated hepatitis (AH).
Boxplots depicting the plasma concentration of four TMA-related metabolites – choline, carnitine, betaine, and γ-butyrobetaine in healthy controls (n = 21) and patients with moderate (n = 112) and severe (n = 152) alcoholic hepatitis (AH). Statistical significance was determined by analysis of variance and a Tukey’s honest significant difference post hoc test (p < .05).
Figure 2 with 1 supplement
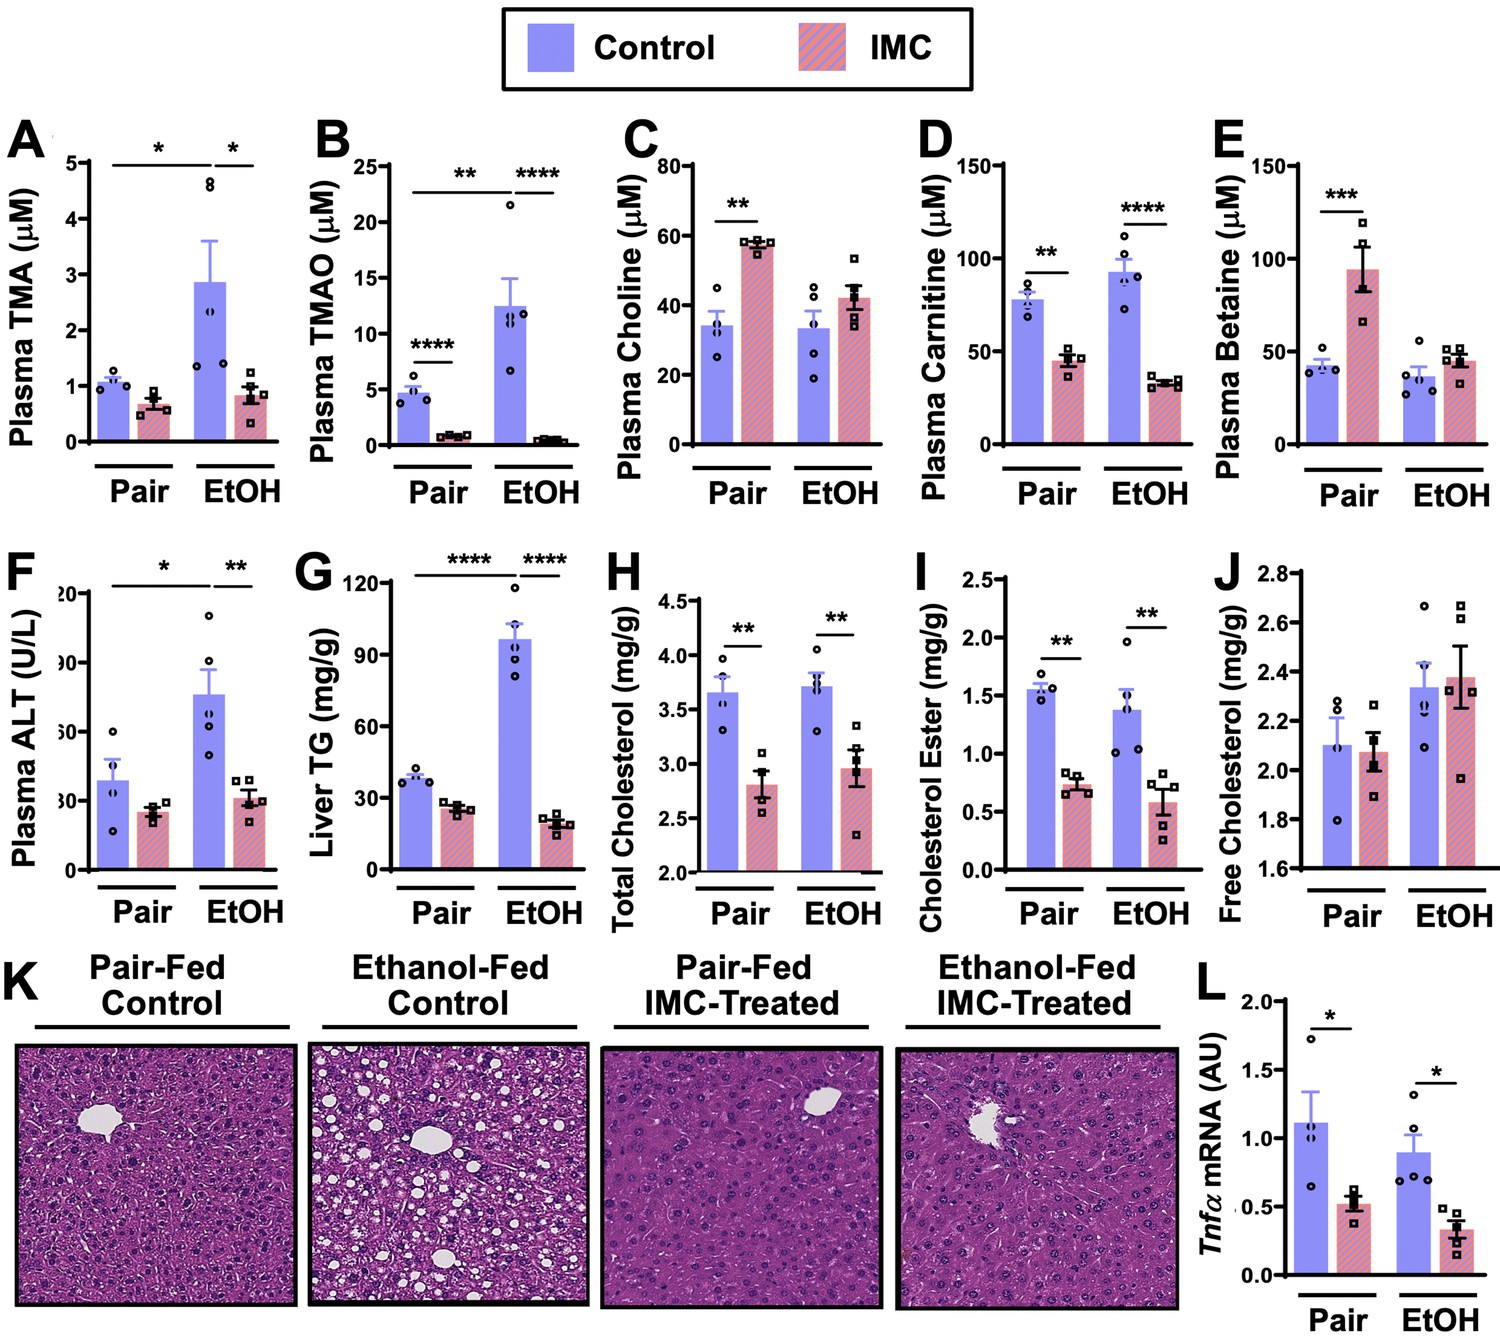
Small molecule choline trimethylamine (TMA) lyase inhibition with iodomethylcholine (IMC) protects mice against ethanol-induced liver injury.
Nine- to eleven-week-old female C57BL6/J mice were fed either ethanol-fed or pair-fed in the presence and absence of IMC as described in the methods. Plasma levels of TMA (A), trimethylamine N-oxide (TMAO) (B), choline (C), carnitine (D), and betaine (E) were measured by mass spectrometry (n = 4–5). Plasma alanine aminotransferase (ALT) (F) was measured enzymatically (n = 4–5). Liver triglycerides (G), total cholesterol (H), cholesterol esters (I), and free cholesterol (J) were measured enzymatically (n = 4–5). (K) Representative H&E staining of livers from pair and EtOH-fed mice in the presence and absence of IMC. (L) Hepatic messenger RNA levels of tumor necrosis factor alpha (Tnfα). Statistics were completed by a two-way analysis of variance (ANOVA) followed by a Tukey’s multiple comparison test. *p ≤ 0.05; **p ≤ 0.01; ***p ≤ 0.001; ****p ≤ 0.0001. All data are presented as mean ± SEM, unless otherwise noted.
Figure 2—figure supplement 1
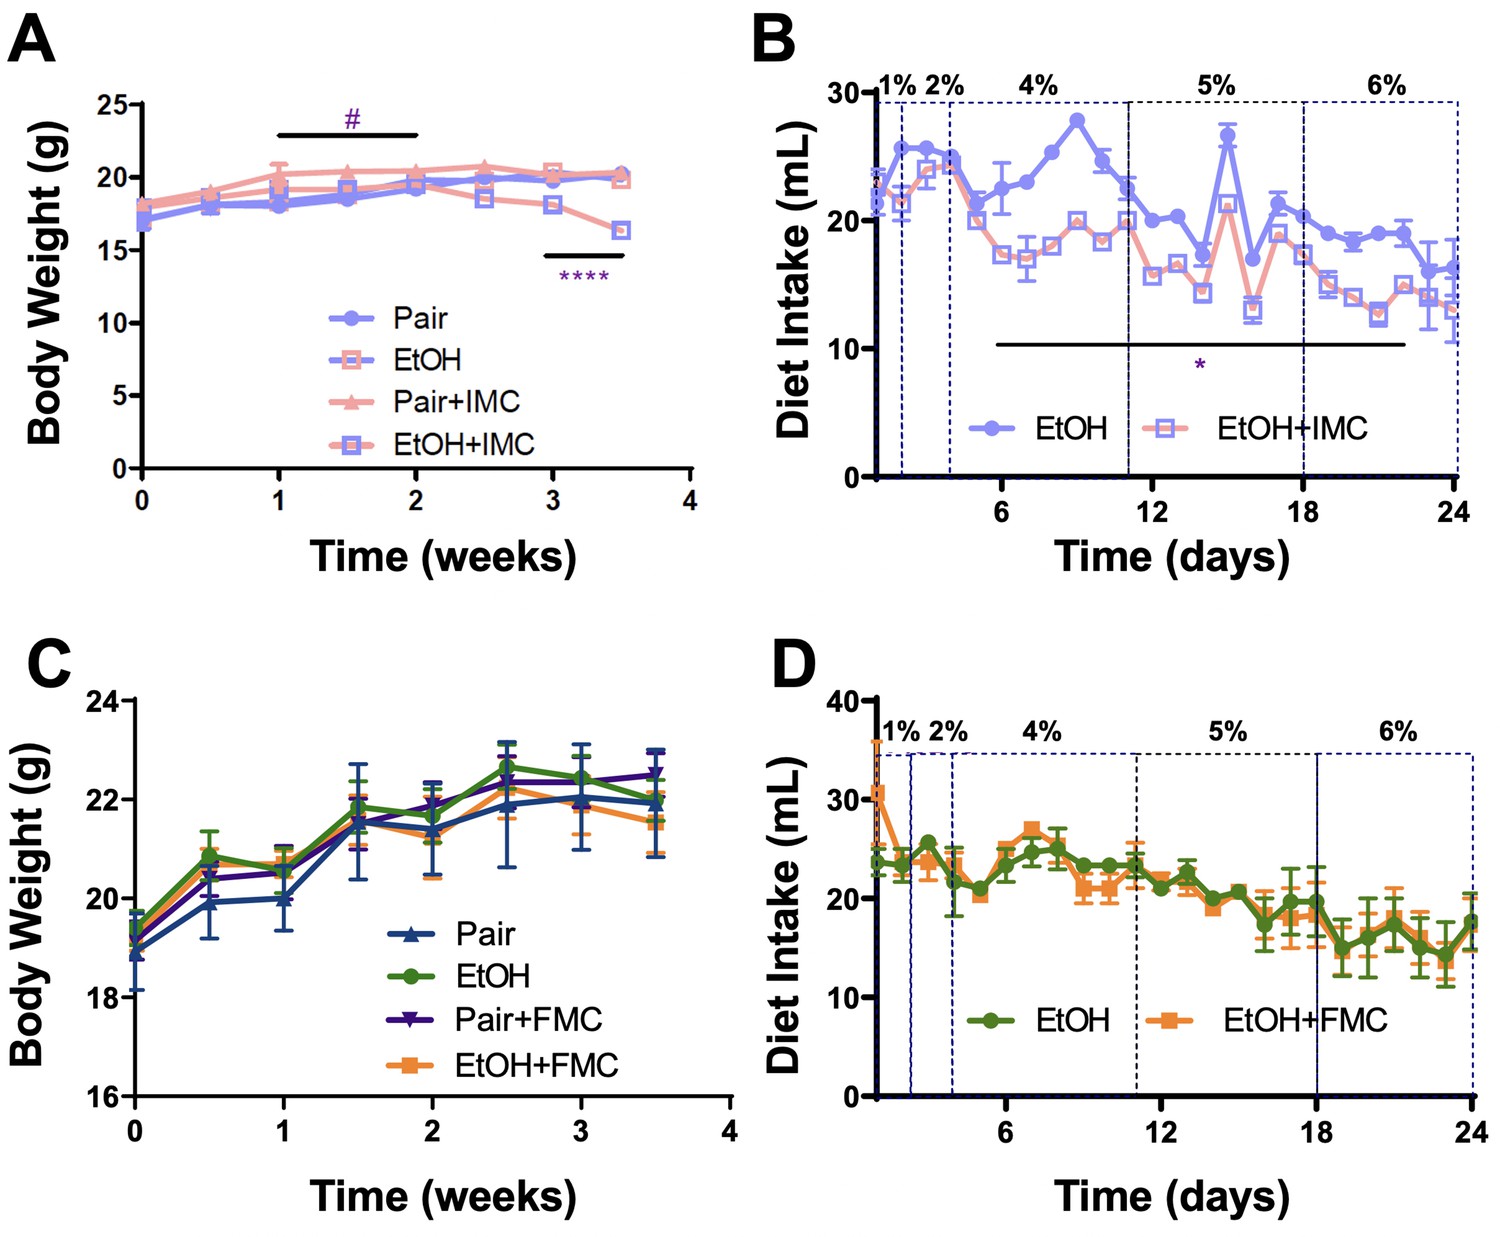
Small molecule inhibition with iodomethylcholine (IMC), but not fluoromethylcholine (FMC), reduces food intake in ethanol-fed mice.
Panels A–B and C–D represent data from IMC- and FMC-treated pair and ethanol-fed mice, respectively. (A, C) Body weights were measured biweekly throughout the 24-day experiment. #p ≤ 0.05 comparing pair to pair + IMC; ****p ≤ 0.0001 comparing ethanol to ethanol + IMC. (B, D) Diet intake was recorded daily throughout the experiment (n = 3 cages of six mice per group). The ethanol percentages (1–6%) are listed on top of the figures. *p ≤ 0.05 for days 6–22; n = 4–6. Statistics were completed using a Student’s t-test compared to the control mice. All data are presented as mean ± SEM, unless otherwise noted.
Figure 3 with 2 supplements
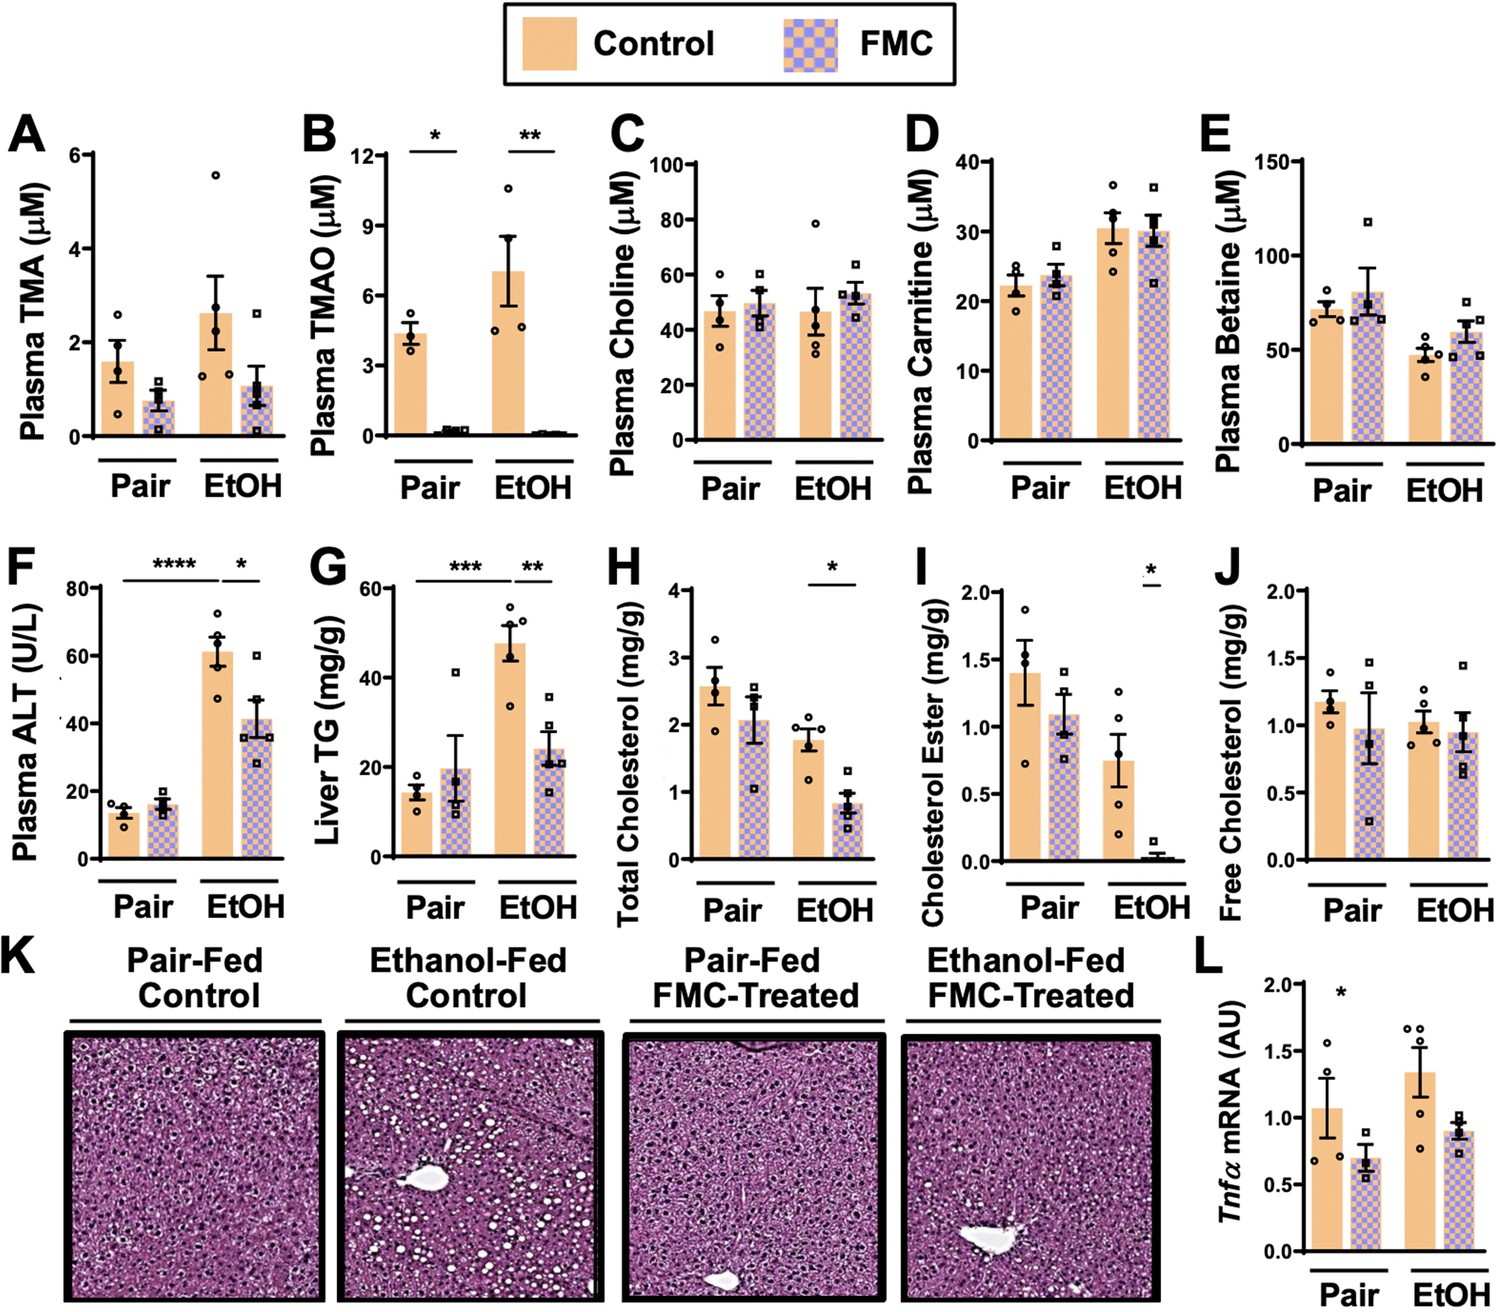
Small molecule choline trimethylamine (TMA) lyase inhibition with fluoromethylcholine (FMC) protects mice against ethanol-induced liver injury.
Nine- to eleven-week-old female C57BL6/J mice were fed either ethanol-fed or pair-fed in the presence and absence of FMC as described in the methods. Plasma levels of TMA (A), trimethylamine N-oxide (TMAO) (B), choline (C), carnitine (D), and betaine (E) were measured by mass spectrometry (n = 3–5). Plasma alanine aminotransferase (ALT) (F) were measured at necropsy (n = 4–5). Liver triglycerides (G), total cholesterol (H), cholesterol esters (I), and free cholesterol (J) were measured enzymatically (n = 4–5). (K) Representative H&E staining of livers from pair and EtOH-fed mice in the presence and absence of FMC. (L) Hepatic messenger RNA levels of tumor necrosis factor alpha (Tnfα). Statistics were completed by a two-way analysis of variance (ANOVA) followed by a Tukey’s multiple comparison test. *p ≤ 0.05; **p ≤ 0.01; ***p ≤ 0.001; ****p ≤ 0.0001. All data are presented as mean ± SEM, unless otherwise noted.
Figure 3—figure supplement 1
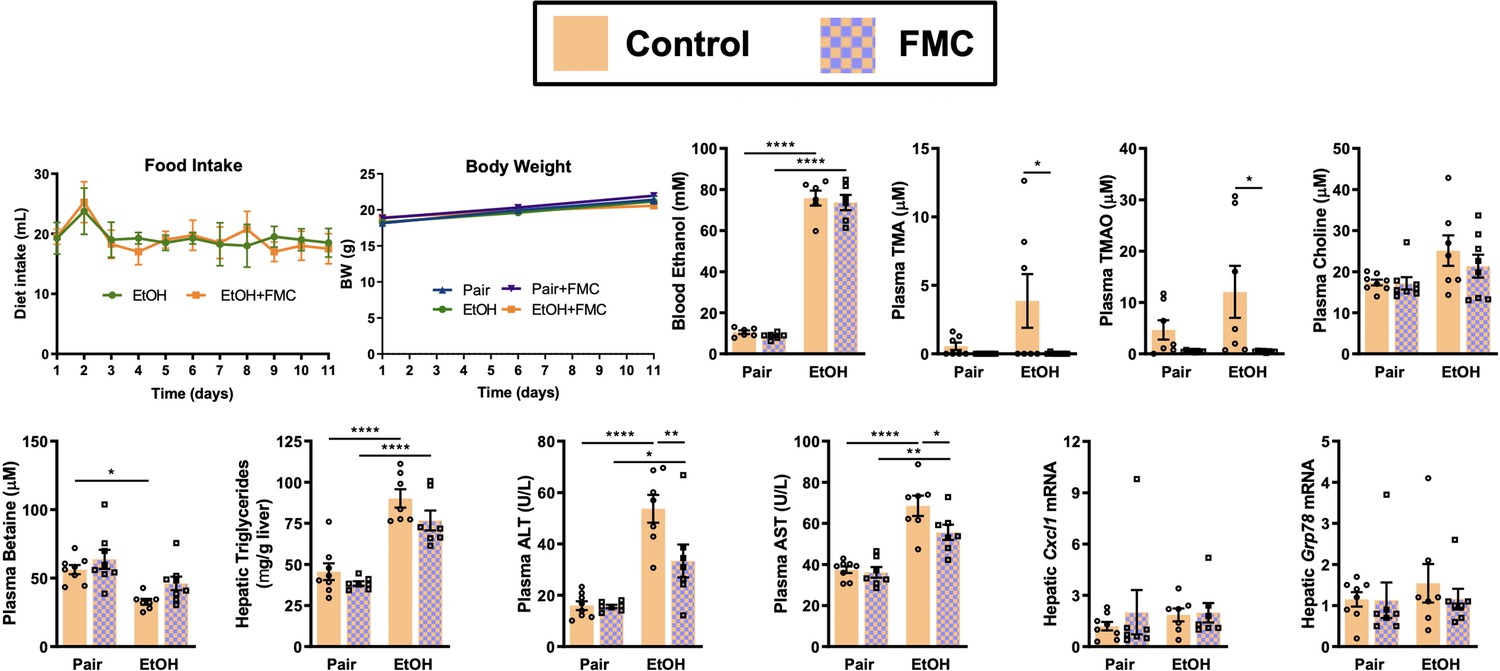
Small molecule inhibition of gut microbial trimethylamine (TMA) lyase activity with fluoromethylcholine (FMC) in a second model of ethanol-induced liver injury.
In this study, mice were exposed to a 10-day chronic model in which mice were allowed free access to a 5% vol/vol (27% kcal) for 10 days (Bertola et al., 2013). Ethanol-fed mice were allowed ad libitum access to liquid diet. Control mice were pair-fed a diet that received isocalorically substituted maltose dextrin for ethanol. Some cohorts received choline TMA lyase inhibitor FMC (0.006% wt/wt) in these liquid diets throughout the entire 10-day feeding period. Statistics were completed by a two-way analysis of variance (ANOVA) followed by a Tukey’s multiple comparison test. *p ≤ 0.05; **p ≤ 0.01; ***p ≤ 0.001; ****p ≤ 0.0001. All data are (n = 5–8 per group) presented as mean ± SEM.
Figure 3—figure supplement 2
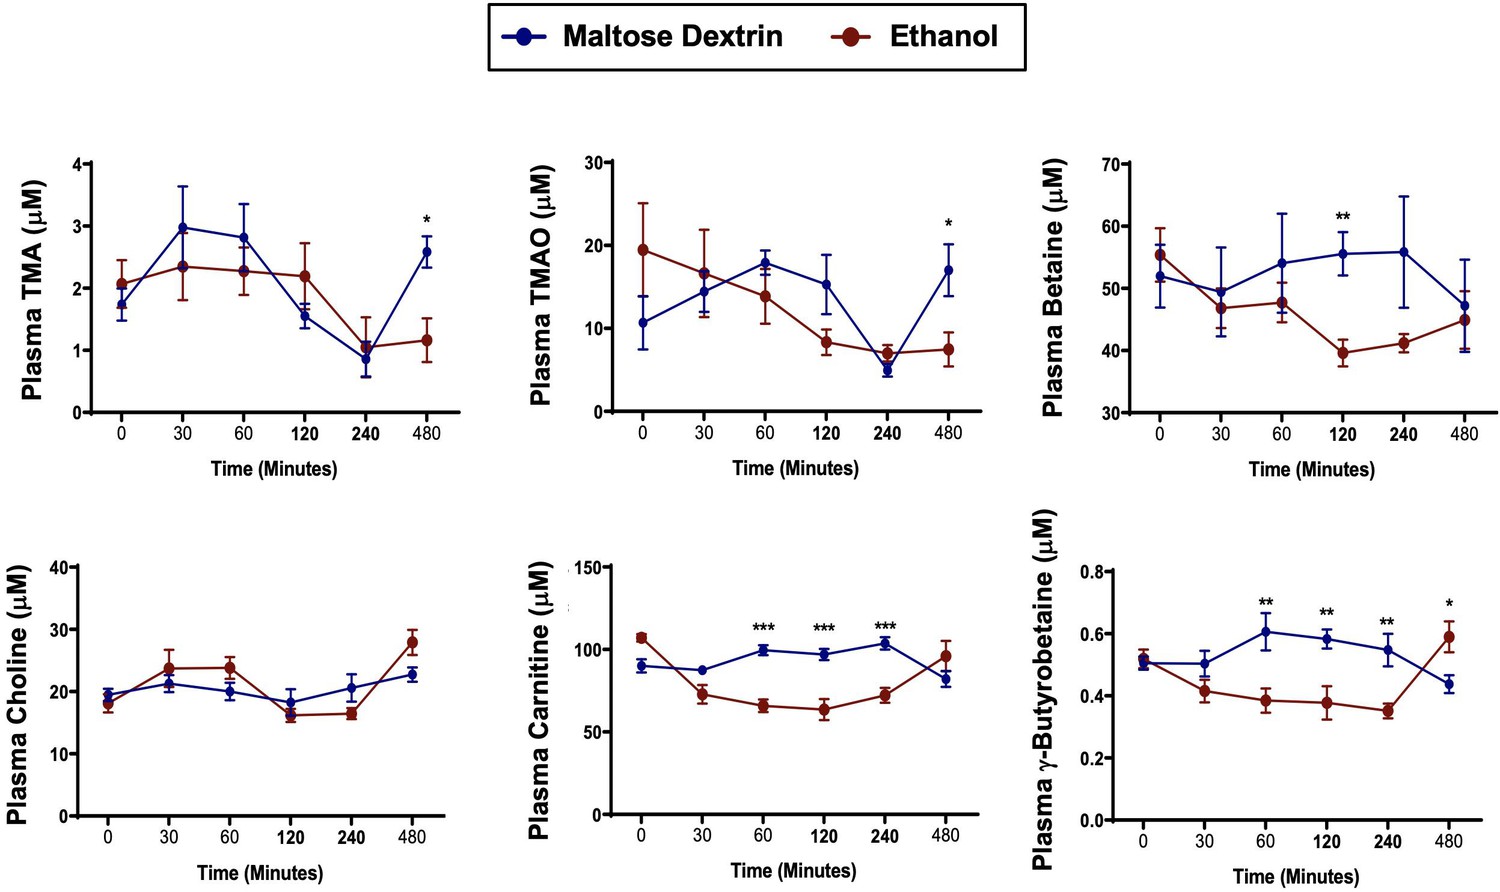
A single bolus of ethanol does not significantly alter trimethylamine (TMA) or trimethylamine N-oxide (TMAO) levels in mice.
Nine- to eleven-week-old female C57BL6/J mice were fed Lieber DeCarli liquid control diet for 6 days (n = 5). On the seventh day, mice were gavaged with a bolus of maltose (9 g/kg) or ethanol (5 g/kg) and plasma was collected at several time points thereafter to examine acute alterations in TMA and related metabolites TMAO, betaine, choline, L-carnitine, and γ-butyrobetaine. Data were analyzed by a Student’s t-test comparing the ethanol-fed mice to the maltose dextrin-gavaged mice. *p ≤ 0.05; **p ≤ 0.01; ***p ≤ 0.001. All data are presented as mean ± SEM, unless otherwise noted.
Figure 4
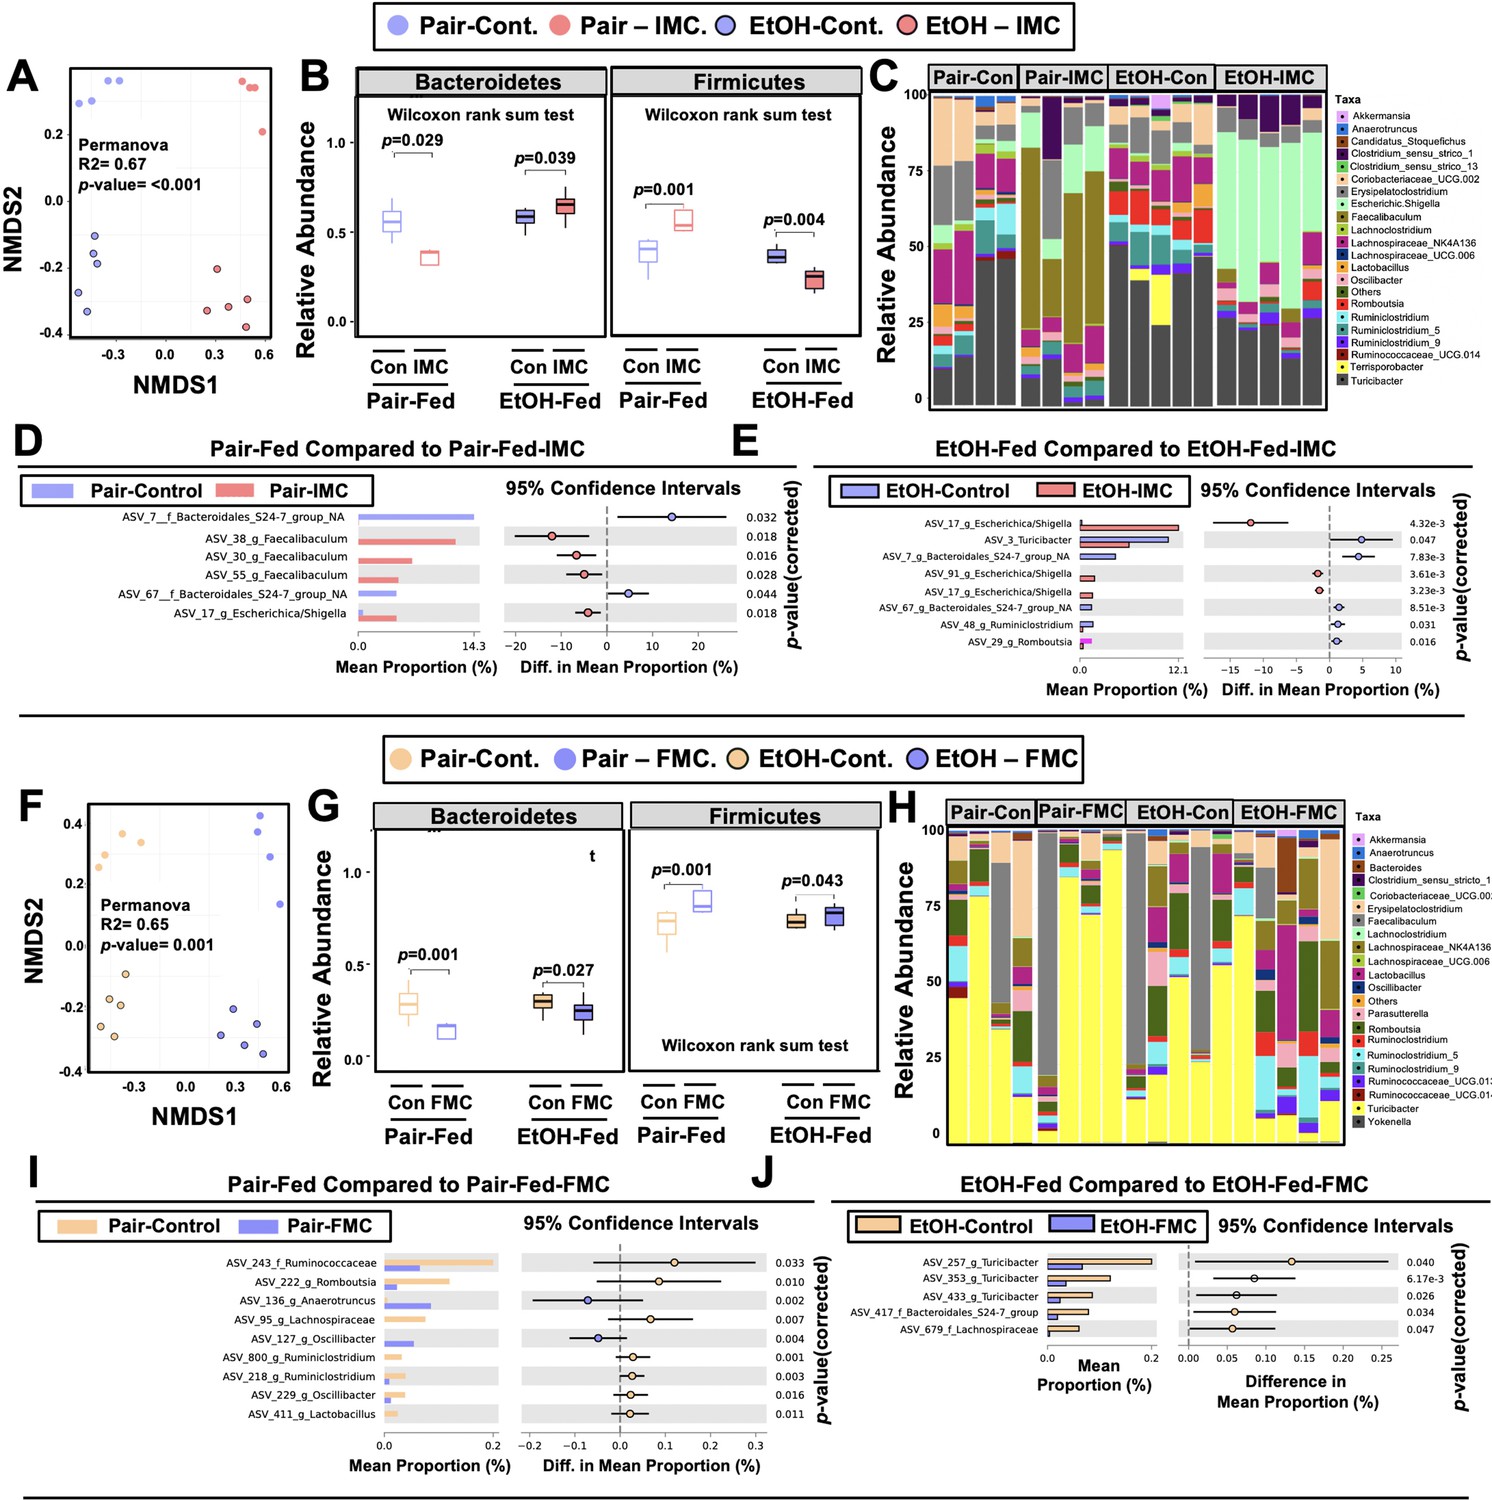
Small molecule choline trimethylamine (TMA) lyase inhibition promotes remodeling of the gut microbiome in an ethanol-dependent manner.
Nine- to eleven-week-old female C57BL6/J mice were fed either ethanol-fed or pair-fed in the presence and absence of iodomethylcholine (IMC) or fluoromethylcholine (FMC) as described in the methods. (A) Non-metric multidimensional scaling (NMDS) plots based on the Bray-Curtis index between the pair, EtOH, pair + 0.06% IMC, and EtOH + 0.06% IMC groups, Statistical analysis was performed with permutational multivariate analysis of variance (PERMANOVA), and p-values are labeled in plots. R2 values are noted for comparisons with significant p-values and stand for percentage variance explained by the variable of interest. (B) Boxplots of relative abundance patterns for Firmicutes and Bacteroidetes distinguishing pair, EtOH, pair + 0.06% IMC and EtOH + 0.06% IMC groups. Statistical analysis was performed with Mann-Whitney U test (also called the Wilcoxon rank-sum test, p-values are labeled in plots). Plotted are interquartile ranges (boxes), and dark lines in boxes are medians. (C) Stacked bar charts of relative abundance (left y-axis) of the top 20 genera assembled across all four groups (pair, EtOH, pair + 0.06% IMC, and EtOH + 0.06% IMC groups). Pairwise differential abundance analyses between (D) pair-fed and pair-fed + 0.06% IMC and (E) EtOH-fed and EtOH-fed + 0.06% IMC group. Statistical analysis was performed with White’s non-parametric t-test (p-values are labeled in plots). (F) NMDS plots based on the Bray-Curtis index between the pair, EtOH, pair + 0.006% FMC, and EtOH + 0.006% FMC groups, Statistical analysis was performed with permutational multivariate analysis of variance (PERMANOVA), and p-values are labeled in plots. R2 values are noted for comparisons with significant p-values and stand for percentage variance explained by the variable of interest. (G) Boxplots of relative abundance patterns for Firmicutes and Bacteroidetes distinguishing pair, EtOH, pair + 0.006% FMC, and EtOH + 0.006% FMC groups. Statistical analysis was performed with Mann-Whitney U test (also called the Wilcoxon rank-sum test, p-values are labeled in plots). Plotted are interquartile ranges (boxes), and dark lines in boxes are medians. (H) Stacked bar charts of relative abundance (left y-axis) of the top 20 genera assembled across all four groups (pair, EtOH, pair + 0.06% FMC, and EtOH + 0.006% FMC groups). Pairwise differential abundance analyses between (I) pair-fed and pair-fed + 0.06% FMC, and (J) EtOH-fed and EtOH-fed + 0.006% FMC group. Statistical analysis was performed with White’s non-parametric t-test (p-values are labeled in plots).
Figure 5

Small molecule choline trimethylamine (TMA) lyase inhibition with iodomethylcholine (IMC) alters the hepatic transcriptome in response to ethanol.
Nine- to eleven-week-old female C57BL6/J mice were fed either ethanol-fed or pair-fed in the presence and absence of IMC as described in the methods. RNA was isolated from the livers and subjected to next-generation sequencing. (A) Non-metric multidimensional scaling (NMDS) plots; each point represents a single sample from a single mouse. Positions of points in space display dissimilarities in the transcriptome, with points further from one another being more dissimilar. (B–C) Row-normalized expression for the top 25 DEGs shown by heat map (B) while the volcano plot (C) summarizes log2 fold changes vs. significance in response to IMC treatment in pair (left) and ethanol (right) feeding (n = 4). (D) Summary of significantly differentially regulated pathways in mice treated with IMC in the ethanol-fed mice (n = 4).
Figure 6
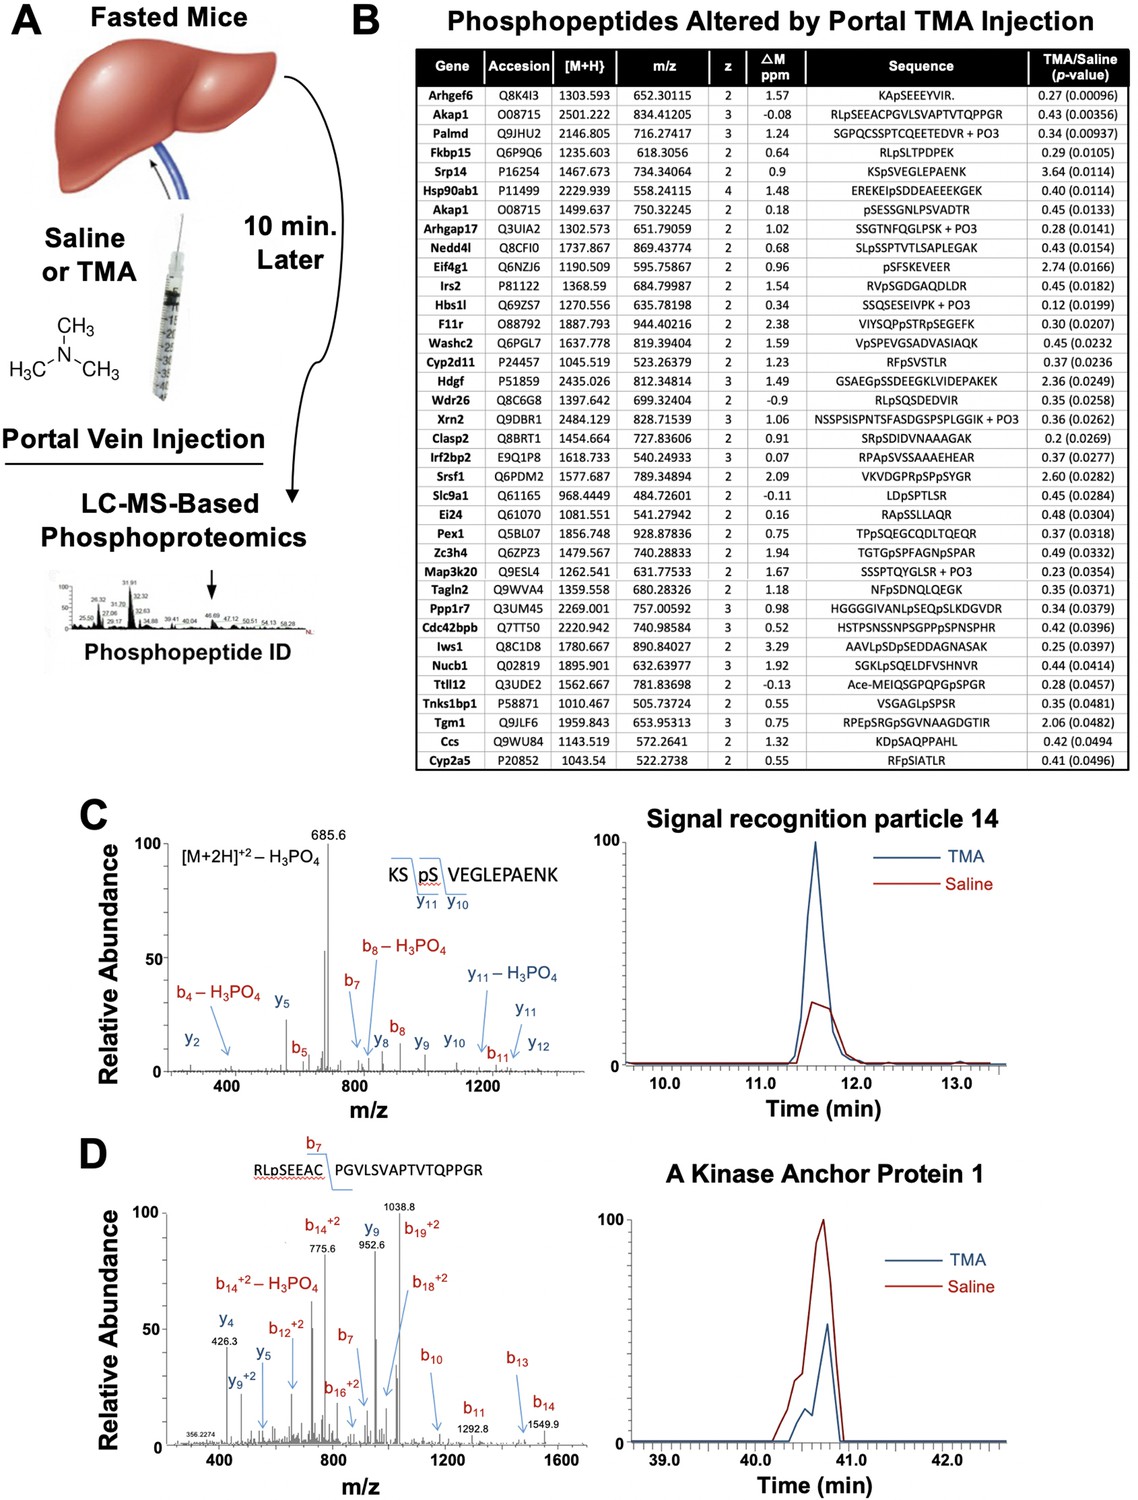
Trimethylamine (TMA) rapidly reorganizes liver signal transduction in vivo.
(A) Schematic of experiment; female C57BL/6 mice were fasted overnight (12 hr fast), and then injected directly into the portal vein with vehicle (saline), or TMA, and only 10 min later liver tissue was harvested for phosphoproteomic analysis to identify TMA-responsive phosphorylation events in mouse liver (n = 4 per group). (B) List of proteins that were differentially phosphorylated (p < 0.05) upon TMA administration in vivo. (C) A doubly charged ion was present in the phospho-enriched sample that was identified as the KSpSVEGLEPAENK from signal recognition particle 14 kDa protein (Srp14). The CID spectra of this ion is dominated by H3PO4 loss from the precursor ion consistent with the presence of a pS or pT residue. The mass difference between the y11 and y10 ions is consistent with modification at S45. The observed chromatograms for this peptide from the saline and TMA samples are shown and the TMA/saline ratio was determined to be 3.6 (p-value 0.0114). (D) A doubly charged ion was present in the phospho-enriched sample that was identified as the RLpSEEACPGVLSVAPTVTQPPGR from A-kinase anchor protein 1. The CID spectra of this ion is dominated by fragmentation C-terminal to the proline residues. The mass of the b7 ion is consistent with modification at S55. The observed chromatograms for this peptide from the saline and TMA samples are shown and the TMA/saline ratio was determined to be 0.4.
Figure 7
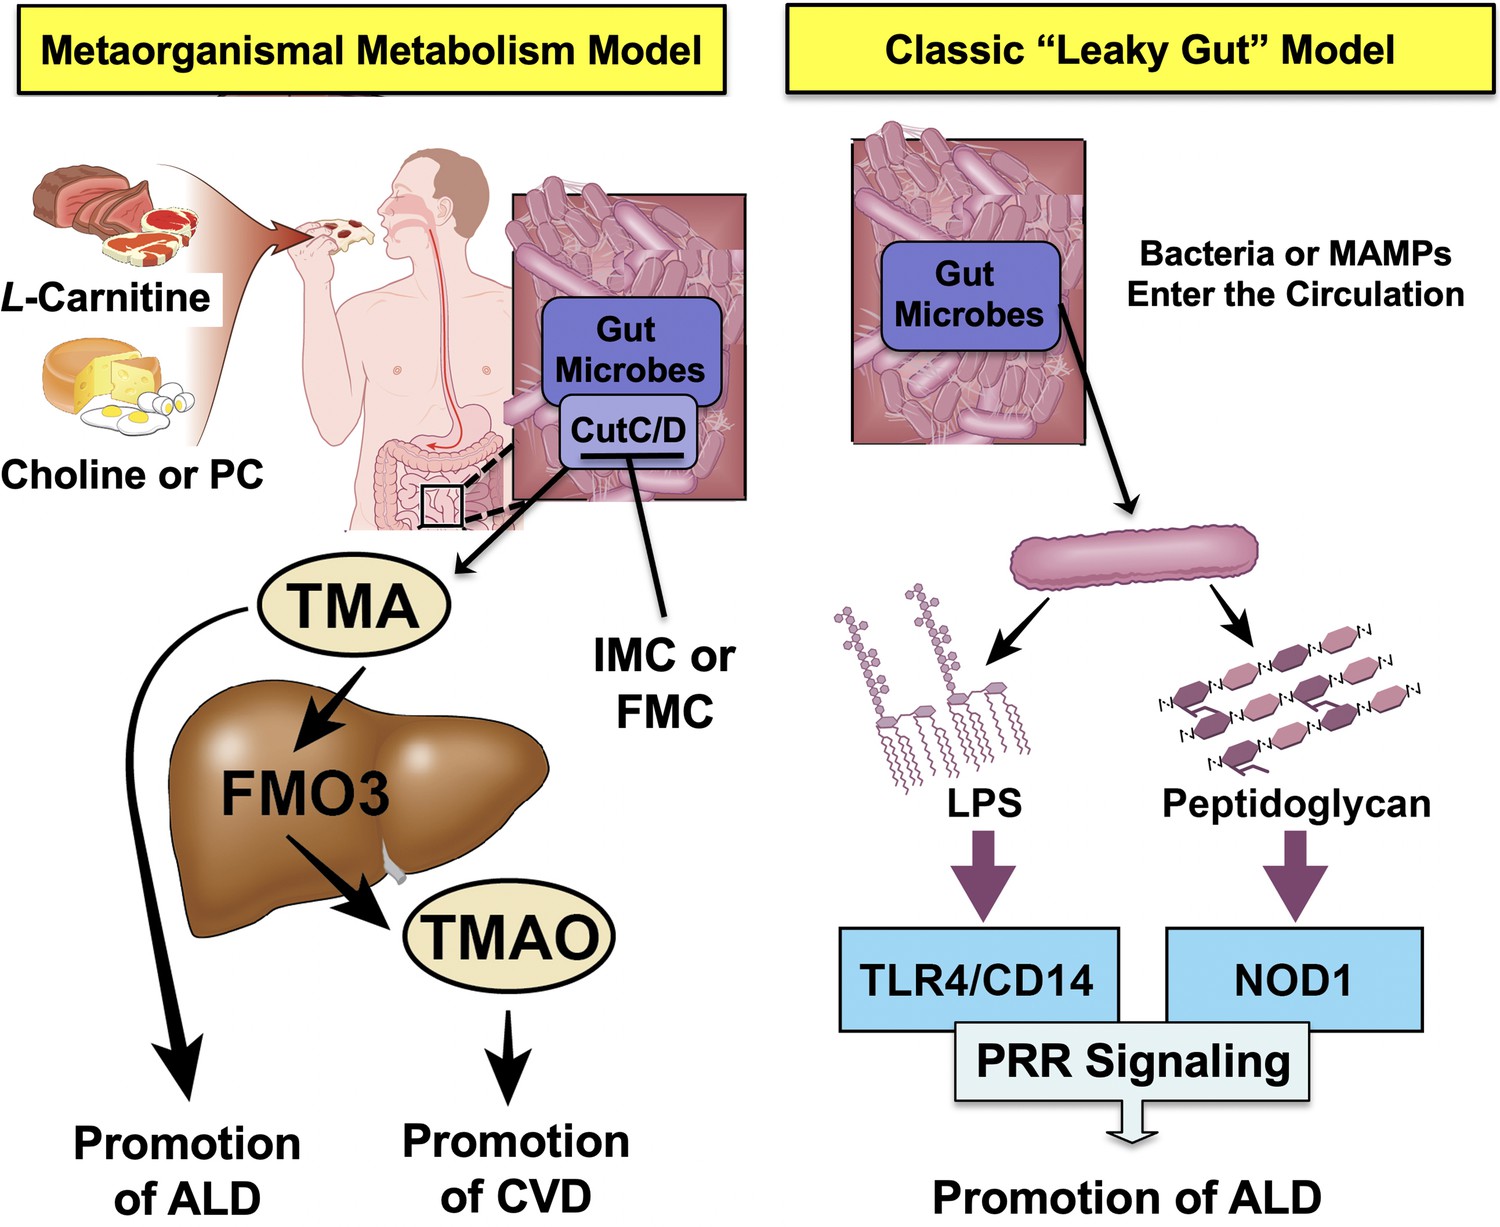
Graphical summary depicting the proposed role of trimethylamine (TMA) in the progression of alcohol-associated liver disease (ALD).
Gut microbiota can elicit both metabolism-dependent and metabolism-independent effects in ALD. Relevant to this manuscript, intestinal microbes metabolize dietary L-carnitine, choline, or phosphatidylcholine (PC) to form TMA, which is a volatile compound that originates exclusively from gut bacterial metabolism and is elevated in ALD. Importantly, TMA can also be converted to trimethylamine N-oxide (TMAO) by hepatic flavin monooxygenase 3 (FMO3), and TMAO has recently been linked to cardiovascular disease (CVD) promotion in humans. Metabolism-independent effects are the result of gut hyperpermeability (leaky gut), allowing bacterial cell wall products such as lipopolysaccharide (LPS) and peptidoglycans to enter into the blood stream and engage with host pattern recognition receptors (PRR) to promote hepatic inflammation. Collectively, metabolism-dependent pathways such as TMA production as well as metabolism-independent pathways provide multiple bacterially derived ‘hits’ to promote ALD progression. The small molecule bacterially targeted CutC/D inhibitors iodomethylcholine (IMC) and fluoromethylcholine (FMC) can effectively blunt ethanol-induced liver injury in mice.
Author response image 1

Inactivation of Flavin Monooxygenase 3 (FMO3)-Drive Conversion of Trimethylamine (TMA) to Trimethylamine-N-Oxide (TMAO) Exacerbates Ethanol-Induced Livery Injury.
Female C57BL/6 mice were treated with a non-targeting control (Con) antisense oligonucleotide (ASO) or an ASO targeting the knockdown of FMO3 and subjected to the chronic (25 day) Lieber-DiCarli liquid diet feeding paradigm. (A) Hepatic FMO3 mRNA levels. (B) Ratio of FMO3’s substrate TMA to product in the circulation. (C) Plasma alanine aminotransferase A(LT) levels. (D) Hepatic Expression of monocyte chemoattractant protein 1 (MCP1). (E) Representative H&E stained liver sections (200x); arrows indicate localized immune cell infiltration. All data represent the mean + S.E.M. from 6 mice per group and means not sharing a common superscript differ (p<0.05).
Author response image 2

Chronic ethanol feeding in Fmo3+/+ and Fmo3-/- mice.
Female Fmo3+/+ and Fmo-/- mice were fed either ethanol-fed or pair-fed using the 25-day chronic feeding paradigm. Plasma levels of trimethylamine (TMA, trimethylamine N-oxide (TMAO)), choline, carnitine and betaine were measured by mass spectrometry. Plasma alanine aminotransferase (ALT), plasms aspartate aminotransferase (AST), liver triglycerides, and mRNA levels for several inflammatory cytokines were measured as in other studies. Statistics were completed by a two-way ANOVA followed by a Tukey’s multiple comparison test. *P<0.05; **P<0.01; ***P<0.001; ****P<0.0001. All data are presented as mean + S.E.M. from 4-6 mice per group.
Tables
Key resources table
| Reagent type (species) or resource | Designation | Source or reference | Identifiers | Additional information |
|---|---|---|---|---|
| Strain, strain background Mice (Females) | 9–11 Weeks | Jackson Laboratories | C57BL6/J, RRID:IMSR_JAX:000664 | 5–8 per study |
| Biological sample (Humans) | Plasma samples from 285 patients | Cleveland Clinic Foundation; University of Louisville; University of Massachusetts Medical School; University of Texas Southwestern Medical Center | Not provided | |
| Biological sample (Humans) | Liver samples from five healthy donors | Clinical Resource for Alcoholic Hepatitis Investigations at Johns Hopkins University | Not provided | |
| Biological sample (Humans) | Liver samples from five patients with severe AH | Clinical Resource for Alcoholic Hepatitis Investigations at Johns Hopkins University | Not provided | |
| Antibody | Anti-FMO3 (Rabbit monoclonal) | Abcam | Cat# ab126790, RRID: AB_11128907 | 1:1000 (WB) |
| Antibody | Anti-HSC70 (Mouse monoclonal) | Santa Cruz Biotechnology | Cat# sc-7298, RRID: AB_627761 | 1:1000 (WB) |
| Antibody | Anti-rabbit IgG HRP | GE-Healthcare | Cat#: NA934-100UL, RRID: AB_772206 | 1:5000 (WB) |
| Antibody | Anti-mouse IgG HRP | GE-Healthcare | NA931V, RRID: AB_772210 | 1:5000 (WB) |
| Sequence-based reagent | Mouse Tnfα | Sigma | PCR primers | F:CCACCACGCTCTTCTGTCTACR:AGGGTCTGGGCCATAGAACT |
| Sequence-based reagent | Mouse Il1β | Sigma | PCR primers | F:AGTTGACGGACCCCAAAAGR:AGCTGGATGCTCTCATCAGG |
| Sequence-based reagent | Mouse Fmo3 | Sigma | PCR primers | F:CCCACATGCTTTGAGAGGAGR:GGAAGAGTTGGTGAAGACCG |
| Sequence-based reagent | Mouse Taar5 | Sigma | PCR primers | F:AAAGAAAAGCTGCCAAGAR:AAGGGAAGCCAACACACA |
| Sequence-based reagent | Mouse CyclophilinA | Sigma | PCR primers | F:GCGGCAGGTCCATCTACGR:GCCATCCAGCCATTCAGTC |
| Sequence-based reagent | Mouse Cxcl1 | IDT | PCR primers | F:TGCACCCAAACCGAAGTCR:GTCAGAAGCCAGCGTTCACC |
| Sequence-based reagent | Mouse Grp78 | IDT | PCR primers | F:ACTTGGGGACCACCTATTCCTR:ATCGCCAATCAGACGCTCC |
| Commercial assay or kit | AST Commercial Kit | Sekisui Diagnostics | 319–30 | |
| Commercial assay or kit | ALT Commercial Kit | Sekisui Diagnostics | 318–30 | |
| Commercial assay or kit | Triglyceride Commercial Kit | Wako | 994–02891 | |
| Commercial assay or kit | Total Cholesterol Commercial Kit | Fisher Scientific | TR134321 | |
| Commercial assay or kit | Free Cholesterol Commercial Kit | Wako | 993–02501 | |
| Commercial assay or kit | RNAeasy Lipid Tissue Mini Kit | Qiagen | 74804 | |
| Commercial assay or kit | Thermo Scientific Pierce TiO2 Phosphopeptide Enrichment and Clean-up Kit | Fisher Scientific | PI88301 | |
| Commercial assay or kit | RNAeasy Purification Kit | Qiagen | 74004 | |
| Chemical compound, drug | Iodomethylcholine (IMC) | Synthesized at the Cleveland Clinic | Not provided | |
| Chemical compound, drug | Fluoromethylcholine (FMC) | Synthesized at the Cleveland Clinic | Not provided | |
| Chemical compound, drug | Trimethylamine Hydrochloride | Sigma | T72761 | |
| Chemical compound, drug | Lipopolysaccharide | Sigma | L4391 | |
| Software, algorithm | GraphPad Prism | GraphPad Software, Inc | 8.4 | |
| Software, algorithm | DADA2 | https://benjjneb.github.io/dada2/dada-installation.html; Callahan et al., 2016 | 1.16 | |
| Software, algorithm | Phyloseq | https://www.bioconductor.org/packages/release/bioc/html/phyloseq.html | 4.1, RRID:SCR_013080 | |
| Software, algorithm | microbiomeSeq | https://github.com/umerijaz/microbiomeSeq | 1: RRID:SCR_002630 | |
| Software, algorithm | Ggplot2 | https://cran.r-project.org/web/packages/ggplot2/index.html | 3.3.5, RRID:SCR_014601 | |
| Software, algorithm | vegan | https://cran.r-project.org/web/packages/vegan/index.html | 2.5–7 | |
| Other | Supersignal West Pico Plus Substrate | Thermo Fisher | 34577 | |
| Other | Diet | Dyets | 710260 |
Additional files
Download links
A two-part list of links to download the article, or parts of the article, in various formats.
Downloads (link to download the article as PDF)
Open citations (links to open the citations from this article in various online reference manager services)
Cite this article (links to download the citations from this article in formats compatible with various reference manager tools)
Gut microbial trimethylamine is elevated in alcohol-associated hepatitis and contributes to ethanol-induced liver injury in mice
eLife 11:e76554.
https://doi.org/10.7554/eLife.76554


