Meta-Research: Author-level data confirm the widening gender gap in publishing rates during COVID-19
- Danish Centre for Studies in Research and Research Policy, Aarhus University, Denmark
- Department of Sociology, Copenhagen University, Denmark
- Department of Radiation Oncology, University of Michigan, United States
Figures
Figure 1
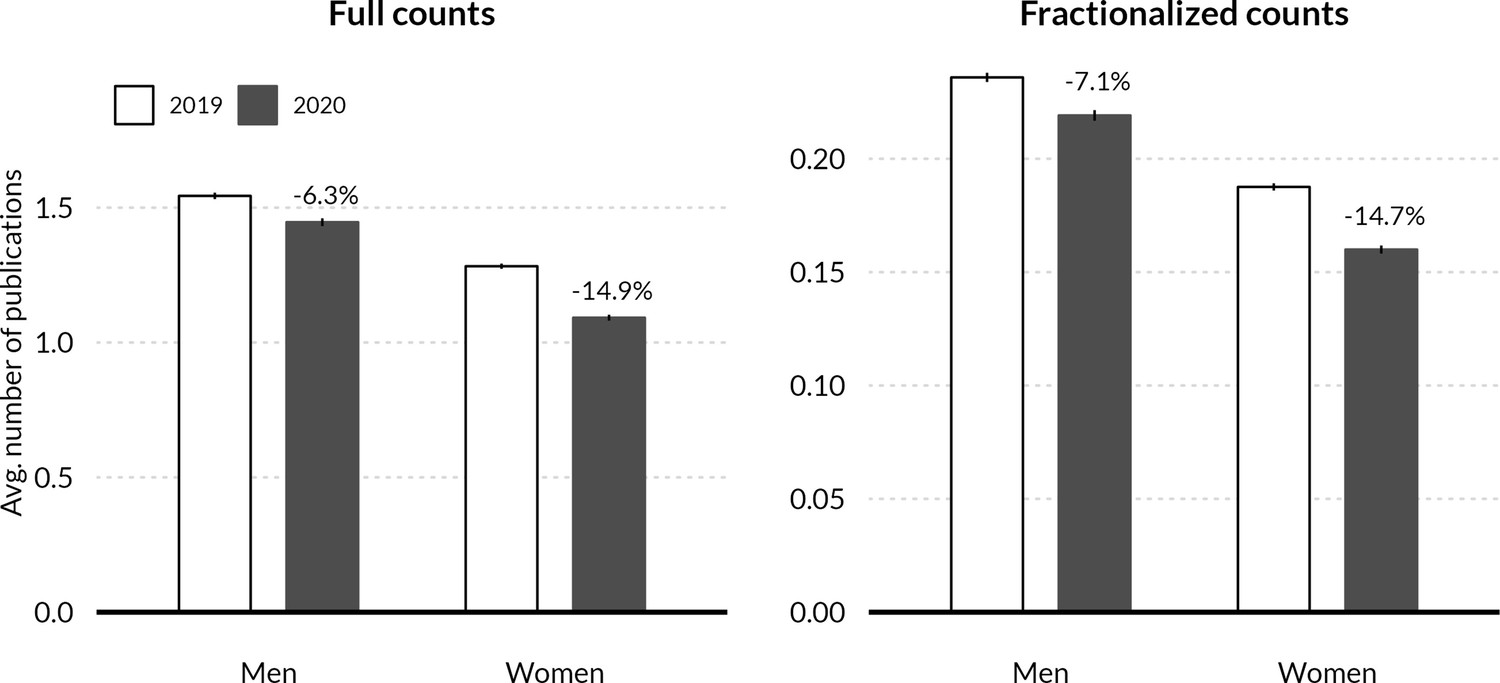
Average publication output by gender and year.
Differences are in percentages of average publication rates in 2019. Results are presented for full and fractionalized publication counts. Men experience a smaller productivity decrease in 2020 compared to 2019 (6.3%) than women (14.9%) using full counts of publications. For fractional counts (each paper counts as a fraction of the number of co-authors), the difference in decrease is greater, with a 7.1% decrease for men and 14.7% decrease for women. Average publication counts are presented with 99% confidence bounds.
Figure 2 with 1 supplement
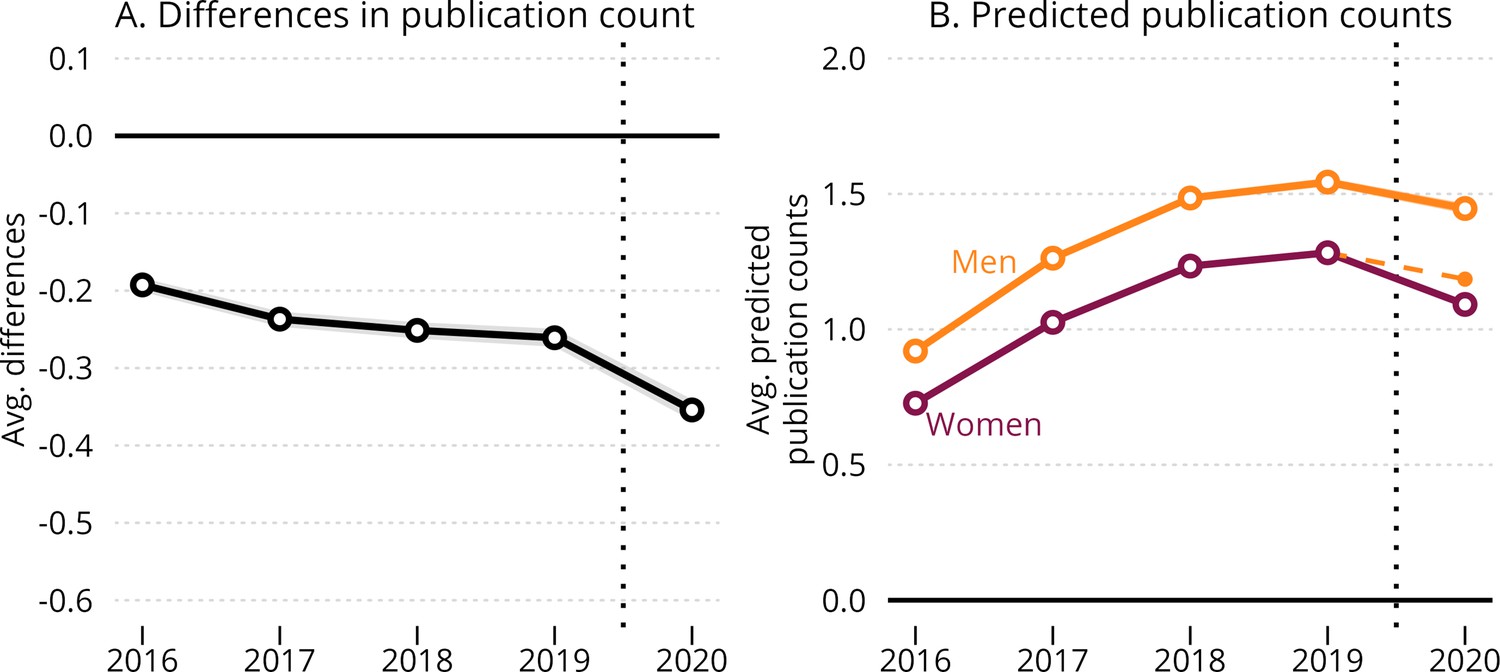
Dynamic effects of the COVID-19 pandemic on women’s and men’s publication productivity.
Panel A shows the estimated average gender difference in publication rates by year. Each point shows the relative difference between men and women per year, with 99.9% confidence bounds shown as a gray area around the line. From 2019 to 2020, the average-marginal gender difference increased from –0.260 (17% lower output for women) to –0.354 (24% lower output for women). Panel B shows the predicted publishing rates for men and women authors, with solid lines showing the trend per gender, and the dashed, orange line showing the counterfactual trend for women if they had similar 2019–2020 trajectories as men (i.e. the trend for men is projected to the 2019 estimate for women). The difference between the dashed line and the straight line in Panel B specifies the average treatment effect for women. Point estimates are reported with 99.9% confidence bounds, with robust standard errors clustered at the individual-author level. For information on how average marginal and predicted values are calculated, please refer to Materials and Methods: Difference-in-Differences model.
-
Figure 2—source data 1
OLS linear regression with full count as dependent variable.
- https://cdn.elifesciences.org/articles/76559/elife-76559-fig2-data1-v3.docx
-
Figure 2—source data 2
OLS linear regression with fractional count as dependent variable.
- https://cdn.elifesciences.org/articles/76559/elife-76559-fig2-data2-v3.docx
-
Figure 2—source data 3
Poisson regression with full count as dependent variable.
- https://cdn.elifesciences.org/articles/76559/elife-76559-fig2-data3-v3.docx
-
Figure 2—source data 4
Negative binomial regression with full count as dependent variable.
- https://cdn.elifesciences.org/articles/76559/elife-76559-fig2-data4-v3.docx
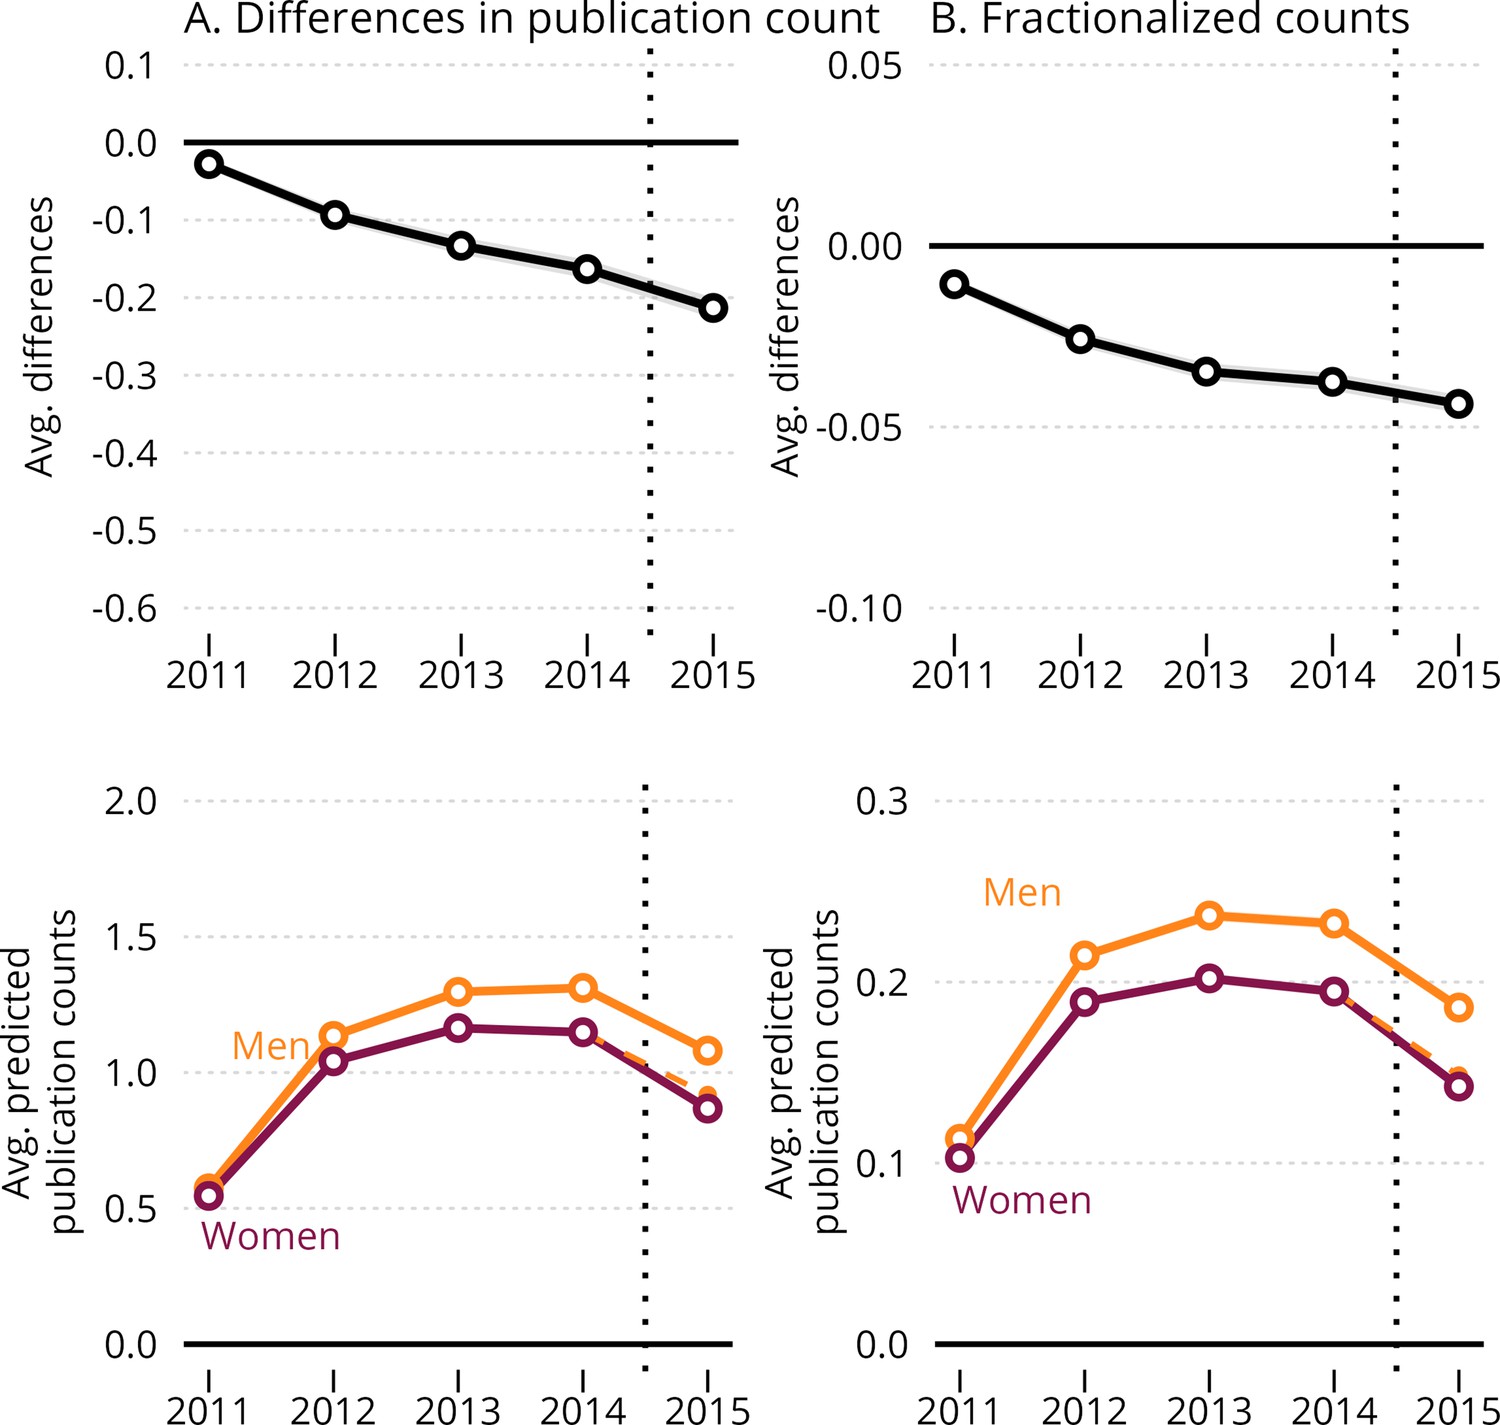
Figure 2—figure supplement 1
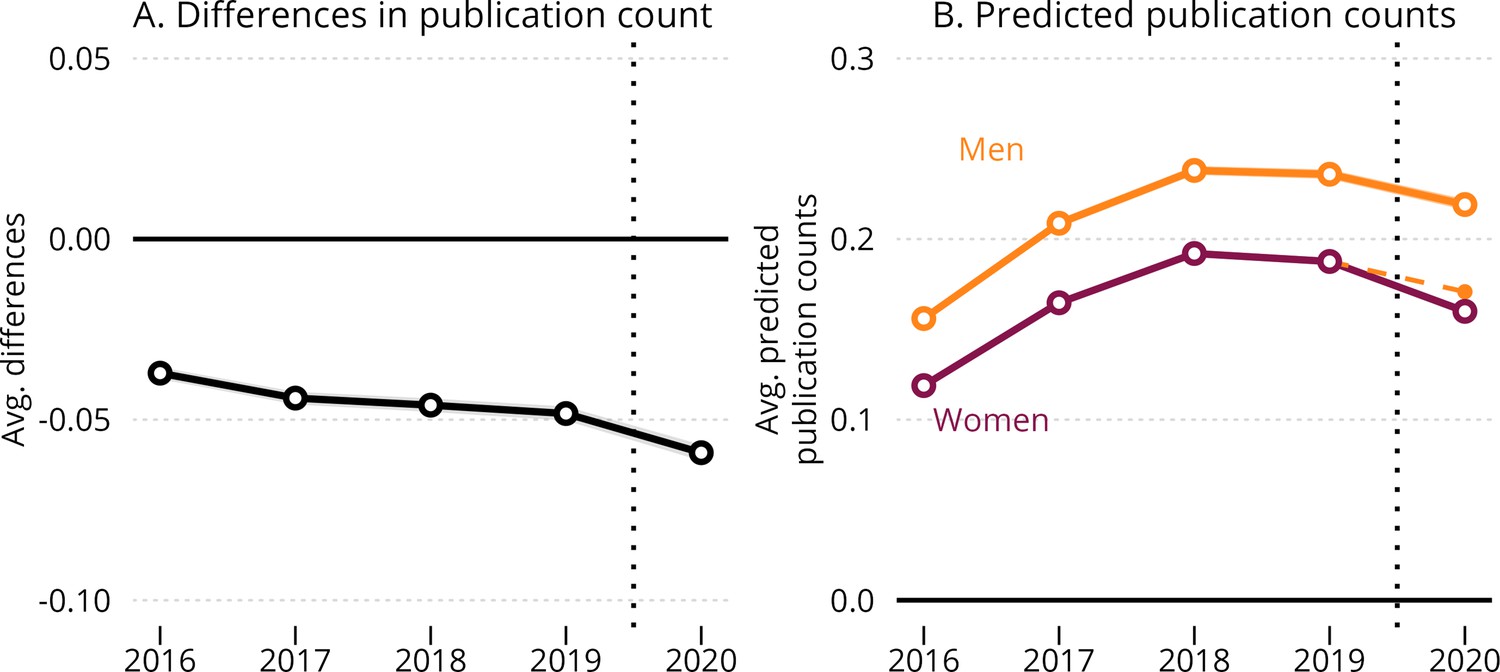
Corresponding analysis with fractional counts.
Dynamic effects of the COVID-19 pandemic on women’s and men’s fractional-count output. Panel A shows the estimated average gender difference in fractional-count publication rates by year. Panel B shows the predicted fractional-count publishing rates for male and female authors. Dashed, colored, lines represent the counterfactual trend for women if they had similar 2019–2020 trajectories as men. The difference between the dashed line and the straight line in Panel B specify the average treatment effect for women. Point estimates are reported with 99.9% confidence bounds, with robust standard errors clustered at the individual-author level.
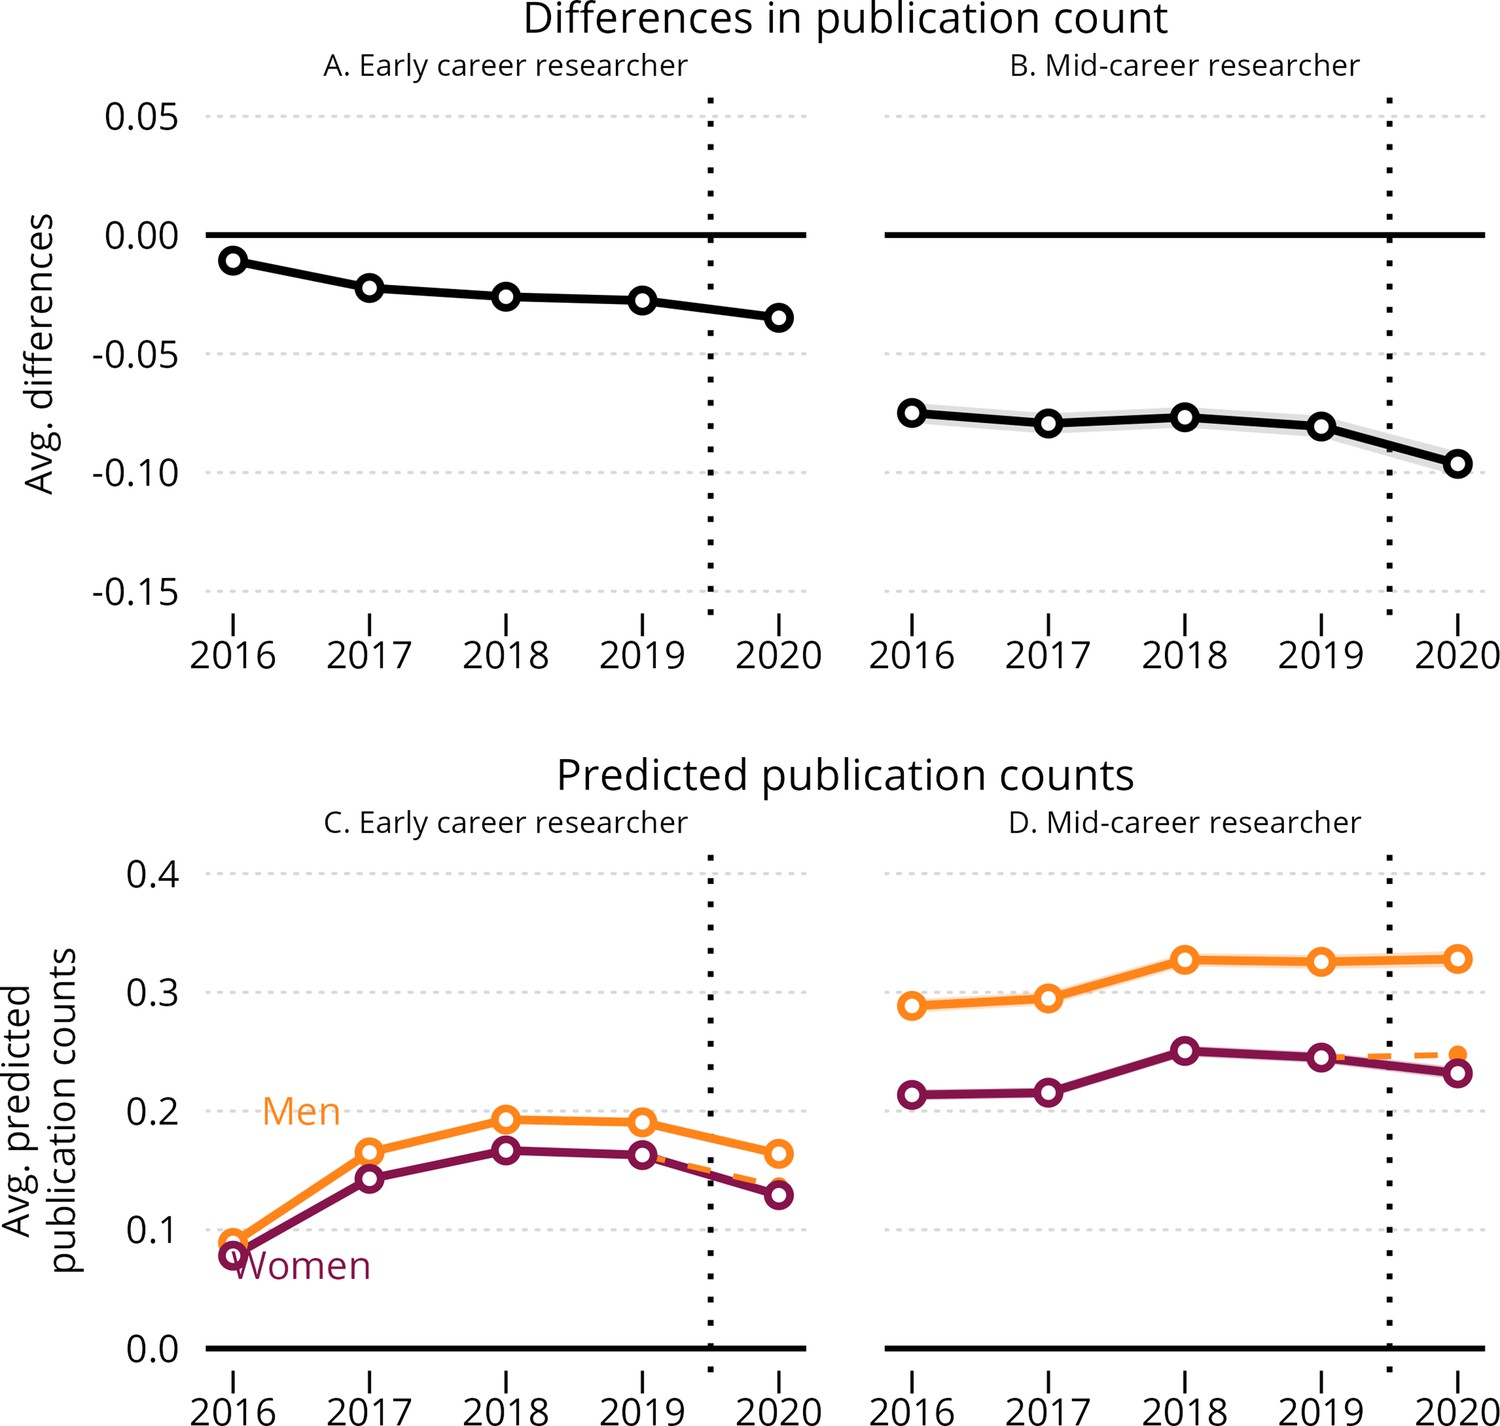
Figure 3 with 2 supplements
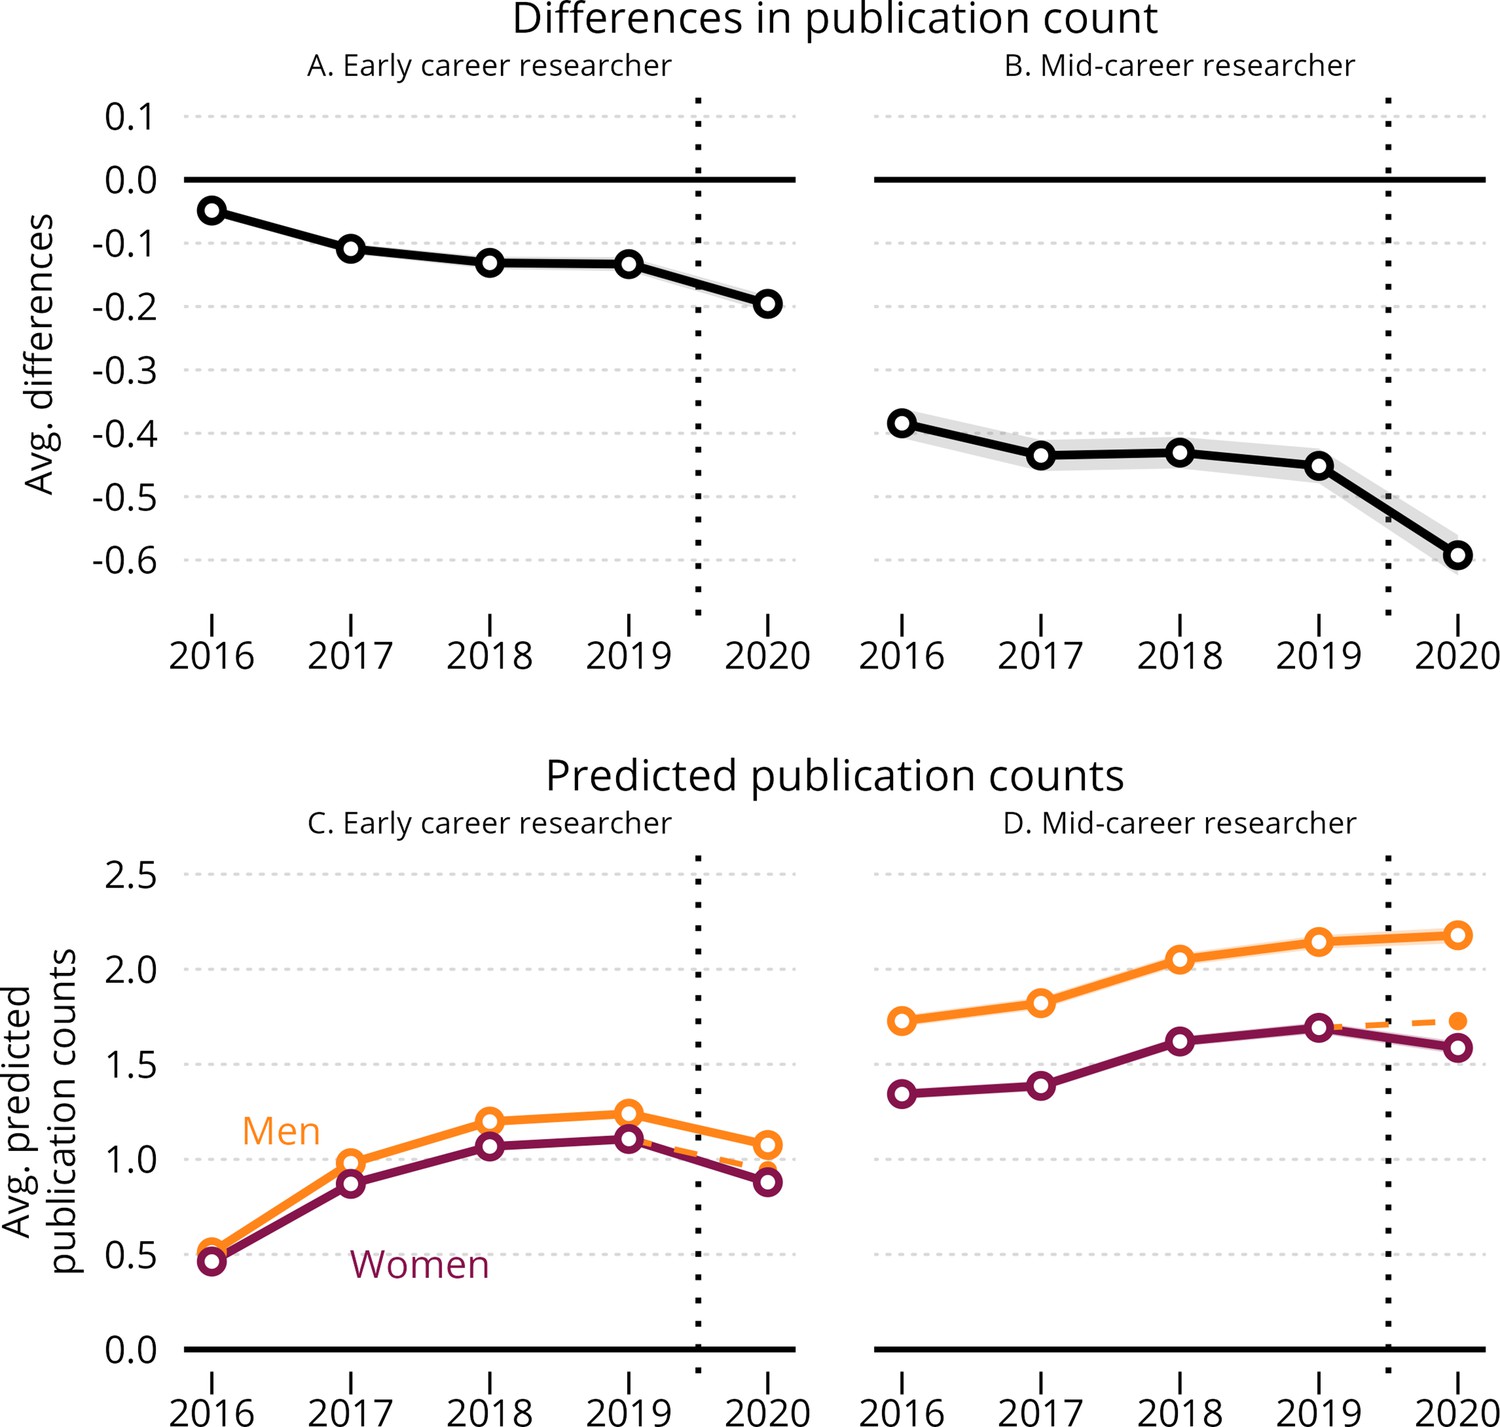
Dynamic effects of the COVID-19 pandemic on the average gender gap in annual publishing rates, by career age.
Panels A and B show the estimated average gender difference in full-count publication rates by year for early-career and mid-career researchers. Panels C and D show men’s and women’s predicted full-count publication rates per year by author status (early-career vs. mid-career researcher). Point estimates are reported with 99.9% confidence bounds and robust standard errors clustered at the individual-author level. For information on how average marginal and predicted values are calculated, please refer to Materials and Methods: Difference-in-Differences model.
-
Figure 3—source data 1
OLS linear regression of the early-career sample, with full count as dependent variable.
- https://cdn.elifesciences.org/articles/76559/elife-76559-fig3-data1-v3.docx
-
Figure 3—source data 2
OLS linear regression of the mid-career sample, with full count as dependent variable.
- https://cdn.elifesciences.org/articles/76559/elife-76559-fig3-data2-v3.docx
-
Figure 3—source data 3
OLS linear regression of the early-career sample, with fractional count as dependent variable.
- https://cdn.elifesciences.org/articles/76559/elife-76559-fig3-data3-v3.docx
-
Figure 3—source data 4
OLS linear regression of the mid-career sample, with fractional count as dependent variable.
- https://cdn.elifesciences.org/articles/76559/elife-76559-fig3-data4-v3.docx
Figure 3—figure supplement 1
Corresponding analysis with fractional counts.
The upper panels show the estimated average gender difference in fractional-count publication rates by year for early-career and senior researchers. The lower panels show men’s and women’s predicted fractional-count publication rates per year by author status (early-career vs. senior researcher). Point estimates are reported with 99.9% confidence bounds, with robust standard errors clustered at the individual-author level.
Figure 3—figure supplement 2
Corresponding analysis with counterfactual sample.
Gender differences in publication productivity for at counterfactual sample. Black lines show average marginal effects of female author gender each year, and colored lines show predicted publication counts (both full and fractionalized) for male and female authors. Predicted differences and counts are based on the difference-in-differences estimates from Figure 3—source data 1 and Figure 3—source data 2 in the supplementary material. 99.9% confidence intervals based on clustered standard errors are shown.
Figure 4
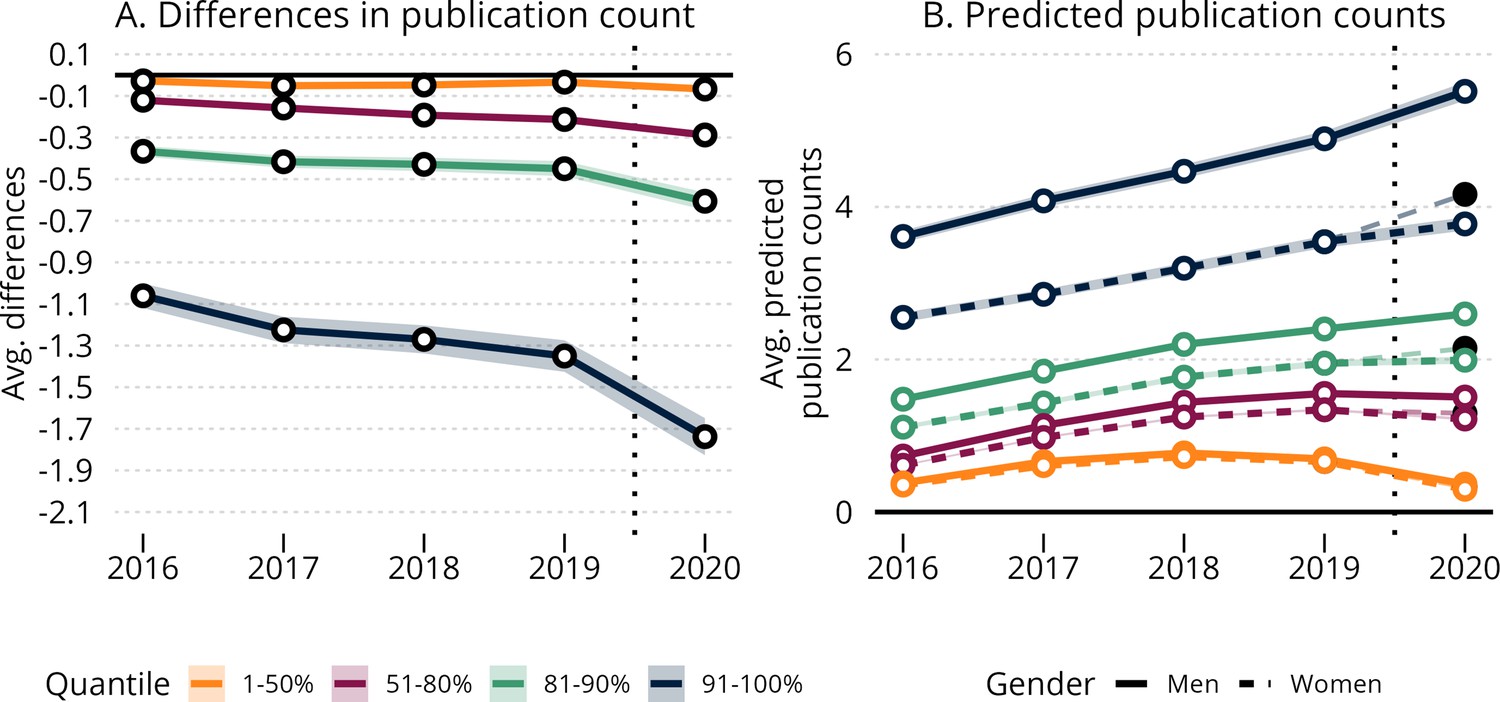
Stratified effects of the COVID-19 pandemic on the average gender gap in annual publishing rates.
Panel A shows the estimated average gender difference in publication rates by year. Panel B shows the predicted publishing rates for men and women authors. In each panel, scientists are divided into strata according to their total number of publications in the period 2016–2020. The difference between the thinner, dashed line with the black circle in 2020 and the thicker, dashed line with hollow circles in panel B specifies the average treatment effect for women. Point estimates are reported with 99.9% confidence bounds and robust standard errors clustered at the individual-author level. For information on how average marginal and predicted values are calculated, please refer to Materials and methods: Difference-in-differences model.
Figure 5 with 2 supplements
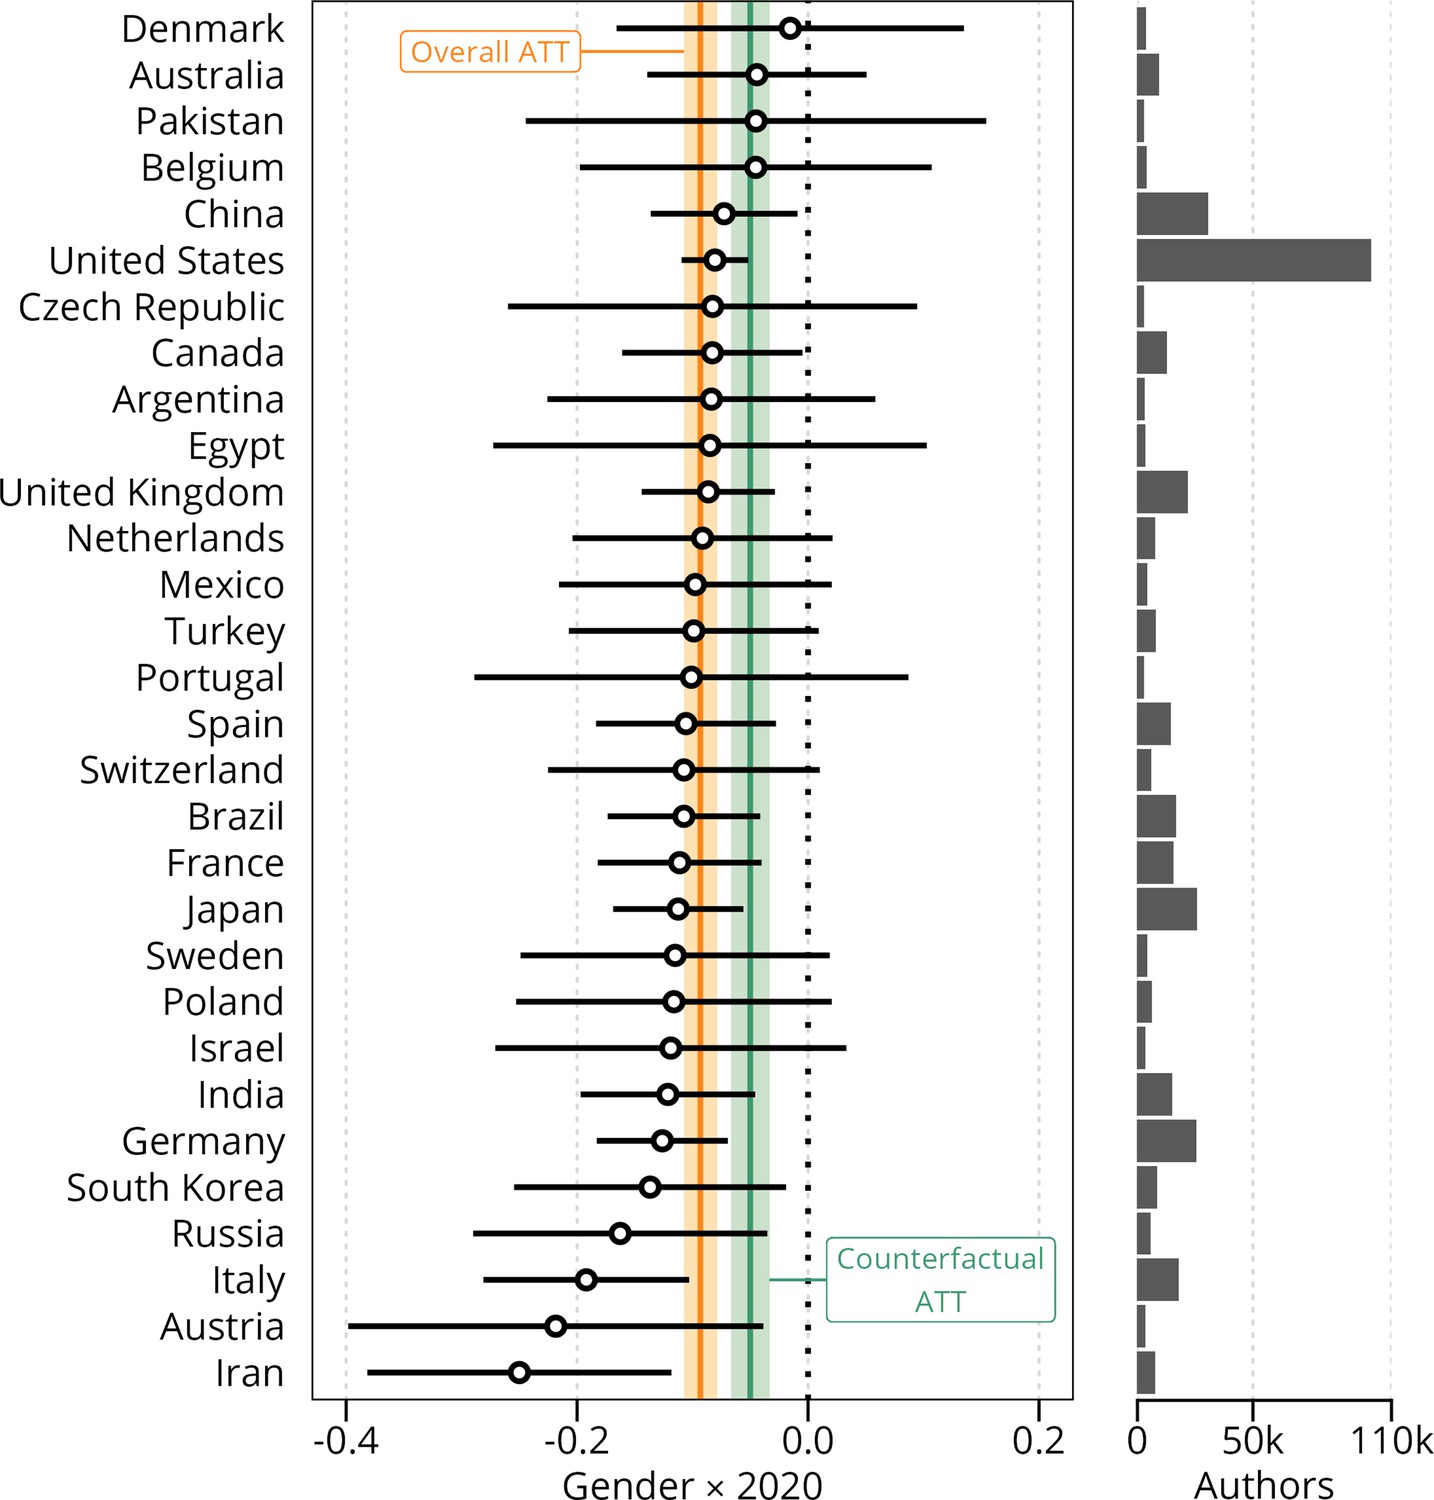
Gender differences in full publication productivity by country, 2019 vs 2020.
The hollow circles show the gender differences per country in full publications counts in 2020 relative to 2019, with error bars showing the 99% confidence intervals based on robust clustered standard errors. Countries are ranked by the estimated gender difference. The horizontal histogram shows the distribution of authors from each country, showing that the vast majority are from the USA. We only list the first 30 countries by number of authors, comprising 90% of authors in our sample. The orange and green lines and bands show the overall treatment effect on the sample and the counterfactual sample. (ATT is the Average Treatment effect on the Treated).
-
Figure 5—source data 1
OLS linear regression of counterfactual sample, with full count as dependent variable.
- https://cdn.elifesciences.org/articles/76559/elife-76559-fig5-data1-v3.docx
-
Figure 5—source data 2
OLS linear regression of counterfactual sample, with fractional count as dependent variable.
- https://cdn.elifesciences.org/articles/76559/elife-76559-fig5-data2-v3.docx
-
Figure 5—source data 3
Coefficients and standard errors relative to 2019 for the 30 countries with most authors in the dataset.
- https://cdn.elifesciences.org/articles/76559/elife-76559-fig5-data3-v3.docx
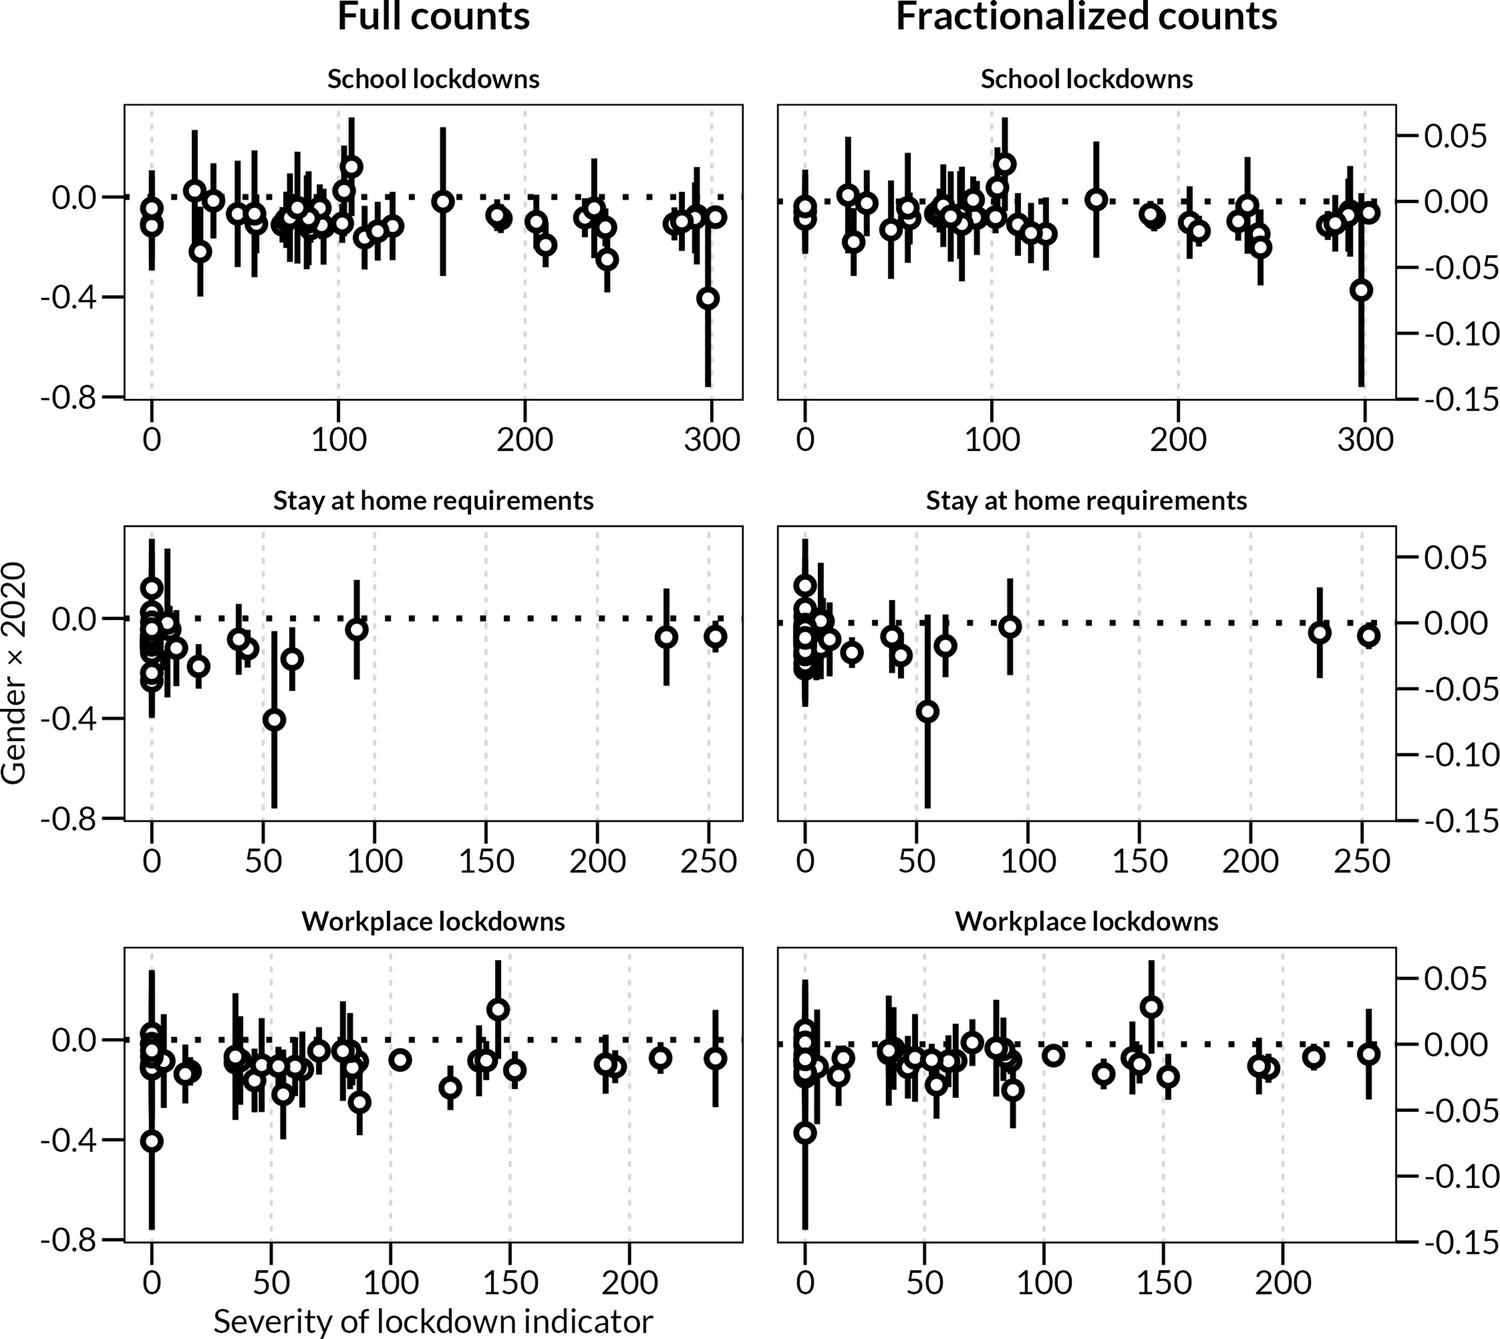
Figure 5—figure supplement 1
Lockdown severity, summed indicators.
Gender differences in full-count publication productivity, 2019 vs 2020, across four different lockdown severity indicators. All indicators are summed values as stipulated in Equation 3. 99% confidence intervals based on clustered standard errors are shown.
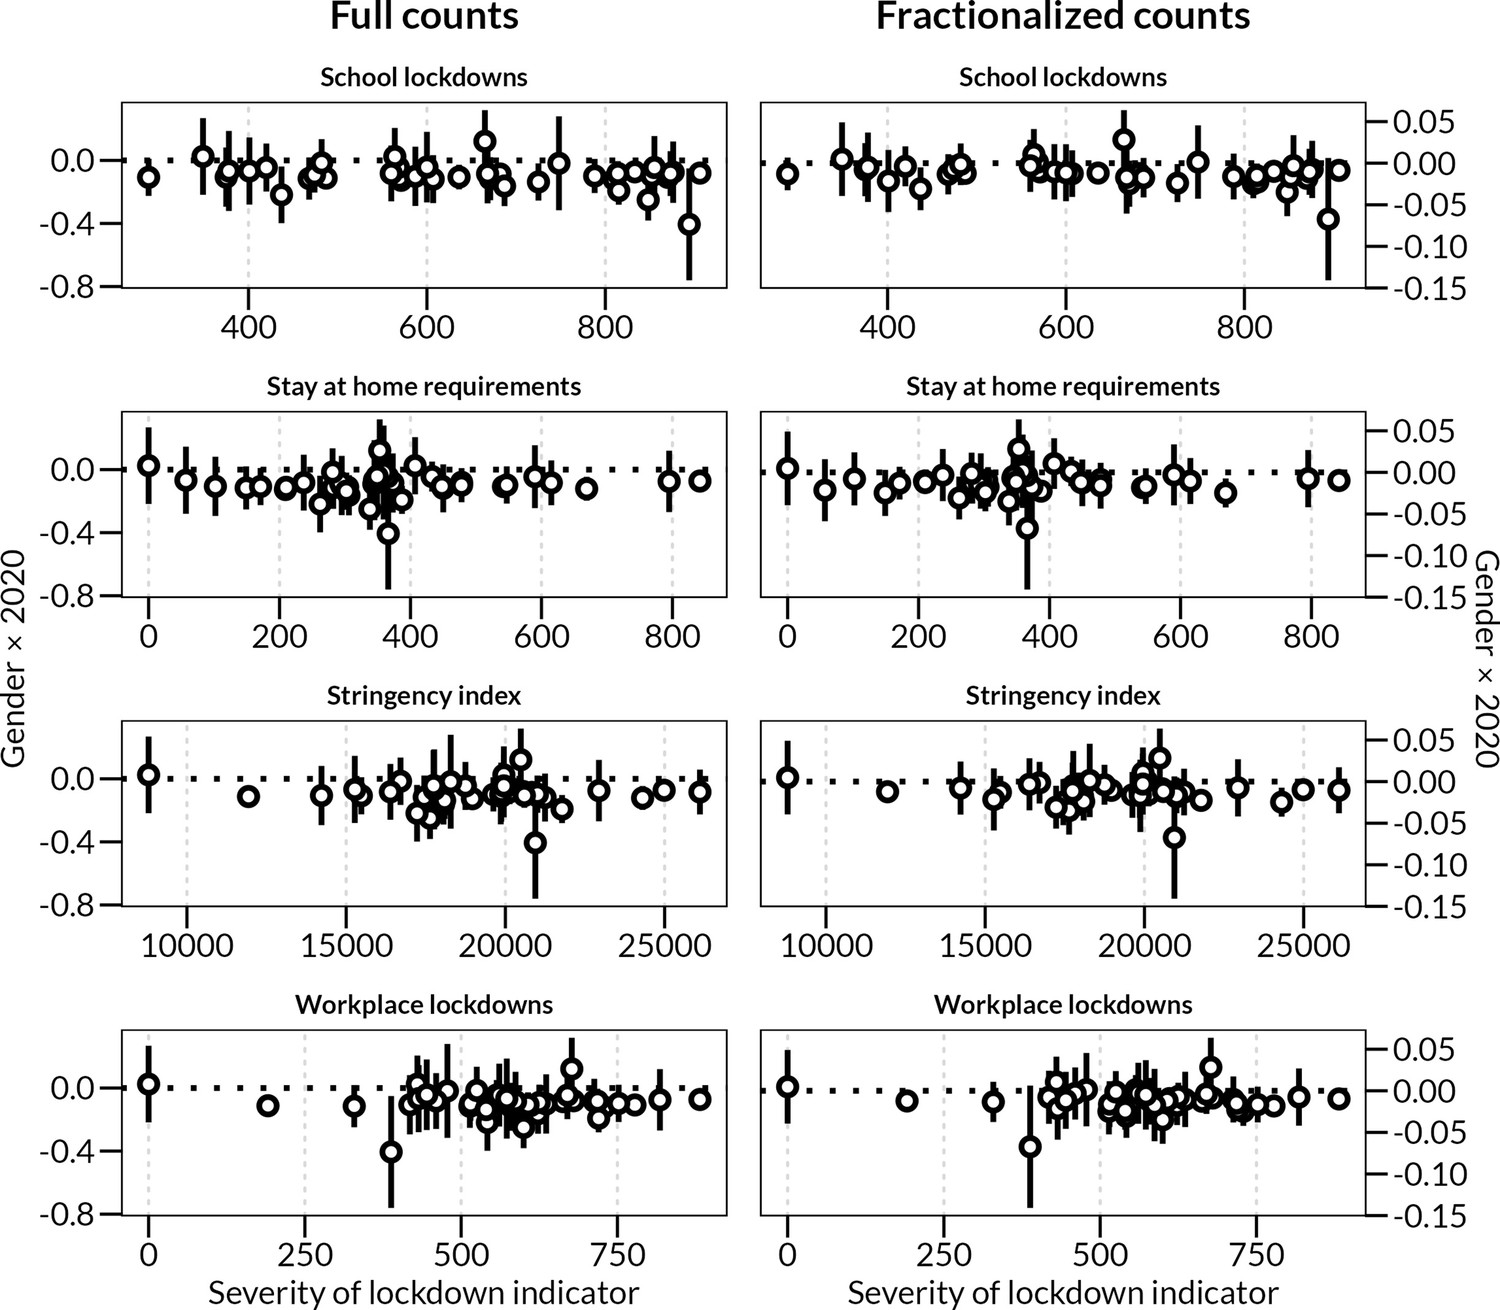
Figure 5—figure supplement 2
Lockdown severity, maximum indicators.
Gender differences in full-count publication productivity, 2019 vs 2020, across three different lockdown severity indicators. All indicators are counts of the maximum values as stipulated in Equation 4. 99% confidence intervals based on clustered standard errors are shown.
Figure 6
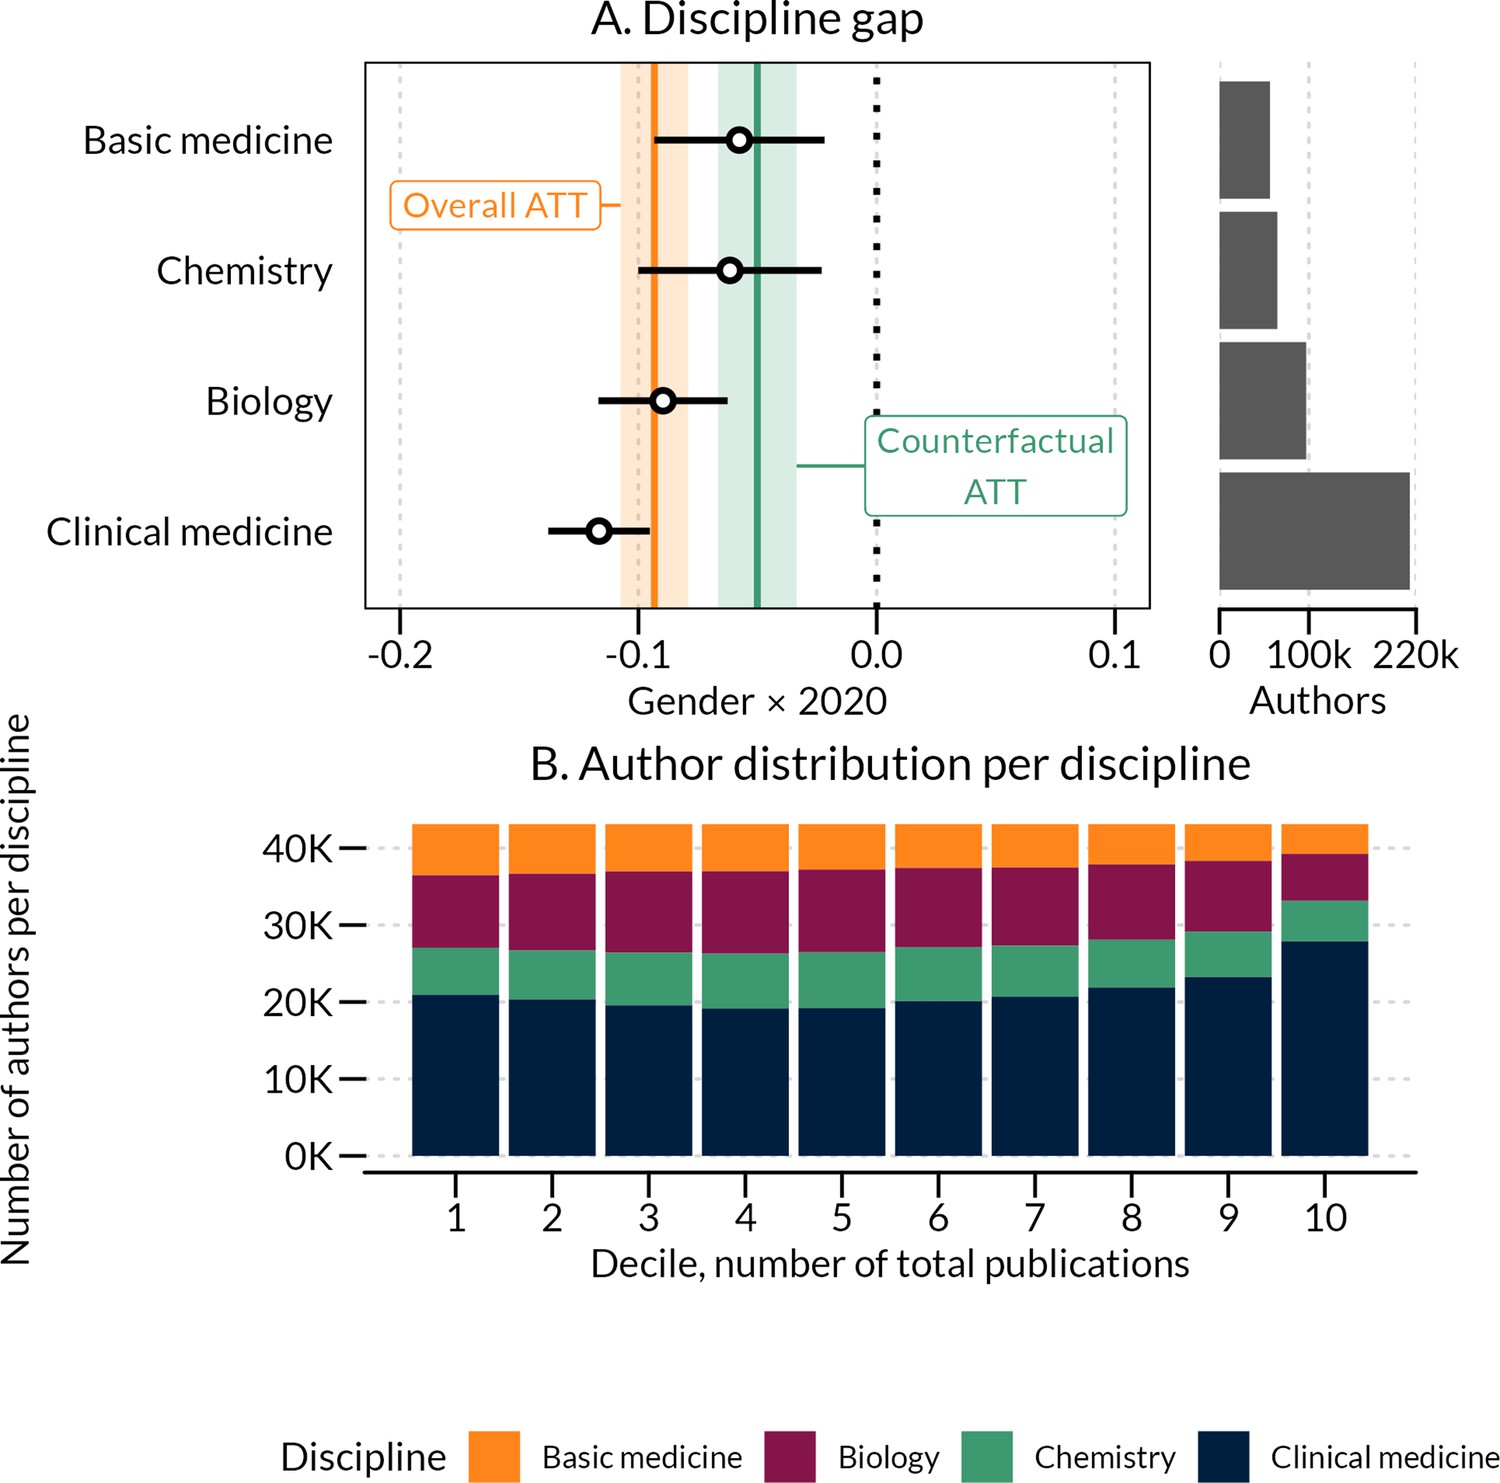
2020 gender differences in full publications counts relative to 2019, across the four disciplines comprising in our sample.
Difference-in-differences estimate from Figure 6—source data 1. 99% confidence intervals based on clustered standard errors are shown. Histograms show the distribution of authors who mainly publish within a given discipline, and orange and green lines and bands show the overall treatment effect on the sample and the counterfactual sample from Figure 2—source data 1 and Figure 5—source data 1. Panel B shows the distribution of authors per discipline in deciles of total publications over the time period.
-
Figure 6—source data 1
Coefficients and standard errors relative to 2019 for the four disciplines.
- https://cdn.elifesciences.org/articles/76559/elife-76559-fig6-data1-v3.docx
Figure 7
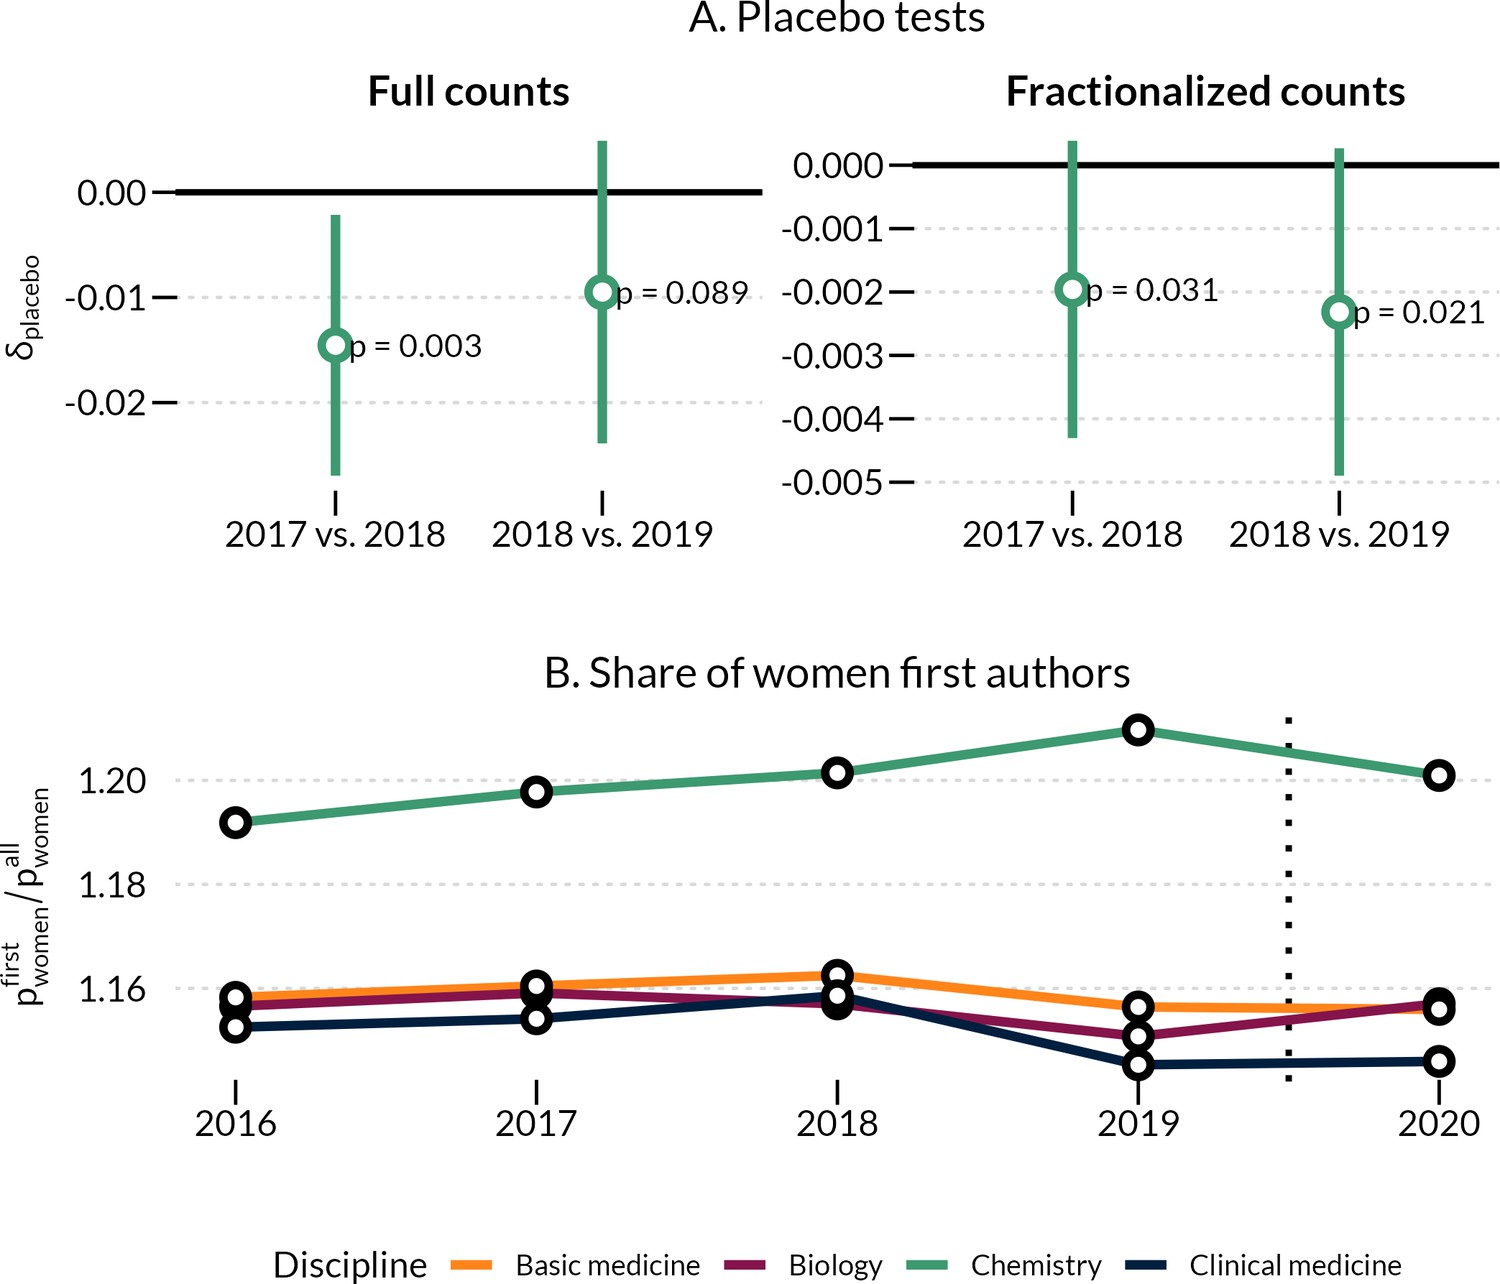
Test against hypothetical placebo pandemic in 2018/2019 (A) and changes in women as first authors (B).
(A) Difference in differences of publication productivity for placebo tests. Points show the difference in publication productivity for women relative to men for two placebo periods, using both full publication counts and fractionalized counts. Estimates are based on Figure 7—source data 1 and Figure 7—source data 2. Errorbars are 99% confidence intervals, with accompanying p-values based on clustered standard errors. (B) Ratio of women’s first author share to women’s share of all authorships. Each line shows the share of women who occupy the first author position divided by women’s share of all authorships by year for each of the four disciplines. A ratio > 1 shows a greater share of women first authors relative to all women’s authorships. Authorships counts are made for a larger sample than used in the main analysis, comprising all authorships registered in the Web of Science for each discipline and year.
-
Figure 7—source data 1
OLS linear regression of full and fractional count as dependent variable, placebo test of 2017 vs 2018.
Linear regression with author and year fixed effects. Standard errors in parentheses are HC1 and clustered at the author level.
- https://cdn.elifesciences.org/articles/76559/elife-76559-fig7-data1-v3.docx
-
Figure 7—source data 2
OLS linear regression of full and fractional count as dependent variable, placebo test of 2018 vs 2019.
Linear regression with author and year fixed effects. Standard errors in parentheses are HC1 and clustered at the author level.
- https://cdn.elifesciences.org/articles/76559/elife-76559-fig7-data2-v3.docx
Tables
Table 1
Seven indicators of COVID-19 lockdown severity.
| Sum indicator | Count of maximum values | |
|---|---|---|
| School lockdowns | + | + |
| Workplace lockdowns | + | + |
| Stay at home requirements | + | + |
| Stringency index | + | - |
Additional files
Download links
A two-part list of links to download the article, or parts of the article, in various formats.
Downloads (link to download the article as PDF and Executable version)
Open citations (links to open the citations from this article in various online reference manager services)
Cite this article (links to download the citations from this article in formats compatible with various reference manager tools)
Meta-Research: Author-level data confirm the widening gender gap in publishing rates during COVID-19
eLife 11:e76559.
https://doi.org/10.7554/eLife.76559


