A saturation-mutagenesis analysis of the interplay between stability and activation in Ras
- California Institute for Quantitative Biosciences (QB3), University of California, Berkeley, United States
- Howard Hughes Medical Institute, University of California, Berkeley, United States
- Department of Chemistry, University of California, Berkeley, United States
- Department of Molecular and Cell Biology, University of California, Berkeley, United States
- Department of Chemistry, Columbia University, United States
- Biophysics Graduate Group, University of California, Berkeley, United States
Figures
Figure 1 with 1 supplement
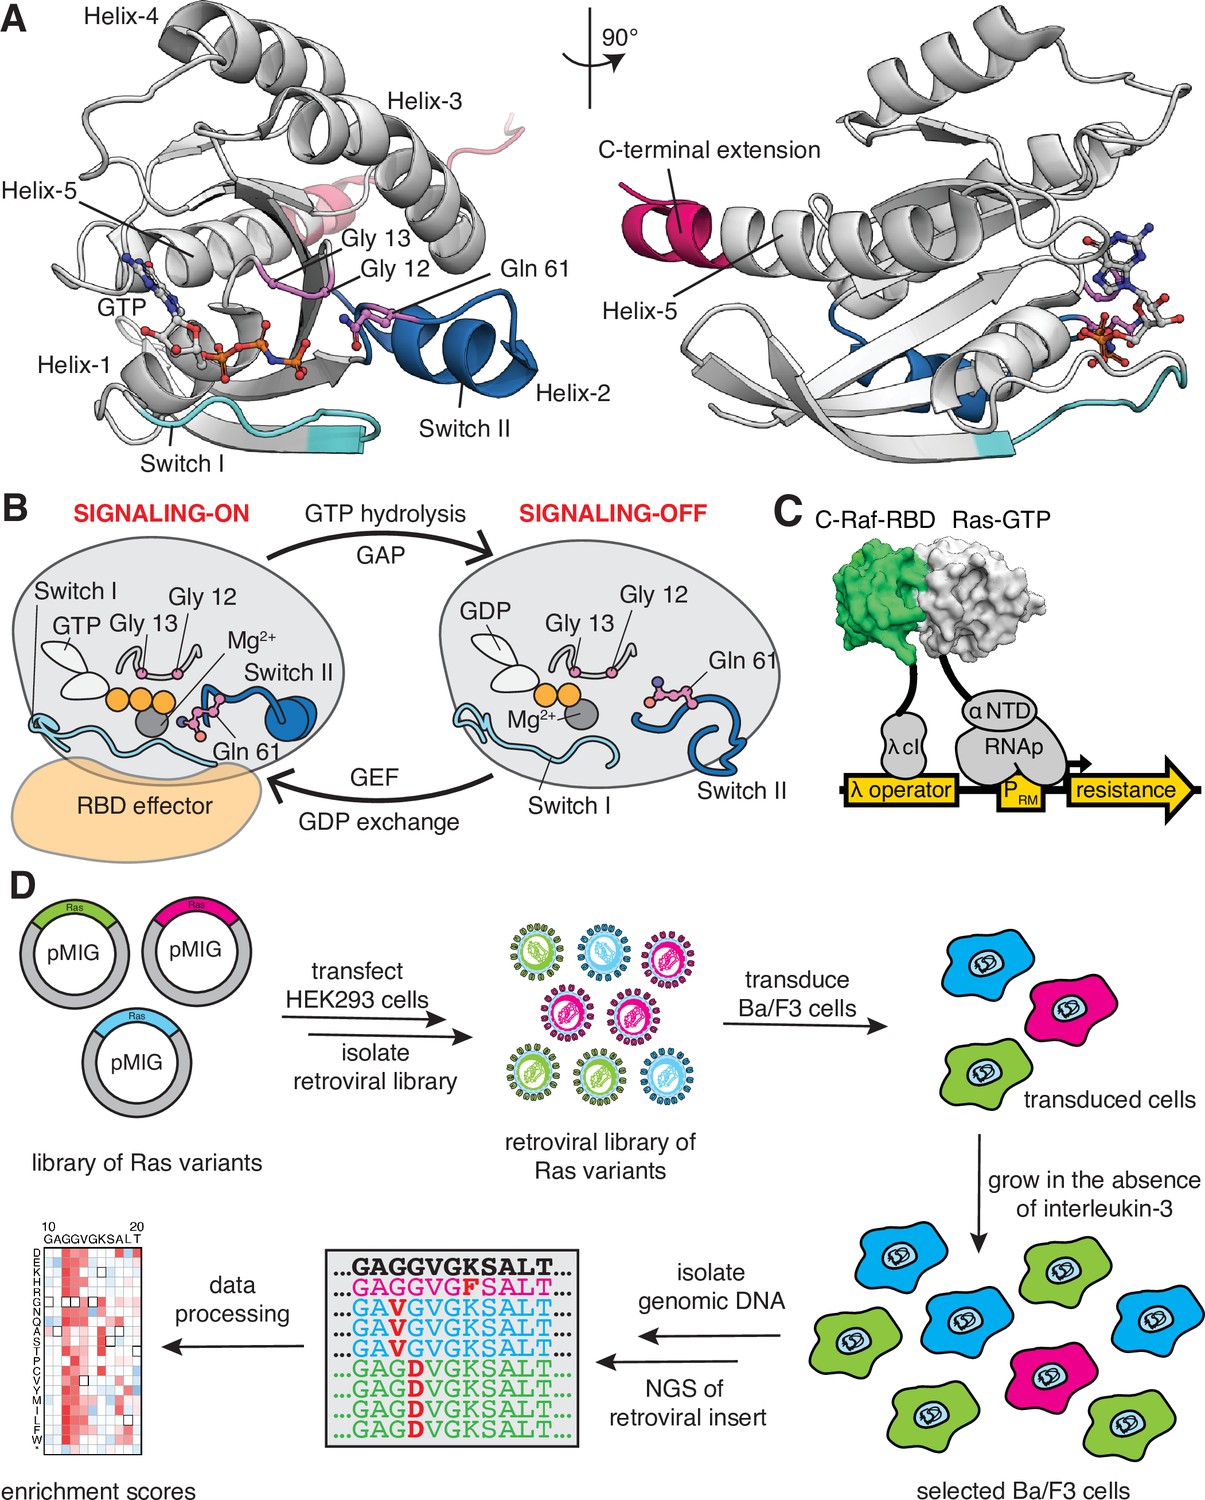
Ras G-domain, the switching cycle, and schematics of the two selection assays.
(A) The three principal sites of cancer mutations in Ras, referred to as the three cancer hotspots – Gly 12, Gly 13, and Gln 61 – are shown in the K-Ras structure. The C-terminal helix extension is indicated. PDB ID: 2MSD (Mazhab-Jafari et al., 2015). (B) Ras cycles between signaling-active GTP-bound and signaling-inactive GDP-bound states. (C) The bacterial-two-hybrid system couples the C-Raf-RBD•Ras-GTP interaction to the transcription of an antibiotic resistance gene (Bandaru et al., 2017). Ras is fused to the N-terminal domain of the α-subunit of the E. coli RNA polymerase. C-Raf-RBD is fused to the λ-cI protein. The GAP and the GEF can be co-expressed in the system. E. coli cells are transformed with a DNA library of ‘unselected’ variants. The bacteria are grown in the presence of an antibiotic for 9 hr, then the DNA library of ‘selected’ variants is isolated. Next-generation sequencing (NGS) is used to count the frequency of each variant in the unselected and selected samples. (D) Ba/F3 assay for Ras activity. Mutant H-Ras libraries are transfected into HEK 293T cells to generate a retroviral library of mutants. Ba/F3 cells are transduced with the retroviral library. After 24 hours, a fraction of the cells are used as the unselected population, and the remainder of the cells – the selected population – are cultured for 7 days in the absence of IL-3 before harvesting them by centrifugation. The genomic DNA of the selected and unselected populations is isolated and sequenced using NGS. The relative enrichment scores are calculated using the selected and unselected counts (see Equation 1).
Figure 1—figure supplement 1
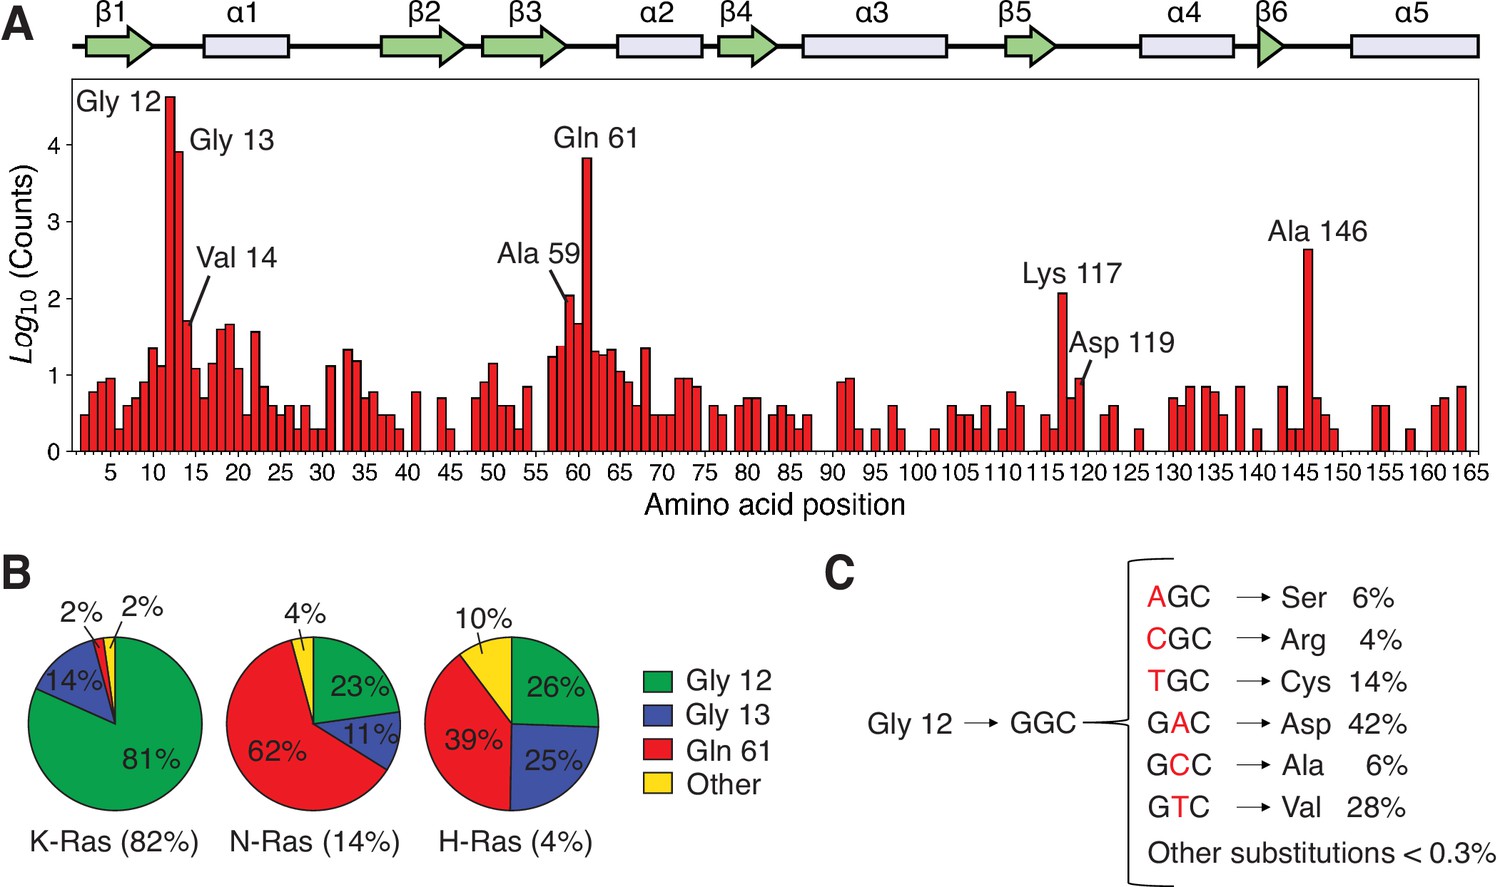
Analysis of the distribution of Ras mutations in COSMIC v94.
(A) Counts for each Ras variant that appears in the Catalogue of Somatic Mutations in Cancer (COSMIC) v94 database (Tate et al., 2019). The counts for each isoform have been aggregated and grouped by residue. There are three main sites where 90%–98% of all mutations occur: Gly 12, Gly 13, and Gln 61 (the cancer hotspots). Other sites are distributed across the protein with a lower frequency in cancer. (B) Distribution of mutations per isoform. (C) Single-nucleotide variants (SNVs) account for ~99.7% of all mutations at residue 12 in the COSMIC database, and multiple-nucleotide variants (MNVs) account for only ~0.3%. The data for C include the counts of the three isoforms.
Figure 2 with 2 supplements
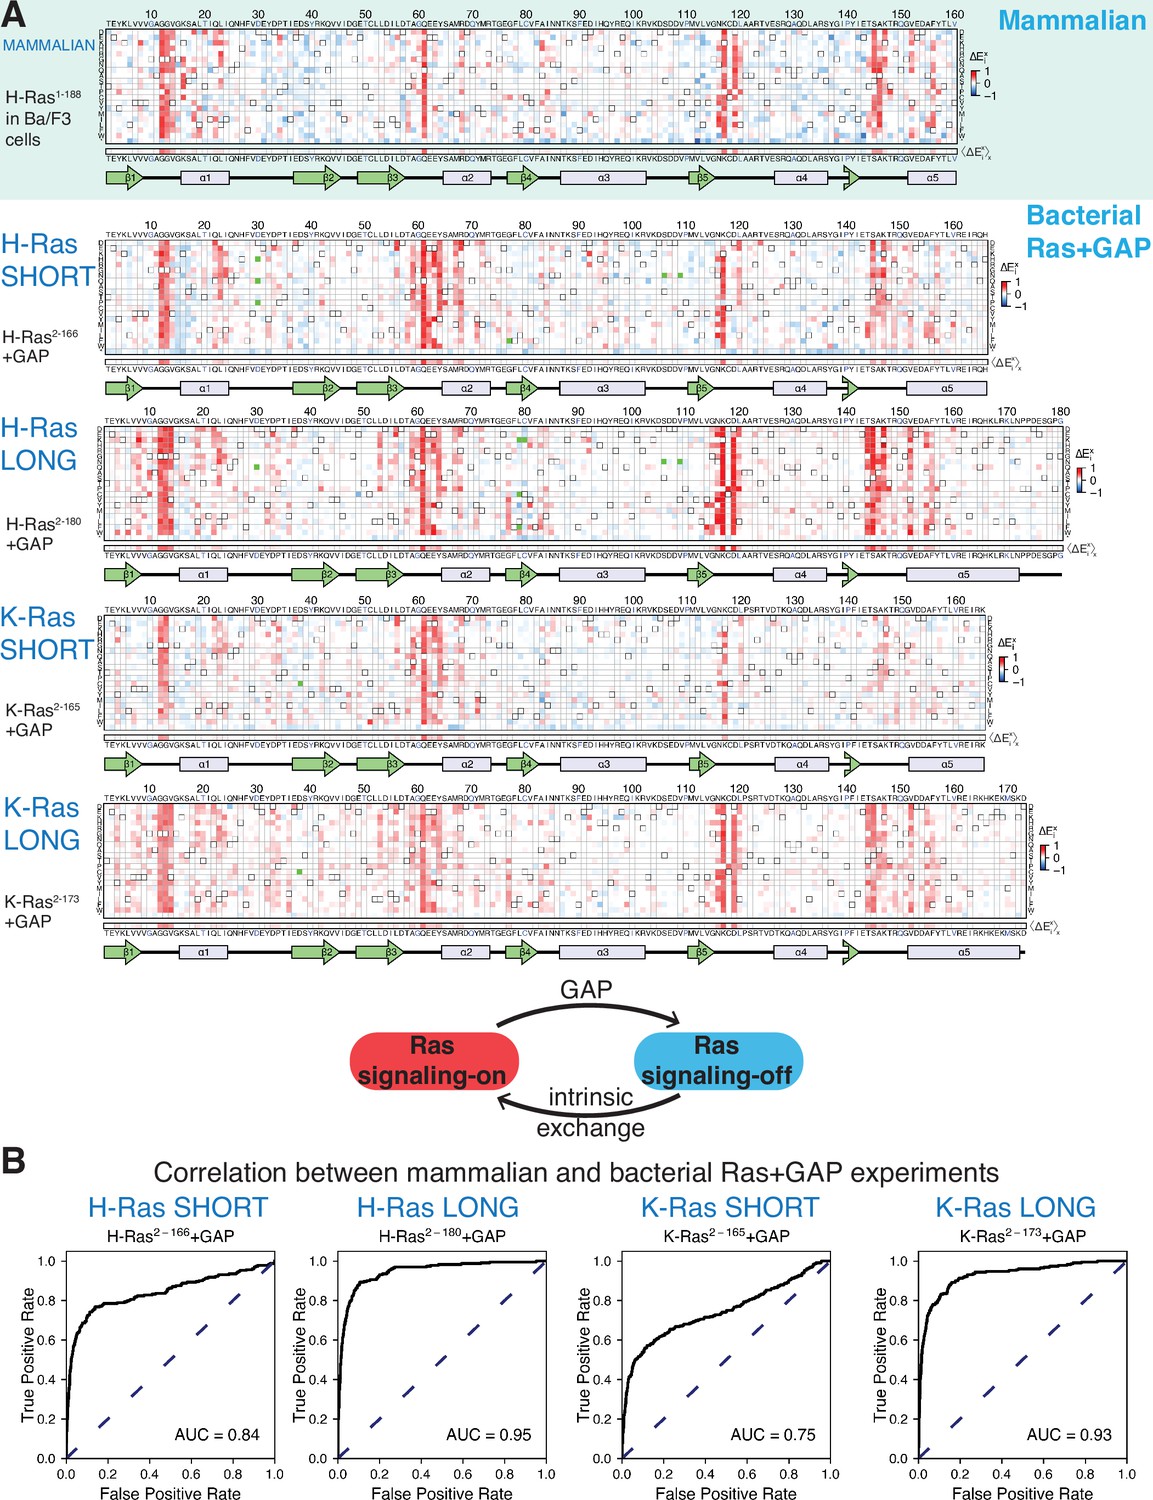
Mutational tolerance of Ras in mammalian Ba/F3 cells and the bacterial Ras+GAP experiment.
(A) The fitness data from saturation-mutagenesis experiments are shown in the form of a matrix, where each row of the matrix represents one of the twenty natural amino acids, and each column displays a residue of the protein (Bandaru et al., 2017). Each entry in the matrix represents, in color-coded form, the relative enrichment score () for the corresponding variant (see Equation 1). The data are normalized using the distribution of enrichment scores of all the synonymous wild-type sequences, so the median of the distribution has a value of zero. Shades of red and blue indicate gain and loss-of-function, respectively, relative to wild-type. Green indicates variants that were not represented in the library. Stop codons are labeled as ‘*’, and the bottom strip displays the functional effect of all amino acid substitutions at each position () – the average taken over each column. The relative enrichment values are provided in the GitHub repository. The secondary structural elements of Ras are displayed below each matrix. The top heatmap shows the data for saturation mutagenesis of H-Ras1-188 in mammalian Ba/F3 cells. Only the enrichment scores for variants within residues 2 and 160 are displayed in the heatmap, calculated as the mean of two biological replicates. The next four heatmaps show the data for H-Ras2-166, H-Ras2-180, K-Ras2-165, and K-Ras2-173 in the bacterial Ras+GAP experiments. The enrichment values shown are the mean of two, four, three, and four biological replicates, respectively. (B) The area under the curve (AUC) of receiver operating characteristic (ROC) graphs is used to determine which of the four Ras+GAP experiments better predicts the enrichment scores of mutations in the mammalian Ba/F3 cell experiment.
Figure 2—figure supplement 1
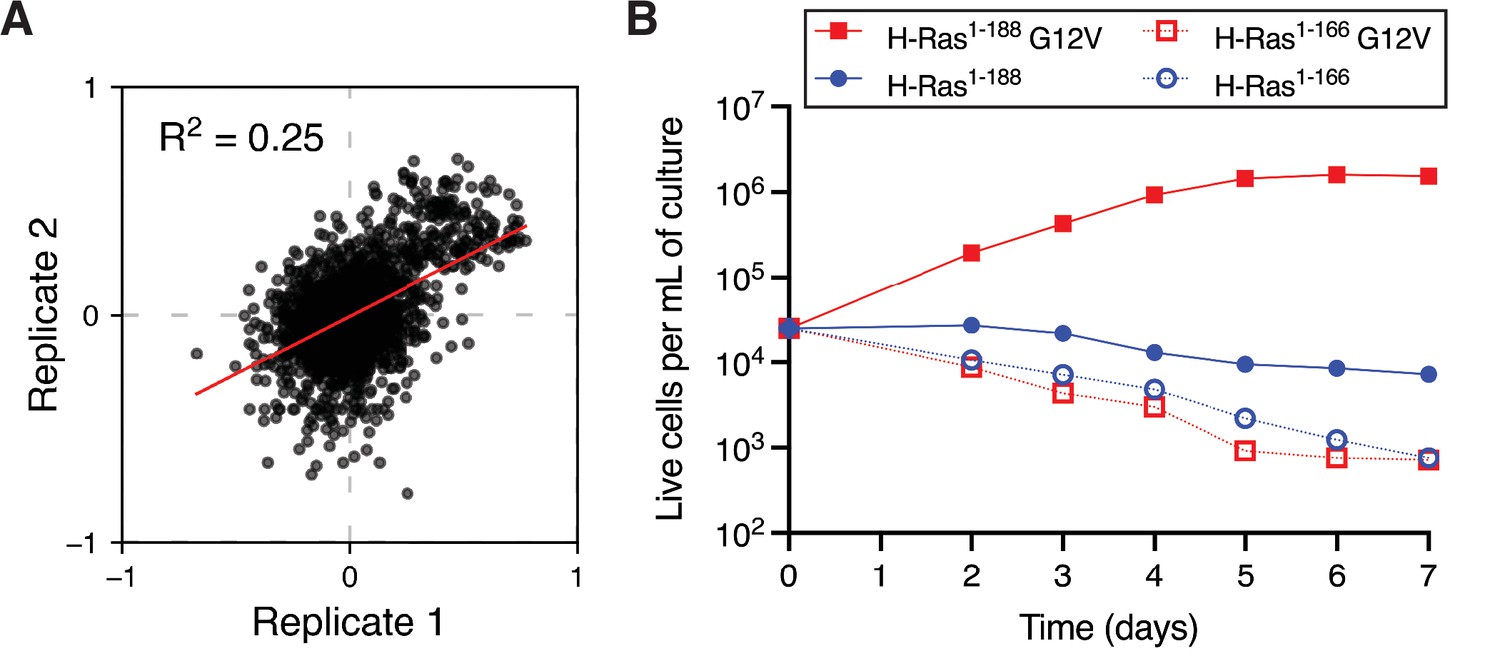
Mammalian Ba/F3 cell screen replicates and growth curves of wild-type H-Ras versus the G12V mutant.
(A) Scatter plot of the enrichment scores of the two biological replicates of the mammalian Ba/F3 screen. (B) Growth curves of mammalian Ba/F3 cells transduced with wild-type H-Ras or H-Ras G12V. Two constructs of different lengths are used. The first construct contains full-length H-Ras (1-188), and the second construct only the G-domain (1-166). Only H-Ras1-188 G12V promotes cell growth.
Figure 2—figure supplement 2
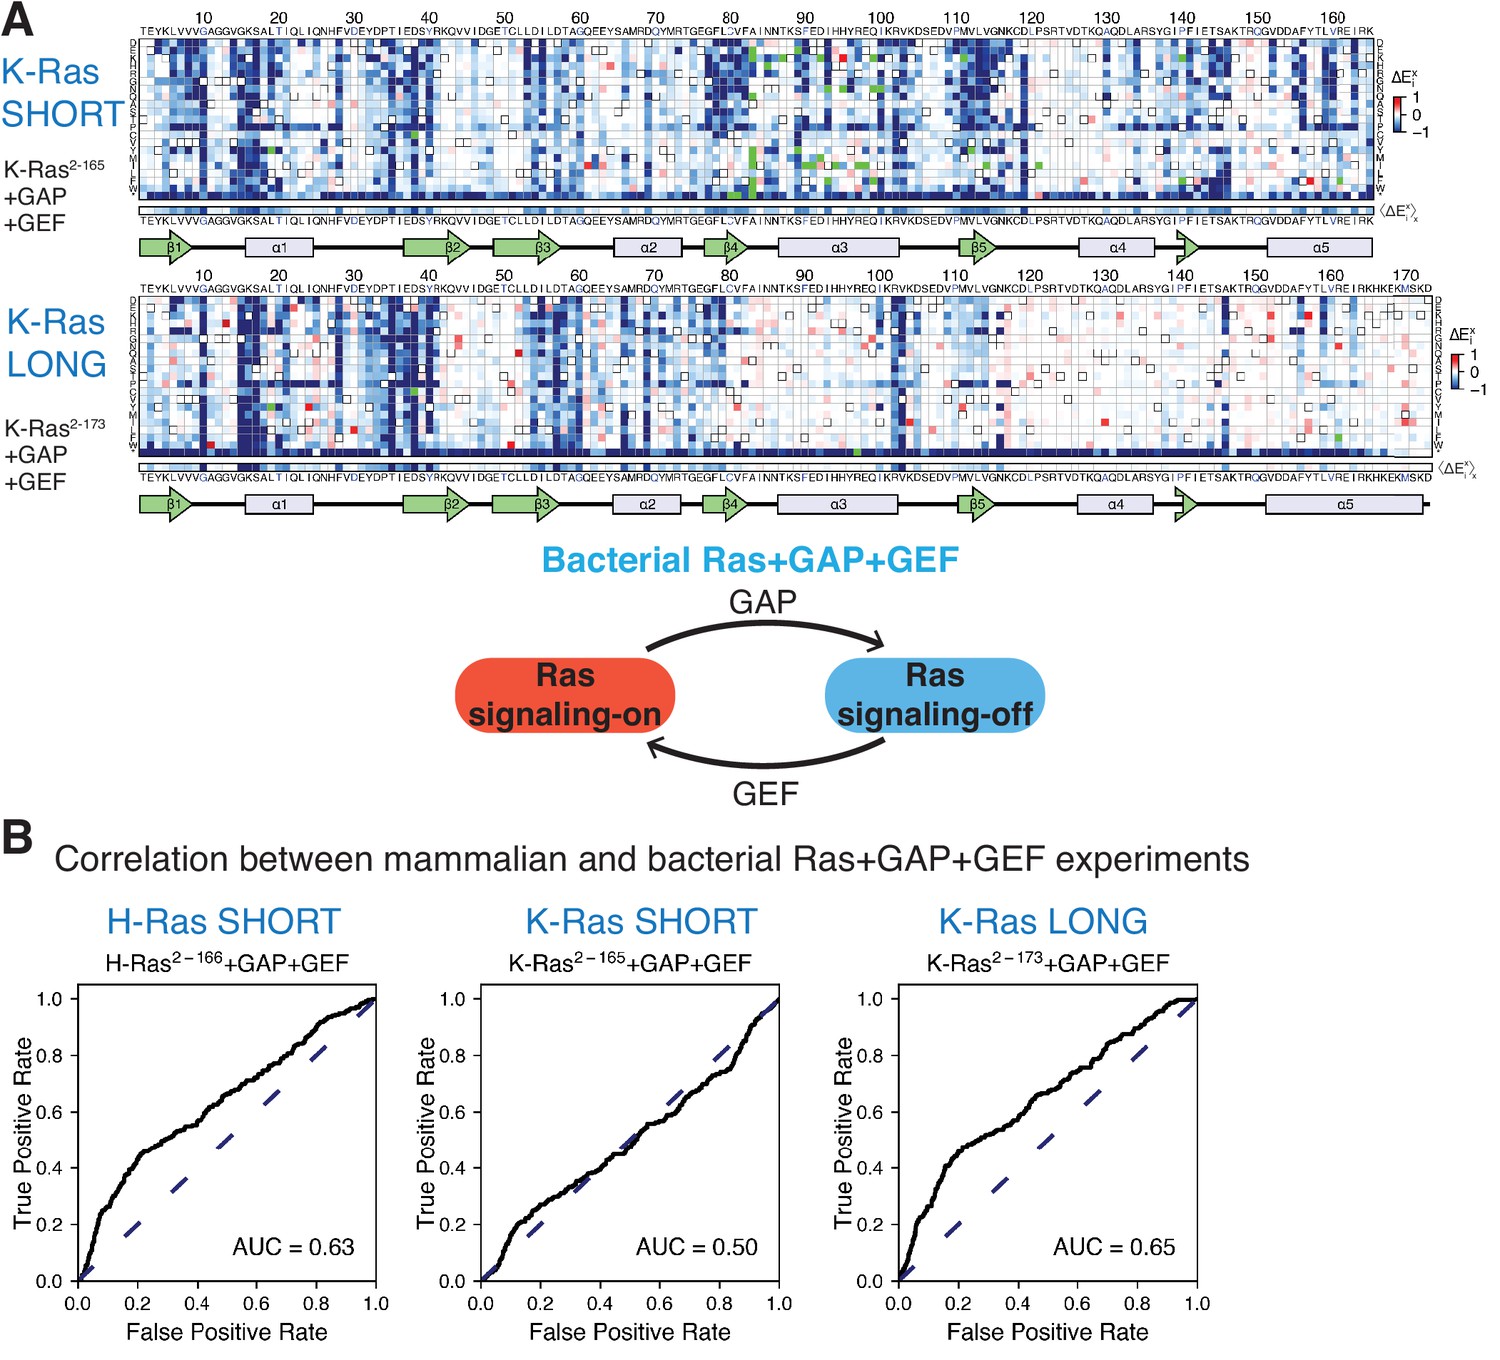
Mutational tolerance of Ras in the bacterial Ras+GAP+GEF experiment.
(A) Relative enrichment values () are shown in matrix form for the following experiments: K-Ras2−165+GAP+GEF and K-Ras2−173+GAP+GEF. The enrichment values of each experiment displayed are the mean of two biological replicates. (B) The ROC AUC is used to determine which of the Ras+GAP+GEF experiments better predicts the enrichment values of mutations in the mammalian Ba/F3 cell experiment. The data used to generate H-Ras2−166+GAP+GEF ROC graph was retrieved from our previous work (Bandaru et al., 2017). The ROC AUCs for the Ras+GAP+GEF experiments are lower than those for the Ras+GAP experiments.
Figure 3 with 1 supplement
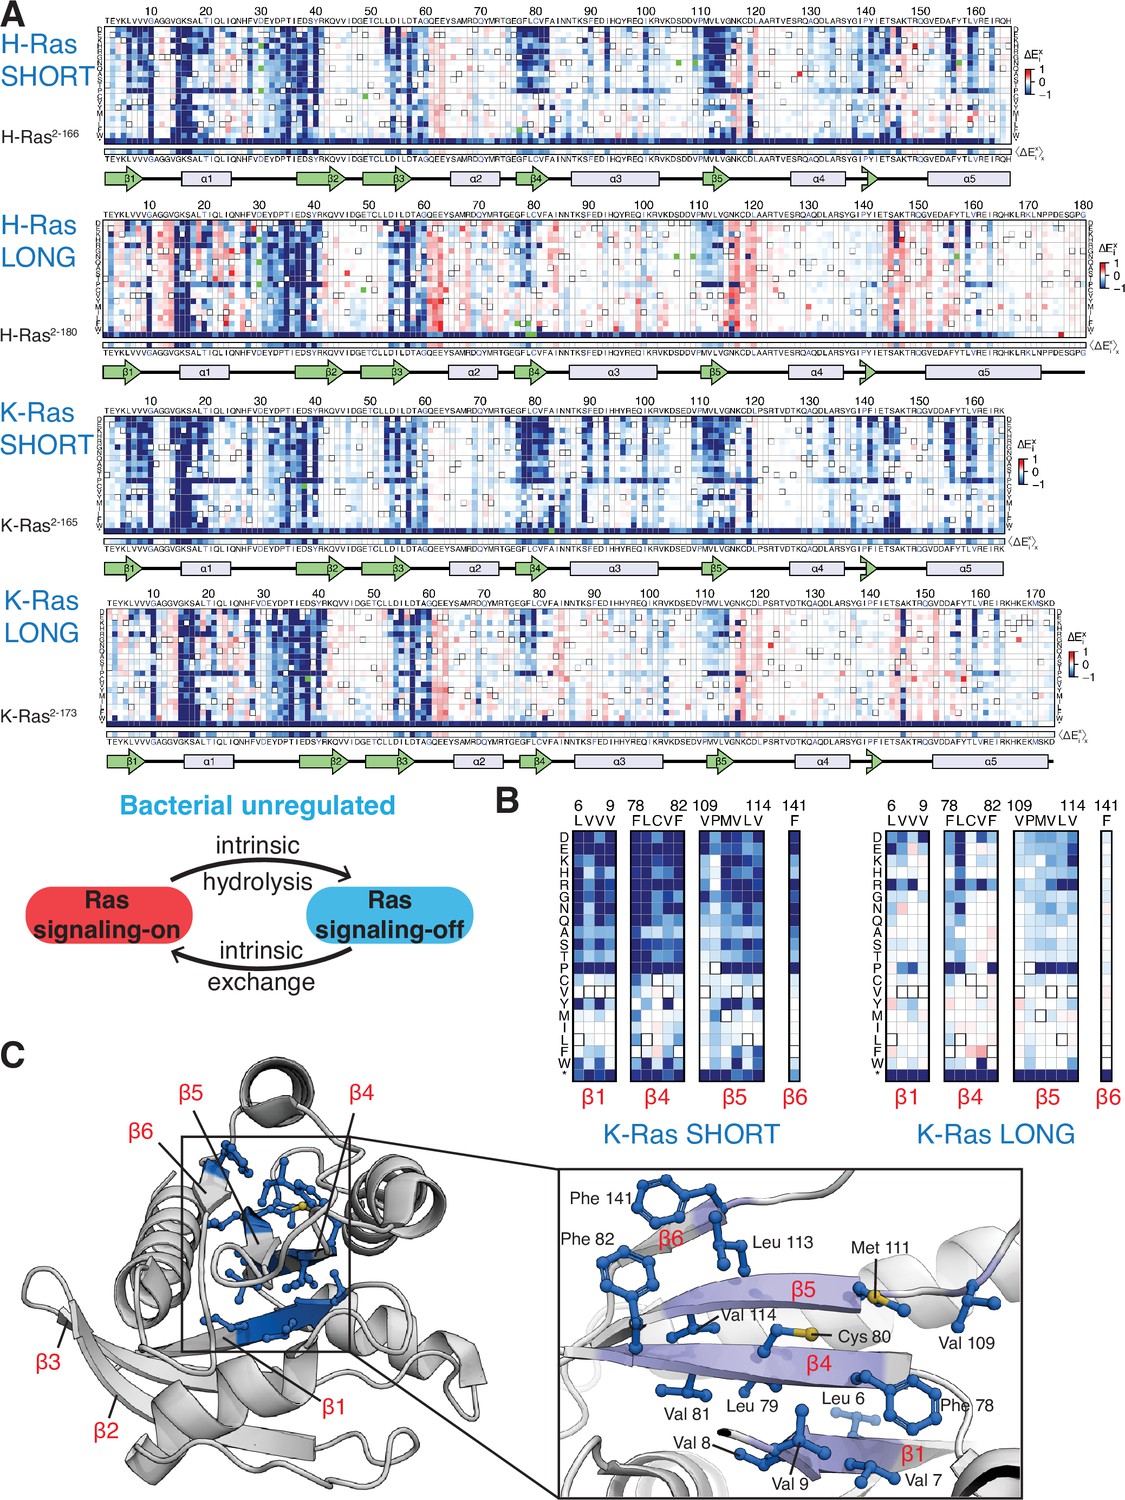
Mutational tolerance of Ras long and short constructs in the unregulated bacterial experiment.
(A) H-Ras2-166, H-Ras2-180, K-Ras2-165, and K-Ras2-173 in the unregulated experiment. The relative enrichment values () shown are the mean of three, four, two, and four biological replicates, respectively. Stop codons are labeled as ‘*’, and the bottom strip displays the functional effect of all amino acid substitutions at each position () – the average taken over each column. (B–C) Comparison of the mutational tolerance of residues in the hydrophobic core of K-Ras in the shorter and longer constructs. The enrichment scores for the hydrophobic core residues are shown for the two K-Ras constructs in B, and mapped onto K-Ras structure in C. PDB ID: 4OBE (Hunter et al., 2015).
Figure 3—figure supplement 1
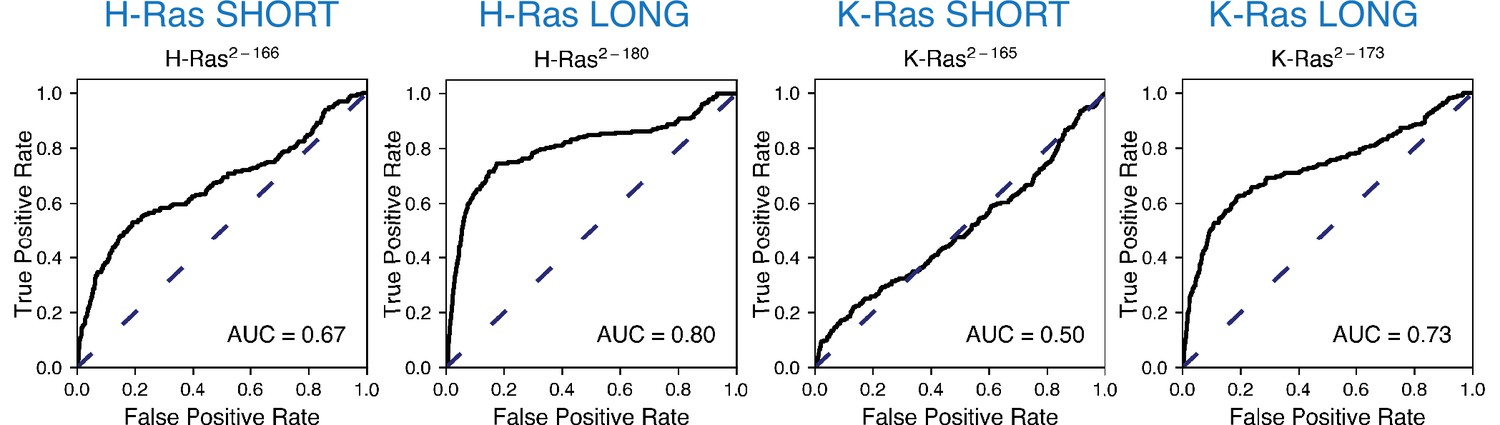
ROC analysis between the mammalian Ba/F3 cell experiment and the unregulated bacterial H-Ras and K-Ras experiments.
Scores are lower than for the Ras+GAP experiments.
Figure 4
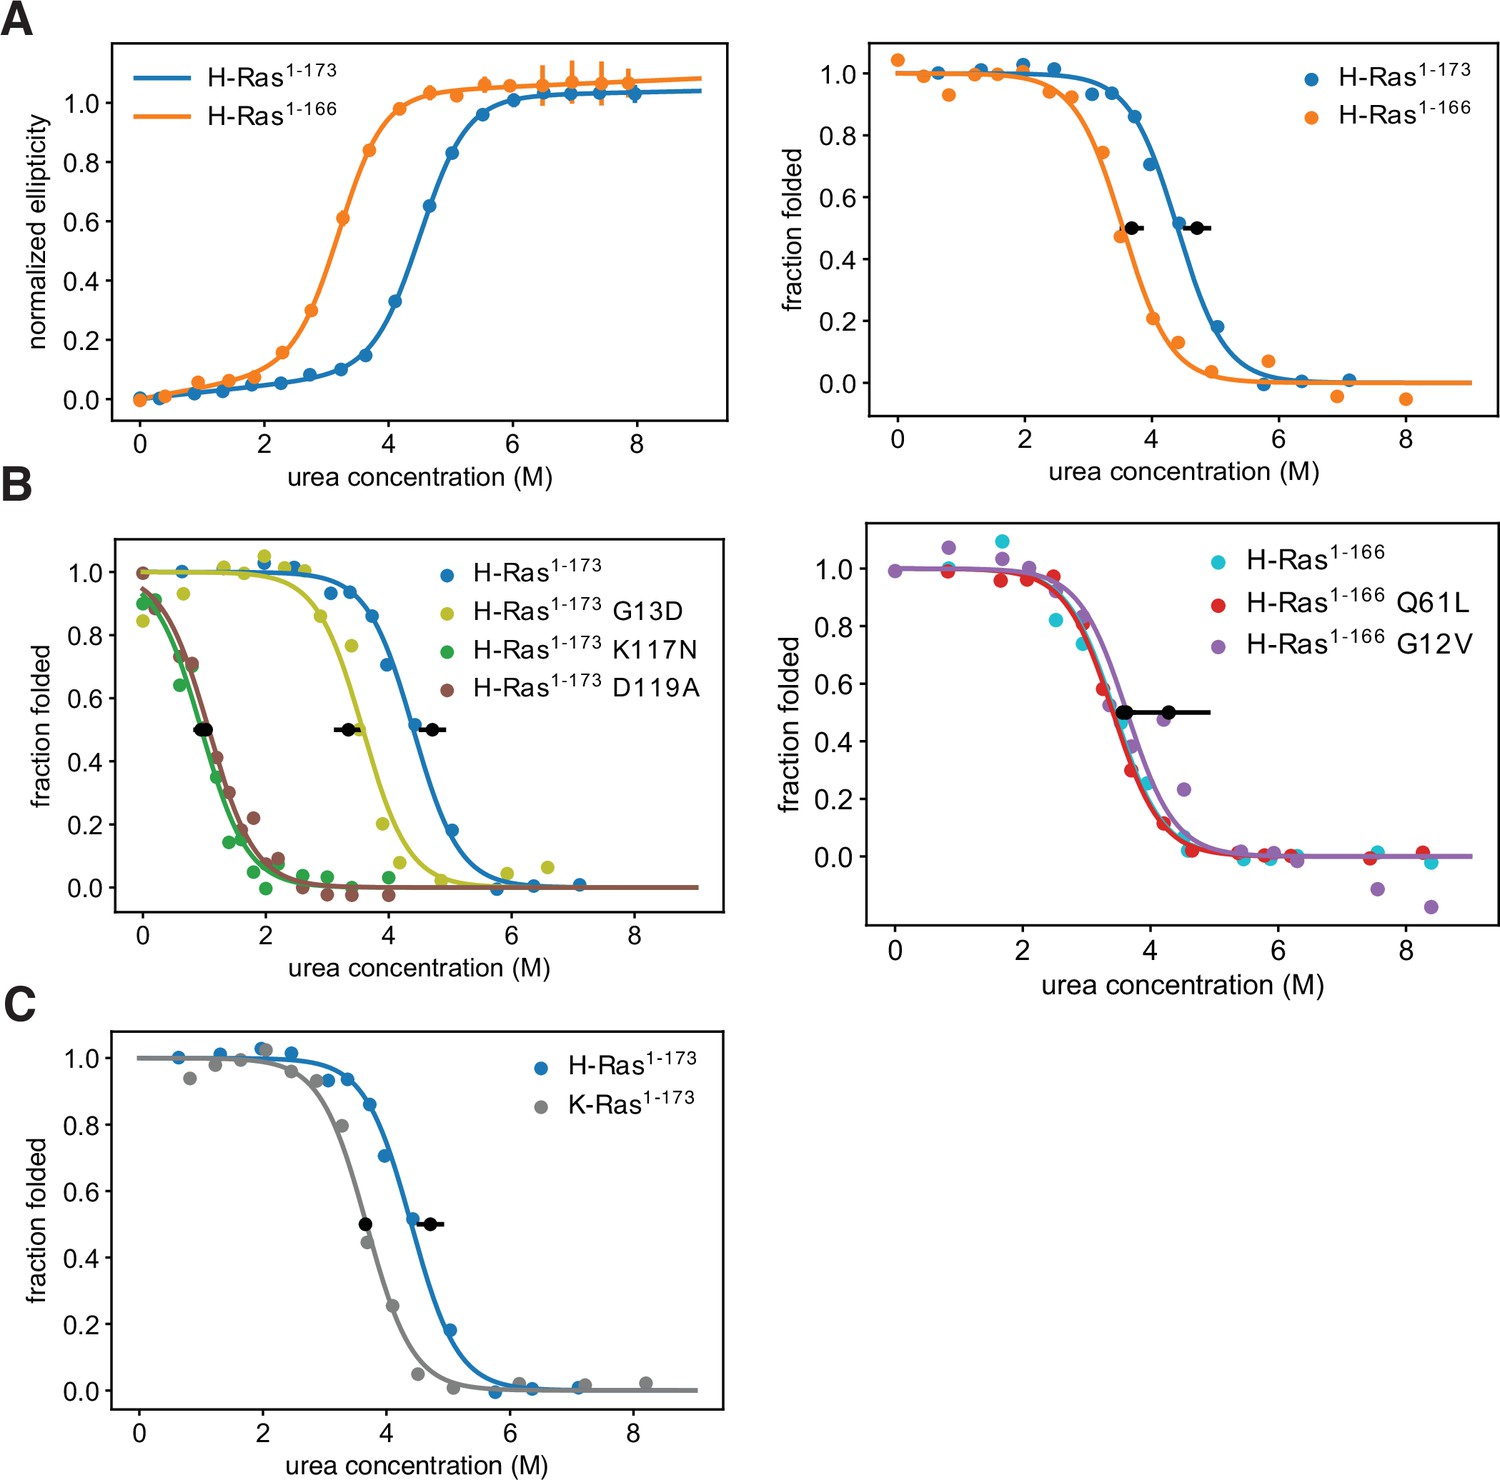
Thermodynamic stability measurements.
(A) The shorter H-Ras1-166 construct has an unfolding free-energy change (ΔGunf) of 22.2 ± 1.6 kJ⋅mol-1, and the longer H-Ras1-173 construct has a ΔGunf of 29.9 ± 1.4 kJ⋅mol-1 when measured by circular dichroism (left). When measured by pulse proteolysis (right), the shorter construct has a ΔGunf of 24.3 ± 1.3 kJ⋅mol-1, and the longer construct has a ΔGunf of 31.1 ± 1.5 kJ⋅mol-1. Both assays indicate that truncating the C-terminal helix destabilizes H-Ras by ~7 kJ⋅mol-1. The CD measurements were conducted at 25 °C, using 35.5 μM GDP and 0.5 μM Ras. CD signal error bars are ± two times the standard deviation of four 15 second reads. (B) Pulse proteolysis measurements of three cancer hotspots mutants (G12V, G13D, Q61L) and two stability-dependent gain-of-function mutants (K117N, D119A). The ΔGunf for G13D, K117N, and D119A mutants in the H-Ras1-173 construct are 22.1 ± 1.5 kJ⋅mol-1, 6.8 ± 0.5 kJ⋅mol-1, and 6.2 ± 0.8 kJ⋅mol-1, respectively. The G12V and Q61L variants were studied in the H-Ras1-166 construct. The ΔGunf for G12V, Q61L, and new replicates of wild-type are 28.3 ± 4.3 kJ⋅mol-1, 23.9 ± 1.0 kJ⋅mol-1, and 23.5 ± 1.0 kJ⋅mol-1, respectively. Hence, these cancer hotspot mutations are not destabilizing. (C) Pulse proteolysis measurements of H-Ras1-173 and K-Ras1-173. K-Ras1-173 has a ΔGunf of 24.2 ± 0.1 kJ⋅mol-1; hence, H-Ras1-173 is more stable than K-Ras1-173 by ~7 kJ⋅mol-1. The proteolysis experiments in A-C were conducted at 25 °C, using 100 μM GDP and 1.6 μM Ras. Midpoint marker error bars are ± the standard deviation of the estimated midpoint concentration (ΔGunf/m) across pulse proteolysis replicates.
Figure 5 with 3 supplements
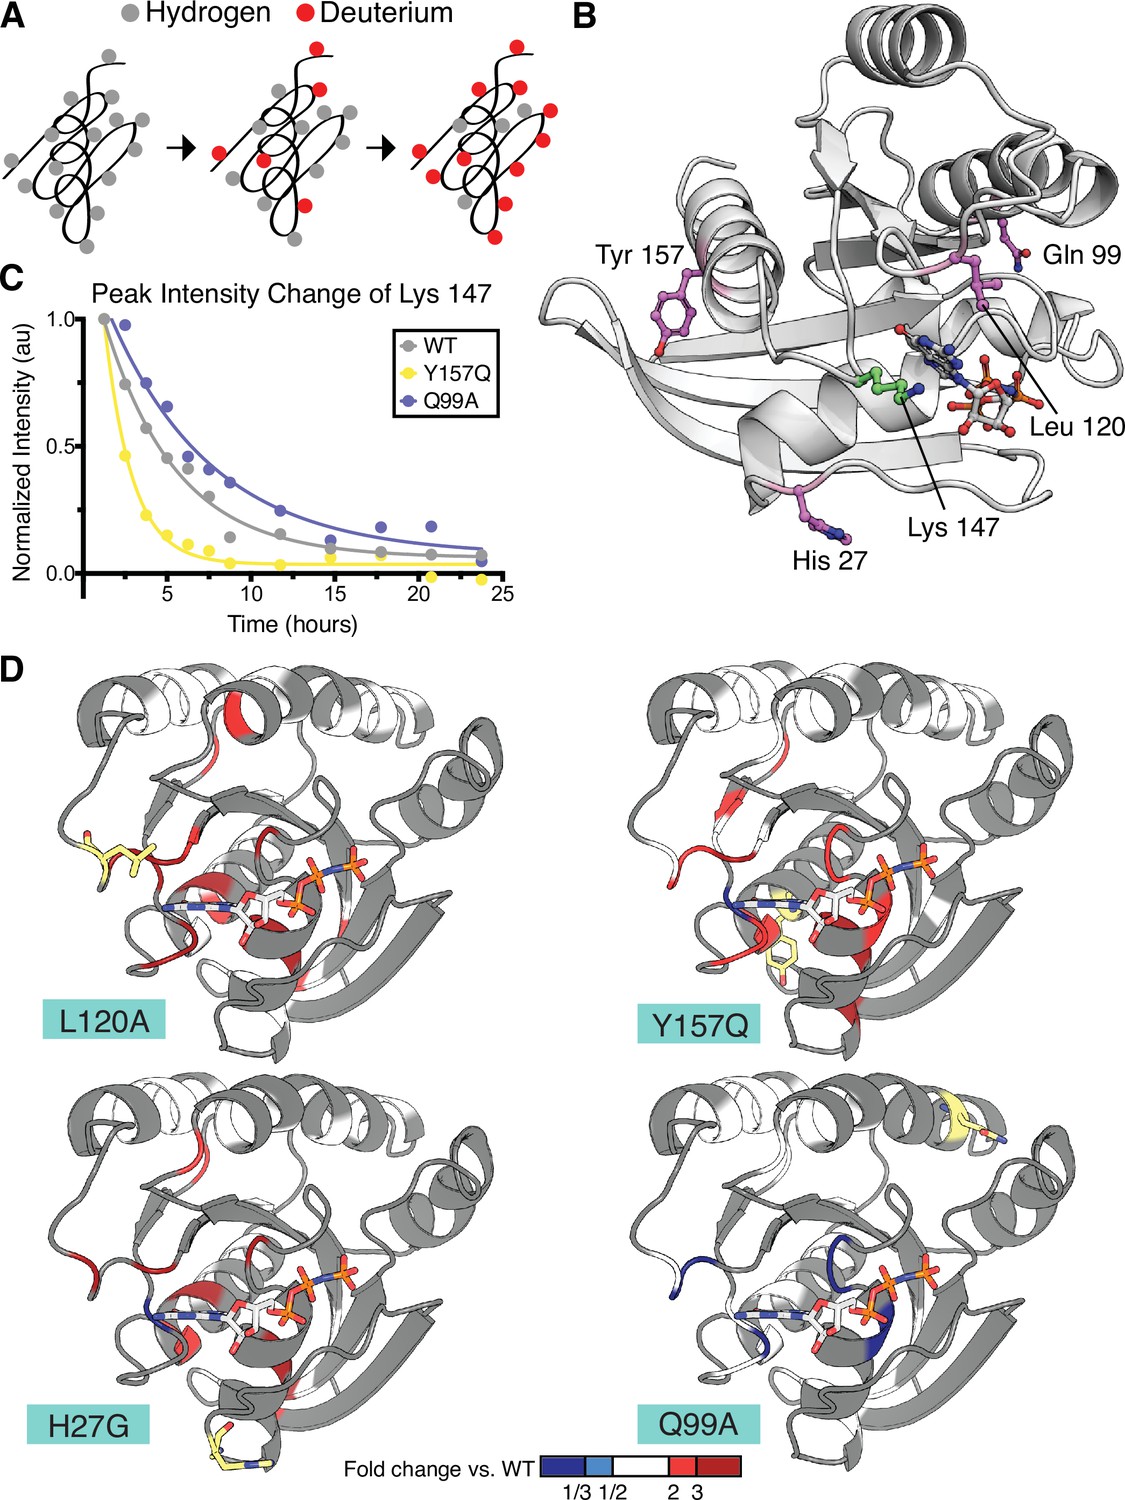
Hydrogen to deuterium exchange by NMR for activating H-Ras mutants.
(A) Schematic of expected backbone hydrogen to deuterium exchange (HDX) over time when lyophilized protein is resolubilized in D2O. (B) Structure displaying the four H-Ras mutants analyzed by HDX and the residue measured in C. PDB ID: 5P21 (Pai et al., 1990). (C) Integrated peak volume change over time for the Lys 147 for wild-type H-Ras1-166 (WT), Y157Q, and Q99A samples. The line represents a single-exponential fit, from which the time-constant can be converted to exchange rate. (D) Fold change in exchange time (kobs,mutant/kobs,WT) plotted onto the WT structure of H-Ras. The mutated sites are highlighted in yellow. Backbone is colored at positions where both WT and mutant exchange could be measured in order to determine fold change. This fold change is represented on the scale reflected at the bottom of the panel. Dark blue color represents a mutant exchange less than three times slower than WT, light blue color between a two and three times slower, white between two times slower and two times faster, light red color between two and three times faster, and dark red color greater than three times faster.
Figure 5—figure supplement 1
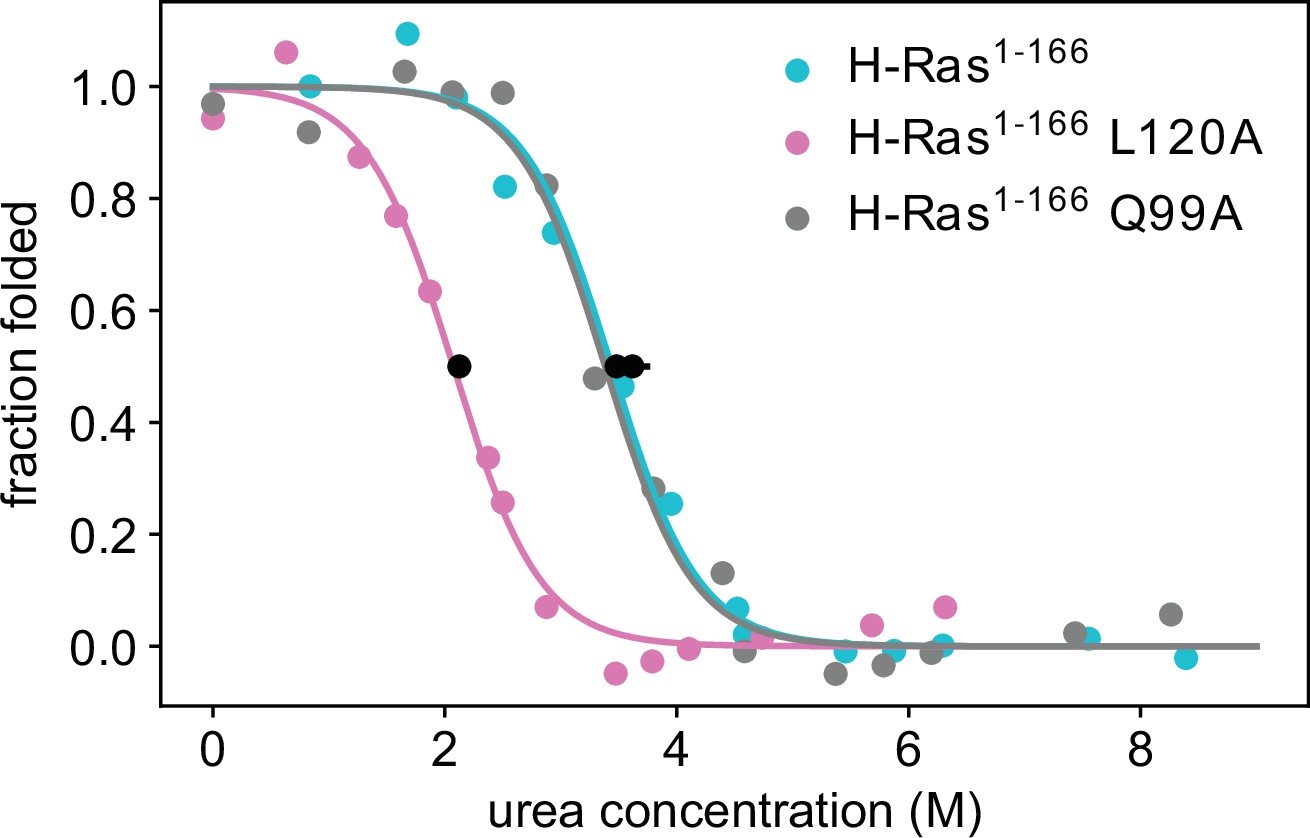
Thermodynamic stability measurements of L120A and Q99A.
Pulse proteolysis measurements of H-Ras1-166 L120A and Q99A variants, as well as new replicates of the wild-type construct. The values of the unfolding free-energy change (ΔGunf) are 14.0 ± 0.3 kJ⋅mol-1, 23.0 ± 0.7 kJ⋅mol-1 and 23.9 ± 1.0 kJ⋅mol-1, respectively. The proteolysis experiments were conducted at 25 °C, using 100 μM GDP and 1.6 μM Ras.
Figure 5—figure supplement 2
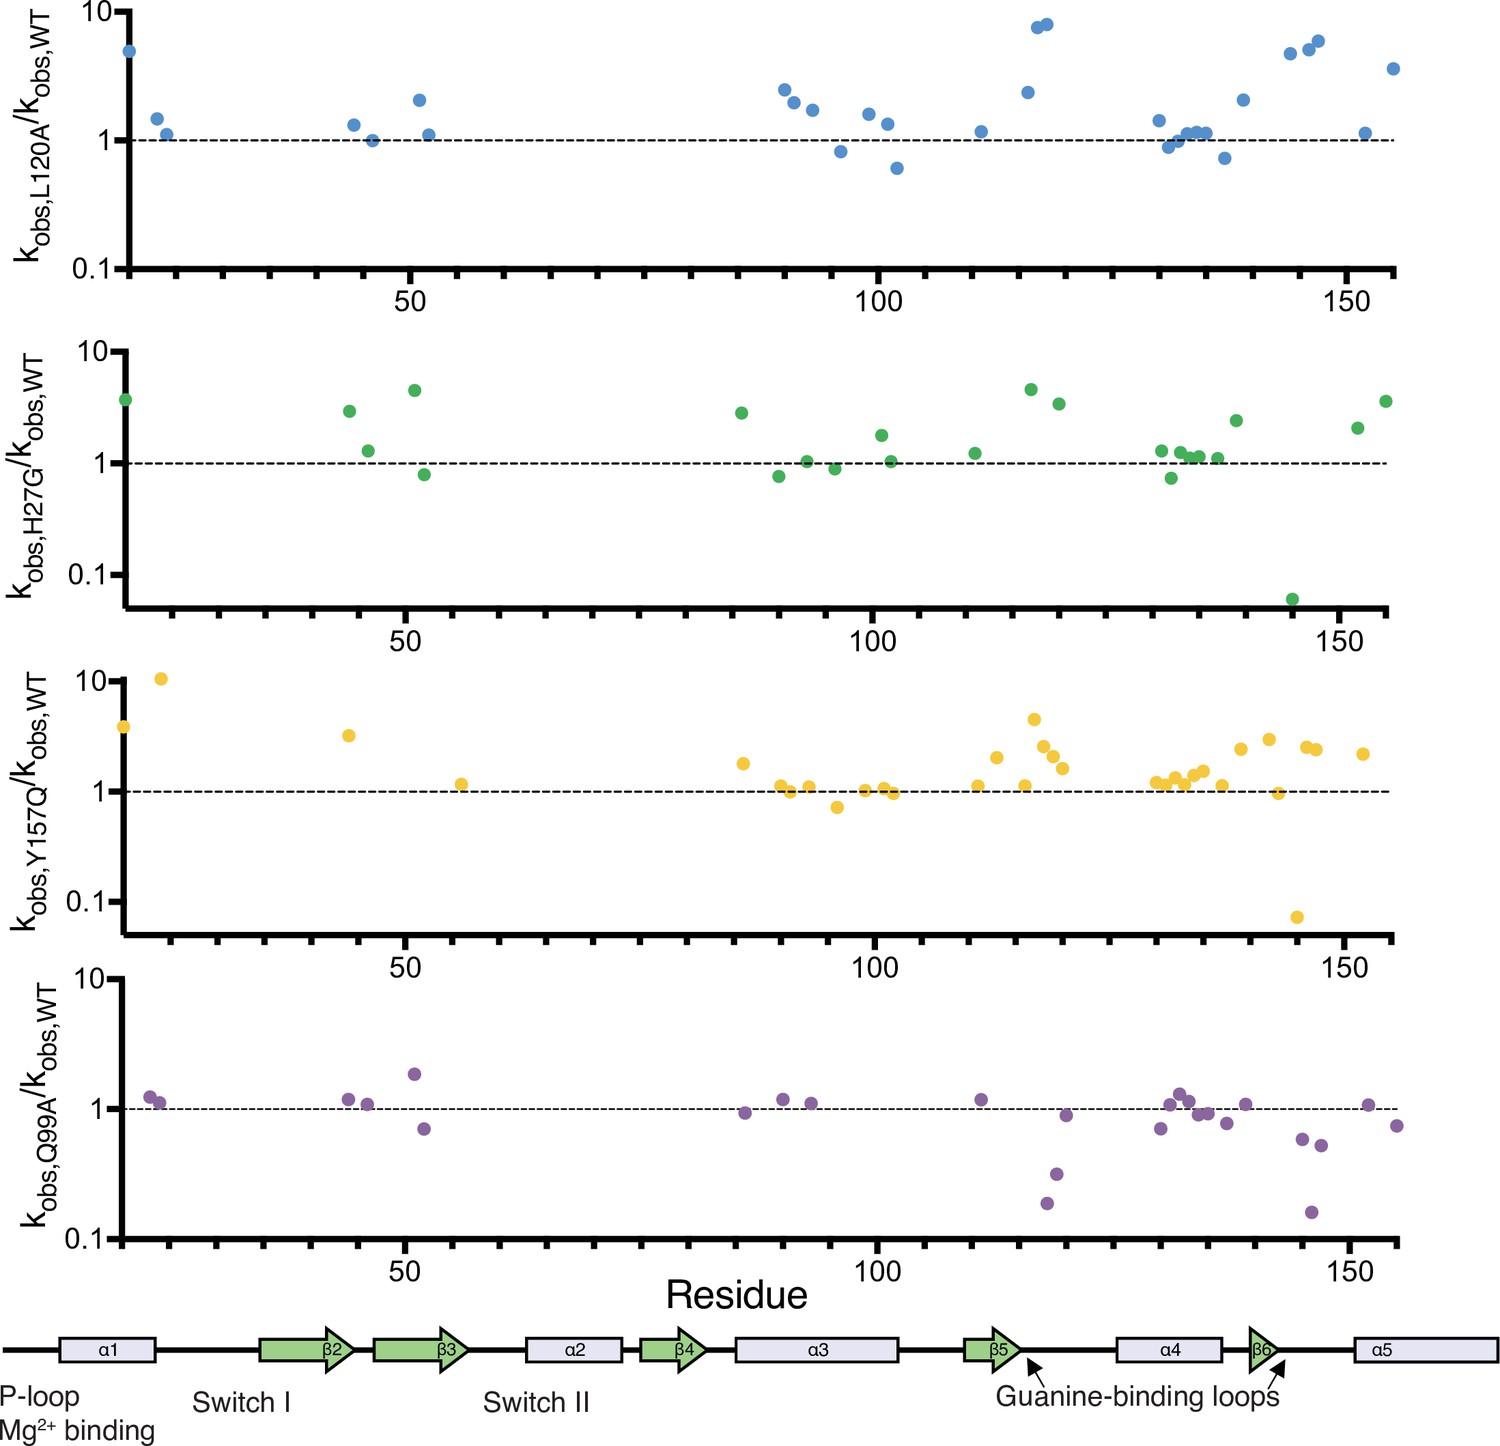
Relative change in hydrogen to deuterium exchange for each mutant.
Relative exchange (kobs,mutant/kobs,WT) plotted over residue number. A map of the secondary structural elements is aligned at the bottom. The structural overlay of the same data can be seen in Figure 5D.
Figure 5—figure supplement 3
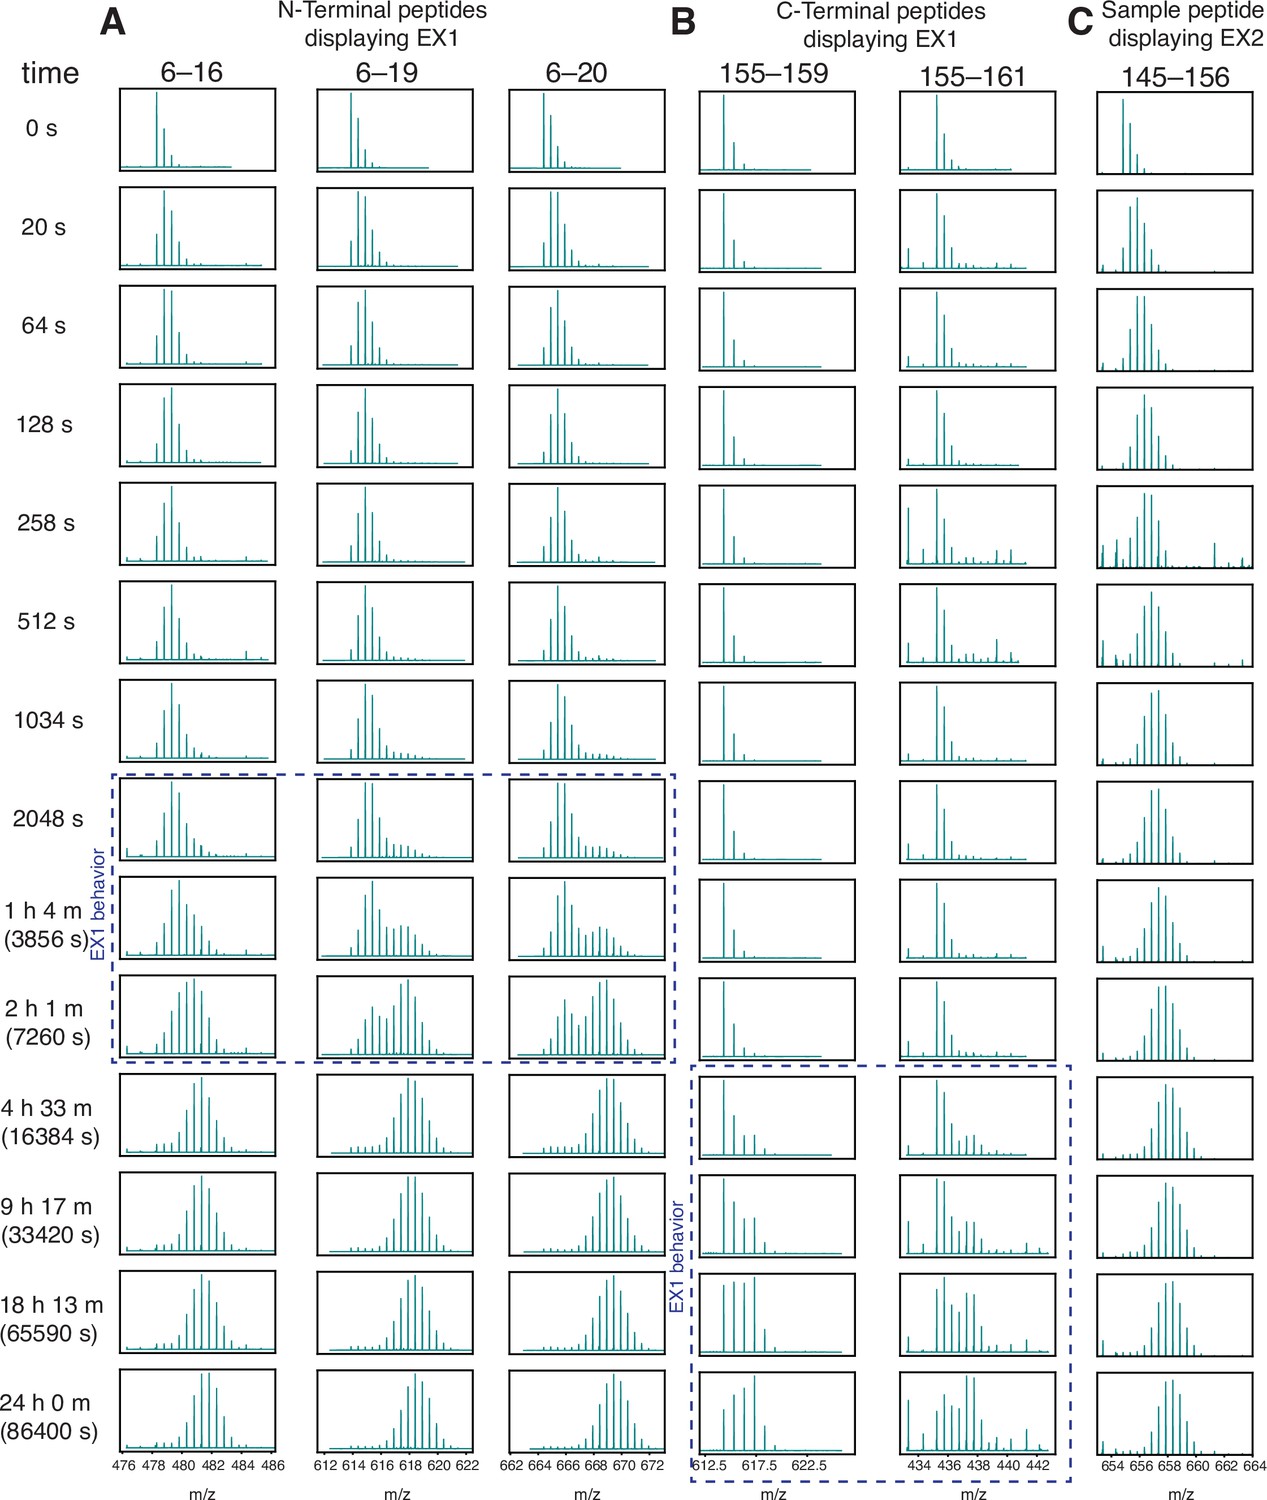
Wild-type H-Ras exhibits EX1 behavior at the N and C terminus.
HDX was measured by mass spectrometry. Reactions were quenched at different time points from time 0 to 24 hr and the protein was digested. Peptide m/z (residue numbers labeled at the top of each column) is plotted inside each box. (A) N-terminal peptides show bimodal exchange (indicative of EX1 behavior) from timepoints 2048 s to 2 hr. (B) C-terminal peptides show EX1 behavior from 4.5 hr to 24 hr. (C) Sample peptide showing EX2 behavior.
Figure 6 with 2 supplements

Prediction of the cancer mutations by the mammalian Ba/F3 cell and Ras+GAP experiments.
(A) Counts per residue of Ras variants that appear in the COSMIC v94 database and pass the five-count cutoff (Tate et al., 2019). There are twenty-eight residues where at least one mutation is present five or more times: residues 4, 5, 10, 12, 13, 14, 18, 19, 20, 22, 31, 33, 50, 57, 58, 59, 60, 61, 62, 63, 68, 72, 91, 92, 117, 119, 132, and 146. (B) ROC analysis of the H-Ras1-188 in mammalian Ba/F3 cells, H-Ras2−180+GAP, and K-Ras2−173+GAP datasets. For a given threshold enrichment value, we count a mutation as activating if its enrichment value is greater than the threshold. If an activating mutation is present in the COSMIC database five or more times, we count the prediction as a true positive. Mutations found in the gnomAD database are used as true negatives (Karczewski et al., 2020). The full list of mutations used in the analysis is provided in the Github repository.
Figure 6—figure supplement 1
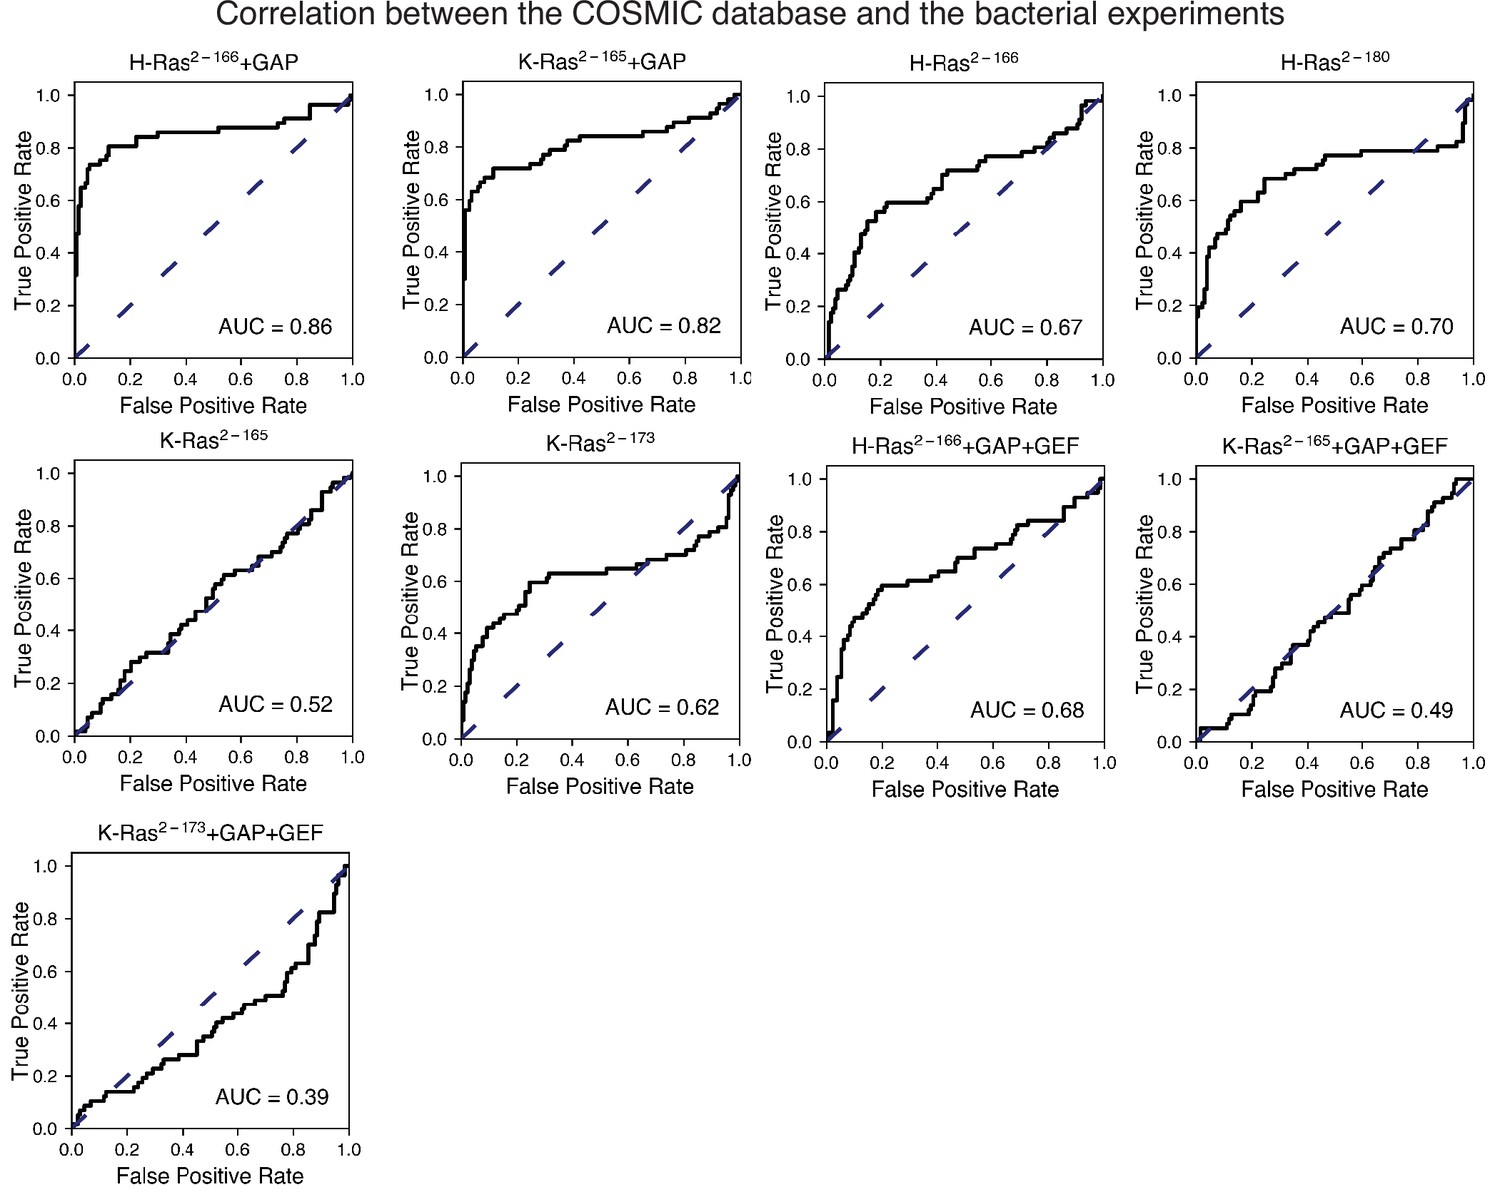
Prediction of the cancer mutations by the bacterial experiments.
This figure shows the ROC plots for the experiments not shown in Figure 6B. The Ras+GAP datasets have higher ROC AUC scores than the Ras+GAP+GEF or the unregulated conditions.
Figure 6—figure supplement 2
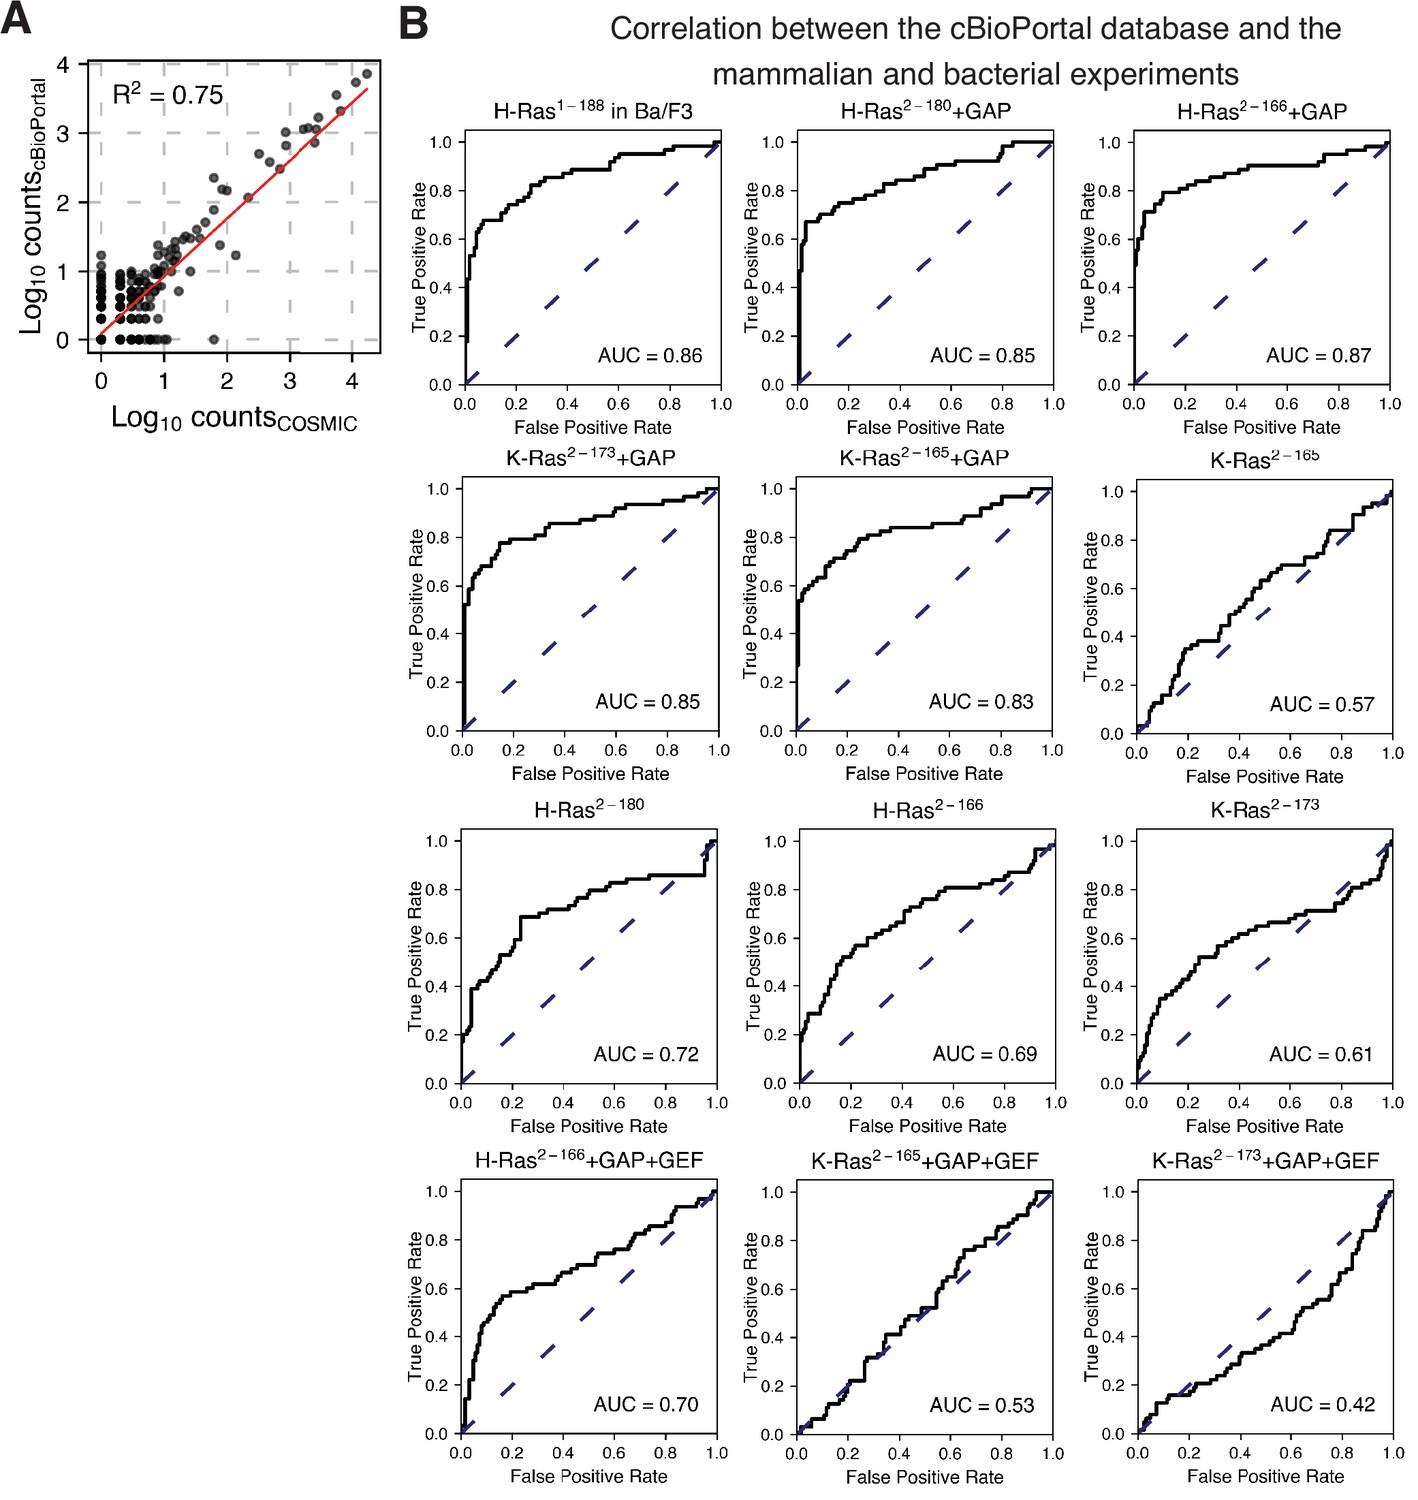
Prediction of the cancer mutations using the cBioPortal dataset as true positives.
(A) Scatter plot between the COSMIC counts and the cBioPortal counts per variant. (B) The ROC analysis shown in Figure 6 and Figure 6—figure supplement 1 was repeated using the cBioPortal counts as true positives. The mammalian Ba/F3 cell and Ras+GAP datasets have higher ROC AUC scores than the Ras+GAP+GEF or the unregulated datasets.
Figure 7 with 4 supplements
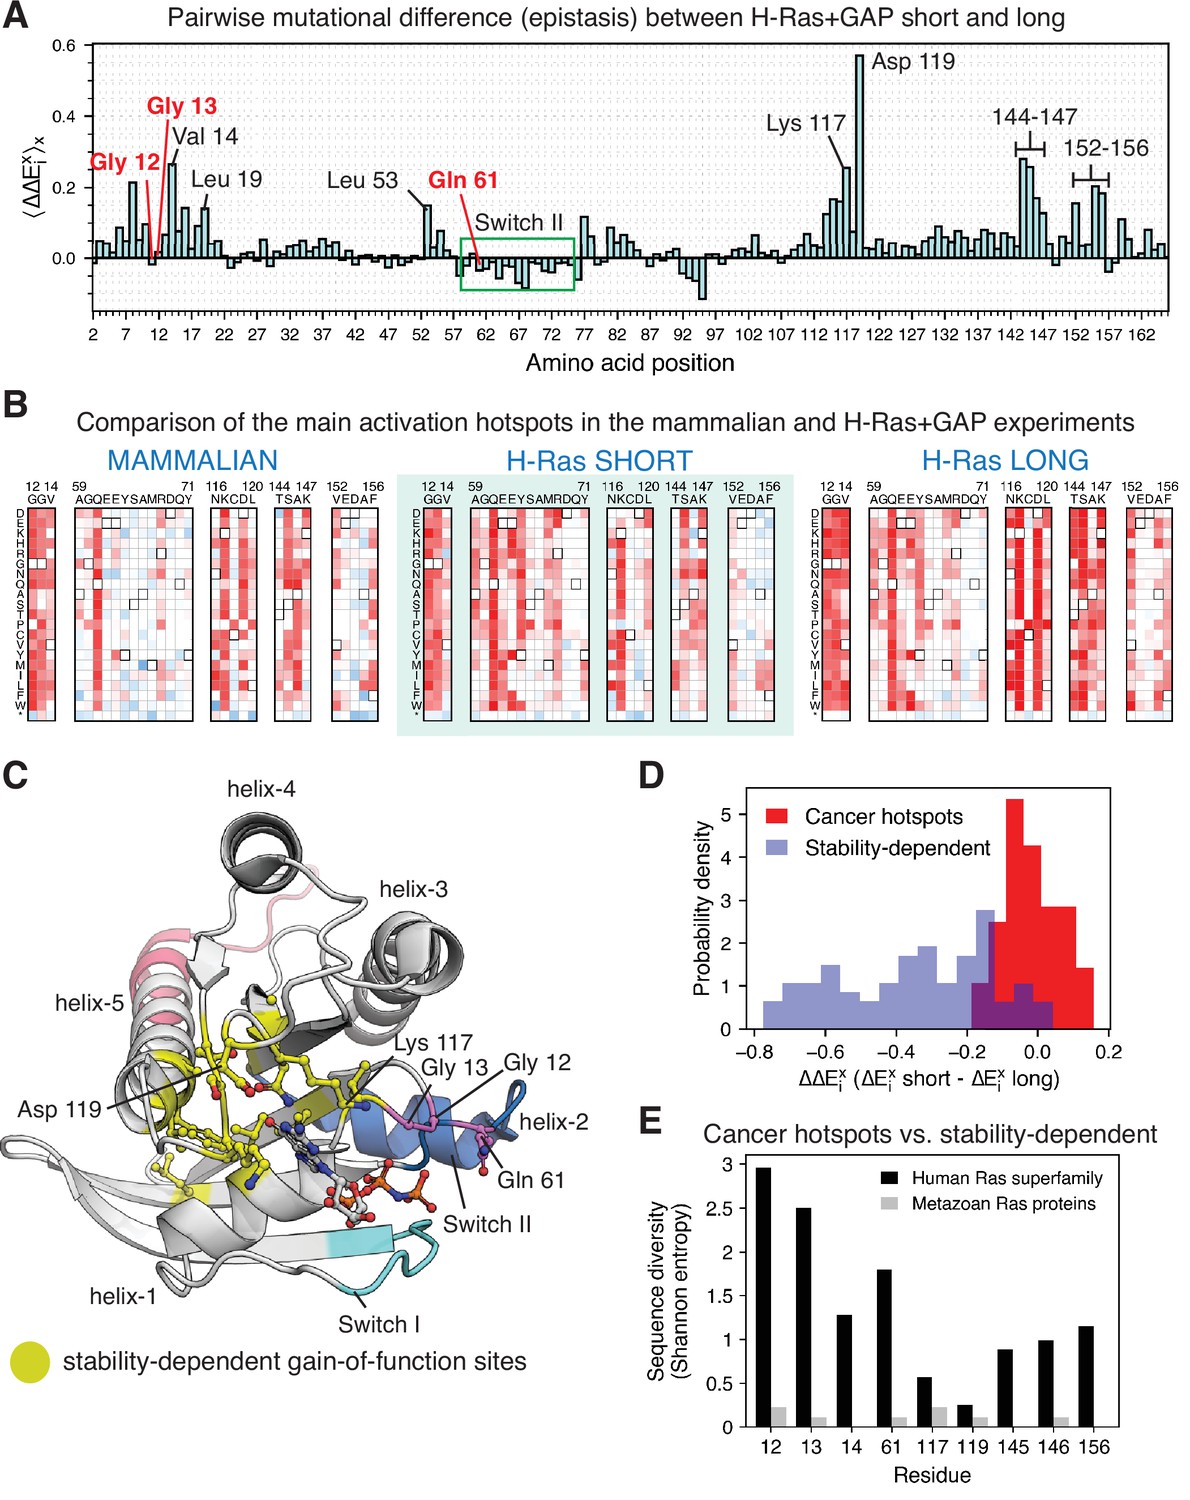
Analysis of the phenotype of activating hotspots in the screens (A) Comparison of the mutational sensitivity profiles for long and short H-Ras+GAP datasets.
The pairwise difference (epistasis) is shown averaged over amino acids at each position (). Figure 7—figure supplement 4 compiles the activating sites where there is epistasis. (B) Comparison of enrichment values for substitutions at activating sites in the H-Ras+GAP and mammalian Ba/F3 cell experiments. Substitutions at the cancer hotspots are activating, whereas substitutions at other sites (e.g.,Val 14 or Asp 119) are gain-of-function only in the longer constructs. (C) The stability-dependent gain-of-function sites are mapped onto Ras structure. PDB ID: 2MSD (Mazhab-Jafari et al., 2015). (D) Comparison of the pairwise difference () for activating mutations at the stability-dependent gain-of-function sites and at the cancer hotspots in long and short H-Ras+GAP datasets. Only mutations that are activating in the longer construct ( > 1.5 times the standard deviation) are considered in this analysis. (E) Sequence diversity analysis of the top-nine gain-of-function mutations found in the H-Ras1-188 in mammalian Ba/F3 cells. Two separate multiple sequence alignments (MSAs) were used in the analysis: a MSA of the ~150 proteins in the human Ras superfamily (Rojas et al., 2012), and a MSA of the Ras ortholog sequences found in an evolutionary analysis of metazoan Ras (Bandaru et al., 2017).
Figure 7—figure supplement 1
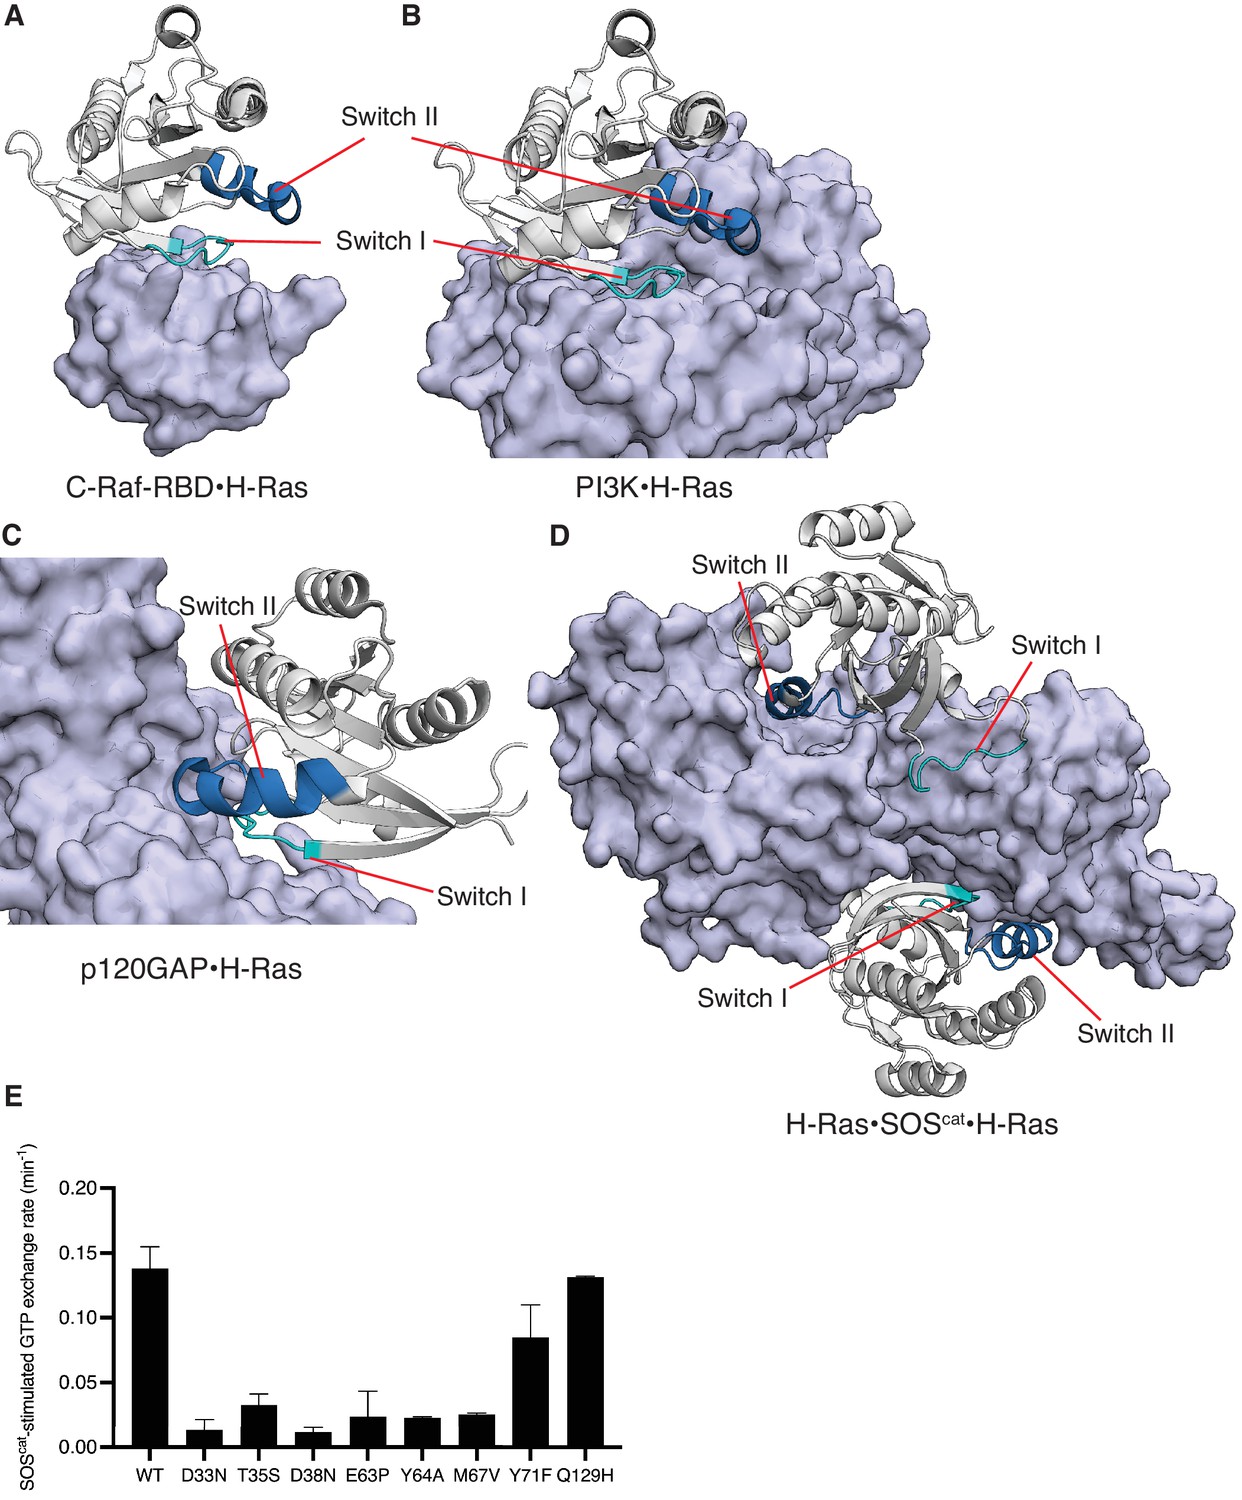
Structures of C-Raf-RBD, PI3K, p120GAP, and SOScat in complex with H-Ras, and SOScat-stimulated GTP release measurements of selected mutants.
Switch II is involved in binding to SOS, p120GAP, and effectors such as PI3K, but not C-Raf-RBD. (A) C-Raf-RBD•H-Ras complex, (B) PI3K•H-Ras complex, (C) p120GAP•H-Ras complex, and (D) H-Ras•SOScat•H-Ras complex. PDB IDs: 4G0N, 1HE8, 1WQ1, and 1NVV (Fetics et al., 2015; Margarit et al., 2003; Pacold et al., 2000; Ahmadian et al., 1997). (E) SOScat-stimulated GTP exchange rates measured by fluorescent-nucleotide release for a panel of H-Ras mutants. Mutants in Switch I (residues 30–38) and Switch II (residues 59–76) directly affect SOScat binding and lead to reduced GTP release rates. In our previous work, Q129H had similar GRP1-stimulated GTP release rates to wild-type (WT) and here is used as a control (Bandaru et al., 2017). Error bars are calculated as the standard deviation of two or three replicates.
Figure 7—figure supplement 2
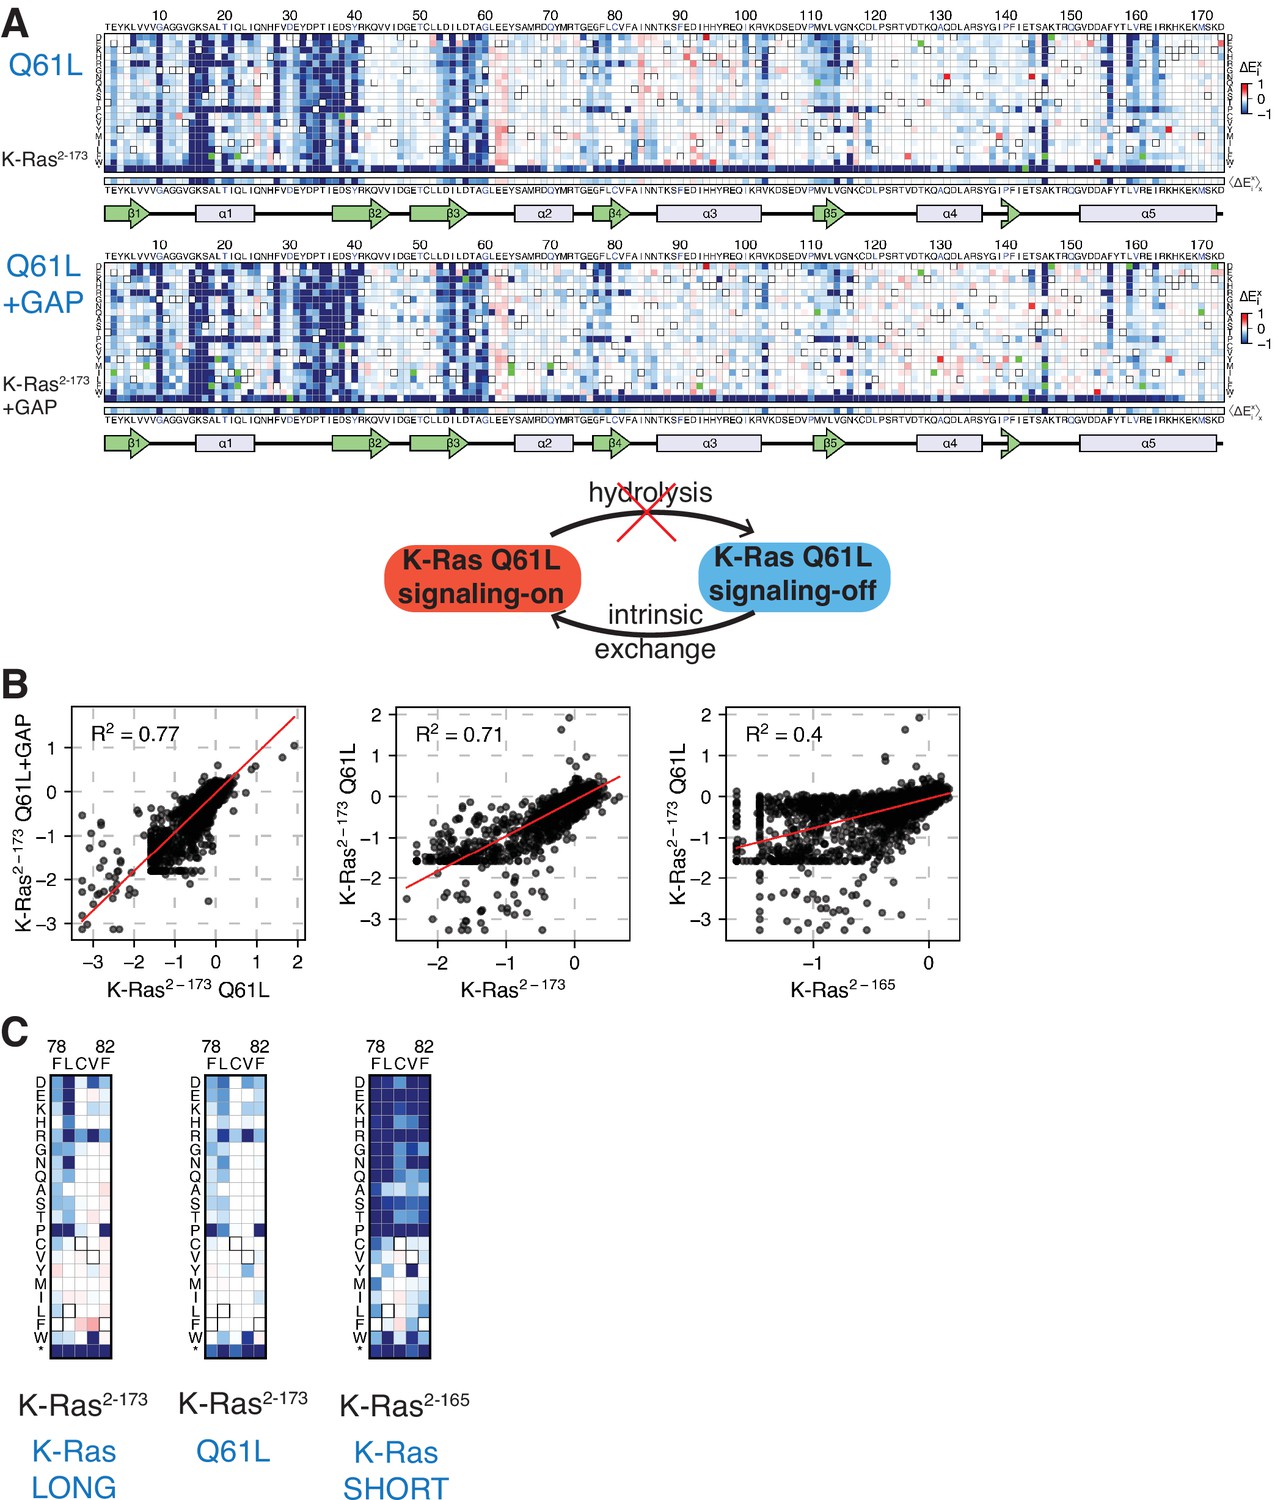
Mutational tolerance of K-Ras2-173 with a Q61L background mutation.
(A) Relative enrichment values () are shown in matrix form for the K-Ras2-173 Q61L (‘Q61L’) construct in the absence of regulators and Ras+GAP conditions. The enrichment values of each experiment displayed are the mean of three and two biological replicates, respectively. (B) Scatter plots of the enrichment values of the unregulated wild-type K-Ras2-165 and K-Ras2-173 versus Q61L experiments. The high R2 value of the Q61L versus Q61L+GAP indicates that the Ras+GAP condition resembles a pseudo-unregulated experiment. The correlation between Q61L with the longer K-Ras2-173 construct is higher than with the shorter K-Ras2-165 construct. (C) Zoomed-in section of residues 78–82 for the unregulated K-Ras2-173, Q61L, and K-Ras2-165 experiments. The Q61L construct presents a similar mutational sensitivity to wild-type K-Ras2-173. Gain-of-function mutations are dampened in the Q61L dataset because Ras is already in a GTP-bound state, limiting the activating effect of some mutations.
Figure 7—figure supplement 3

Location of top-activating sites in the mammalian Ba/F3 cell experiment and structure of H-Ras, Rap1B, and Rab29.
(A) Structure of H-Ras with the top-nine sites of gain-of-function mutations in the H-Ras1-188 in mammalian Ba/F3 cells. PDB ID: 5P21 (Pai et al., 1990). (B) The G-domain is conserved among the three proteins of the human Ras superfamily. Rab29 and Rap1B have sequence identities with H-Ras of ~27% and ~ 56%, respectively. Rab29 has alanine instead of glycine at positions corresponding to residues 12 and 13 of human Ras, and Rap1B, has a threonine instead of a glutamine at position 61. PDB IDs: 5P21, 3X1X, and 6HH2 (McGrath et al., 2021; Noguchi et al., 2015; Pai et al., 1990).
Figure 7—figure supplement 4
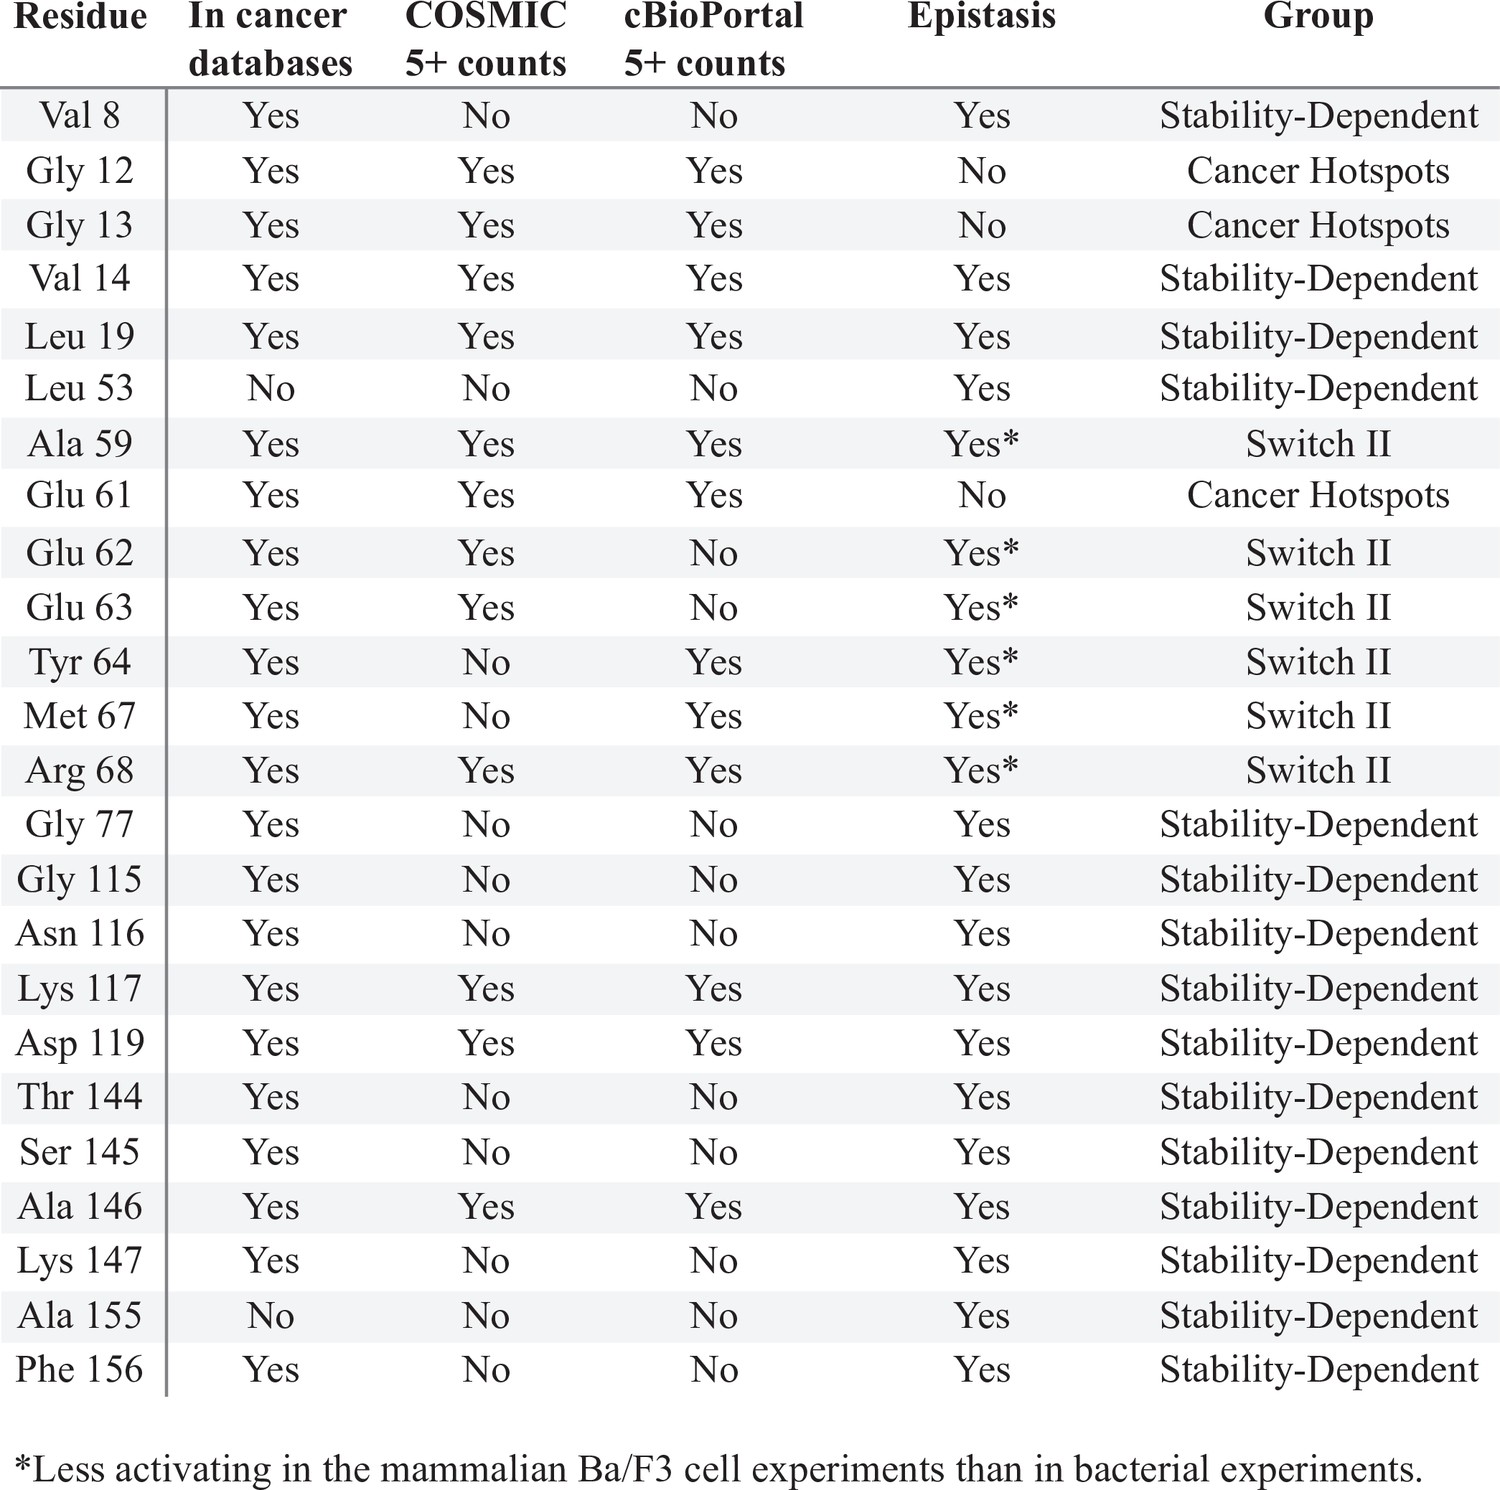
Sites of H-Ras where mutations have a different phenotype in the mammalian Ba/F3 cell and H-Ras+GAP experiments.
The column ‘In cancer databases’ lists if mutations at that residue are found in cancer, regardless of the number of counts. The columns ‘COSMIC 5+ counts’ and ‘cBioPortal 5+ counts’ say whether a mutation in that residue is found at least five times in that database. The column ‘Epistasis’ reports whether the mutational profile of that residue is different between the H-Ras+GAP short and long and the mammalian Ba/F3 screens. The column ‘Group’ categorizes the residues into: stability-dependent gain-of-function, Switch II, or cancer hotspots.
Figure 8
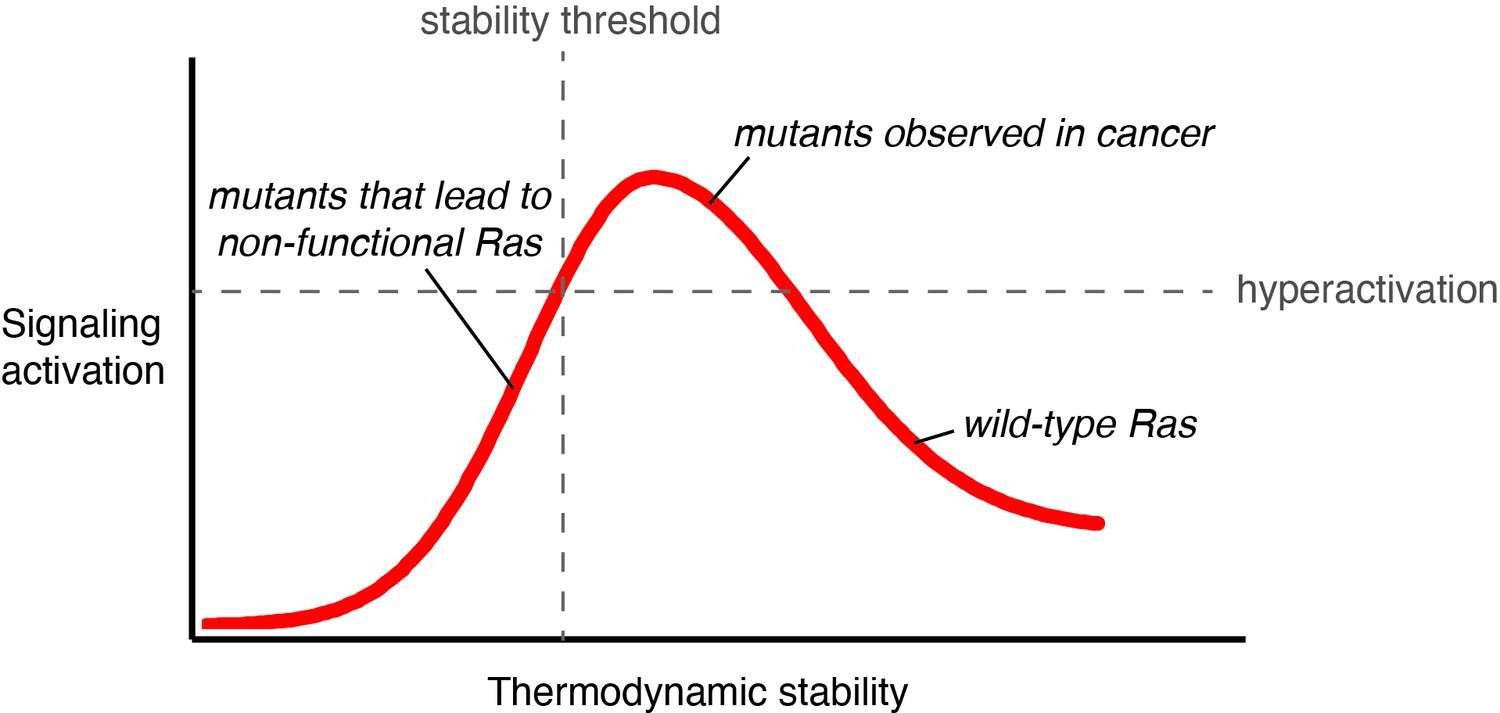
Signaling activity versus thermodynamic stability.
A conceptual relationship between the thermodynamic stability and signaling activity of Ras variants is shown. A decrease in stability can increase signaling activity by enhancing nucleotide-exchange rates or compromising catalytic activity. However, further stability reduction reaches the stability threshold. The stability threshold buffers the deleterious effects of mutations (Bershtein et al., 2006), and is epistatic in nature; once exhausted, the deleterious effects of mutations become fully pronounced. Hence, signaling activity decreases. The closer a mutant is to the stability threshold, the narrower the window where the mutant can promote hyperactivation in vivo.
Author response image 1
Tables
Author response table 1
| Construct | Wild-type | L120A | Y157Q | H27G | Q99A |
|---|---|---|---|---|---|
| Number of peaks | 127 | 109 | 104 | 82 (after 1 hour of deuterium exchange) | 113 |
Additional files
Download links
A two-part list of links to download the article, or parts of the article, in various formats.
Downloads (link to download the article as PDF)
Open citations (links to open the citations from this article in various online reference manager services)
Cite this article (links to download the citations from this article in formats compatible with various reference manager tools)
A saturation-mutagenesis analysis of the interplay between stability and activation in Ras
eLife 11:e76595.
https://doi.org/10.7554/eLife.76595


