Structural and thermodynamic analyses of the β-to-α transformation in RfaH reveal principles of fold-switching proteins
- Biochemistry IV – Biophysical Chemistry, University of Bayreuth, Germany
- Birkbeck, University of London, Malet Street, Bloomsbury, United Kingdom
Figures
Figure 1 with 2 supplements

Fold-switching within the NusG/RfaH family.
(A) Cartoon representation of EcRfaH in the closed, autoinhibited state (left; protein data bank identifier (PDB-ID): 5OND) and in the open, active conformation (right; PDB-ID all-β EcRfaH-KOW: 2LCL) as well as of EcNusG-KOW (boxed; PDB-ID: 2JVV). Unstructured regions are shown as dashed lines, termini are labeled. (B) Secondary structures of EcRfaH-KOW in the all-α and the all-β state. Tubes indicate α-helical elements, arrows represent β-strands. The amino acid sequence is shown above. (C) Secondary chemical shift of VcRfaH. The plots show the difference between the observed chemical shift and the corresponding predicted random coil value of 13Cα (top) and 13CO (bottom). Positive values indicate helical, negative values elongated (β-sheet) structures, and values close to zero are observed for random coil-like structures. The secondary structure elements inferred from the analysis are shown above the graphs (code for secondary structure elements as in (B)). The position of the identified disulfide bridge (see also Figure 1—figure supplement 1A, B) is indicated. (D) Left: Ribbon representation of the 20 lowest energy structures of VcRfaH-KOW (PDB-ID: 6TF4). Right: Cartoon representation of the lowest energy structure. β-Strands and termini are labeled.
Figure 1—figure supplement 1

Disulfide bridge formation in VcRfaH.
(A) Strips of the HNCACB experiment corresponding to VcRfaH residues C34 and C102, respectively. Signals arising from the cystein’s Cα and Cβ carbons (indicative of a cysteine in a disulfide bridge) are labeled. (B) [1H, 15N]-HSQC spectra of [2H, 13C, 15N]-VcRfaH in the absence (black) or presence (red) of 20 mM DTT. Signals of the two disulfide bridge forming residues, C34 and C102, and their sequential neighbors are labeled. (C) Refolding of VcRfaH under reducing conditions. [1H, 15N]-heteronuclear single quantum coherence (HSQC) spectra of 150 µM 15N-VcRfaH (black), 39 µM 15N-VcRfaH after incubation in the presence of 8 M urea for 24 hr (red), and 40 µM 15N-VcRfaH upon refolding (cyan).
Figure 1—figure supplement 2
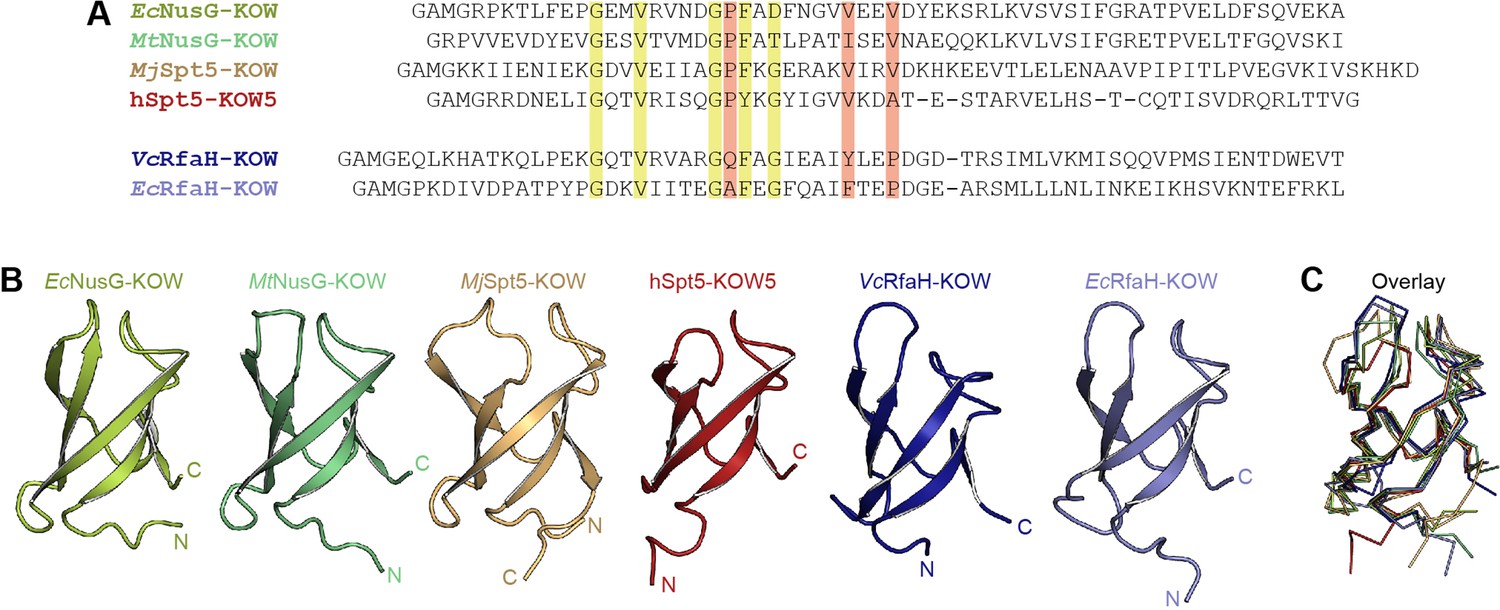
Structure comparison of Kyrpides, Ouzounis, Woese (KOW) domains used in this study.
(A) Structure-based sequence alignment of the KOW constructs used in this study. Highly conserved residues are highlighted in green, residues that differ among NusG-KOW/Spt5-KOW and RfaH-KOW domains are colored red. (B) Structures of the six KOW domains shown in cartoon representation. N- and C-termini are labeled. PDB-IDs: 2JVV (EcNusG-KOW), 2MI6 (MtNusG-KOW), 4ZN3 (MjSpt5-KOW), 2E70 (hSpt5-KOW5), 2LCL (EcRfaH-KOW), 6TF4 (VcRfaH-KOW). (C) Structural alignment of the six KOW domains. The proteins are shown as ribbons. Orientation and colors as in (B).
Figure 2 with 1 supplement
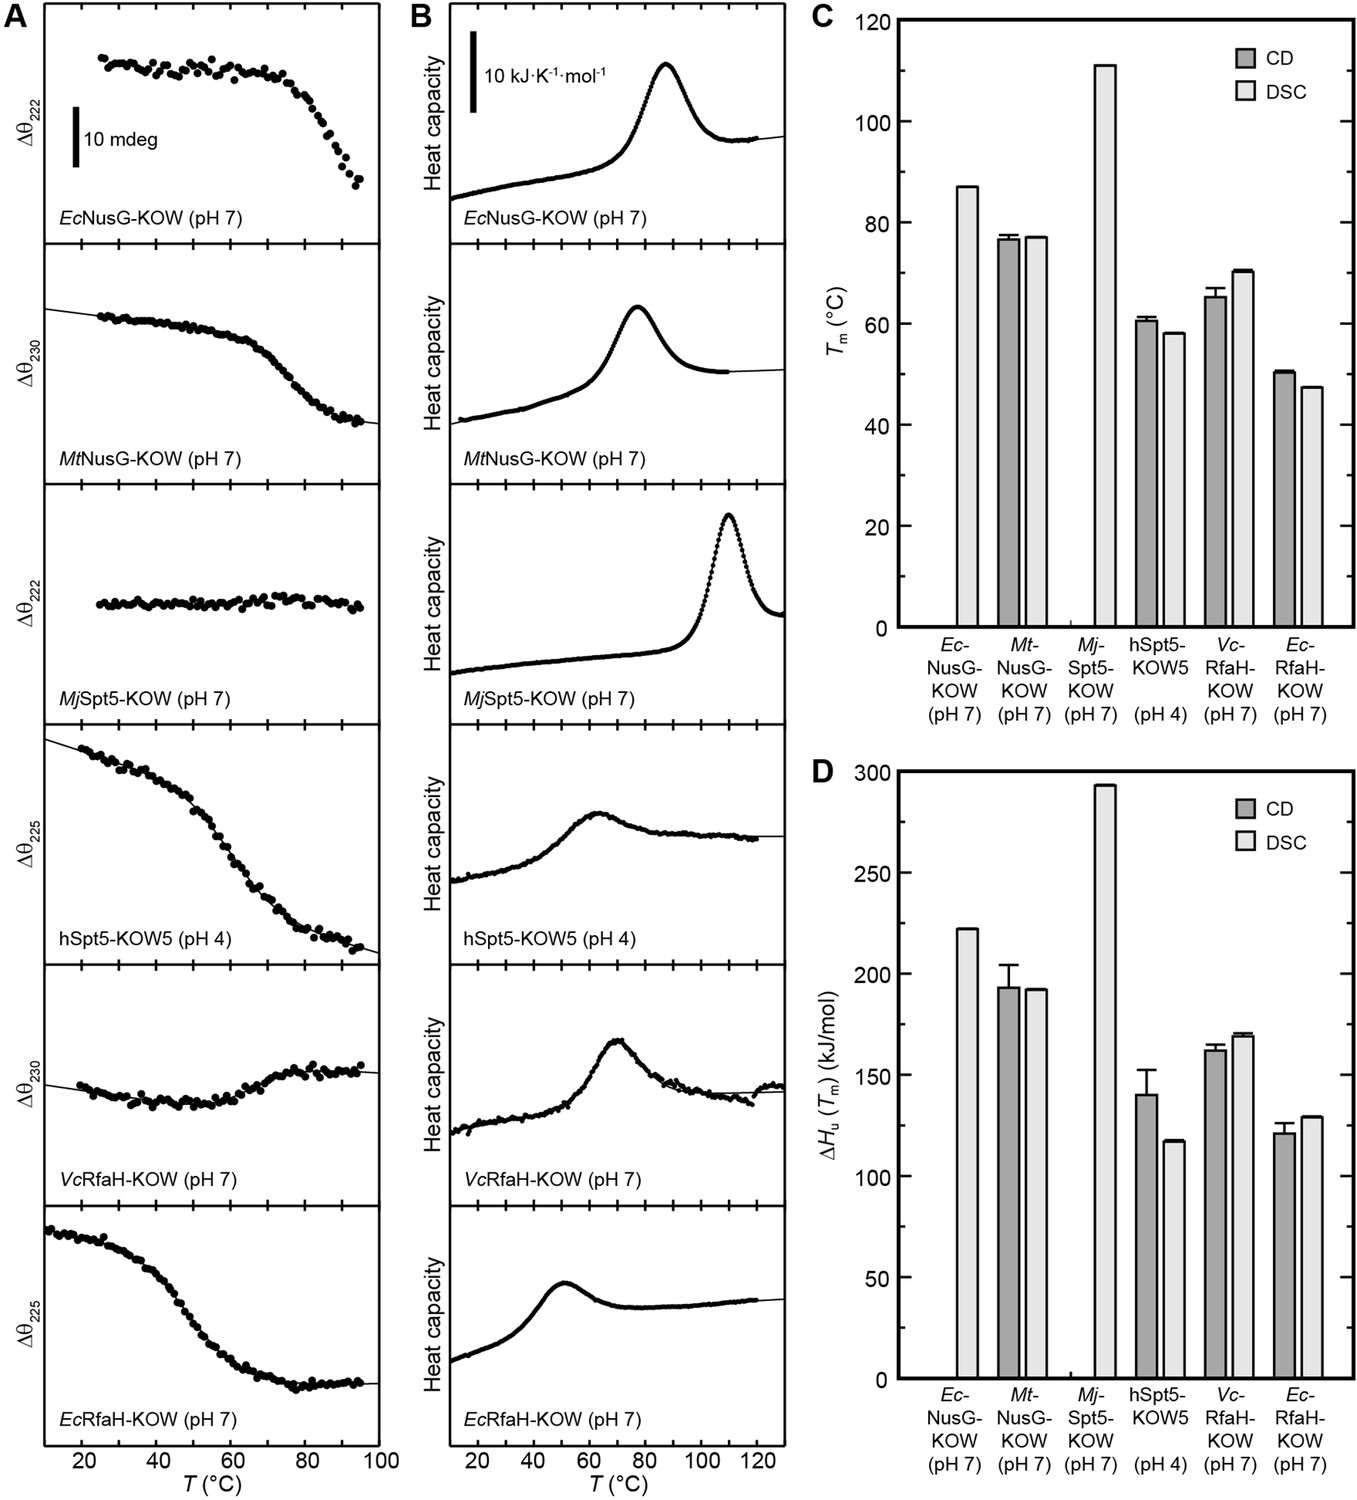
Thermal unfolding experiments of the six Kyrpides, Ouzounis, Woese (KOW) domains.
(A) Thermal unfolding monitored via change in the circular dichroism (CD) signal with a temperature gradient from 20°C to 95°C. The line corresponds to the best fit to a two-state unfolding model. Measurements were carried out with proteins in 10 mM K-acetate (pH 4.0) buffer for hSpt5-KOW5 and in 10 mM K-phosphate (pH 7.0) buffer for all other domains. The wavelength for monitoring the transition was chosen based on the largest difference between the spectra of the folded and unfolded protein (for details, see Materials and methods). Data for EcNusG-KOW was not fitted due to the lack of the baseline of the unfolded state. MjSpt5-KOW could not be denatured at all. (B) Thermograms obtained from differential scanning calorimetry (DSC) measurements. All profiles are normalized to one molar of protein. The lines correspond to best fits to a two-state unfolding model that includes a T-dependent ΔCp change. Buffers are as in (A). (C,D) Tm (C) and ΔHu(Tm) (D) values derived from thermal unfolding experiments monitored by CD and DSC. Error bars result from data fitting.
-
Figure 2—source data 1
Data for thermal denaturation experiments for all Kyrpides, Ouzounis, Woese (KOW) domains.
- https://cdn.elifesciences.org/articles/76630/elife-76630-fig2-data1-v2.xlsx
Figure 2—figure supplement 1
Reversibility of thermal unfolding.
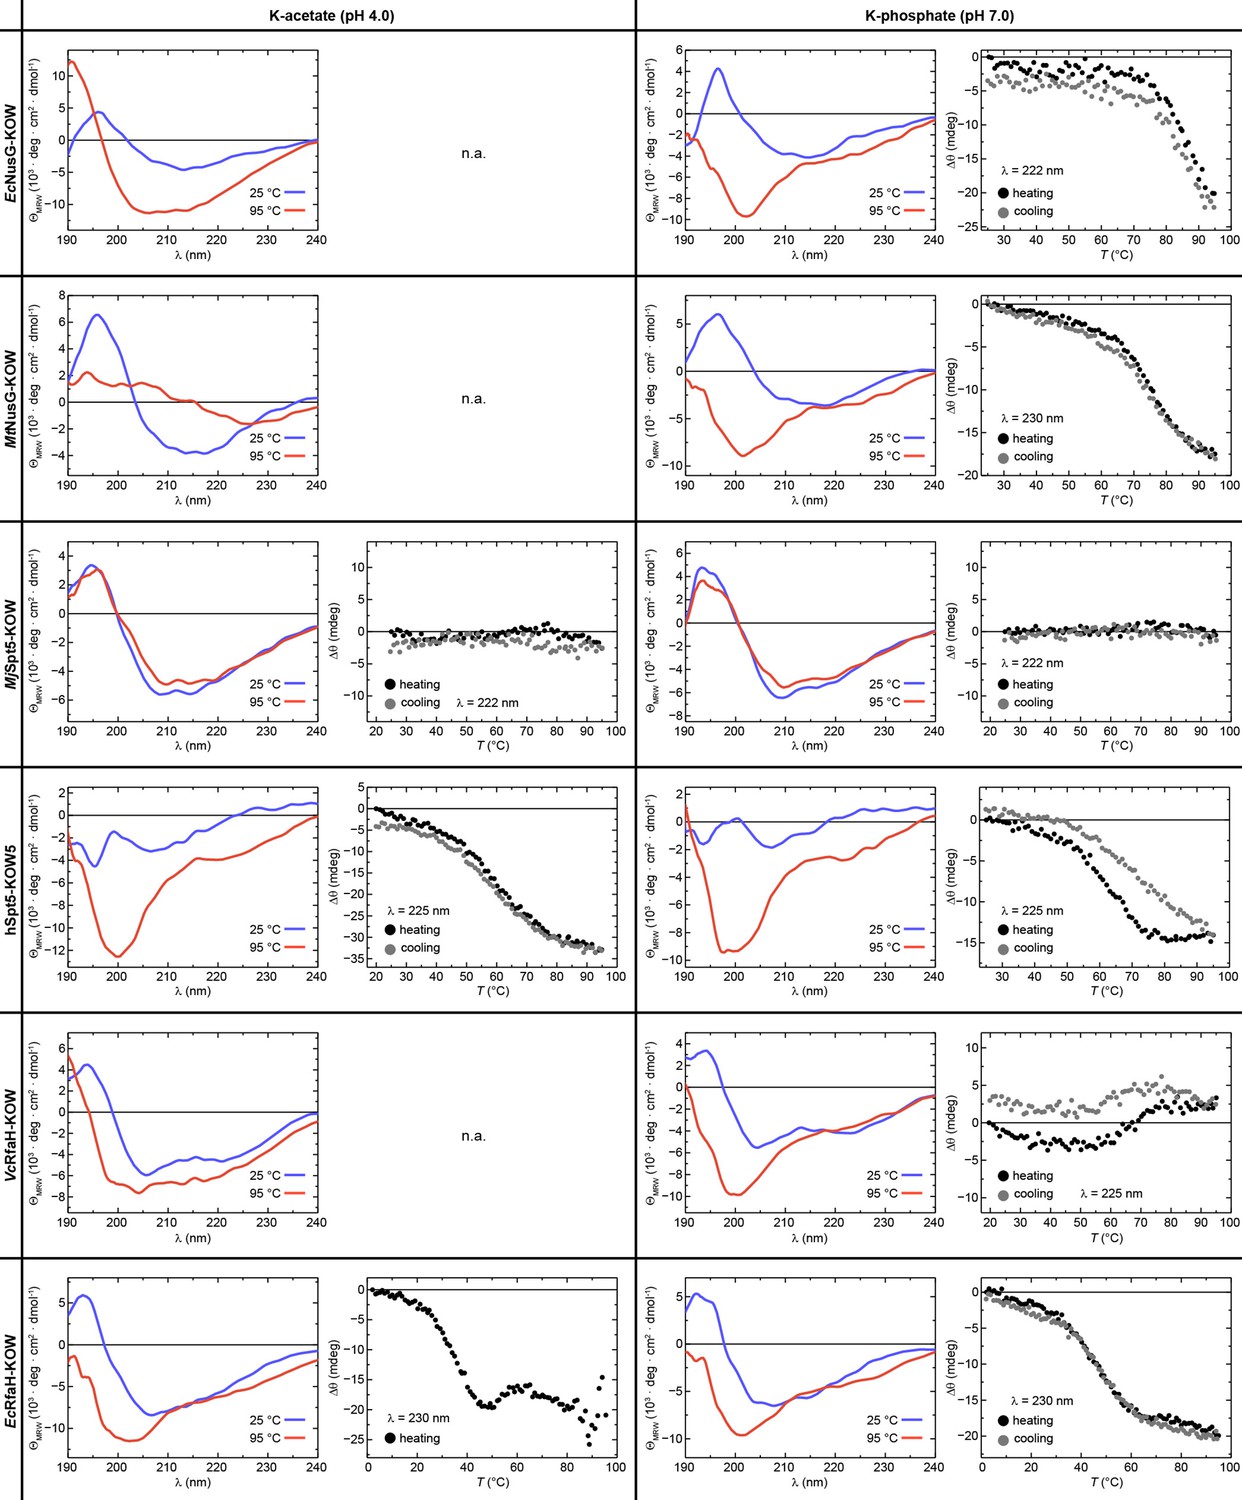
The graphs show circular dichroism (CD) spectra of the six Kyrpides, Ouzounis, Woese (KOW) domains at 25°C (blue) and at 95°C (red) together with the change in ellipticity, Δθ, during heating from 25°C to 95°C (filled black circles) and subsequent cooling to the initial temperature (filled gray circles), each at pH 4.0 (left) and pH 7.0 (right). When aggregation was already apparent from the CD spectra acquired at 95°C (i.e. the shape of the spectrum did not correspond to that of an unfolded protein), no thermal unfolding/refolding curves were recorded (n.a.). Due to its hyperthermophilic source organism, MjSpt5-KOW could not be denatured at either pH. The wavelength for monitoring the transition was chosen based on the largest difference between the spectra of the folded and unfolded state (for details see Materials and methods).
Figure 3 with 2 supplements

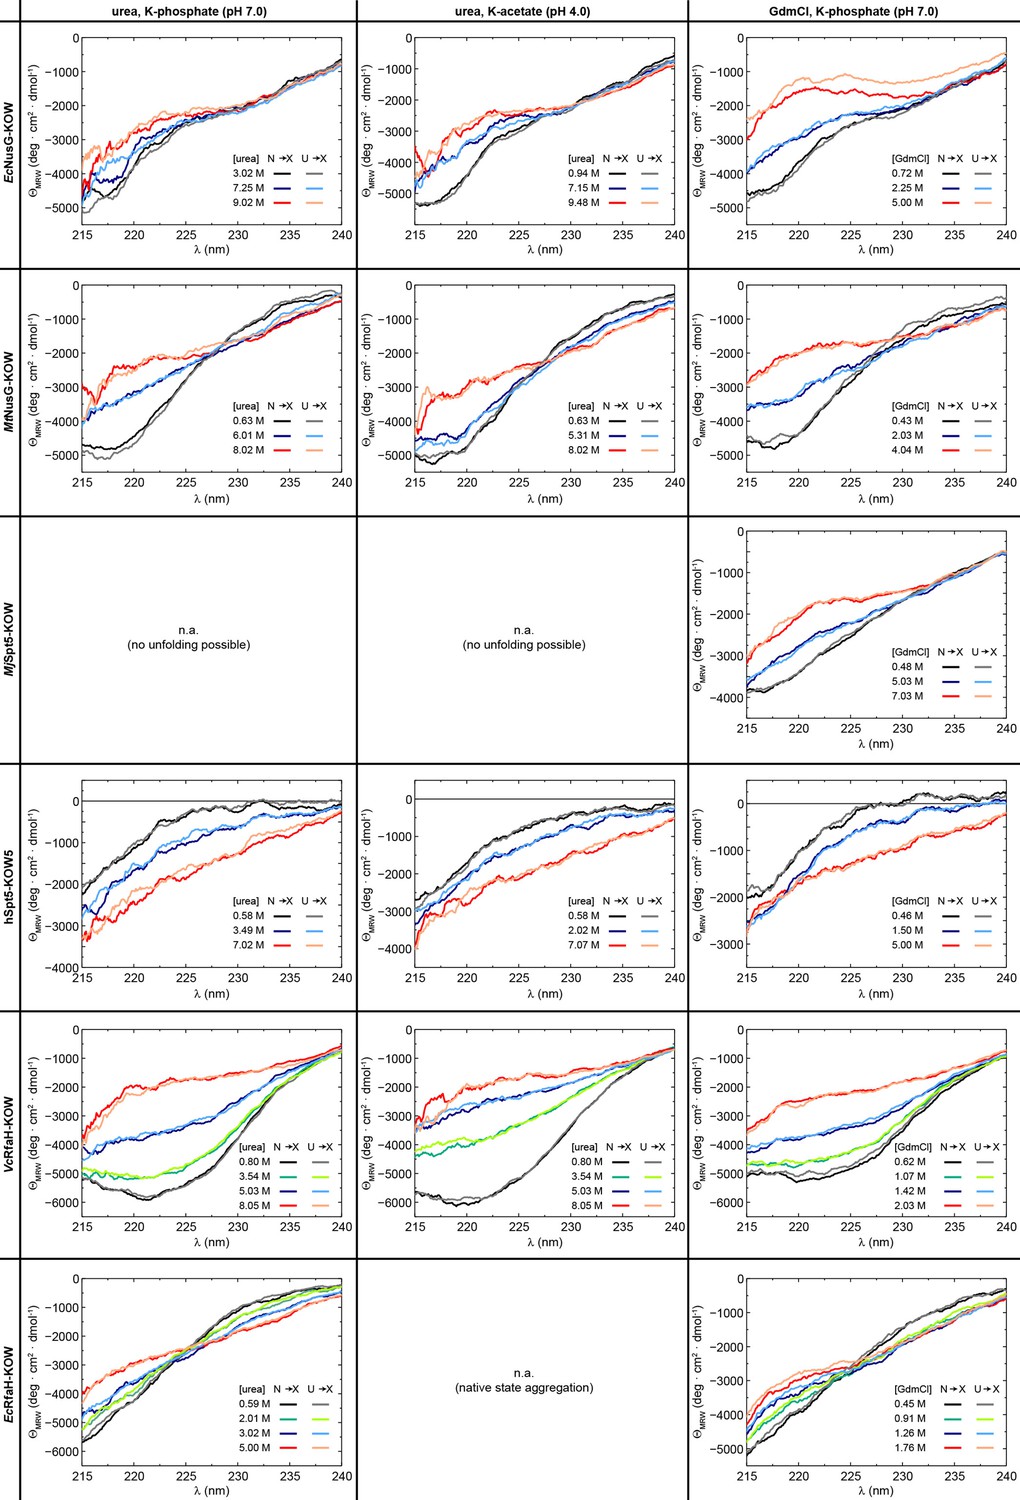
Circular dichroism (CD) spectroscopy-based chemical equilibrium unfolding of the six Kyrpides, Ouzounis, Woese (KOW) domains.
(A–F) Change in ΘMRW of the indicated protein domain upon over-night incubation with increasing concentrations of (left) urea in 10 mM K-acetate (pH 4.0; red circles) or 10 mM K-phosphate (pH 7.0; dark blue circles), respectively, and (right) GdmCl in 10 mM K-phosphate (pH 7.0; light blue circles). The detection wavelength is indicated and chosen based on the maximum difference between the spectra of the folded and unfolded state (for details see Materials and methods). The lines correspond to the best fits to a two-state unfolding model, except for EcRfaH-KOW, which exhibits a three-state unfolding behavior. (G, H) Comparison of [denat]1/2 values (G) and ΔGu(H2O) values (H) of the KOW domains derived from the chemical denaturation experiments shown in (A–E). Error bars result from data fitting.
-
Figure 3—source data 1
Data for chemical denaturation experiments for all Kyrpides, Ouzounis, Woese (KOW) domains.
- https://cdn.elifesciences.org/articles/76630/elife-76630-fig3-data1-v2.xlsx
Figure 3—figure supplement 1

Chemical unfolding of VcRfaH-KOW monitored by change in Trp fluorescence.
(A), (B) The curves show the normalized Trp fluorescence change at 380 nm of VcRfaH-KOW, obtained after over-night incubation of the protein in the presence of increasing concentrations of (A) urea at pH 4.0 (filled blue circles) or pH 7.0 (filled red circles) or (B) GdmCl at pH 7.0 (filled light blue circles). The lines represent fits to a two-state unfolding model.
Figure 3—figure supplement 2
Reversibility of chemical denaturation.
Circular dichroism (CD) spectra of the six protein domains acquired at the indicated denaturant concentration and buffer. In order to check the reversibility, two spectra at identical denaturant concentration were obtained by adding the native protein from a solution containing no denaturant to the desired denaturant concentration (N → X), or by adding the unfolded protein from a solution containing 10 M urea/8 M GdmCl to a solution containing the desired denaturant concentration (U → X). The color code is indicated.
Figure 4
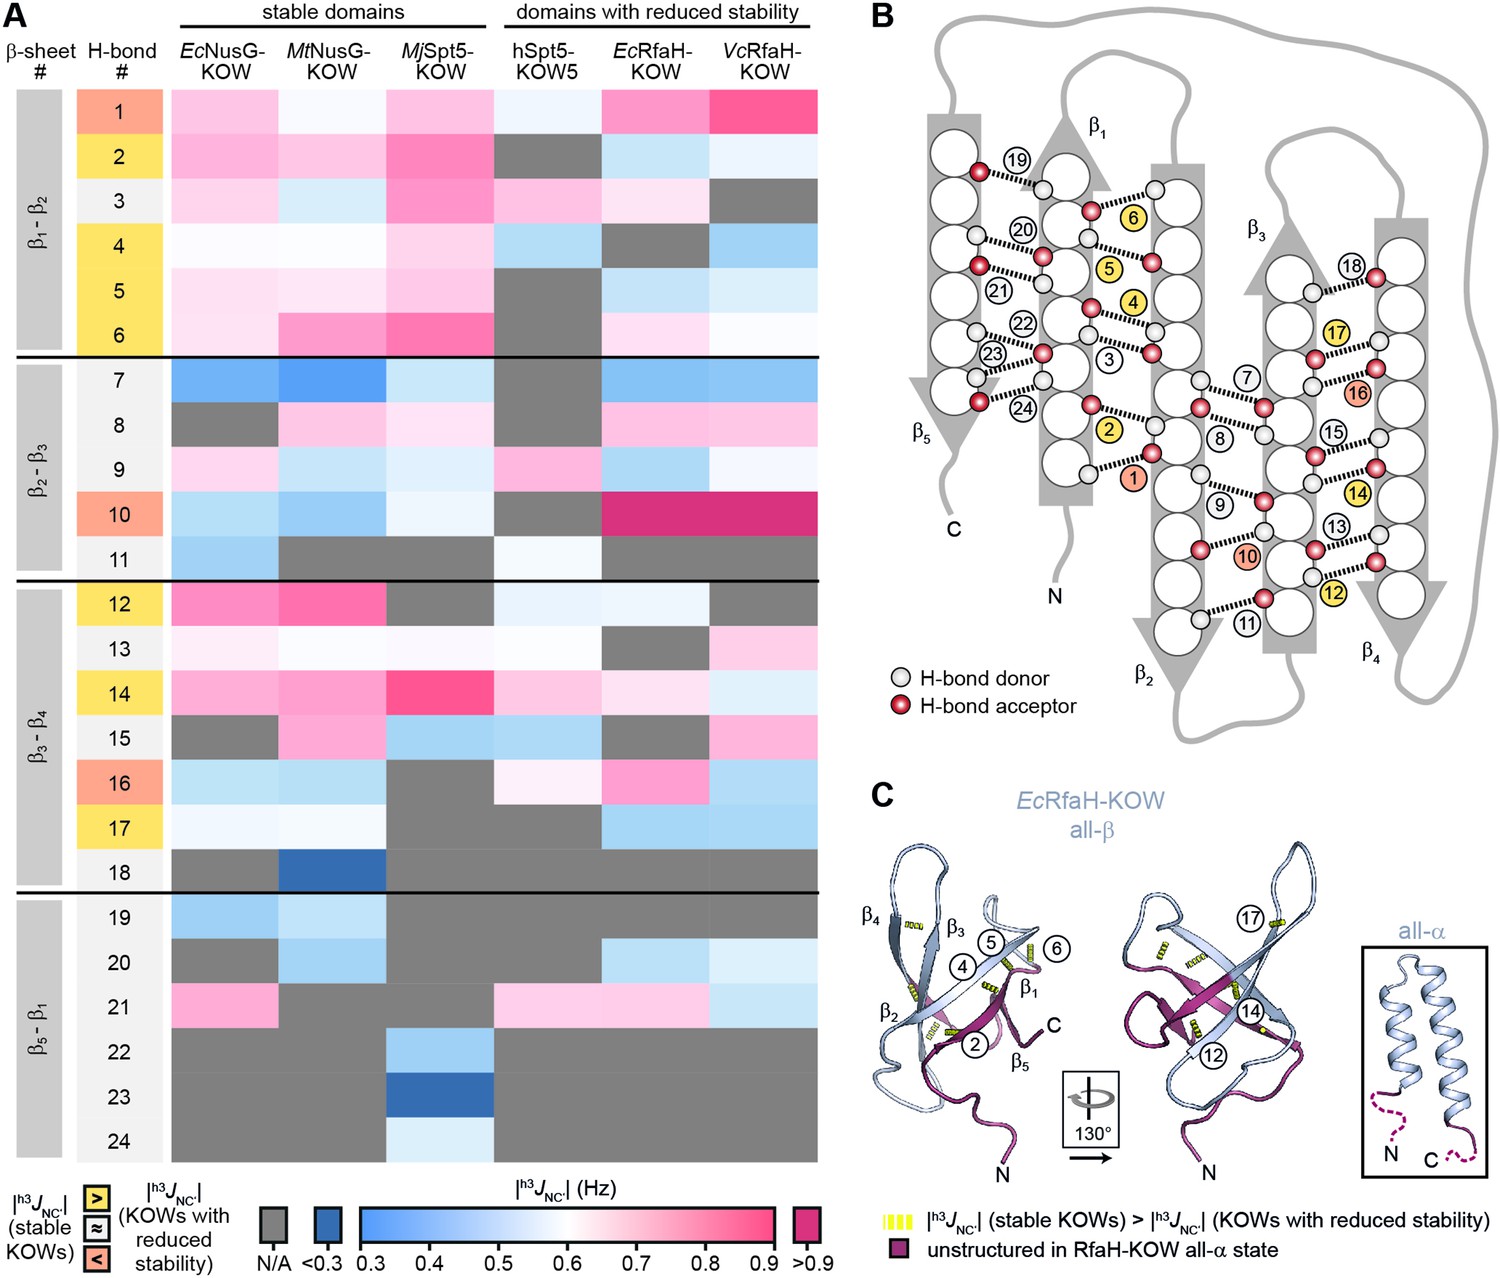
H-bond pattern and stability in the six Kyrpides, Ouzounis, Woese (KOW) domains.
(A) Heat map of the magnitude of the h3JNC’ coupling constants of the H-bonds determined by long-range HNCO nuclear magnetic resonance (NMR) experiments. H-bonds that are located at equivalent positions are grouped and ordered according to their location in the respective β-sheet (position within the β-barrel as indicated in (B)), and colored according to their |h3JNC’| value as indicated at the bottom. H-bond numbers highlighted in yellow: H-bonds that have lower |h3JNC’| values for at least two of the domains with reduced thermodynamic stability compared to the stable domains; H-bond numbers highlighted in orange: H-bonds that have higher |h3JNC’| values for at least two of the domains with reduced thermodynamic stability compared to the stable domains. (B) Scheme of the positions of the H-bonds (dashed lines) within the β-barrel. Amino acids are depicted as spheres. White and red circles represent H-bond donors and acceptors, respectively. H-bonds are color-coded as in (A). (C) Cartoon representation of all-β EcRfaH-KOW (PDB-ID: 2LCL, gray). Regions that are unstructured in the all-α conformation are colored in dark red. H-bonds that have lower |h3JNC’| values for at least two of the domains with reduced thermodynamic stability compared to the stable domains are shown as yellow dashed tubes and labeled. The relative orientation of the structures is indicated. The inset shows the all-α EcRfaH-KOW (PDB-ID: 5OND; gray; unstructured regions at the termini are colored in dark red and correspond to the dark red regions in the all-β EcRfaH-KOW).
Figure 5 with 1 supplement
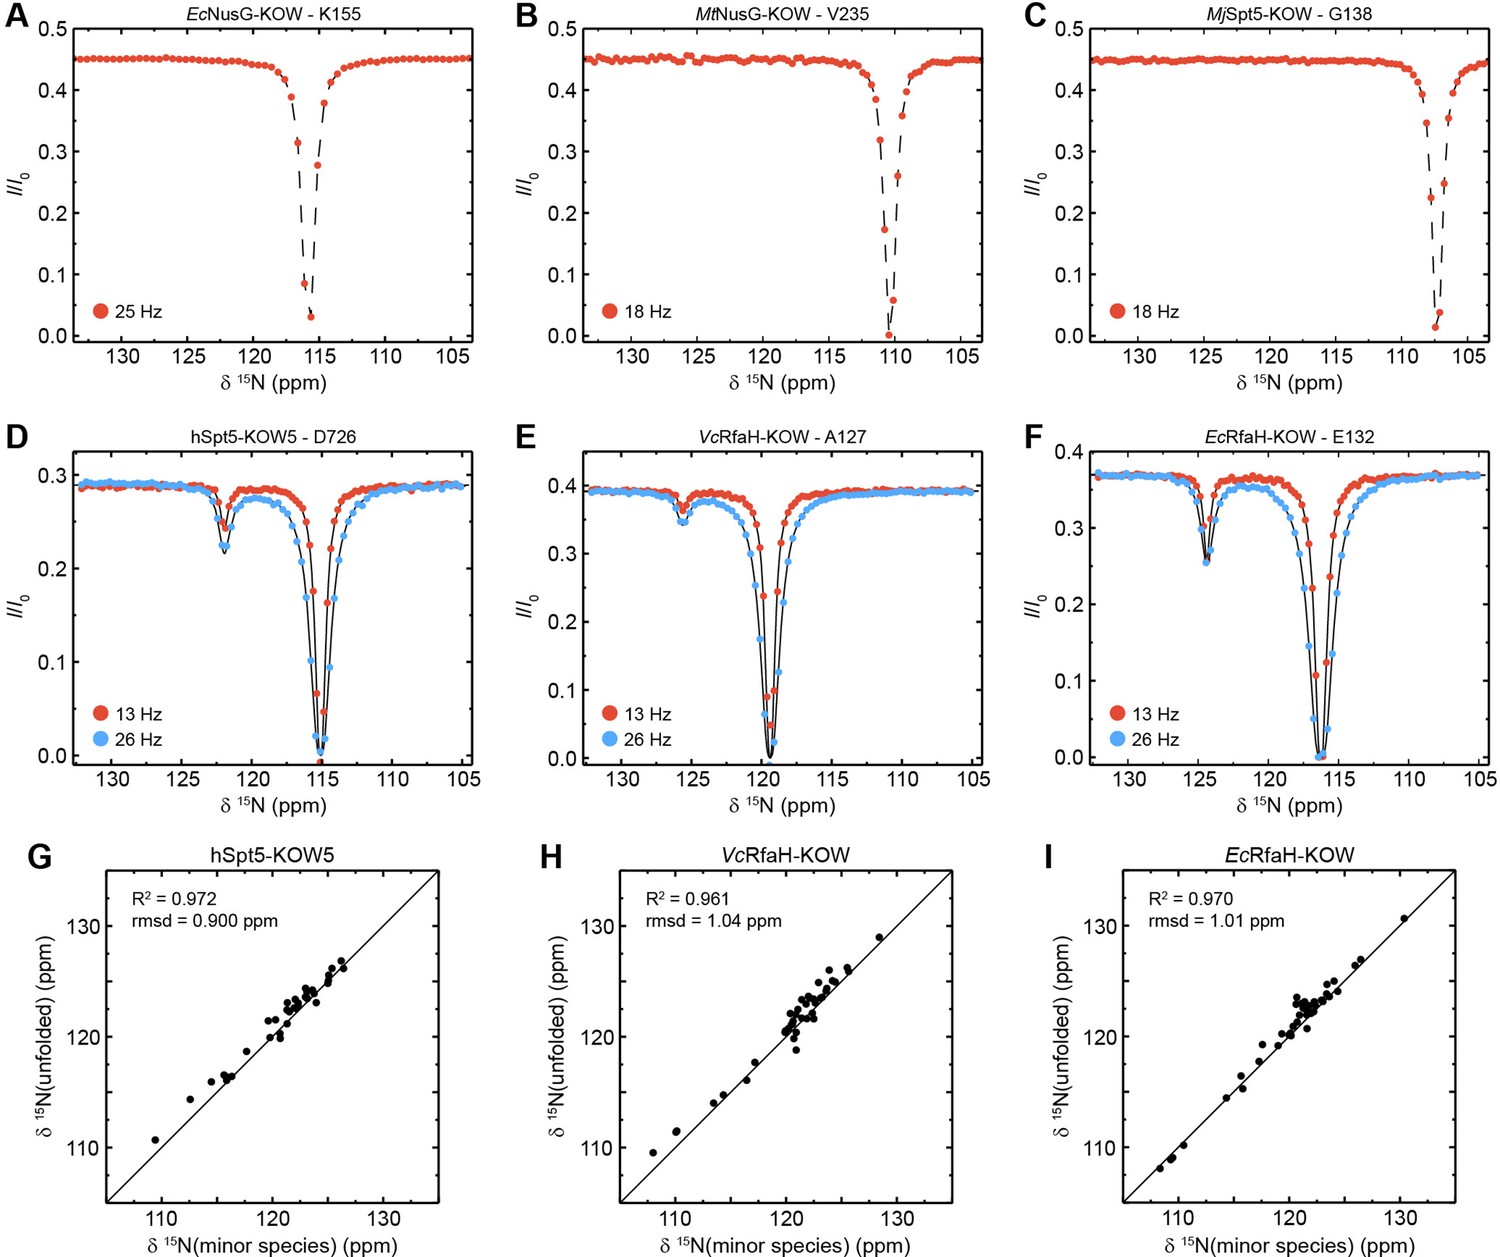
Chemical exchange saturation transfer (CEST) analysis of the Kyrpides, Ouzounis, Woese (KOW) domains.
(A–F) Representative backbone 15N-CEST profiles of the indicated KOW domain measured with one (A–C) or two (D–F) B1 field strengths and an exchange time of 0.5 s. B0 field for (A–C): 21.15T; B0 field for (A–C): 16.45T. The lines in (D–F) are fits to a two-state exchange model. (G–I) Correlation plots showing the high similarity of the chemical shift of the minor CEST species and that of the corresponding random coil value. The latter were obtained by backbone assignment in 8 M urea (EcRfaH-KOW) or are theoretical values (VcRfaH-KOW, hSpt5-KOW5). The squared correlation coefficient and the root mean square deviation (rmsd) between the two corresponding sets of chemical shifts are listed.
-
Figure 5—source data 1
Chemical exchange saturation transfer (CEST) fits for EcRfaH-KOW, VcRfaH-KOW, and hSpt5-KOW5.
- https://cdn.elifesciences.org/articles/76630/elife-76630-fig5-data1-v2.xlsx
-
Figure 5—source data 2
Experimentally determined chemical shift values of urea-denatured EcRfaH-KOW and predicted random coil chemical shift values of VcRfaH-KOW and hSpt5-KOW5.
- https://cdn.elifesciences.org/articles/76630/elife-76630-fig5-data2-v2.xlsx
Figure 5—figure supplement 1

Extended chemical exchange saturation transfer (CEST) analysis of hSpt5-KOW5, VcRfaH-KOW, or EcRfaH-KOW.
Plots of kex versus the population of the minor species (pB) obtained from individual fits (black symbols) or a global fit (red symbol) of the CEST profiles of (A) hSpt5-KOW5, (B) VcRfaH-KOW, and (C) EcRfaH-KOW. Error bars represent the standard deviation of the fits.
Figure 6 with 6 supplements
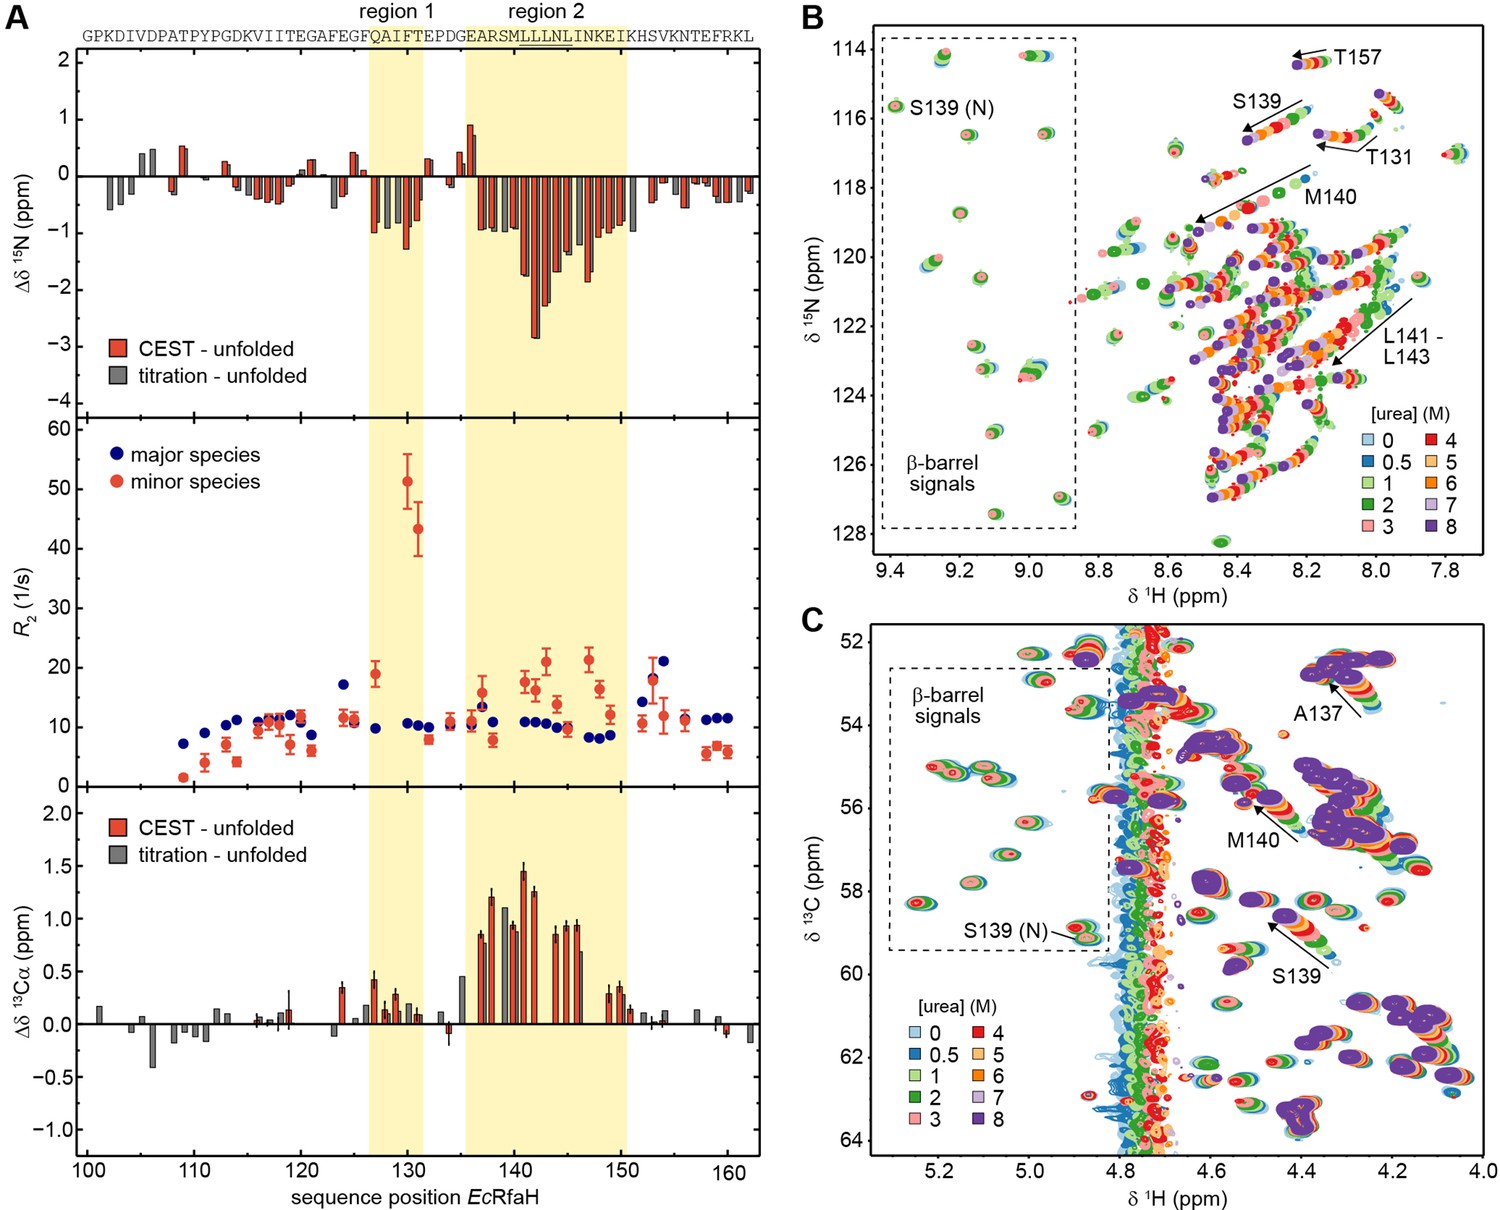
The minor species of EcRfaH-KOW contains residual structure.
(A) Deviations of the minor species of EcRfaH-KOW from the urea-unfolded state. Top row: Sequence-dependent difference between the 15N backbone amide chemical shifts of the minor species and of the values obtained by assignment in 8 M urea. The values for the minor species were either obtained from the chemical exchange saturation transfer (CEST) experiment (red bars, individual fits; ‘CEST – unfolded’) or by tracing back the chemical shift changes from 8 to 0 M urea in the [1H, 15N]-heteronuclear single quantum coherence (HSQC)-based urea titration (gray bars; ‘titration – unfolded’; see panel (B)). Middle row: R2 values of the major species (EcRfaH-KOW β-barrel; blue) and minor species (red), obtained from fitting the CEST profiles (global fit). Regions 1 and 2 of the minor species have R2 values significantly higher than those of their corresponding β-barrel conformation indicating additional exchange processes, whereas N- and C-terminal regions have R2 values lower than those of their corresponding β-barrel conformation, which is typical for random coil structures. Bottom row: Sequence-dependent difference between the 13Cα chemical shifts of the minor species and of the values obtained by assignment in 8 M urea. The values for the minor species were either obtained from the CEST experiment (red bars, individual fits; ‘CEST – unfolded’) or by tracing back the chemical shift changes from 8 to 0 M urea in the [1H, 13C]-ctHSQC-based urea titration (gray bars; ‘titration – unfolded’; see panel (C)). The sequence of EcRfaH-KOW is given above the diagram, the Leu-rich motif is underlined. Regions 1 and 2 are highlighted. Error bars result from data fitting. (B, C) Nuclear magnetic resonance (NMR)-based chemical equilibrium unfolding experiments of EcRfaH-KOW using urea as denaturant. The plots show an overlay of (B) [1H, 15N]-HSQC, and (C) [1H, 13C]-ctHSQC spectra of [15N, 13C]-EcRfaH-KOW, acquired in the presence of varying urea concentrations. The system was buffered by 20 mM Na-phosphate (pH 6.5), 100 mM NaCl, 1 mM ethylenediaminetetraacetic acid (EDTA), 10% (v/v) D2O. Boxed regions mark signals corresponding to the β-barrel state with the signal of S139 being labeled with ‘N’ (‘native’). Arrows and further labels indicate signals of residues that exhibit strong chemical shift changes in the indirect dimension (15N in (B), 13C in (C)). The spectra are colored as indicated.
-
Figure 6—source data 1
8-Anilino-1-naphthalenesulfonic acid (ANS) binding by EcRfaH-KOW during urea-based denaturation.
- https://cdn.elifesciences.org/articles/76630/elife-76630-fig6-data1-v2.xlsx
Figure 6—figure supplement 1
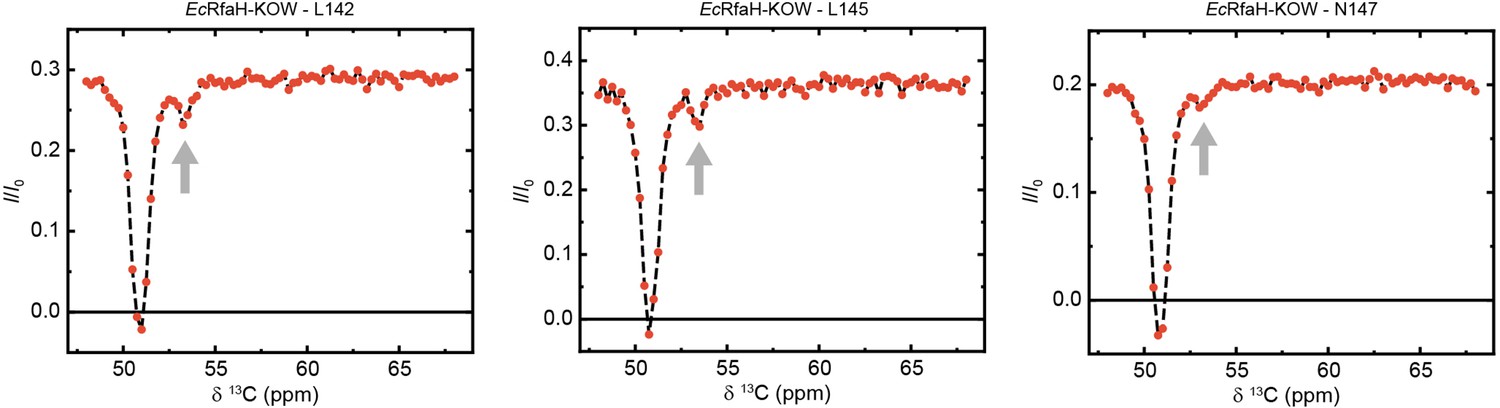
Exemplary traces of chemical exchange saturation transfer (CEST) experiments recorded on 13Cα carbons of 13C-EcRfaH-KOW.
The arrows indicate the positions of the minor species dips.
Figure 6—figure supplement 2
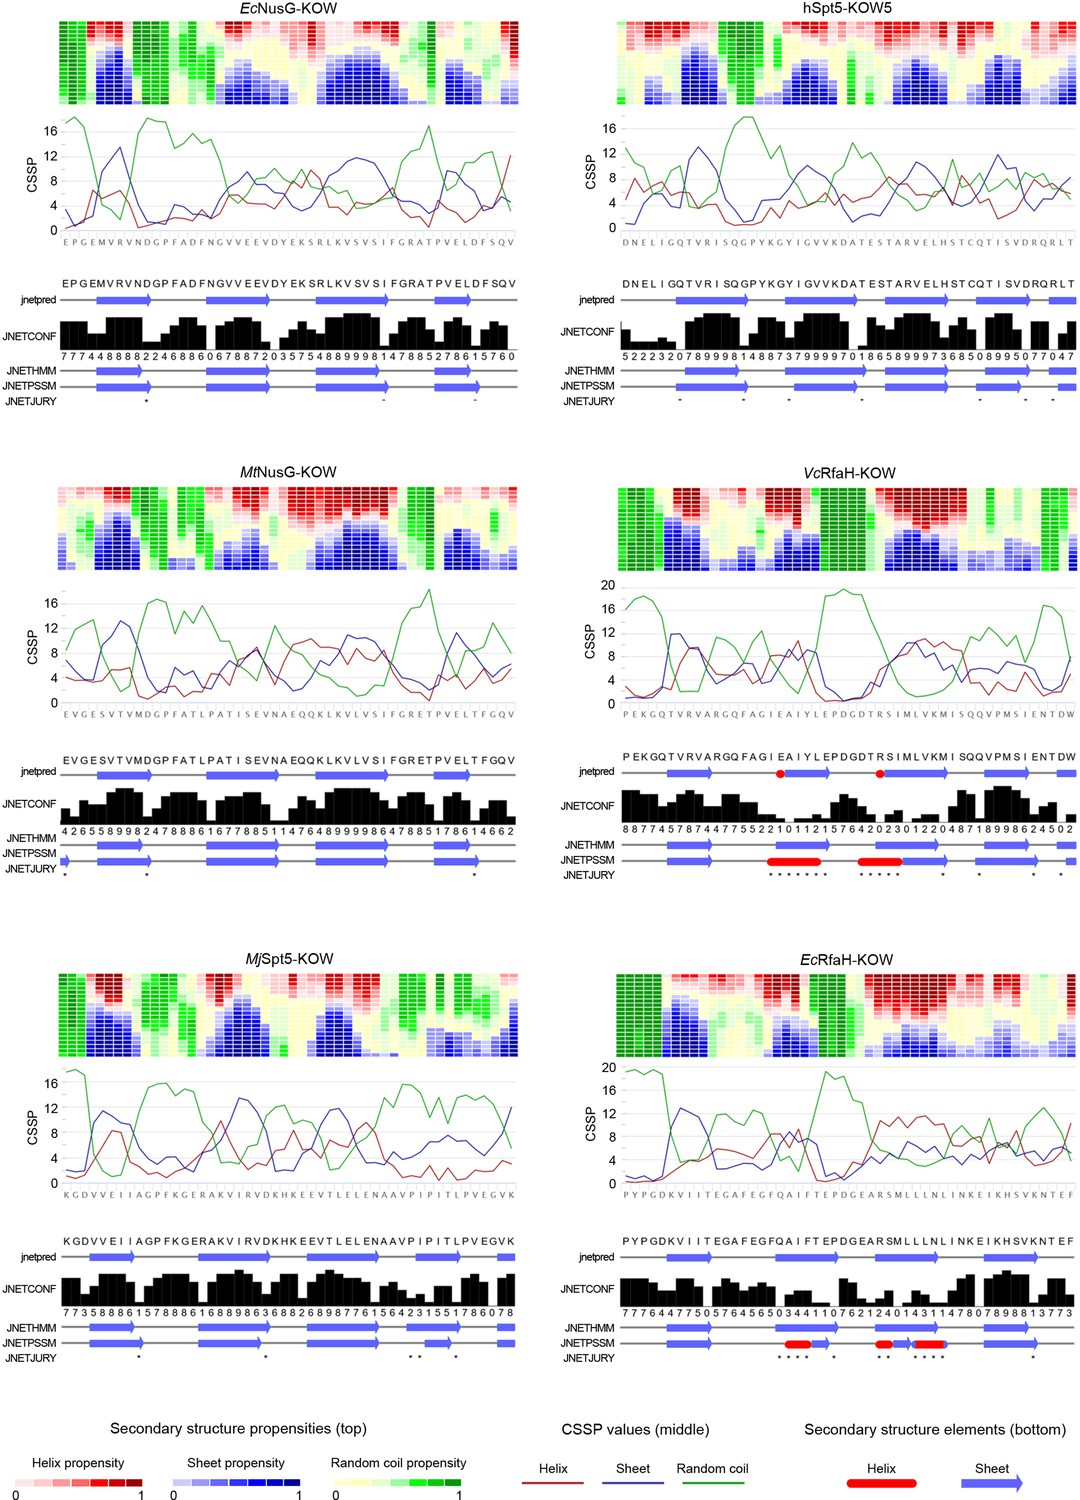
Secondary structure predictions for the six Kyrpides, Ouzounis, Woese (KOW) domains used in this study.
For each domain two predictions were carried out: (i) By Net-CSSP (Kim et al., 2009), top. The contact-dependent secondary structure propensity (CSSP) of each domain is plotted against die amino acid sequence (red: helices; blue: beta structures; green: random coil). The heat map above each graph displays the propensity of each amino acid to adopt helical (red), beta (blue), or random coil (green) structures using a gradient from dark (high propensity) to light (low propensity) colors. (ii) By Jpred 4 (Drozdetskiy et al., 2015), bottom. The predicted secondary structure elements are shown below the amino acid sequence (red: helices; blue: beta structures). JNetPRED: consensus prediction; JNetCONF: confidence estimate for the prediction (high values correspond to high confidence); JNetHMM: profile prediction based on hidden Markov model (HMM), JNetPSSM: profile prediction based on position-specific scoring matrix (PSSM); JNetJURY: an asterisk indicates significantly different primary predictions.
Figure 6—figure supplement 3
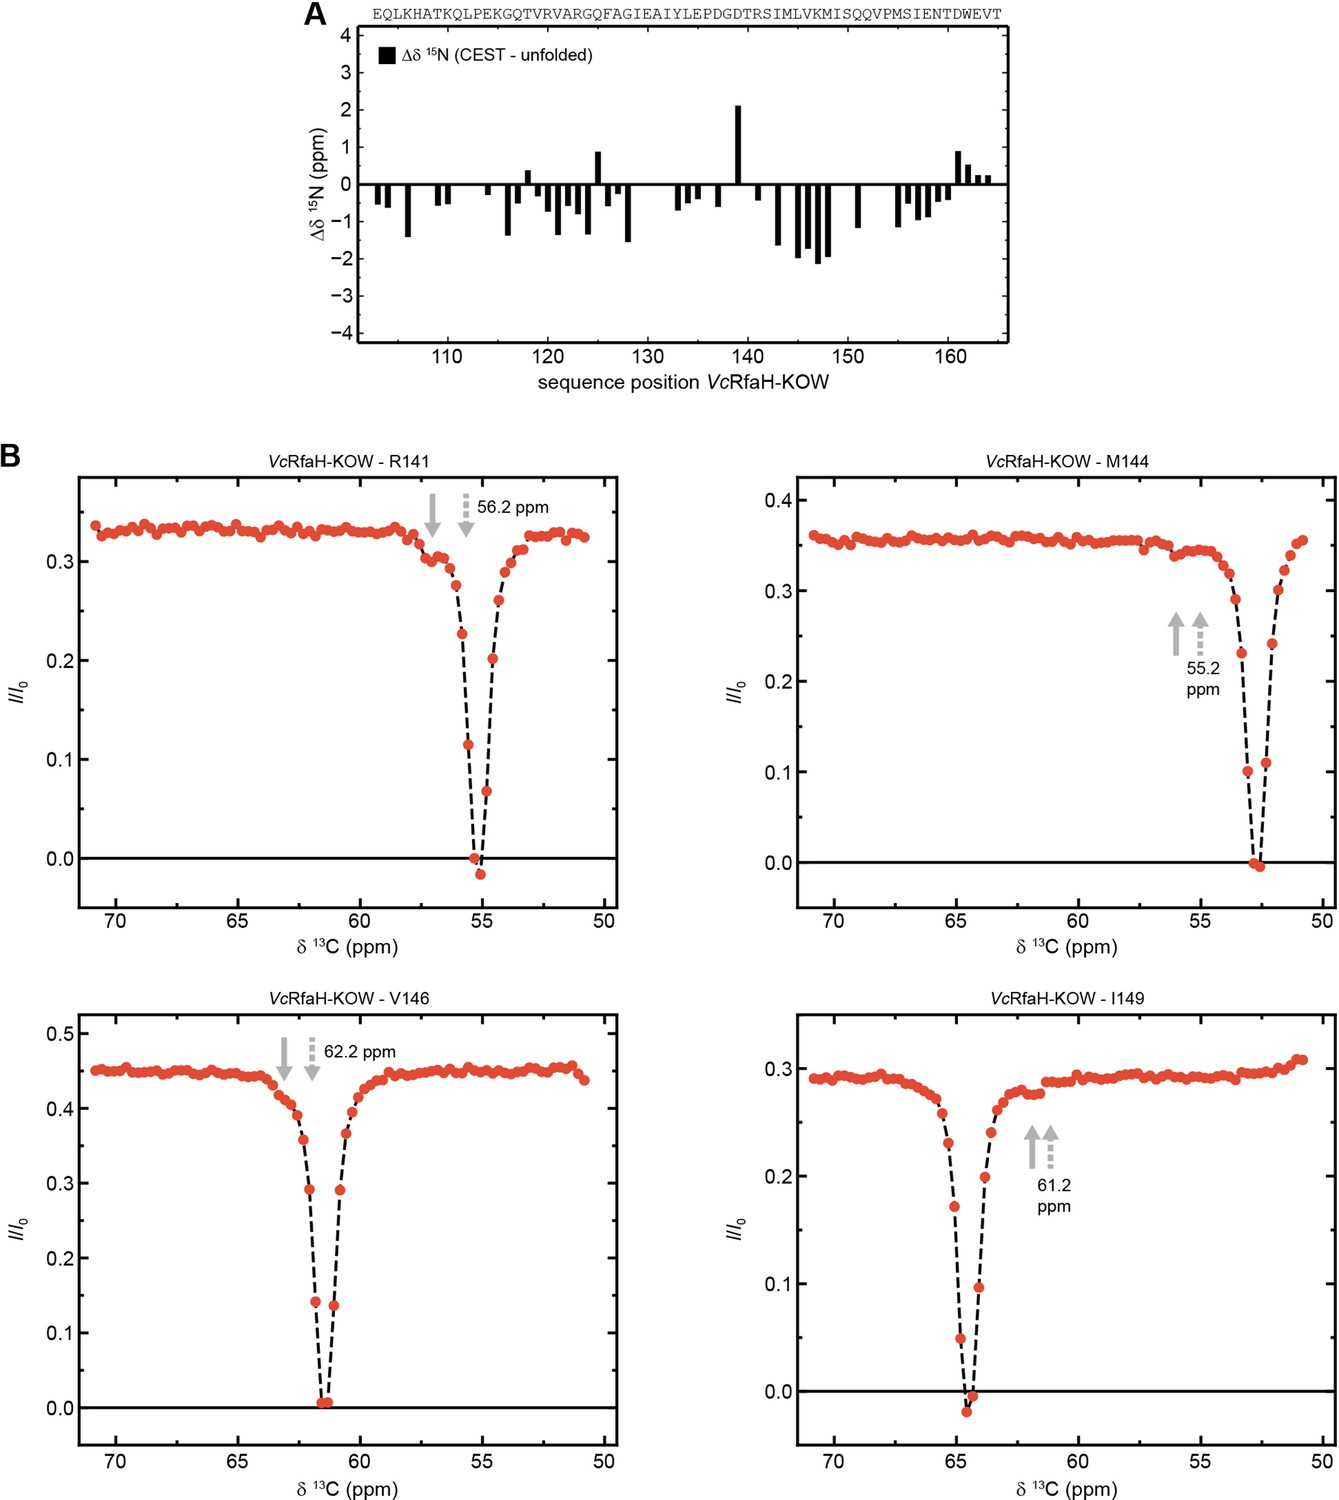
The minor species of VcRfaH-KOW contains residual structure.
(A) Sequence-dependent difference between the 15N backbone amide chemical shifts of the chemical exchange saturation transfer (CEST) minor species of VcRfaH-KOW and the corresponding theoretical random coil value. The sequence of the two protein construct is given above the diagrams. (B) Exemplary traces of CEST experiments recorded on 13Cα carbons of 13C,15N-VcRfaH-KOW. Solid arrows mark the positions of the minor species dips, dashed arrows indicate the predicted random coil values.
Figure 6—figure supplement 4
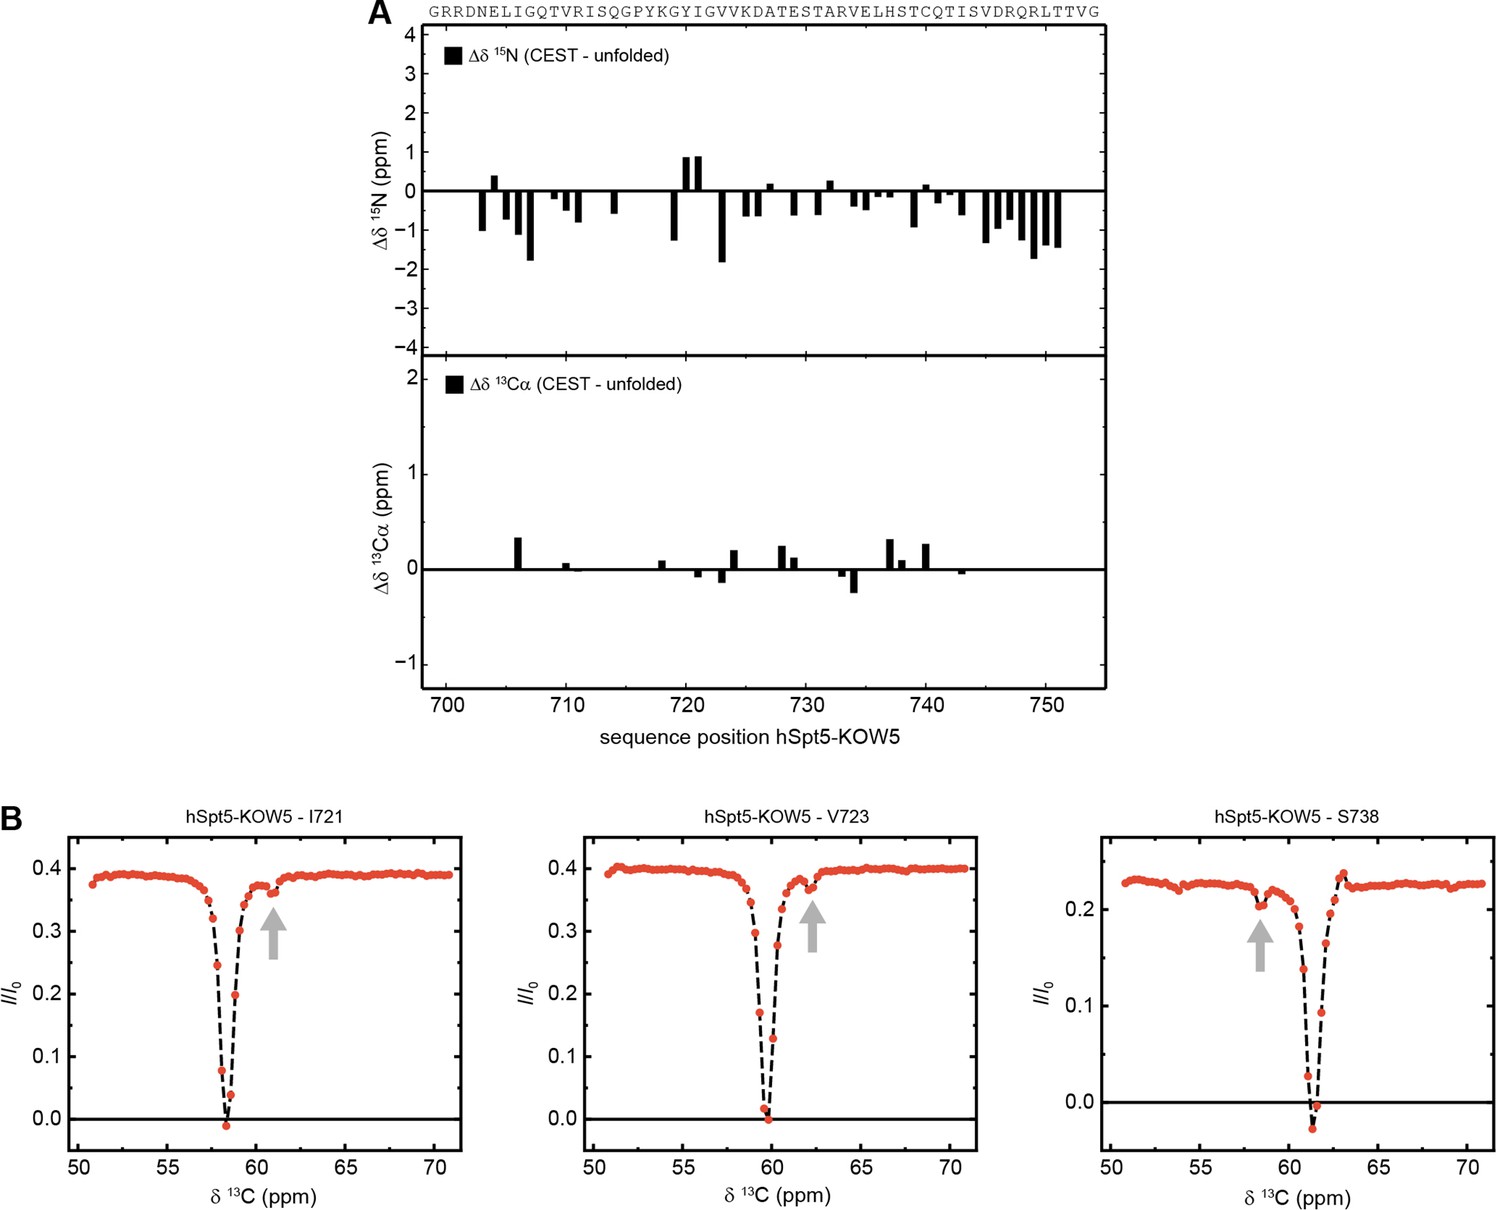
The minor species of hSpt5-KOW5 is completely unfolded.
(A) Sequence-dependent difference between the 15N backbone amide (top) and 13Cα carbons (bottom) chemical shifts of the chemical exchange saturation transfer (CEST) minor species of hSpt5-KOW5 and the corresponding theoretical random coil value. The sequence of the two protein construct is given above the diagrams. (B) Exemplary traces of CEST experiments recorded on 13Cα carbons of 13C,15N-hSpt5-KOW5. Arrows mark the positions of the minor species dips.
Figure 6—figure supplement 5
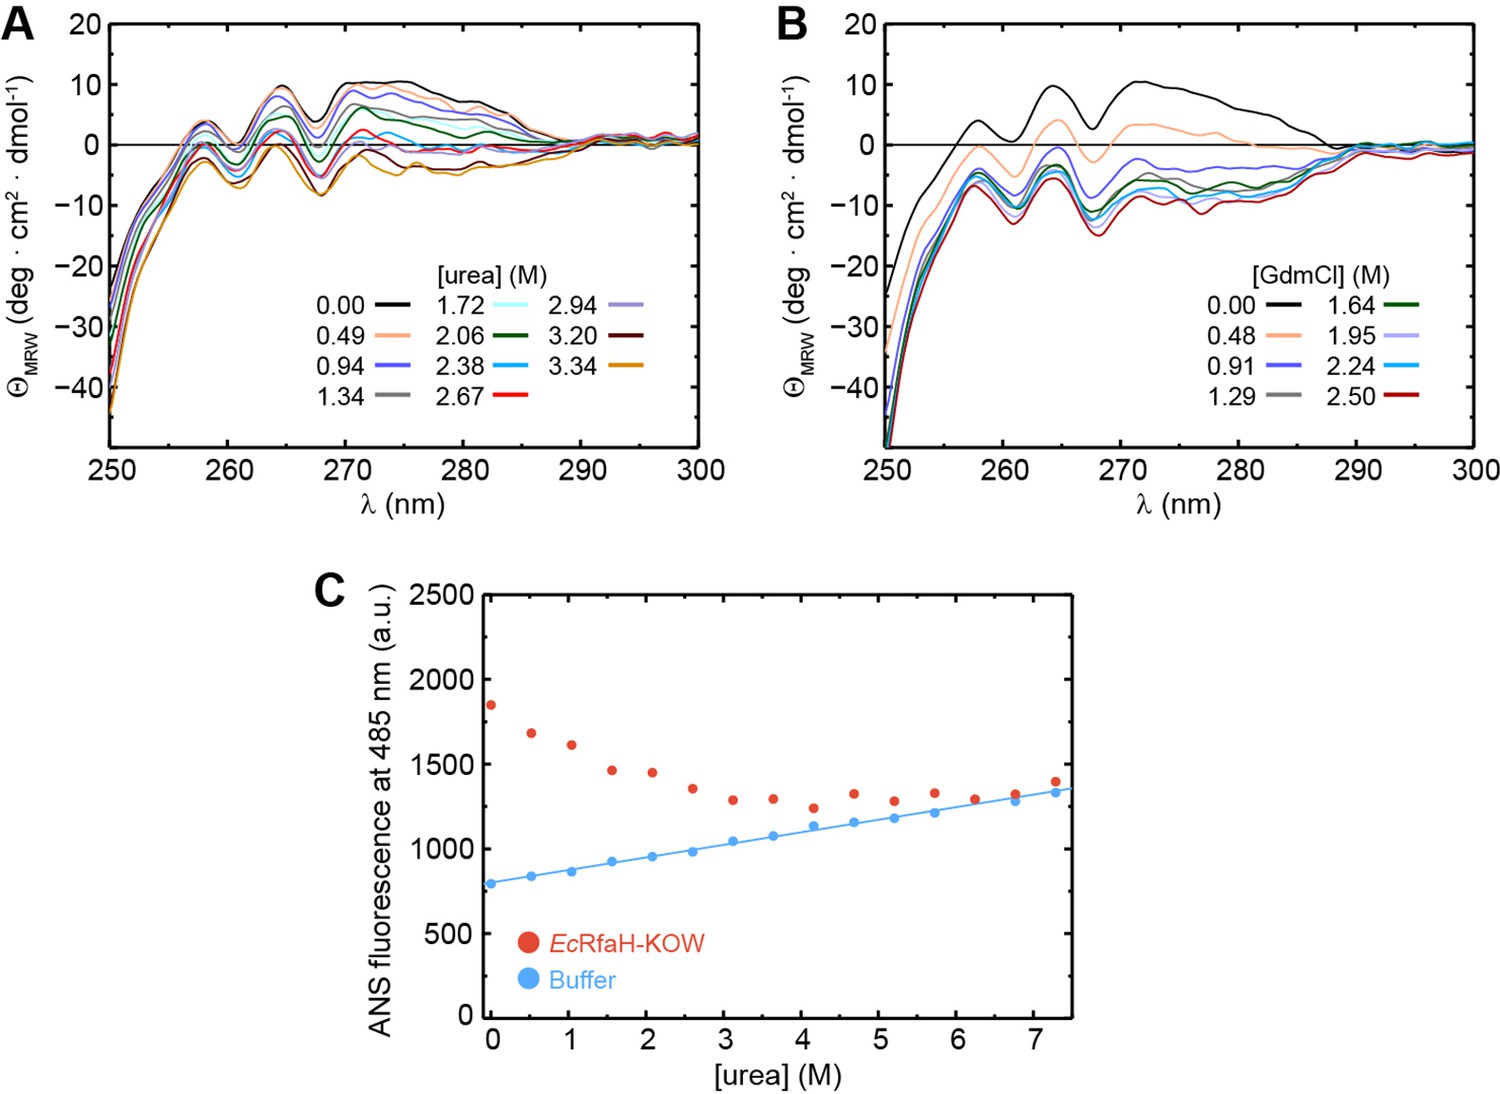
The intermediate state of EcRfaH-KOW is no equilibrium MG.
(A, B) Near-UV circular dichroism (CD) spectra of EcRfaH-KOW during a titration with (A) 10 M urea and (B) 8 M GdmCl. In both cases, the solution was buffered by 10 mM K-phosphate (pH 7.0). The denaturant concentrations at which the spectra were recorded are indicated. (C) 8-Anilino-1-naphthalenesulfonic acid (ANS) binding experiments. The graph shows the ANS fluorescence at 485 nm after over-night incubation of ANS in the presence (filled red circles) or absence (filled blue circles) of EcRfaH-KOW at increasing urea concentrations. The system was buffered by 10 mM K-phosphate (pH 7.0).
Figure 6—figure supplement 6
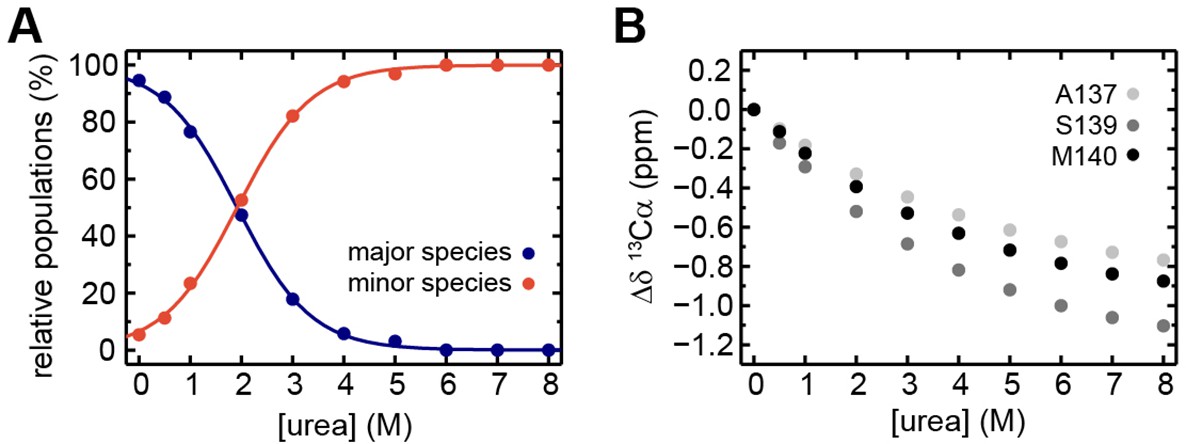
Extended analysis of the urea-induced denaturation of EcRfaH-KOW.
(A) Relative populations of the minor (filled red circles) and major (filled blue circles) species during the [1H, 13C]-ctHSQC-based urea denaturation of 1H, 13C-EcRfaH-KOW. The populations at a certain urea concentration were calculated from the ratio of volumes of the Hα/Cα correlation peaks of S139 minor or major species signals, respectively, to the sum of both values. The curves were fitted to a two-state model to extract the parameters of the transition from the major species to the minor species. The minor species was treated as a single species neglecting the fact that it is actually an ensemble of at least two subspecies. Fitting to a three-state (or even higher-state) model with an increased number of fitting parameters would not be appropriate due to the limited number of data points. (B) Chemical shift changes of 13Cα signals, Δδ13Cα, of A137, S139, and M140 in the [1H, 13C]-ctHSQC spectra during urea denaturation.
Figure 7
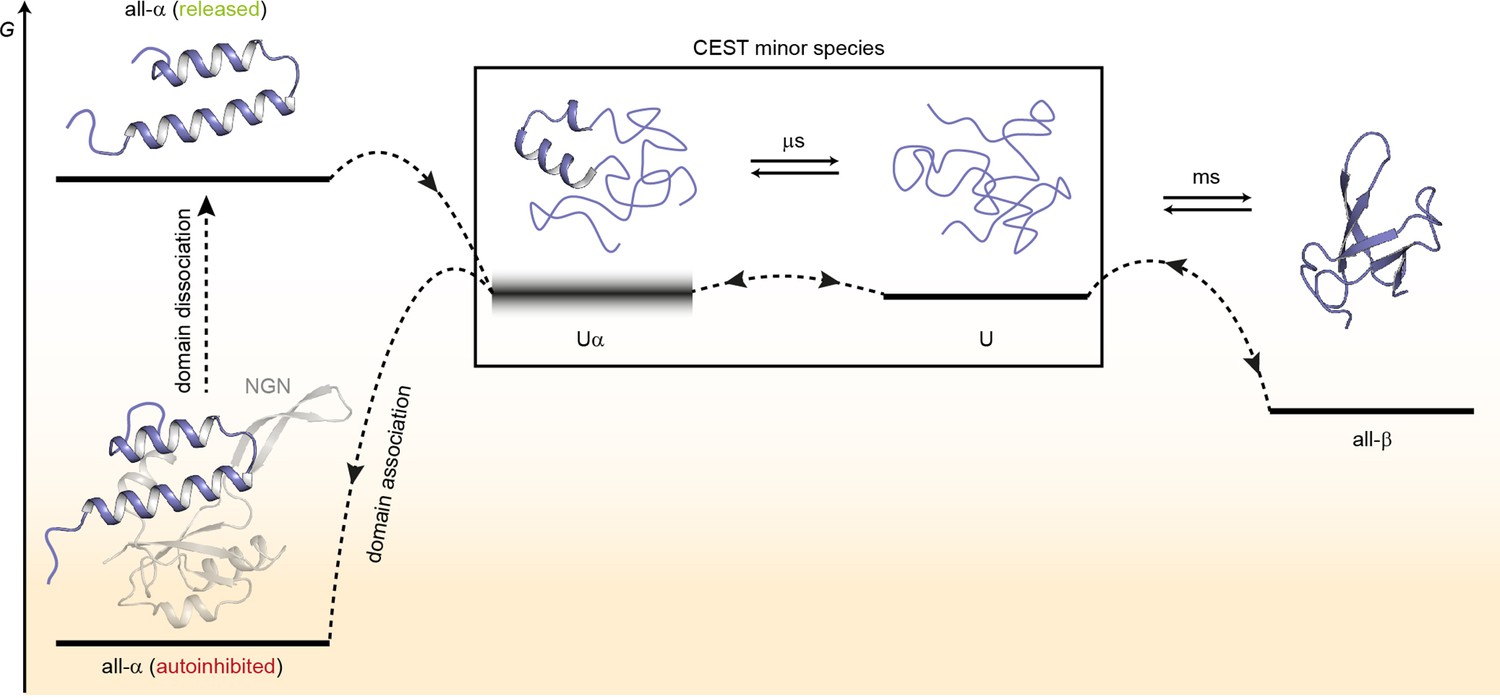
Model for the conformational plasticity of EcRfaH-KOW.
Qualitative Gibbs free energy level diagram and associated structures for the all-α to all-β transition of EcRfaH-KOW and vice versa. In its ground state, that is, the autoinhibited conformation, the energy of the all-α conformation of EcRfaH-KOW is strongly lowered by the extensive inter-domain contacts with the EcRfaH-NGN domain. Upon recruitment, the domains dissociate, the helical structure of the released KOW domain becomes destabilized in isolation, and rapidly decays toward an ensemble of mainly unfolded sub-states that interconvert on the µs time scale. Some of the sub-states correspond to the completely unfolded state (U) whereas others retain some residual (α-) helical elements (Uα). The scheme displays exemplary structures of these sub-states. Due to their fast structural interconversion, U and Uα may be grouped into a single macro-state/ensemble (as is the case during the chemical exchange saturation transfer [CEST] experiments) that exhibits helical structures for a limited amount of time and is otherwise unfolded. Uα is either marginally stable or even unstable (therefore, its energy level is blurred). The disordered conformation then allows for easy and rapid refolding to the all-β conformation. Due to their low thermodynamic stability, or even instability of all-β and Uα, respectively, the last two steps are reversible, that is, the all-α state can be rapidly regained when the EcRfaH-NGN domain becomes available for re-association after transcription termination.
Tables
Table 1
Solution structure statistics for VcRfaH-KOW.
| Experimental derived restraints | ||
|---|---|---|
| Distance restraints | ||
| NOEs unique (total) | 630 (734) | |
| Intraresidual | 59 | |
| Sequential | 187 | |
| Medium range | 89 | |
| Long range | 295 | |
| Hydrogen bonds | 2 · 18 | |
| Dihedral restraints | 76 | |
| Restraint violation | ||
| Average distance restraint violation (Å) | 0.002584±0.000700 | |
| Maximum distance restraint violation (Å) | 0.12 | |
| Average dihedral restraint violation (°) | 0.0654±0.0265 | |
| Maximum dihedral restraint violation (°) | 0.71 | |
| Deviation from ideal geometry | ||
| Bond length (Å) | 0.000544±0.000039 | |
| Bond angle (Å) | 0.1096±0.0056 | |
| Coordinate precision*,† | ||
| Backbone heavy atoms (Å) | 0.32 | |
| All heavy atoms (Å) | 0.90 | |
| Ramachandran plot statistics‡ (%) | 91.8/7.9/0.2/0.1 |
-
*
The precision of the coordinates is defined as the average atomic root mean square difference between the accepted simulated annealing structures and the corresponding mean structure calculated for the given sequence region.
-
†
Calculated for residues 116–165.
-
‡
Ramachandran plot statistics are determined by PROCHECK and noted by most favored/ additionally allowed/generously allowed/disallowed.
Table 2
Selected thermodynamic parameters of the six Kyrpides, Ouzounis, Woese (KOW) domains.
The values were derived from thermal denaturations monitored by differential scanning calorimetry (DSC) and circular dichroism (CD) spectroscopy. Standard deviations result from data fitting.
| Parameter | EcNusG-KOW | MtNusG-KOW | MjSpt5-KOW | hSpt5-KOW5 | EcRfaH-KOW | VcRfaH-KOW |
|---|---|---|---|---|---|---|
| Tm (°C) pH 7/pH 4 | ||||||
| CD | –*/– | 76.6±0.874/– | –†/–† | –/60.5±0.771 | 50.3±0.388/– | 65.2±1.78/– |
| DSC | 87.0±0.0485/– | 77.0±0.0885/– | 111±0.0326/– | –/58.0±0.162 | 47.3±0.143/– | 70.2±0.379/– |
| ΔHu (Tm) (kJ/mol) pH 7/pH 4 | ||||||
| CD | –*/– | 193±11.3/– | –†–/–† | –/140±12.4 | 121±5.15/– | 162±2.91/– |
| DSC | 222±0.339/– | 192±0.417/– | 293±0.345/– | –/117±0.735 | 129±0.432/– | 169±1.56/– |
| ΔCp (Tm) (kJ/(K mol)) pH 7/pH 4 | 0.800/– | 0.346/– | –*/– | –/2.27 | 2.18/– | 0.148/– |
-
*
Data was not fitted due to the lack of the baseline of the unfolded state.
-
†
No denaturation.
Table 3
Thermodynamic parameters of the six Kyrpides, Ouzounis, Woese (KOW) domains.
The values were derived from chemical denaturations monitored by circular dichroism (CD) spectroscopy as well as fluorescence spectroscopy where indicated. Standard deviations result from data fitting.
| Parameter | EcNusG-KOW | MtNusG-KOW | MjSpt5-KOW | hSpt5-KOW5 | EcRfaH-KOW | VcRfaH-KOW |
|---|---|---|---|---|---|---|
| ΔGu(H2O) (25°C) (kJ/mol) | ||||||
| Urea, pH 4 | 19.8±2.21 | 22.4±3.46 | –* | 6.24±4.42 | – (native state aggregation) | 10.8±1.66 (10.8±0.90)† |
| Urea, pH 7 | 27.7±4.21 | 26.4±6.16 | –* | 14.3±2.90 | Three-state | 14.0±1.74 (13.9±0.61)† |
| GdmCl, pH 7 | 11.7±2.07 | 15.7±3.99 | 45.4±4.83 | 7.37±3.16 | Three-state | 2.87±4.92 (2.84±6.55)† |
| m (25°C) (kJ/(mol M)) ‡ | ||||||
| Urea, pH 4 | 2.51±0.453 | 4.18±0.660 | –* | 3.25±0.857 | – (native state aggregation) | 2.91±0.396 (2.98±0.22)† |
| Urea, pH 7 | 3.84±0.681 | 5.71±1.32 | –* | 3.83±0.820 | Three-state | 2.98±0.388 (3.13±0.14)† |
| GdmCl, pH 7 | 5.22±0.809 | 8.26±1.87 | 9.02±0.984 | 4.95±1.31 | Three-state | 7.71±3.68 (7.86±4.29)† |
| [Denat]1/2 (25°C) (M) | ||||||
| Urea, pH 4 | 7.89 | 5.36 | >10* | 1.92 | – (native state aggregation) | 3.71 (3.62)† |
| Urea, pH 7 | 7.21 | 4.62 | >10* | 3.73 | ~2.25/~4.25 | 4.70 (4.44)† |
| GdmCl, pH 7 | 2.24 | 1.90 | 5.03 | 1.49 | ~0.6/~1.3 | 0.37 (0.36)† |
-
*
No denaturation possible.
-
†
Values were determined by fluorescence-based unfolding experiments.
-
‡
The m value is a measure of the broadness of the transition and correlates with the difference in the accessible surface area between N and U, and the transition midpoint.
Table 4
Quantification of H-bond strengths from LR-HNCO nuclear magnetic resonance (NMR) experiments for all Kyrpides, Ouzounis, Woese (KOW) domains.
| EcNusG-KOW | MtNusG-KOW | MjSpt5-KOW | |||||||||||
|---|---|---|---|---|---|---|---|---|---|---|---|---|---|
| H-bond # | β-Sheet | Donor | Acceptor | |h3JNC’| (Hz) | σ |h3JNC’| (Hz) | Donor | Acceptor | |h3JNC’| (Hz) | σ |h3JNC’| (Hz) | Donor | Acceptor | |h3JNC’| (Hz) | σ |h3JNC’| (Hz) |
| 1 | β1-β2 | 131 | 148 | 0.69 | 0.0077 | 188 | 205 | 0.61 | 0.0098 | 92 | 109 | 0.70 | 0.013 |
| 2 | β1-β2 | 148 | 132 | 0.72 | 0.0083 | 205 | 189 | 0.69 | 0.0094 | 109 | 93 | 0.79 | 0.0088 |
| 3 | β1-β2 | 134 | 146 | 0.67 | 0.0081 | 191 | 203 | 0.56 | 0.011 | 95 | 107 | 0.77 | 0.012 |
| 4 | β1-β2 | 146 | 134 | 0.62 | 0.0096 | 203 | 191 | 0.62 | 0.0094 | 107 | 95 | 0.67 | 0.0095 |
| 5 | β1-β2 | 136 | 144 | 0.65 | 0.0073 | 193 | 201 | 0.65 | 0.0080 | 97 | 105 | 0.68 | 0.048 |
| 6 | β1-β2 | 143 | 136 | 0.65 | 0.0088 | 200 | 193 | 0.76 | 0.013 | 104 | 97 | 0.82 | 0.012 |
| 7 | β2-β3 | 147 | 161 | 0.37 | 0.0105 | 204 | 218 | 0.31 | 0.015 | 108 | 122 | 0.54 | 0.010 |
| 8 | β2-β3 | 161 | 147 | Peak overlap | 218 | 204 | 0.69 | 0.011 | 122 | 108 | 0.65 | 0.010 | |
| 9 | β2-β3 | 149 | 159 | 0.67 | 0.012 | 206 | 216 | 0.53 | 0.013 | 110 | 120 | 0.57 | 0.030 |
| 10 | β2-β3 | 159 | 150 | 0.50 | 0.0086 | 216 | 207 | 0.45 | 0.012 | 120 | 111 | 0.60 | 0.010 |
| 11 | β2-β3 | 152 | 157 | 0.46 | 0.019 | 209 | 214 | Peak overlap | 113 | 118 | – | – | |
| 12 | β3-β4 | 158 | 173 | 0.78 | 0.0077 | 215 | 230 | 0.83 | 0.0088 | 119 | 134 | No HNCO peak | |
| 13 | β3-β4 | 173 | 158 | 0.64 | 0.010 | 230 | 215 | 0.62 | 0.011 | 134 | 119 | 0.62 | 0.010 |
| 14 | β3-β4 | 160 | 171 | 0.73 | 0.0056 | 217 | 228 | 0.75 | 0.0089 | 121 | 132 | 0.88 | 0.012 |
| 15 | β3-β4 | 171 | 161 | Peak overlap | 228 | 217 | 0.73 | 0.0062 | 132 | 121 | 0.47 | 0.014 | |
| 16 | β3-β4 | 162 | 169 | 0.51 | 0.0074 | 219 | 226 | 0.50 | 0.0090 | 123 | 130 | No H-bond distance | |
| 17 | β3-β4 | 169 | 162 | 0.60 | 0.0066 | 226 | 219 | 0.61 | 0.0091 | No equivalent | – | – | |
| 18 | β3-β4 | 167 | 164 | – | – | 224 | 221 | 0.20 | 0.019 | No equivalent | – | – | |
| 19 | β5-β1 | 137 | 177 | 0.46 | 0.017 | 194 | 234 | 0.52 | 0.025 | 98 | 138 | No HNCO peak | |
| 20 | β5-β1 | 179 | 135 | Peak overlap | 236 | 192 | 0.47 | 0.016 | 140 | 96 | Peak overlap | ||
| 21 | β5-β1 | 135 | 179 | 0.73 | 0.0060 | 192 | 236 | Peak overlap | 96 | 140 | Peak overlap | ||
| 22 | β5-β1 | 181 | 133 | – | – | 238 | 190 | – | – | 142 | 94 | 0.46 | 0.023 |
| 23 | β5-β1 | No equivalent | – | – | No equivalent | – | – | 143 | 94 | 0.27 | 0.022 | ||
| 24 | β5-β1 | No equivalent | – | – | No equivalent | – | – | 94 | 143 | 0.57 | 0.010 | ||
| hSpt5-KOW5 | EcRfaH-KOW | VcRfaH-KOW | |||||||||||
| H-bond # | β-Sheet | Donor | Acceptor | |h3JNC’| (Hz) | σ |h3JNC’| (Hz) | Donor | Acceptor | |h3JNC’| (Hz) | σ |h3JNC’| (Hz) | Donor | Acceptor | |h3JNC’| (Hz) | σ |h3JNC’| (Hz) |
| 1 | β1-β2 | 707 | 724 | 0.60 | 0.0074 | 113 | 130 | 0.76 | 0.020 | 116 | 133 | 0.87 | 0.015 |
| 2 | β1-β2 | 724 | 708 | Peak overlap | 130 | 114 | 0.53 | 0.051 | 133 | 117 | 0.59 | 0.024 | |
| 3 | β1-β2 | 710 | 722 | 0.70 | 0.0077 | 116 | 128 | 0.65 | 0.027 | 119 | 131 | Peak overlap | |
| 4 | β1-β2 | 722 | 710 | 0.50 | 0.019 | 128 | 116 | Peak overlap | 131 | 119 | 0.46 | 0.020 | |
| 5 | β1-β2 | 712 | 720 | No HNCO peak | 118 | 126 | 0.53 | 0.056 | 121 | 129 | 0.57 | 0.014 | |
| 6 | β1-β2 | 719 | 713 | Peak overlap | 125 | 118 | 0.66 | 0.026 | 128 | 121 | 0.62 | 0.017 | |
| 7 | β2-β3 | 723 | 735 | H-bond peak present. but too weak to quantify | 129 | 142 | 0.41 | 0.029 | 132 | 145 | 0.42 | 0.019 | |
| 8 | β2-β3 | 735 | 723 | Peak overlap | 142 | 129 | 0.70 | 0.019 | 145 | 132 | 0.69 | 0.027 | |
| 9 | β2-β3 | 725 | 734 | 0.71 | 0.010 | 131 | 140 | 0.48 | 0.032 | 134 | 143 | 0.61 | 0.036 |
| 10 | β2-β3 | 733 | 726 | – | – | 140 | 132 | 0.96 | 0.021 | 143 | 135 | 1.0 | 0.011 |
| 11 | β2-β3 | 728 | 731 | 0.61 | 0.012 | 134 | 138 | – | – | 137 | 141 | – | – |
| 12 | β3-β4 | 732 | 745 | 0.59 | 0.009 | 139 | 154 | 0.60 | 0.034 | 142 | 157 | Peak overlap | |
| 13 | β3-β4 | 745 | 732 | 0.62 | 0.019 | 154 | 139 | No HNCO peak | 157 | 142 | 0.68 | 0.015 | |
| 14 | β3-β4 | 734 | 743 | 0.69 | 0.039 | 141 | 152 | 0.65 | 0.049 | 144 | 155 | 0.58 | 0.019 |
| 15 | β3-β4 | 743 | 734 | 0.49 | 0.029 | 152 | 141 | – | – | 155 | 144 | 0.72 | 0.021 |
| 16 | β3-β4 | 736 | 741 | 0.63 | 0.033 | 143 | 150 | 0.75 | 0.033 | 146 | 153 | 0.49 | 0.024 |
| 17 | β3-β4 | 741 | 736 | No H-bond orientation | 150 | 143 | 0.47 | 0.052 | 153 | 146 | 0.48 | 0.015 | |
| 18 | β3-β4 | No equivalent | – | – | 148 | 145 | No H-bond orientation | 151 | 148 | No HNCO peak | |||
| 19 | β5-β1 | 713 | 749 | No HNCO peak | 119 | 158 | Peak overlap | 122 | 161 | – | – | ||
| 20 | β5-β1 | 751 | 711 | – | – | 160 | 117 | 0.51 | 0.036 | 163 | 120 | 0.57 | 0.037 |
| 21 | β5-β1 | 711 | 751 | 0.68 | 0.023 | 117 | 160 | 0.68 | 0.015 | 120 | 163 | 0.53 | 0.016 |
| 22 | β5-β1 | 753 | 709 | – | – | 162 | 115 | – | – | 165 | 118 | – | – |
| 23 | β5-β1 | No equivalent | – | – | No equivalent | – | – | No equivalent | – | – | |||
| 24 | β5-β1 | No equivalent | – | – | No equivalent | – | – | No equivalent | – | – | |||
Table 5
Exchange parameters derived from global fitting of the chemical exchange saturation transfer (CEST) experiments to a two-state exchange model.
| Parameter | hSpt5-KOW5 | VcRfaH-KOW | EcRfaH-KOW |
|---|---|---|---|
| pA (%) | 99.15±0.02 | 99.57±0.01 | 94.47±0.46 |
| pB (%) | 0.85±0.02 | 0.43±0.01 | 5.53±0.46 |
| kAB (s–1) | 0.76±0.03 | 0.32±0.02 | 0.82±0.10 |
| kBA (s–1) | 88.62±3.12 | 74.24±3.17 | 13.98±1.24 |
| kex (s–1) | 89.38±3.15 | 74.57±3.18 | 14.80±1.31 |
| τA (s) | 1.31±0.05 | 3.08±0.15 | 1.22±0.15 |
| τB (ms) | 11.28±0.40 | 13.47±0.57 | 71.52±6.33 |
| ΔG (kJ/mol) | 11.81±0.05 | 13.48±0.07 | 7.18±0.21 |
Key resources table
| Reagent type (species) or resource | Designation | Source or reference | Identifiers | Additional information |
|---|---|---|---|---|
| strain, strain background | Escherichia coli BL21(DE3) | Novagen | N/A | |
| recombinant DNA reagent | List of recombinant plasmids used | Table 7 | ||
| Sequence-based reagent | List of primers used | Table 6, Biolegio | PCR primers | |
| peptide, recombinant protein | V. cholerae RfaH | This work | See Materials and methods, section ‘Production of recombinant proteins’ | |
| peptide, recombinant protein | V. cholerae RfaH-KOW | This work | See Materials and methods, section ‘Production of recombinant proteins’ | |
| peptide, recombinant protein | E. coli RfaH-KOW | Burmann et al., 2012 doi:10.1016/j.cell.2012.05.042 | ||
| peptide, recombinant protein | E. coli NusG-KOW | Burmann et al., 2010 doi: 10.1126/science.1184953 | ||
| peptide, recombinant protein | M. tuberculosis NusG-KOW | Strauß et al., 2016 doi: 10.1080/07391102.2015.1031700 | ||
| peptide, recombinant protein | M. janaschii Spt5-KOW | This work | See Materials and methods, section ‘Production of recombinant proteins’ | |
| peptide, recombinant protein | Human Spt5-KOW5 (G699-G754) | This work | See Materials and methods, section ‘Production of recombinant proteins’ | |
| commercial assay or kit | QIAquick Gel Extraction Kit | Qiagen | Cat#: 28706 | |
| commercial assay or kit | QIAprep Spin Miniprep Kit | Qiagen | Cat#: 27106 | |
| chemical compound, drug | (15NH)4SO4 | Sigma/Merck KGaA | Cat#: CS01-185_148 | |
| chemical compound, drug | D2O | Euriso-Top GmbH | Cat#: 7789-20-0 | |
| chemical compound, drug | 13C-D-glucose | Euriso-Top GmbH | Cat#: CLM-1396–10 | |
| chemical compound, drug | Urea | Carl Roth GmbH & Co. KG | Cat#: 2317.1 | |
| chemical compound, drug | GdmCl | Carl Roth GmbH & Co. KG | Cat#: 0037.1 | |
| chemical compound, drug | DSS | Sigma | Cat#: T-8636 | |
| chemical compound, drug | ANS | Sigma/Merck KGaA | Cat#: 10417–5G-F | |
| software, algorithm | Fit-o-Mat v0.752 | Möglich, 2018 doi: 10.1021/acs.jchemed.8b00649 | ||
| software, algorithm | PyMol v. 1.7 | The PyMOL Molecular Graphics System, Schrödinger, LLC | https://pymol.org/2/ | |
| software, algorithm | NMRViewJ | One Moon Scientific, Inc | http://www.onemoonscientific.com/nmrviewj | |
| software, algorithm | ChemEx v. 0.6.1 | Vallurupalli et al., 2012 doi:10.1021/ja3001419 | https://github.com/gbouvignies/ChemEx | |
| other | Quartz cuvette for CD spectroscopy, 1 mm | Hellma GmbH & Co. KG | See Materials and methods, section ‘CD spectroscopy’ | |
| other | Quartz cuvette for CD spectroscopy, 2 mm | Hellma GmbH & Co. KG | See Materials and methods, section ‘CD spectroscopy’ | |
| other | Quartz cuvette for fluorescence spectroscopy, 1 cm | Hellma GmbH & Co. KG | See Materials and methods, section ‘Fluorescence spectroscopy’ |
Table 6
Primers used for cloning.
| Primer | Sequence (5’ → 3’) |
|---|---|
| Fw-VcRfaH-KOW | CAT GCC ATG GGA GAG CAA TTG AAG CAT GCC AC |
| Rv-VcRfaH-KOW | CGC GGA TCC TTA GGT GAC TTC CCA ATC GG |
| Fw-hSpt5-KOW5 | CAT GCC ATG GGC CGG AGG GAC AAC GAA CTC ATC GG |
| Rv-hSpt5-KOW5 | TAG AAT TCT CAG CCC ACC GTG GTG AGC CGC TG |
| Fw-MjSpt5-KOW | AT GCC ATG GGT AAG AAA ATC ATT GAA AAT ATT GAG AAA GG |
| Rv-MjSpt5-KOW | CGG AAT TCT TAA TCT TTA TGC TTT GAA ACT ATT TTA AC |
Table 7
Plasmids.
| Plasmid | Description | Source |
|---|---|---|
| pVS13 | rfaH from V. cholera in pTYB1 | I Artsimovitch |
| pHC301 | rfaH from V. cholera in pIA238 (a pET28 derivative) Artsimovitch and Landick, 2002 | Carter et al., 2004 |
| pETGb1a-VcRfaH-KOW | rfaH103-165 from V. cholera in pETGb1a | This work |
| pETGb1a-hSpt5-KOW5 | human spt5699-754 in pETGb1a | This work |
| pETGb1a-MjSpt5-KOW | spt5583-147 from M. janaschii in pETGb1a | This work |
| pOTB7_huSUPT5H | cDNA plasmid containing human spt5 | Zuber et al., 2018 |
| pGEX-2TK_MjSpt5-KOW | spt5583-147 from M. janaschii in pGEX-2TK | Hirtreiter et al., 2010 |
| pETGb1a-EcNusG-KOW | nusG123-181 from E. coli in pETGb1a | Burmann et al., 2010 |
| pET101d-MtNusG-KOW | nusG178-238 from M. tuberculosis in pET101d | Strauß et al., 2016 |
| pETGb1a-EcRfaH-KOW | rfaH101-162 from E. coli in pETGb1a | Burmann et al., 2012 |
Additional files
Download links
A two-part list of links to download the article, or parts of the article, in various formats.
Downloads (link to download the article as PDF)
Open citations (links to open the citations from this article in various online reference manager services)
Cite this article (links to download the citations from this article in formats compatible with various reference manager tools)
Structural and thermodynamic analyses of the β-to-α transformation in RfaH reveal principles of fold-switching proteins
eLife 11:e76630.
https://doi.org/10.7554/eLife.76630


