Determination of oligomeric states of proteins via dual-color colocalization with single molecule localization microscopy
- Institute of Biological Information Processing, Molecular and Cellular Physiology (IBI-1), Forschungszentrum Jülich, Germany
- Berlin Institute of Health at Charité – Universitätsmedizin Berlin, Center of Functional Genomics, Hypertension and Molecular Biology of Endocrine Tumors, Charitéplatz, Germany
Figures
Figure 1 with 2 supplements

The dual-color colocalization (DCC) strategy to determine the oligomeric state of proteins.
(A) Model of a dimeric fusion protein used for DCC-single molecule localization microscopy (SMLM). The protein of interest is marked with a white ‘X’, whereas the marker and indicator fluorescent proteins are labeled ‘M’ and ‘F’, respectively. (B) A reconstructed SMLM image from an HEK293T cell expressing Kir2.1 labeled with both mVenus (green) and PAmCherry (magenta). White indicates colocalization of the two color signals. Scale bar: 1 μm. (C) The probability of detecting a protein complex changes with the number (n) and recall rate (p) of the fluorescent proteins it contains. Each color indicates a different recall rate from 0.1 to 0.9 in steps of 0.1. (D) A representative image reconstructed from a recording of a bare coverslip surface showing background signals in the PAmCherry (magenta) and mVenus channels (green). Scale bar: 1 μm. (E) The mean background cluster densities (± SEM) in the mVenus (green, g.) and the PAmCherry (red, r.) recording channels. A cluster comprises a series of fluorescent signals that are spatially close and clustered with the DBSCAN (density-based spatial clustering of applications with noise) algorithm. N=283 recordings. (F) As the background signals in the green channel are negligible, only three types of signals are considered: signals from mVenus (mV.), signals from PAmCherry (pC.), and background signals in the red channel (r.bkg).
Figure 1—figure supplement 1
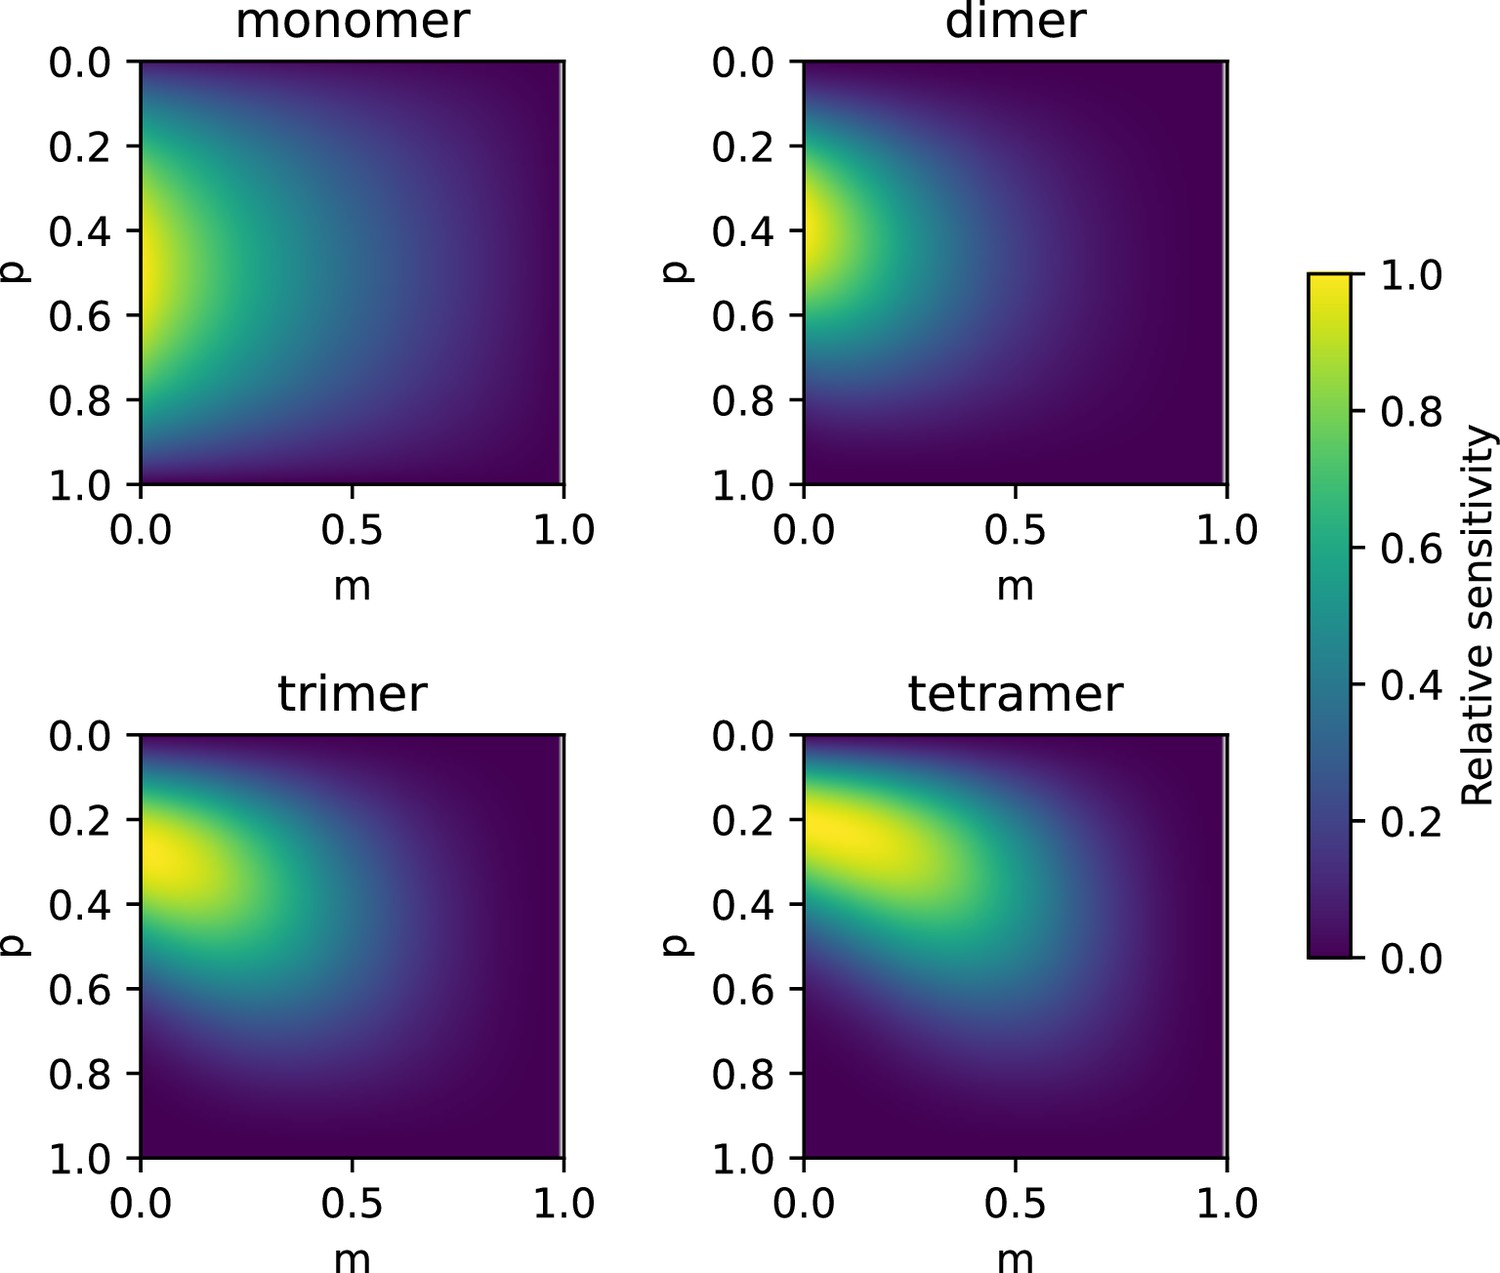
Sensitivity analysis of Equation 1 and Equation 4 for different oligomeric states as indicated in the titles.
The results of Equation 4 were calculated using the indicated values of p and m for the indicated as well as the next smaller and larger oligomeric state. Differentiation was then calculated either as the difference from monomer to dimers (for the detection of monomers) or by the product of the differences to the next smaller and larger oligomeric state. Values were normalized by the maximum difference obtained for each panel and plotted using the indicated color code. The sensitivity of Equation 1 can be seen where m=0.
Figure 1—figure supplement 2
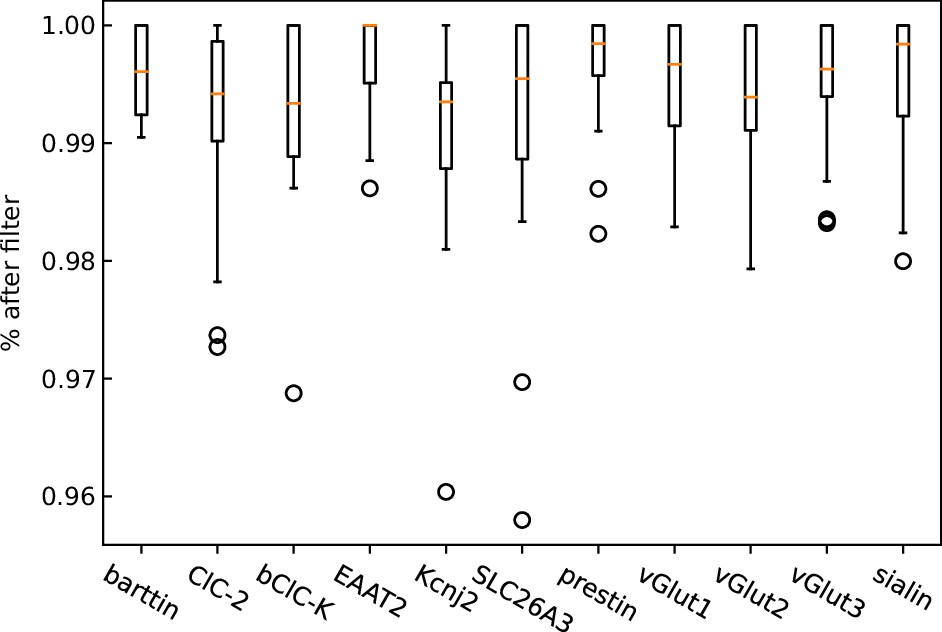
Fraction of clusters remaining after the removal of large clusters (% after filter) by our analysis pipeline for each protein of interest in our study.
Figure 2 with 1 supplement
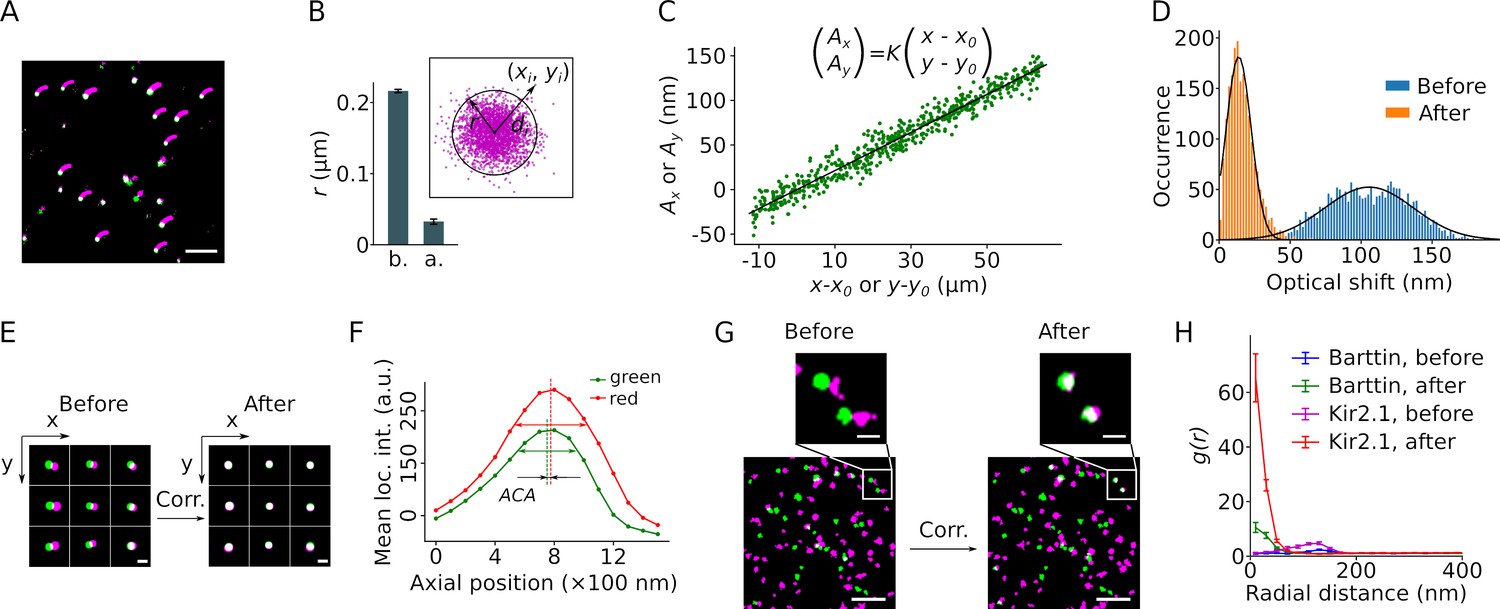
Correction of sample drift and chromatic aberration.
(A) A single molecule localization microscopy (SMLM) image of a bead sample reconstructed from 13,000 frames recorded over ∼18.5 min. The small magenta smears indicate the trajectory of the sample drift. The corrected positions are displayed in green or, when overlapping, in white. Scale bar: 1 μm. (B) The mean cluster radius of positions extracted from 41 beads before (b.) and after (a.) drift correction, with error bars indicating the SEM. The cluster radius is defined as μ+2σ of the Euclidean distances (di) of all localizations (with coordinates (xi, yi)) to the center (mean coordinates) of the cluster, as shown in the inset. (C) Plot of the lateral chromatic aberration between the red and green channels, (Ax, Ay), versus the distance from the red coordinates to an arbitrary center point (x0, y0). Data from both dimensions are included in the graph. Linear regression (black line) yielded the values of the slope K, x0, and y0. The fit is a representative from a single recording of a bead sample. (D) Lateral chromatic aberrations from nine recordings of a bead sample with a total of 1980 beads were corrected with the values obtained in (C), with blue and orange indicating before and after the correction, respectively. Black lines show the Gaussian fitting. (E) Reconstructed images of nine representative beads from different areas before and after drift and chromatic aberration corrections. The green and magenta indicate signals from the mVenus and PAmCherry channels, respectively. Scale bar: 200 nm. (F) The mean intensities of the beads recorded at the green and the red channels changed along the axial position of the sample. The axial distance between the two peaks indicates the axial chromatic aberration (ACA). (G) Representative reconstructed images showing the mVenus (green) and PAmCherry clusters (magenta) recorded from HEK293T cells expressing barttin-mVenus-PAmCherry before and after drift and chromatic aberration corrections. Non-clustered localizations were omitted from the images. Scale bars indicate 1 μm and 200 nm respectively in the bottom and the zoomed-in images. (H) Radial distribution of barttin (17 cells, 1 preparation) and Kir2.1 (35 cells, 3 preparations) PAmCherry clusters around mVenus clusters before and after drift and chromatic aberration corrections. Non-clustered localizations were excluded from the analysis.
Figure 2—figure supplement 1
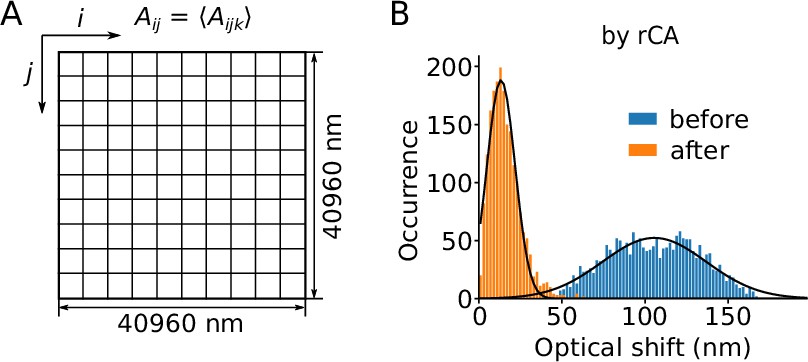
Regional averaging for the correction of lateral chromatic abberation.
(A) The whole microscopic field of view was divided into 100 squares and the mean lateral chromatic aberration (Aijk) measured in each square was taken as the offset (Aij) for correction. (B) Distribution of the optical shift before (blue) and after (orange) correction by regional lateral chromatic aberration correction (rCA). Data are from the same recordings as in Figure 2D. Black lines show the result of a Gaussian fit.
Figure 3 with 1 supplement
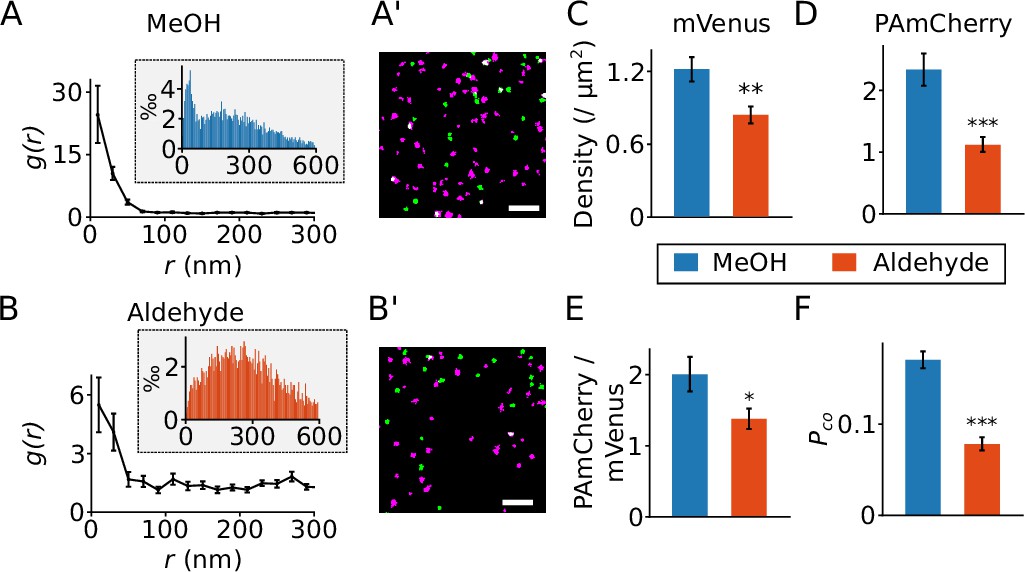
Effect of different fixation methods.
(A and B) Results from the radial distribution function g(r) for PAmCherry clusters around mVenus clusters recorded in Flp-In T-REx 293 cells expressing barttin-mVenus-PAmCherry and fixed with cold methanol (A, MeOH, 24 cells) or para-formaldehyde plus glutaraldehyde (B, aldehyde, 29 cells). The inset shows the histograms of the nearest neighbor distances. (A’ and B’) Reconstructed images from recordings of cells expressing barttin-mVenus-PAmCherry fixed with cold methanol (A’) or the aldehyde (B’), with green indicating mVenus clusters and magenta for PAmCherry clusters. Scale bar: 1 µm. (C and D) The densities of mVenus (C, p=0.0028) and PAmCherry (D, p=4.9 × 10⁻⁵) clusters in samples prepared using the two fixation methods. (E) The relative density of PAmCherry (pC.) clusters to mVenus (mV.) clusters, p=0.02. (F) The measured colocalization ratio of mVenus with PAmCherry, p=1.6 × 10⁻¹⁰. *: 0.0 5 > p > 0.01, **: 0.01 > p > 0.001, ***: p<0.001, Student’s t-test. Data is shown as mean ± SEM.
Figure 3—figure supplement 1
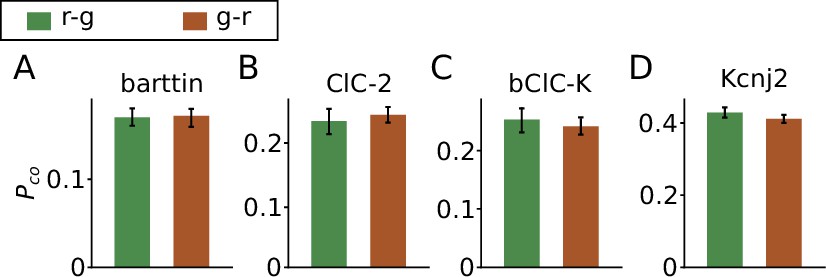
The order of fluorescent proteins does not affect the colocalization ratio.
(A–E) The colocalization ratios of mVenus with PAmCherry fused to the C-terminus of five different proteins transiently transfected in HEK293T cells fixed with cold methanol. The two fusion patterns POI-PAmCherry-mVenus (r-g) and POI-mVenus-PAmCherry (g-r) are compared for each protein. Data is shown as mean ± SEM. The number of cells included in the analysis are (r-g/g-r) barttin: 23/17 , ClC-2: 12/32, bClC-K: 9/15, and Kcnj2: 14/35, respectively.
Figure 4 with 5 supplements
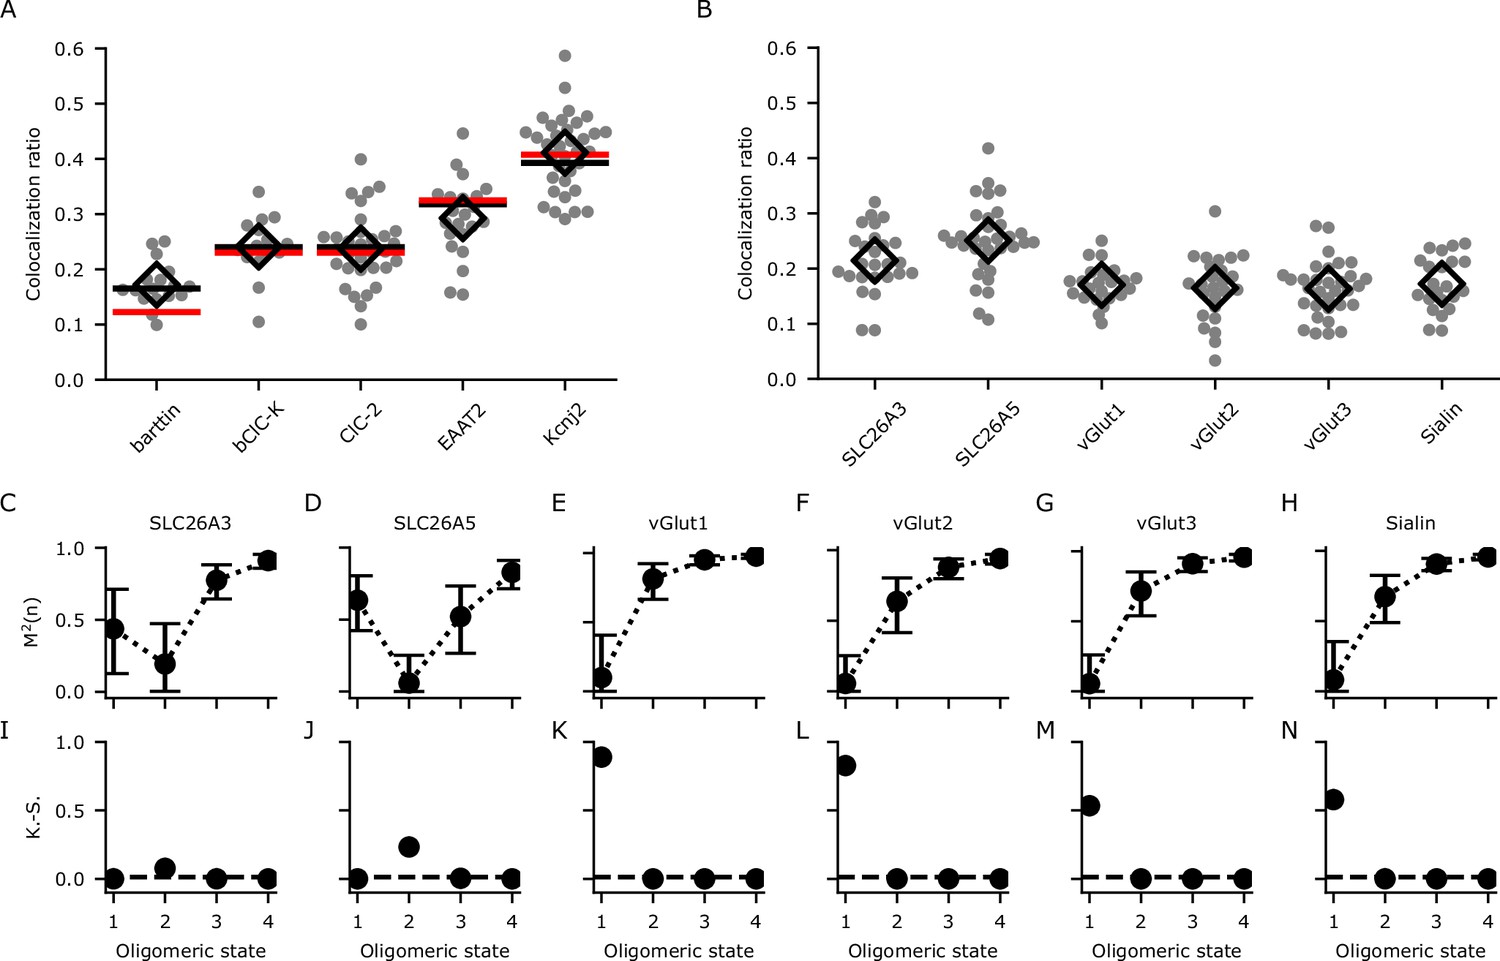
Calibration and determination of oligomeric states through analyzing the colocalization ratios with dual-color colocalization (DCC)-single molecule localization microscopy (SMLM).
(A) The colocalization ratios for mVenus and PAmCherry linked to proteins with known oligomeric states for calibration. Red lines show the fit with Equation 1 and black lines show the fit with Equation 4 including the modification factor m. The number of cells included in the analysis are (in brackets): barttin (13), ClC-2 (30), bClC-K (14), EAAT2 (19), and Kir2.1 (34). Individual values are shown as gray circles and the mean value is shown as a black open diamond. (B) Colocalization ratios for mVenus and PAmCherry linked to the indicated proteins of interest. The number of cells included are 24, 27, 22, 25, 30, and 22, respectively. (C–H) The coefficient of mismatch (M2) calculated for all the proteins of interest at assumed oligomeric states of monomer (1), dimer (2), trimer (3), and tetramer (4). Error bars correspond to the range of the 95% confidence intervals as determined by a global bootstrap resampling (10,000 resamples). (I–N): Two-sample Kolmogorov-Smirnov (K.-S.) tests of the observed colocalization ratios from each protein of interest compared with the protein standards in (A). The dashed horizontal line indicates the Bonferroni-corrected threshold for the α-level (0.0125).
Figure 4—figure supplement 1
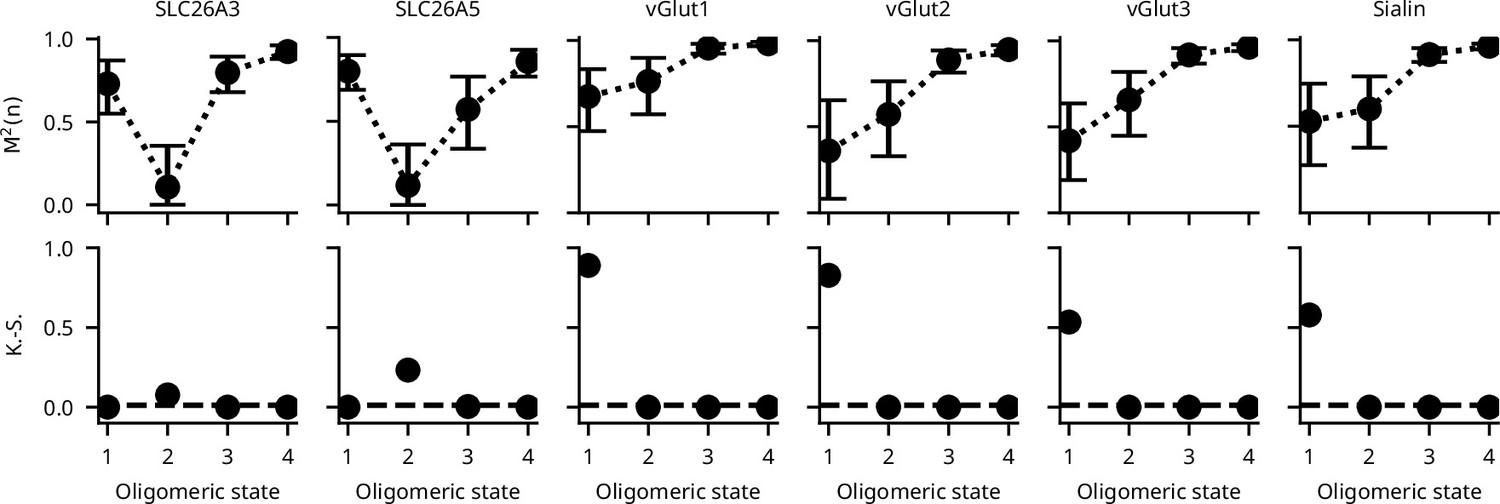
Determination of the most likely oligomeric state of SLC26 and SLC17 proteins using only Equation 1.
As expected, the determination of the monomeric state of SLC17 (vGlut and Sialin) proteins is not possible using the COM based only on Equation 1 (top row). Determination of dimers as seen for the SLC26 proteins is much less affected (top row). Error bars correspond to the range of the 95% confidence intervals as determined by a global bootstrap resampling (10,000 resamples). The comparison of the observed colocalization ratios with those of reference proteins using the Kolmogorov-Smirnov test is unaffected (bottom row).
Figure 4—figure supplement 2
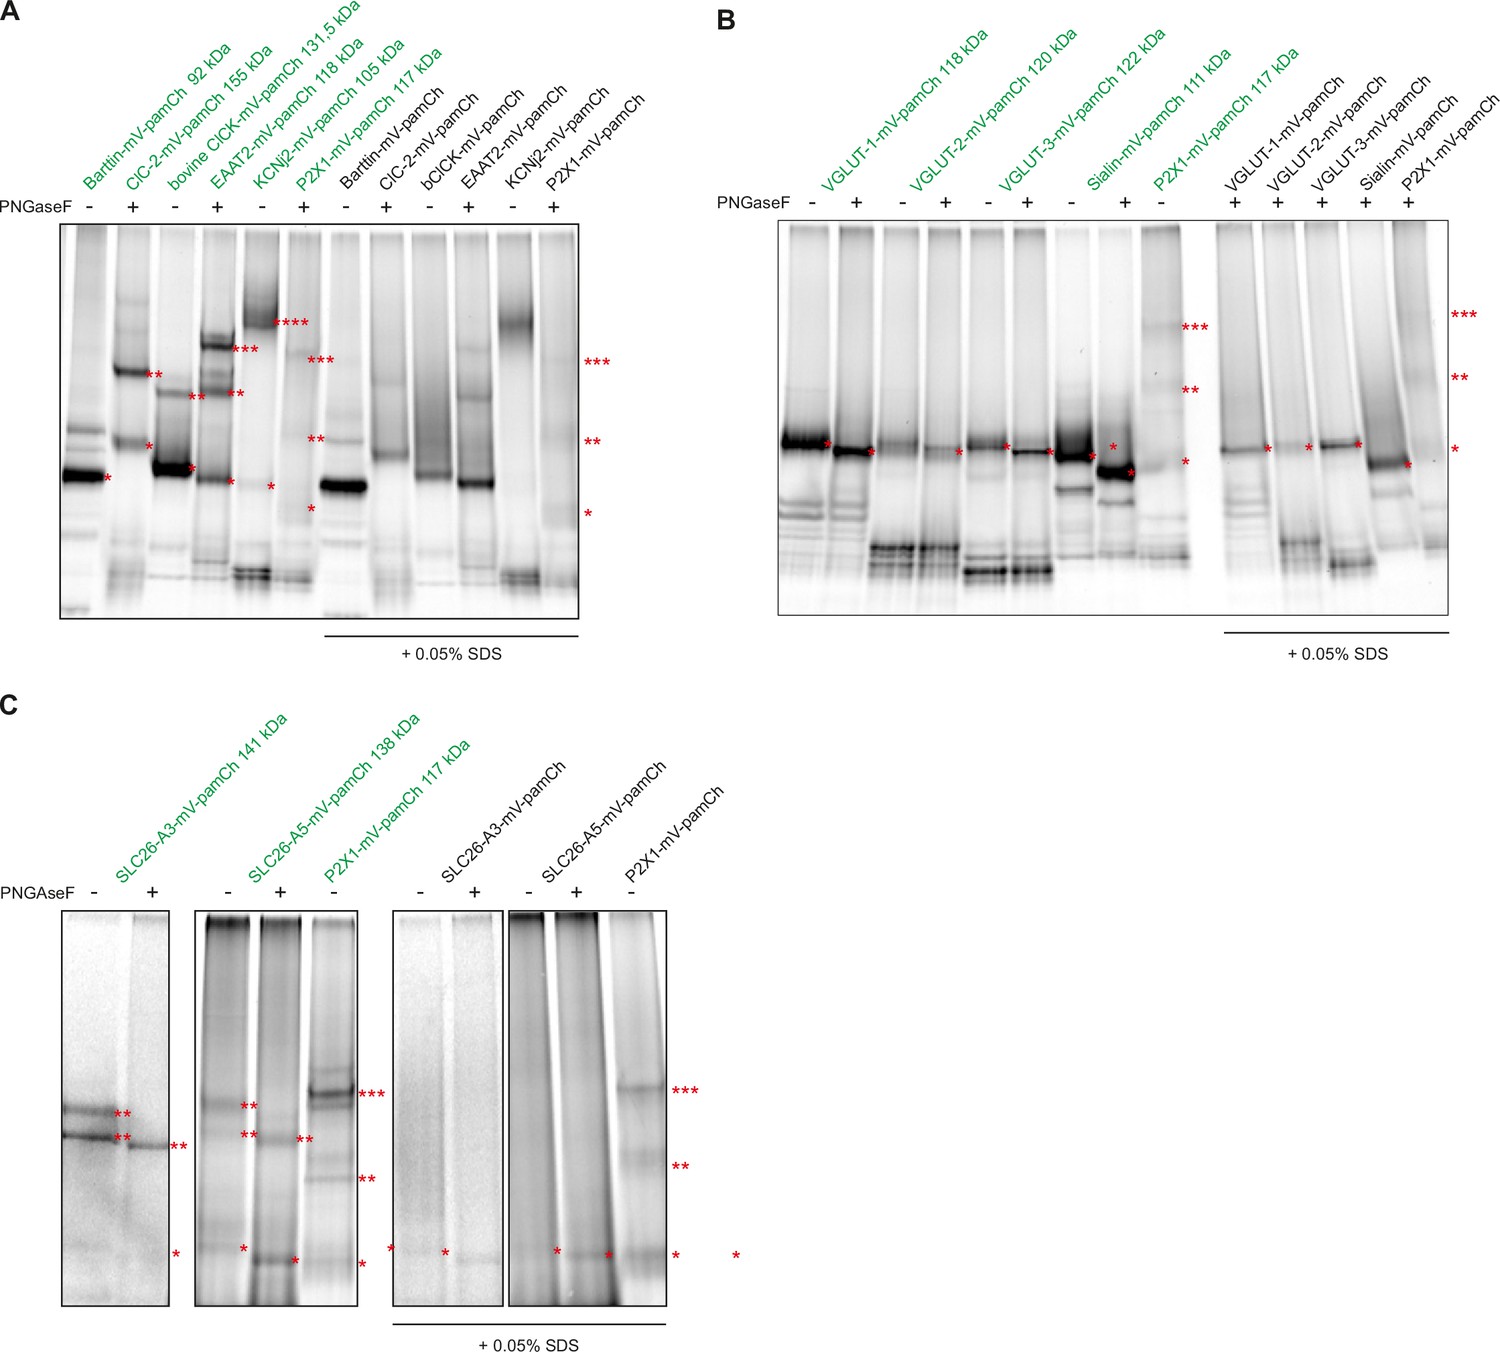
High-resolution clear native gel electrophoresis (hrCNE) of reference proteins and proteins of interest.
(A) hrCNE of standard proteins with known oligomeric state. Depending on their oligomeric state, protein bands are indicated with an increasing number of red stars (monomer, *; dimer, **, timer, ***; tetramer, ****). (B) hrCNE of VGLUTs and sialin. To minimize artifacts due to protein glycosylation, proteins were treated with PNGaseF at 34 °C for 30 min. For comparison, enzyme treated (+) and untreated (-) samples were loaded. (C) hrCNE of SLC26A3 and SLC26A5/prestin. Both proteins are natively glycosylated, therefore dimers exhibit two bands in non-PNGaseF-treated samples. Proteins were also treated with a final concentration of 0.05% SDS for 15 min at 37 °C to dissociate oligomers (right half of the gel). The calculated molecular masses of protein monomers are shown in green.
-
Figure 4—figure supplement 2—source data 1
This source data contains the unedited gel images.
- https://cdn.elifesciences.org/articles/76631/elife-76631-fig4-figsupp2-data1-v2.zip
Figure 4—figure supplement 3
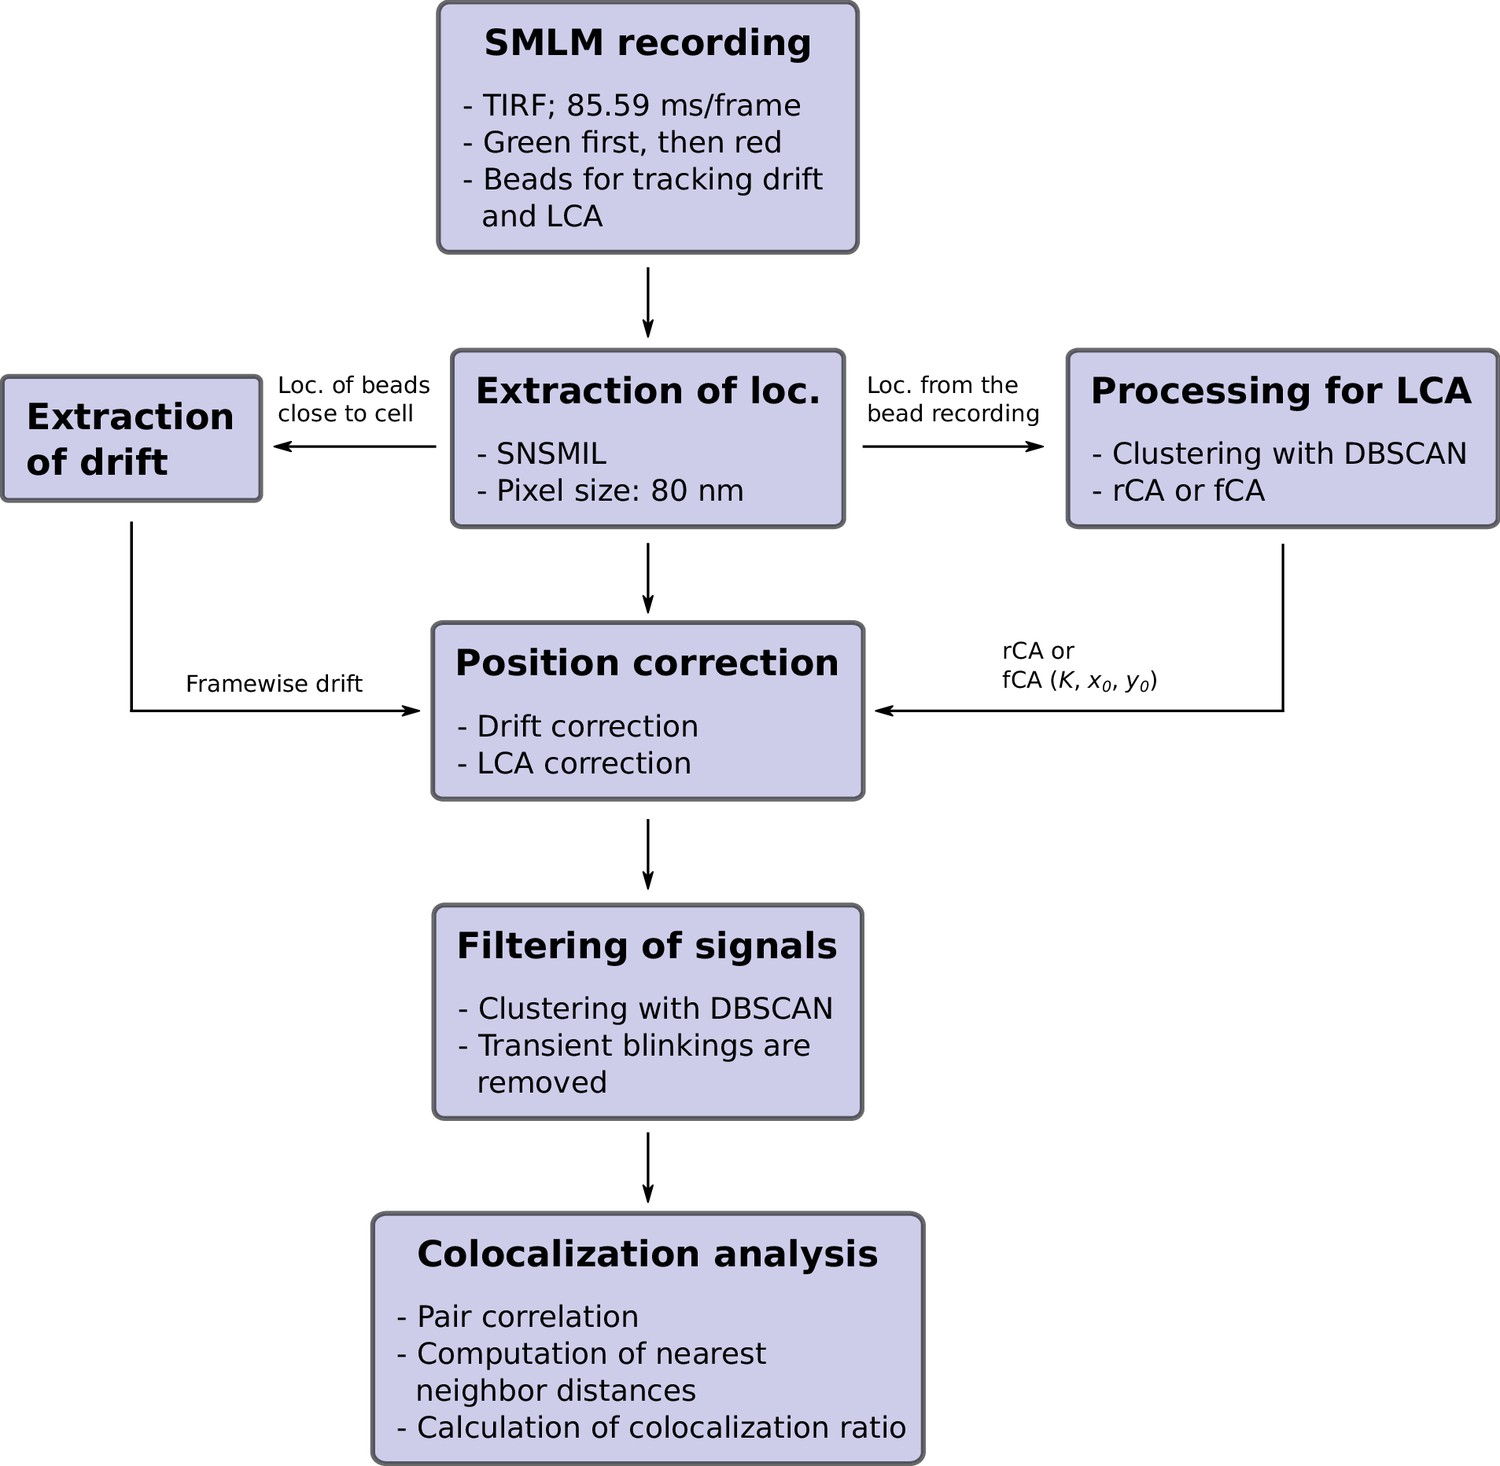
The working paradigm of dual-color colocalization (DCC)-single molecule localization microscopy (SMLM).
Figure 4—figure supplement 4
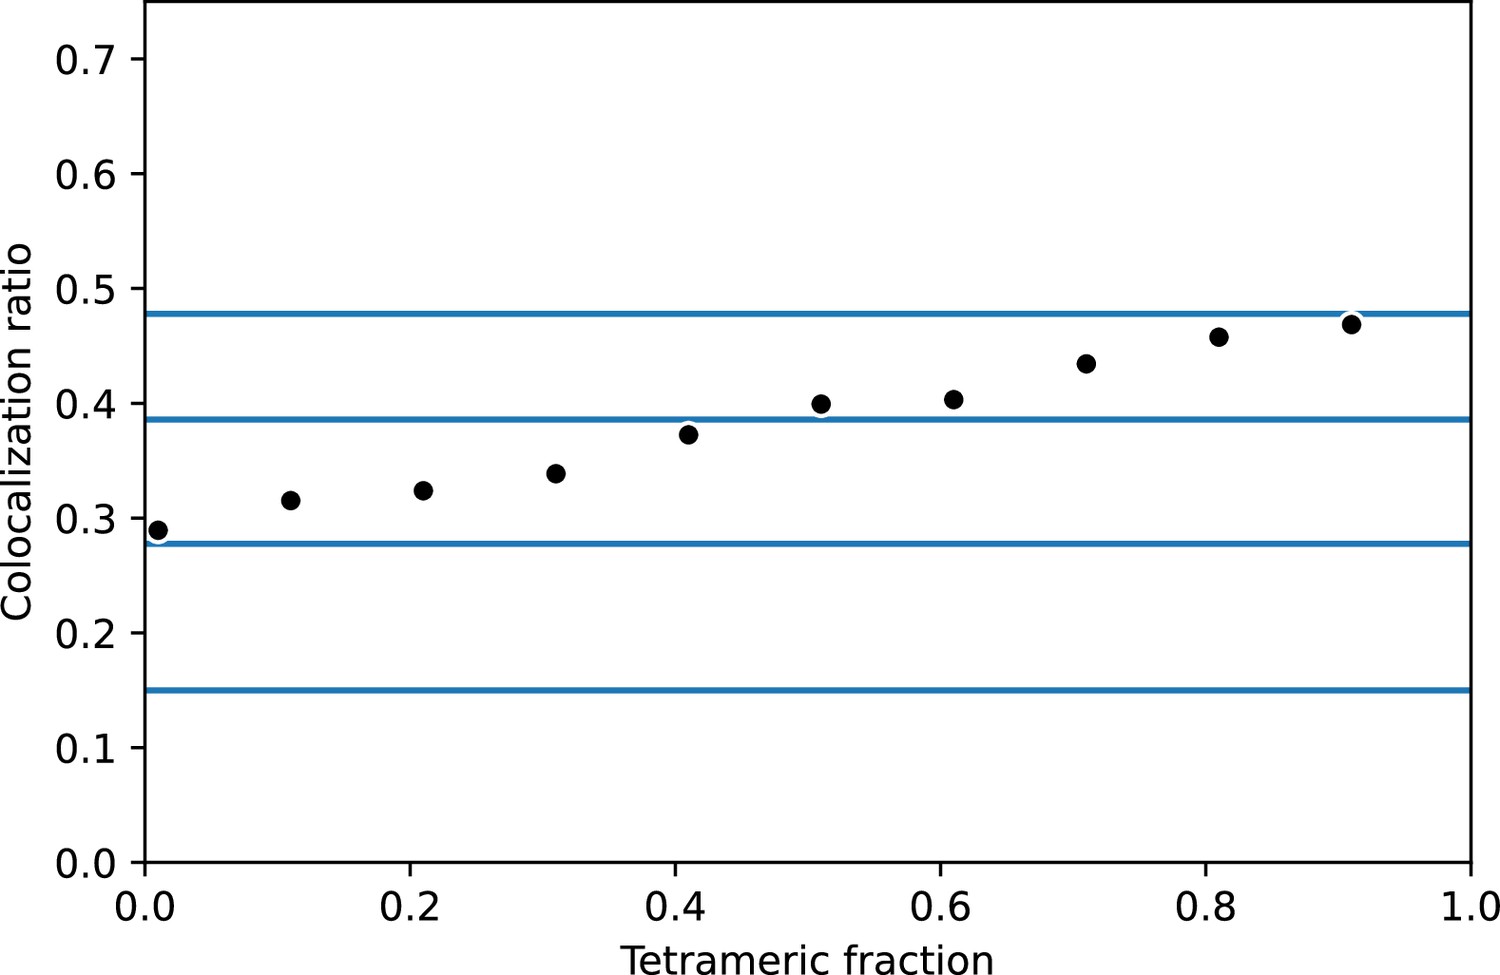
Summary of 1000 simulations per data point of a mixed population of dimeric and tetrameric proteins.
Proteins were simulated with p = 0.15, m = 1 at a density of 5 clusters/µm². Protein coordinates were set randomly and DBSCAN (density-based spatial clustering of applications with noise) clustering was applied as stated in Materials and Methods. Blue lines represent expected values for monomeric through tetrameric values. The standard error of the mean is smaller than the symbols.
Figure 4—figure supplement 5
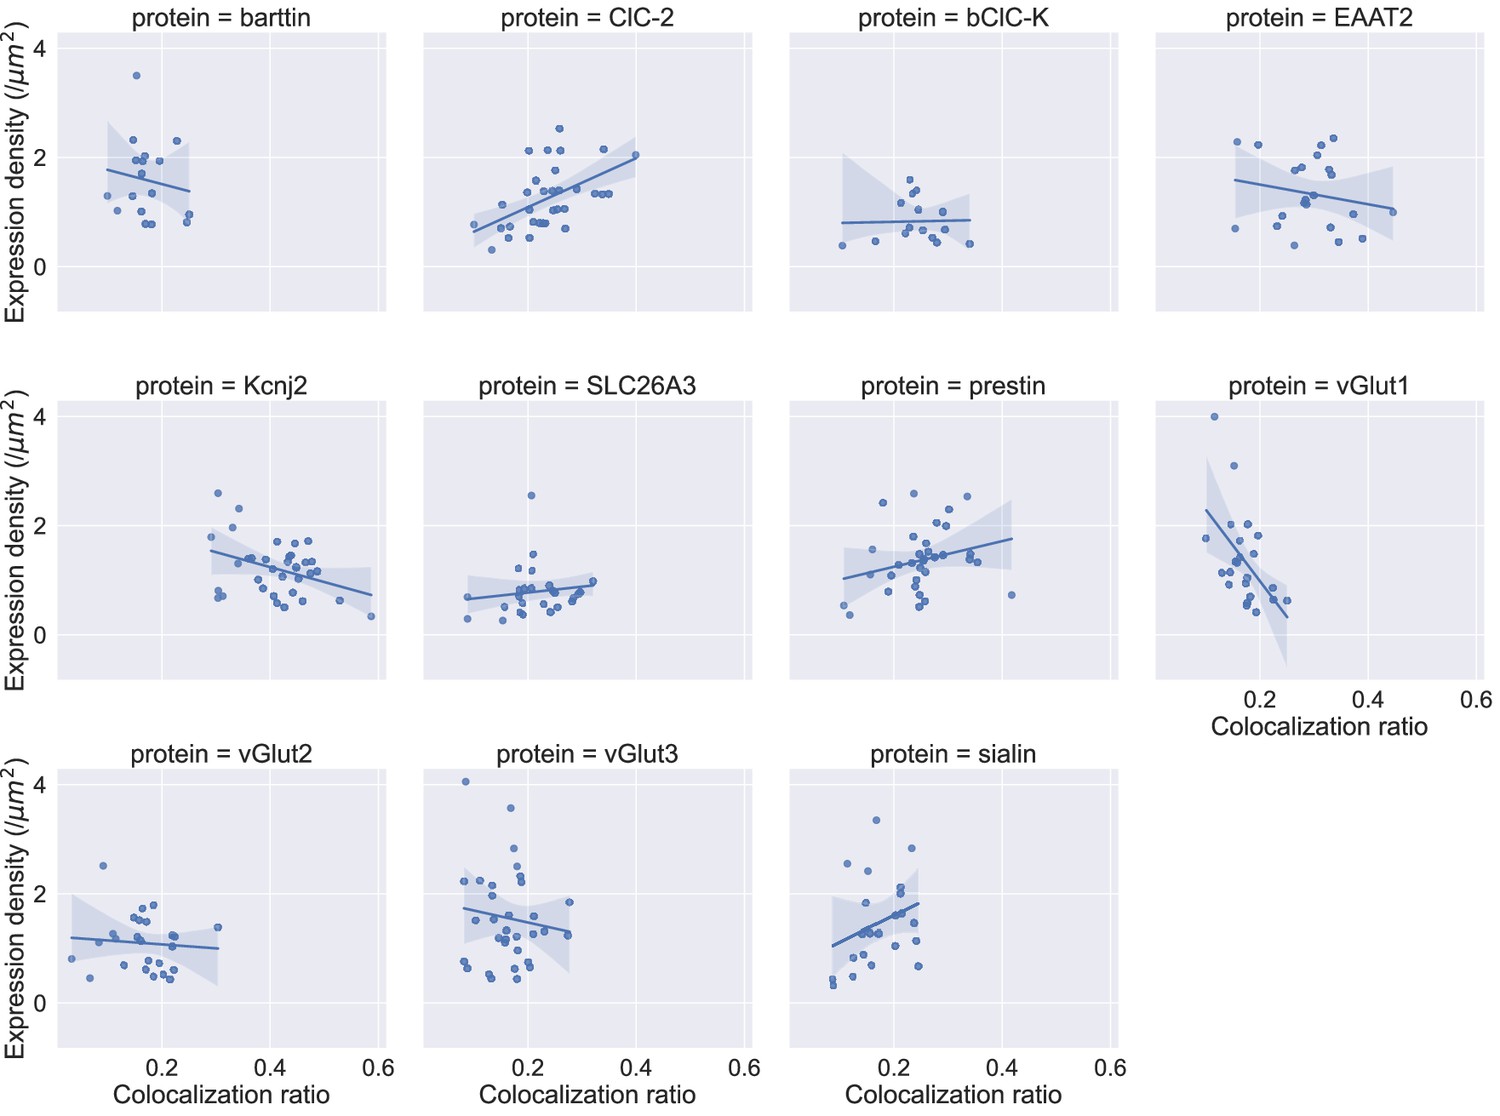
Plots of the experimentally observed expression densities versus the colocalization ratio do not reveal a consistent correlation.
Blue lines represent a fit of a linear function to the data and the shaded areas represent the 95%confidence interval (CI) of this fit as determined by 10,000 bootstrap resamples each.
Figure 5 with 1 supplement
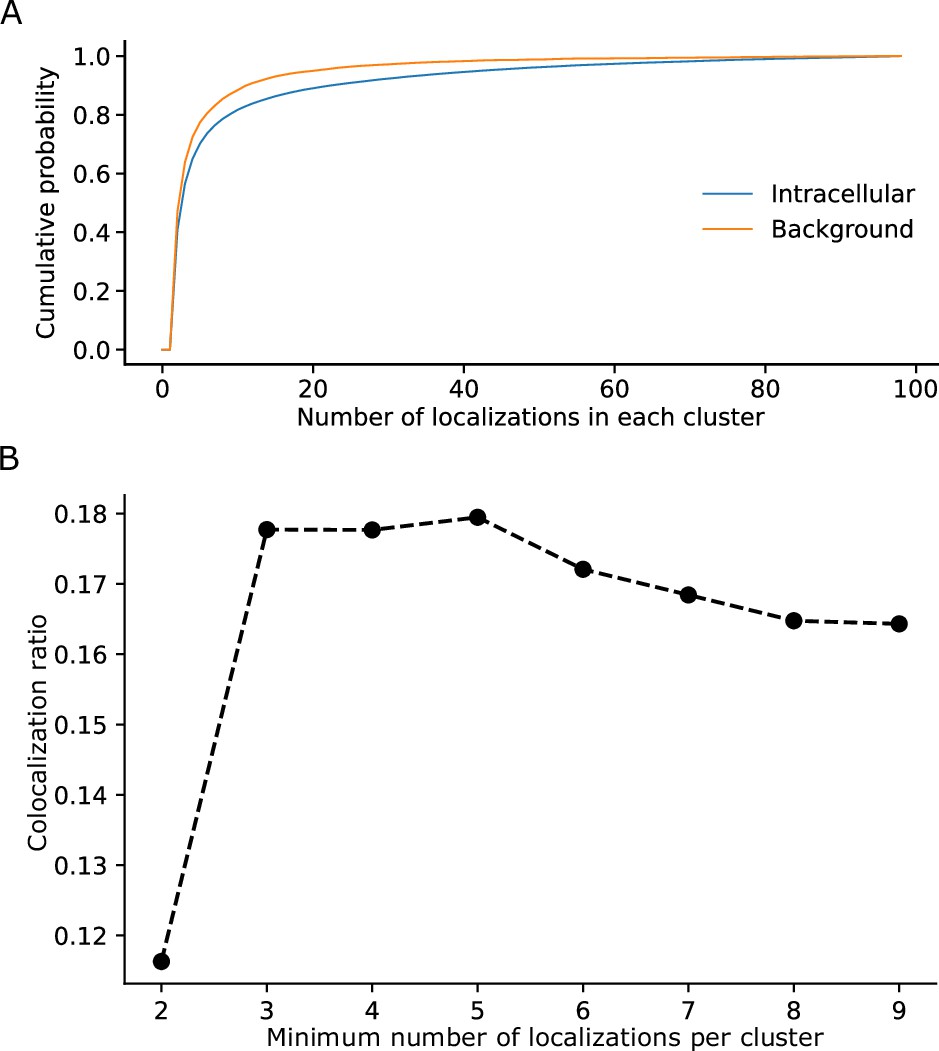
Determination of parameters for the clustering of localizations.
(A) The cumulative probability distribution of the number of localizations per cluster in the background and within Flp-In T-Rex 293 cells expressing Barttin-mVenus-PAmCherry.
While most clusters in the background only exhibit a small number of localizations, clusters within cells exhibit a higher proportion of larger clusters. (B) The dependence of the colocalization ratio p versus the lower cutoff to be considered a genuine cluster. A cutoff of 2 results in low ratios due to the inclusion of a large number of background red clusters, which interfere with the computation algorithm by excluding a large amount of colocalizations of the genuine clusters. While data on the stoichiometry in large protein clusters and macro-structures can be relevant, dual-color colocalization (DCC)-single molecule localization microscopy (SMLM) was developed to only resolve smaller oligomeric structures in situ as they are typically the smallest functional units of proteins. We therefore removed larger structures from further analysis. The number of clusters removed, however, was very low with typically more than 98% remaining (Figure 1—figure supplement 1).
Figure 5—figure supplement 1
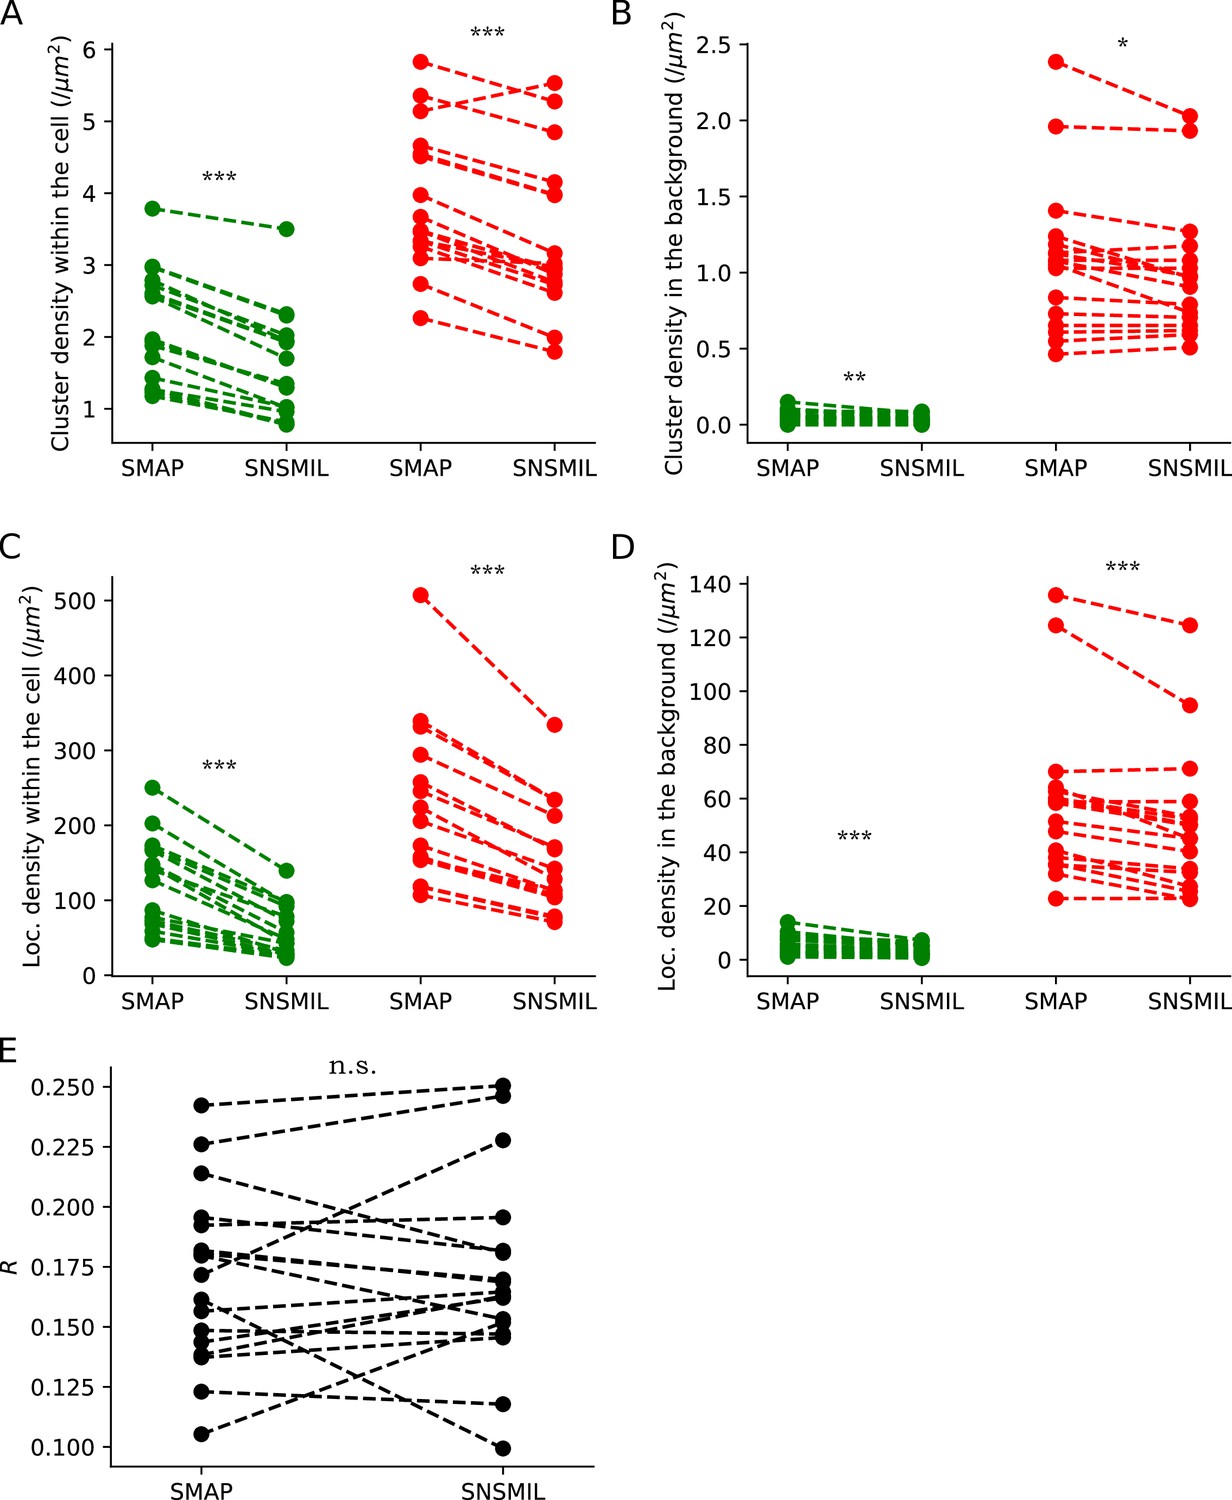
Comparison of localization extraction using two different softwares: SMAP and SNSMIL.
SMLM was recorded for mVenus and PAmCherry in HEK293T cells expressing barttin-mVenus-PAmCherry. N=17 recordings. Dashed lines connect the same recordings. (A and B) The cluster densities collected within the cell (A) and in the background (B), with green indicating the mVenus channel and red the PAmCherry channel. (C and D) The localization densities collected within the cell (C) and in the background (D). (E) Comparison of colocalization ratios (p) of mVenus and PAmCherry clusters collected within the cell (p = 0.82). Paired Student’s t-tests were used to compare SMAP and SNSMIL extractions, with *** indicating p<0.001, ** 0.001 ≤ p < 0.01, * 0.01 ≤ p < 0.05, n.s. p ≥ 0.05.
Tables
Table 1
Colocalization ratio (Pd) of mVenus clusters with PAmCherry clusters of fusion proteins fixed with PFA+GA or cold methanol.
| Protein | PFA +GA | Cold methanol | ||
|---|---|---|---|---|
| Pd | N | Pd | N | |
| ClC-2 | 0.215 | 19 | 0.237 | 32 |
| bClC-K | n/a | n/a | 0.241 | 15 |
| EAAT2 | n/a | n/a | 0.293 | 22 |
| Kcnj2 (Kir2.1) | 0.248 | 23 | 0.411 | 35 |
| SLC26A3 | n/a | n/a | 0.214 | 26 |
| Prestin | 0.176 | 27 | 0.251 | 33 |
| vGlut1 | 0.119 | 25 | 0.170 | 23 |
| vGlut2 | 0.111 | 25 | 0.165 | 25 |
| vGlut3 | 0.131 | 26 | 0.163 | 32 |
| sialin | n/a | n/a | 0.172 | 22 |
| barttin | 0.078 | 27 | 0.172 | 17 |
Table 2
The linkers used in the fusion of proteins of interest (POIs) to the fluorescent protein.
| Name | Amino acid sequence | Length (a.a.) |
|---|---|---|
| Linker #1 | GGSGG PSGLR SGSGG GSASG GSGS | 24 |
| Linker #2 | PPVGT ELGST | 10 |
| Linker #3 | GGSGG PGGSG GSPVG TELGS T | 21 |
| Linker #4 | GSGSG GGSAS GGSGS | 15 |
-
In this project two fusion patterns were tested: POI-Linker #1-PAmCherry-Linker #2-mVenus (r-g) and POI-Linker #3-mVenus-Linker #4-PAmCherry (g-r) (both written from the N- to C-terminus) with the following linker sequences.
Table 3
The settings used for single molecule localization microscopy (SMLM) imaging.
| Channel | FP | Excitation laser | Emission filter | Collection range |
|---|---|---|---|---|
| Green | mVenus | 514 nm @ 6.1/4.4 mW | FF01-485/537/627−25+FF03-525/50-25 | 526–546 nm |
| Red | PAmCherry | 561 nm @ 6.5/5.4 mW | FF01-609/57-25 | 580–537 nm |
-
The dichroic mirror Di01-R442/514/561−25x36 was used for imaging of both fluorescent proteins. All filters and dichroic mirrors were acquired from Semrock. The laser power was measured at the sample plane and before the rear entrance of the objective. The power of the 405 nm activation laser for PAmCherry was varied between 4.4 µW and 10.2 mW near the rear entrance, corresponding to 3.0 µW to 4.8 mW in the sample plane.
Key resources table
| Reagent type (species) or resource | Designation | Source or reference | Identifiers | Additional information |
|---|---|---|---|---|
| Cell line (Homo sapiens) | tsa201 (HEK293T) | ECACC via Sigma Aldrich | Cat# 96121229-1VL | |
| Cell line (Homo sapiens) | Flp-In T-Rex 293 | Thermo Fisher Scientific | Cat# R78007 | |
| Transfected construct (Homo sapiens) | SLC26A3 | 10.1074/jbc.M704924200 | GenBank:NM_000111 | |
| Transfected construct (Rattus norvegicus) | Slc26a5 (Prestin) | 10.1074/jbc.M704924200 | GenBank:NM_030840 | |
| Transfected construct (Homo sapiens) | ClC-2 | 10.1093/hmg/4.3.407 | Swiss-Prot:P51788 | With Y17H and R210H inserted to conform to 360 control chromosomes (Haug et al., 2003) |
| Transfected construct (Bos taurus) | bClC-K | This paper | Cloned from bovine kidney tissue | |
| Transfected construct (Homo sapiens) | EAAT2 | 10.1074/jbc.M110.187492 | ||
| Transfected construct (Mus musculus) | vGlut1 | Other | From Dr R Guzman, FZ Jülich. Carries a mutation of the di-leucin motif to alanine to facilitate plasma membrane insertion (see Eriksen et al., 2016) | |
| Transfected construct (Mus musculus) | vGlut2 | Other | From Dr R Guzman, FZ Jülich. Carries a mutation of the di-leucin motif to alanine to facilitate plasma membrane insertion (see Eriksen et al., 2016) | |
| Transfected construct (Mus musculus) | vGlut3 | Other | From Dr R Guzman, FZ Jülich. Carries a mutation of the di-leucin motif to alanine to facilitate plasma membrane insertion (see Eriksen et al., 2016) | |
| Transfected construct (Mus musculus) | Sialin | Other | From Dr R Guzman, FZ Jülich. Carries a mutation of the di-leucin motif to alanine to facilitate plasma membrane insertion (see Eriksen et al., 2016) | |
| Transfected construct (Homo sapiens) | Barttin | 10.1097/HJH.0b013e3283140c9e | GenBank:NM_057176 | Obtained via Dr AL George |
| Transfected construct (Homo sapiens) | Kir2.1 | 10.1073/pnas.102609499 | Obtained via Prof. Dr J Daut | |
| Other | TetraSpeck fluorescent beads (100 nm) | Thermo Fisher Scientific | Cat# T7279 | Fluorescent microspheres used for the correction of drift and chromatic aberration, as well as for the general calibration of the microscope |
Additional files
Download links
A two-part list of links to download the article, or parts of the article, in various formats.
Downloads (link to download the article as PDF)
Open citations (links to open the citations from this article in various online reference manager services)
Cite this article (links to download the citations from this article in formats compatible with various reference manager tools)
Determination of oligomeric states of proteins via dual-color colocalization with single molecule localization microscopy
eLife 11:e76631.
https://doi.org/10.7554/eLife.76631


