Fam49b dampens TCR signal strength to regulate survival of positively selected thymocytes and peripheral T cells
- Department of Pathology, The Johns Hopkins University School of Medicine, United States
- Department of Pharmaceutics, College of Pharmacy, Chungbuk National University, Republic of Korea
- Department of Nutritional Sciences and Toxicology, University of California,Berkeley, United States
- Department of Molecular and Cell Biology, University of California, Berkeley, United States
Figures
Figure 1 with 1 supplement
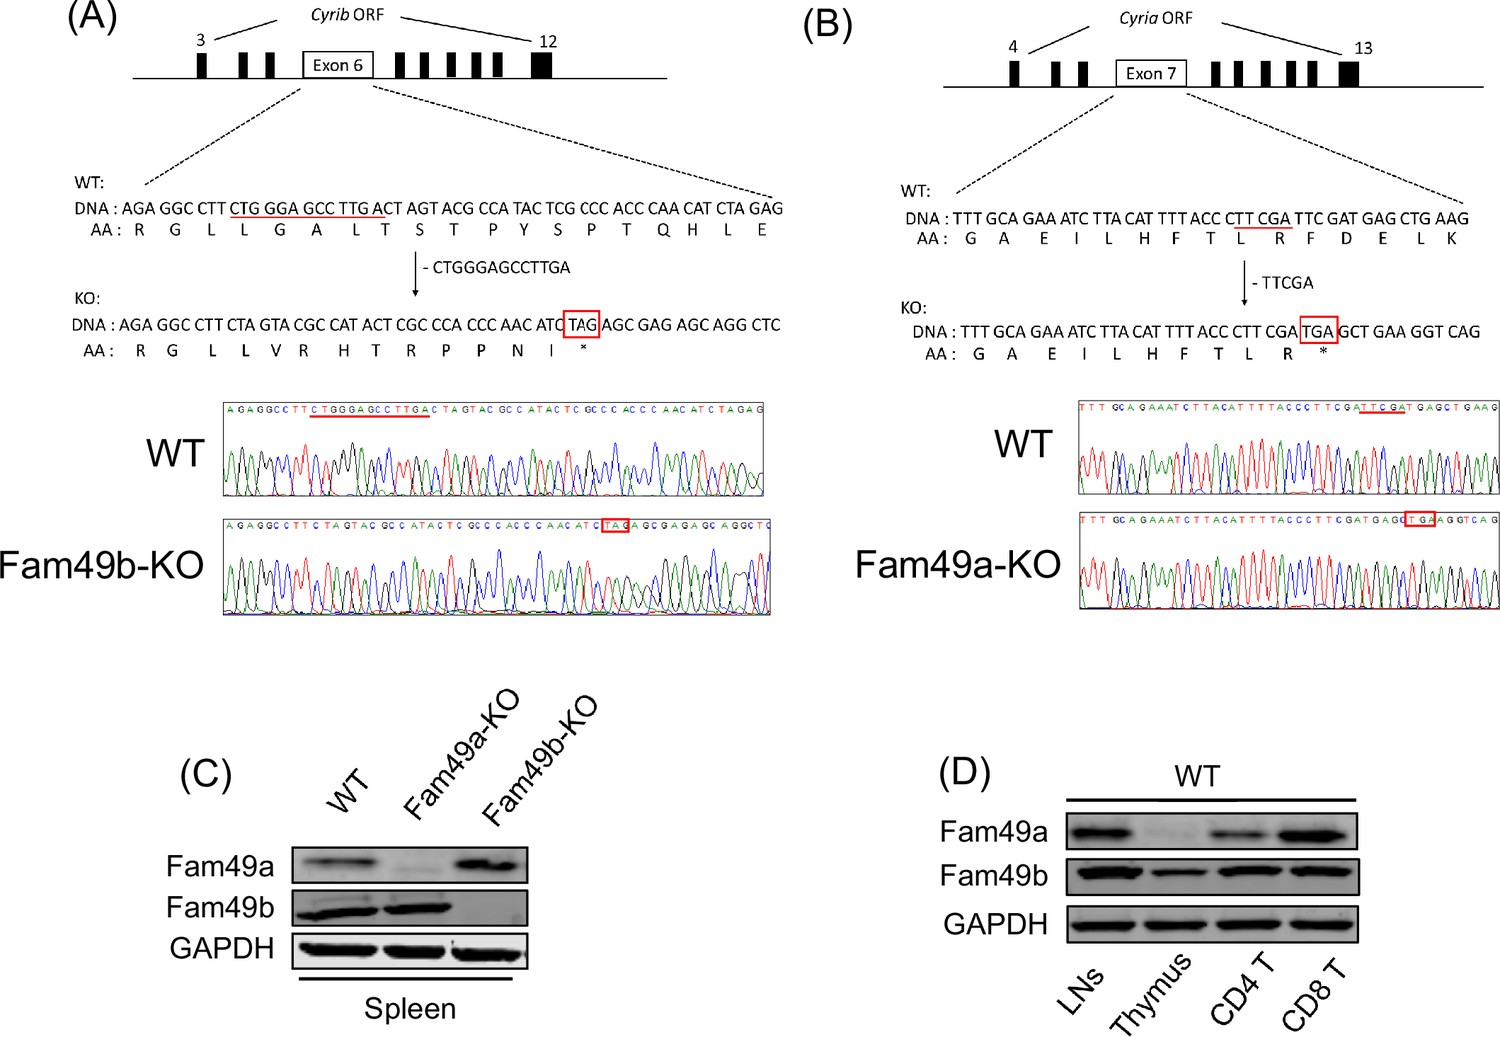
Generation of Family with sequence similarity 49 member A (Fam49a)-KO and Family with sequence similarity 49 member B (Fam49b)-KO mice with CRISPR/Cas9 and expression of Fam49a and Fam49b in mice.
(A) Schematic diagram depicting the locations of guide RNAs (gRNAs) targeting the Fam49b (Upper). Representative Sanger sequencing chromatograms confirmed the genotype of Fam49b-KO mice (Lower). Red underline above the chromatograms indicates the deletion (5 bp) and pre-mature stop codon sequences are in red boxes. See also Figure 1—source data 1. (C) Immunoblot analysis of Fam49a and Fam49b expression in spleen from wild-type (WT), Fam49a-KO mice, and Fam49b-KO mice. Fam49a antibody (Sigma, SAB 1103179) is specific for an epitope mapping between amino acids 56–70 near the N-terminus of the human Fam49a molecule. Fam49b antibody (Santa Cruz, D-8) is specific for an epitope mapping between amino acids 8–20 near the N-terminus of human Fam49b molecule. The data are representative of three independent experiments. See also Figure 1—source data 2. (D) Immunoblot analysis of Fam49a and Fam49b expression in lymph nodes, thymus, and peripheral CD4 T cells, and peripheral CD8 T cells from WT mice. The data are representative of three independent experiments. See also Figure 1—source data 2.
-
Figure 1—source data 1
Sanger sequencing for CYFIP Related Rac1 Interactor A (Cyria) and CYFIP Related Rac1 Interactor B (Cyrib).
- https://cdn.elifesciences.org/articles/76940/elife-76940-fig1-data1-v1.zip
-
Figure 1—source data 2
Immunoblot for Family with sequence similarity 49 member A (Fam49a) (Cyria) and Family with sequence similarity 49 member B (Fam49b) (Cyrib).
- https://cdn.elifesciences.org/articles/76940/elife-76940-fig1-data2-v1.zip
Figure 1—figure supplement 1
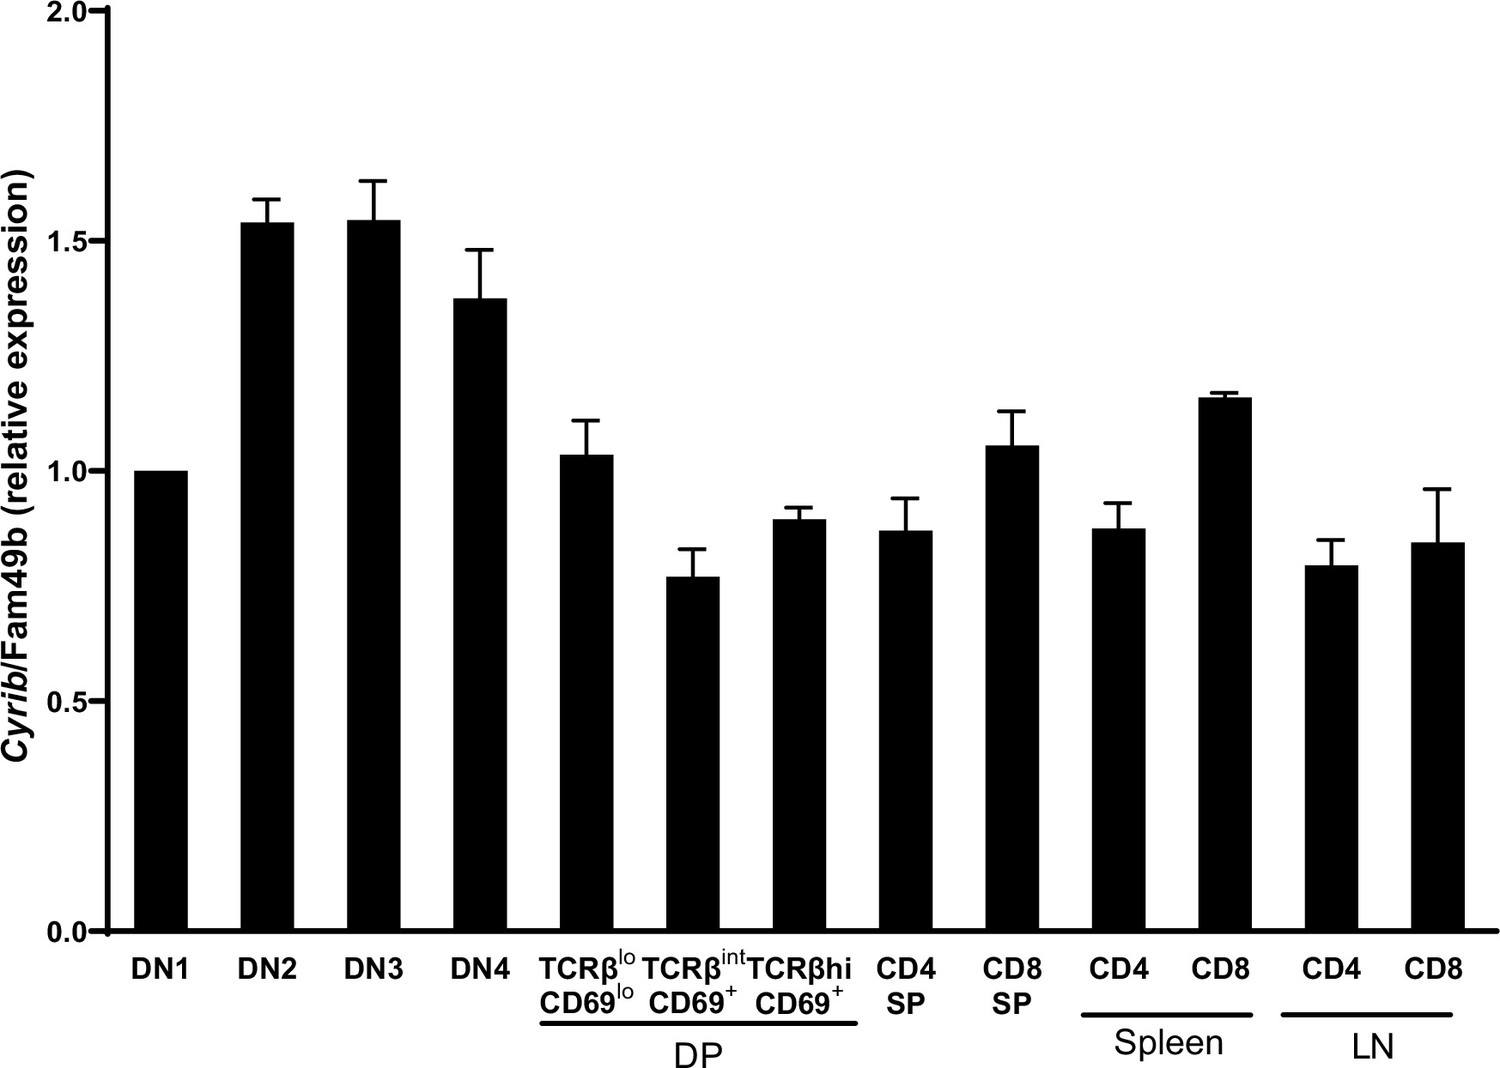
Family with sequence similarity 49 member B (Fam49b) expression in thymocyte subsets and T cells from wild-type (WT) mice.
(A) Cyrib/Fam49b mRNA expression analyzed by real-time RT-PCR of FACS-sorted subset of WT thymocytes and peripheral T cells. Data shown relative to β actin expression. Error bars denote SEM. Data are pooled from two independent experiments. See also Figure 1—figure supplement 1—source data 1.
-
Figure 1—figure supplement 1—source data 1
The numerical data used to generate the Figure 1—figure supplement 1.
- https://cdn.elifesciences.org/articles/76940/elife-76940-fig1-figsupp1-data1-v1.xlsx
Figure 2
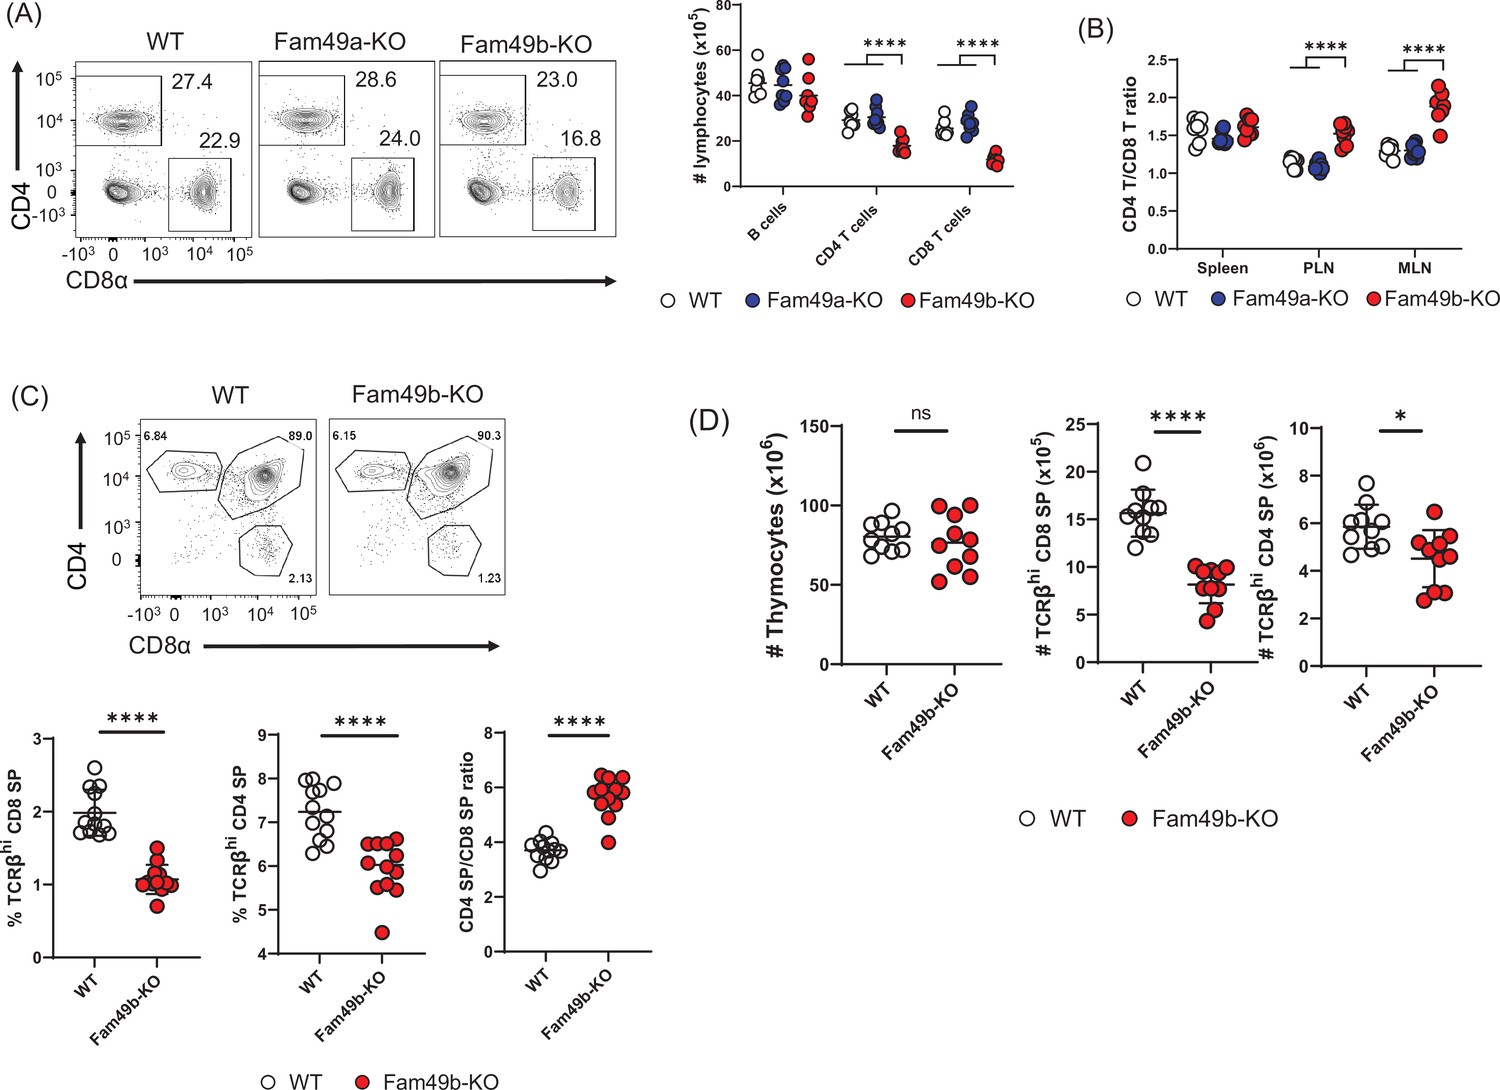
Reduced T cell numbers in Family with sequence similarity 49 member B (Fam49b)-KO mice, but not Family with sequence similarity 49 member A (Fam49a)-KO mice.
(A) Flow cytometry profiles of the expression of CD4 and CD8 (left) and the absolute number of lymphocytes in peripheral lymph nodes (right) from wild-type WT, Fam49a-KO, and Fam49b-KO mice. Numbers adjust to outlined areas indicate percentage of T cells among total lymphocytes. We used B220 as B cell marker. Each dot represents an individual mouse. Small horizontal lines indicate the mean of 8 mice. ****p<0.0001 (One-way ANOVA). Data are representative of four experiments. See also Figure 2—source data 1. (B) Ratio of CD4 T cells over CD8 T cells in spleen, peripheral lymph nodes, and mesenteric lymph node in WT, Fam49a-KO, and Fam49b-KO mice. Each dot represents an individual mouse. Small horizontal lines indicate the mean of 8 mice. ****p<0.0001 (One-way ANOVA). Data are representative of four experiments. See also Figure 2—source data 1. (C) Flow cytometry analyzing the expression of CD4 and CD8 in thymocytes. Contour plots show percentage of CD8 SP and CD4 SP in total thymocytes (upper). Percentage of TCRβ+ CD8 SP in total thymocytes (lower left), and TCRβ+ CD4 SP in total thymocytes (lower middle), and ratio of TCRβ+ CD4 SP cells over TCRβ+ CD8 SP was shown (lower right). Each dot represents an individual mouse. Small horizontal lines indicate the mean of 10 mice. ****p<0.0001 (Mann-Whitney test). Data are representative of three experiments. See also Figure 2—source data 1. (D) Quantification of cell numbers of total thymocytes (left), TCRβ+ CD8 SP (middle), and TCRβ+ CD4 SP (right). Small horizontal lines indicate the mean of 10 mice. *p=0.0124 and ****p<0.0001 (Mann-Whitney test). Data are representative of three experiments. See also Figure 2—source data 1.
-
Figure 2—source data 1
The numerical data used to generate the Figure 2.
- https://cdn.elifesciences.org/articles/76940/elife-76940-fig2-data1-v1.xlsx
Figure 3 with 4 supplements
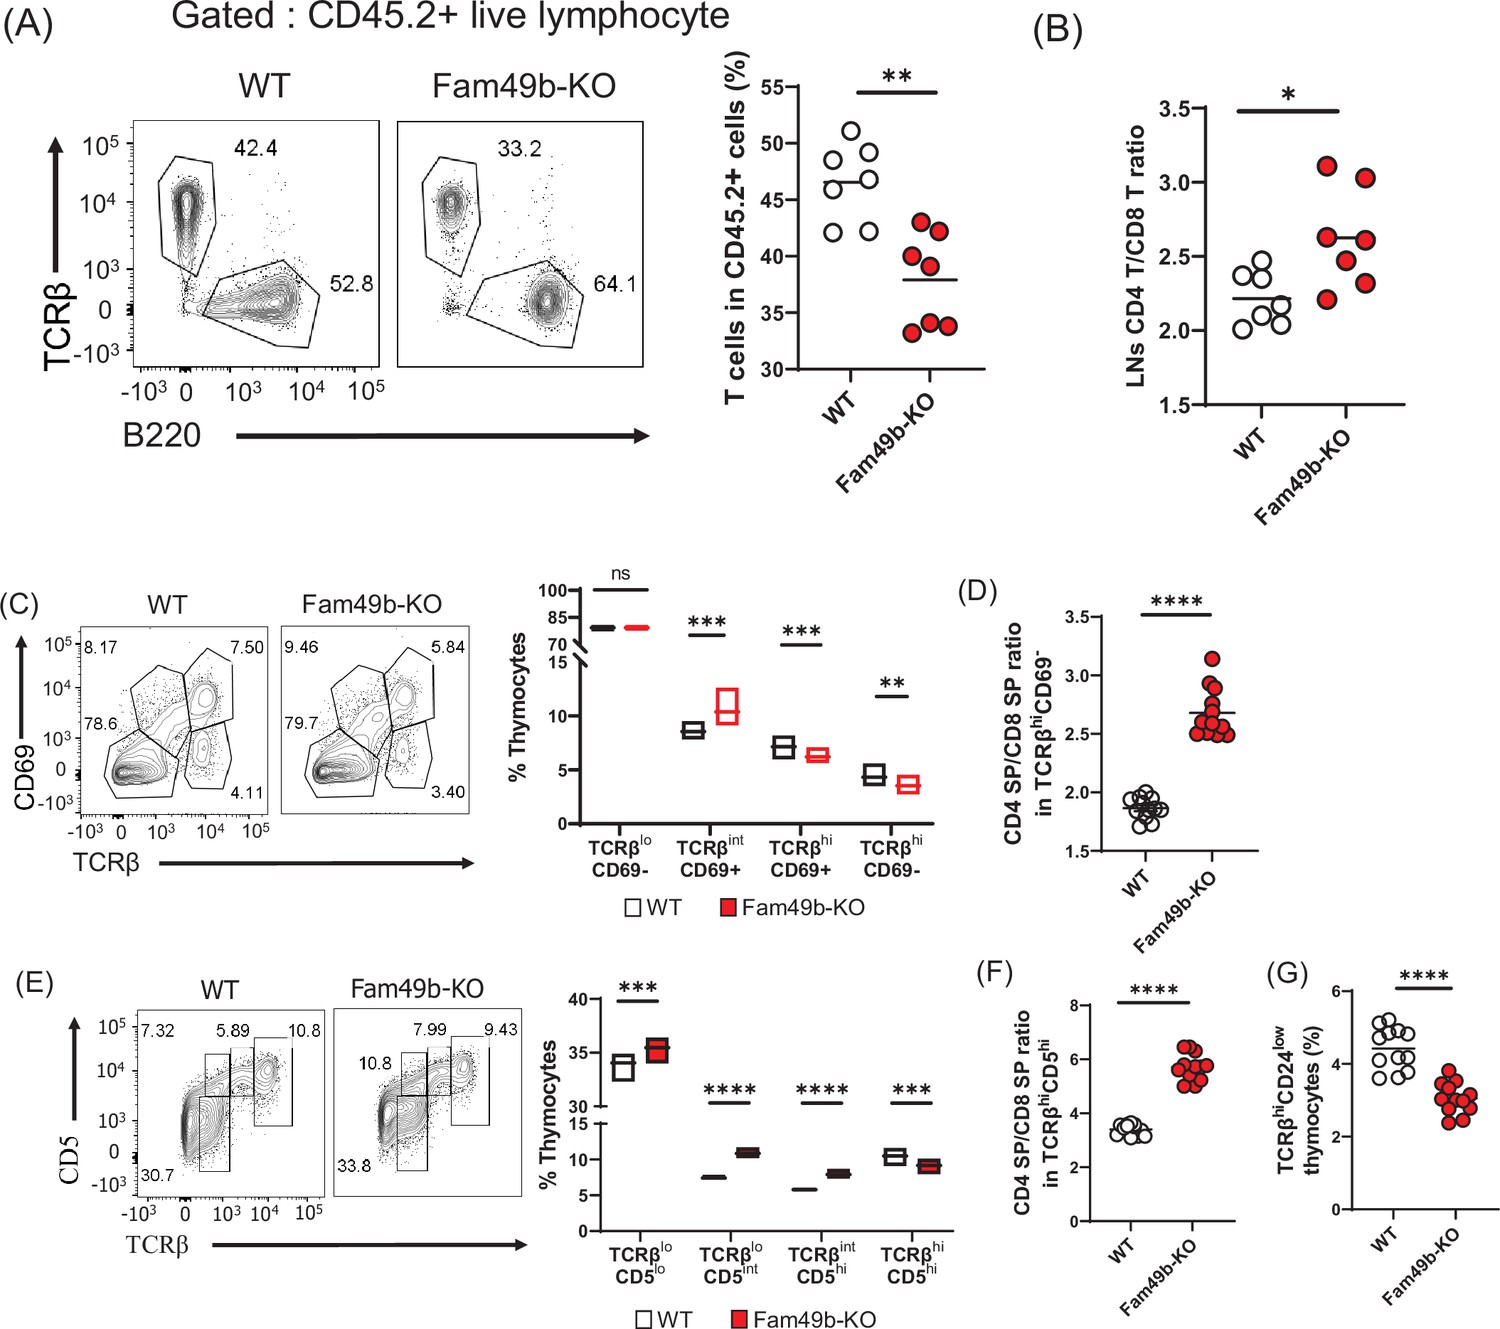
Defective thymic development in Family with sequence similarity 49 member B (Fam49b)-KO mice.
(A) Expression of TCRβ and B220 expressing cells (left) and frequency of TCRβ expressing cells among CD45.2+ total lymph node cells from bone marrow chimera mice (right). Bone marrow from either wild-type (WT) or Fam49b-KO mice was injected i.v. into lethally irradiated CD45.1+ WT mice and chimeric mice were analyzed 8 weeks later. Small horizontal lines indicate the mean of 7 mice. **=0.0047 (Mann-Whitney test). Data are pooled from two independent experiments. See also Figure 3—source data 1. (B) Ratio of CD4 T cells over CD8 T cells in CD45.2+ total lymph node cells from bone marrow chimera mice. Bone marrow from either WT or Fam49b-KO mice was injected i.v. into lethally irradiated CD45.1+ WT mice and chimeric mice were analyzed 8 weeks later. Small horizontal lines indicate the mean of 7 mice. *p=0.0192 (Mann-Whitney test). Data are pooled from two independent experiments. See also Figure 3—source data 1. (C) (left) Differential surface expression of CD69 and TCRβ was used to identify thymocyte population of different maturity in WT and Fam49b-KO mice. (right) Dot Plots show percentages of different thymocyte subpopulations in WT and Fam49b-KO mice. Numbers adjust to outlined areas indicate percentage of thymocytes subset among total thymocytes. Floating bars (min to max). horizontal lines indicate the mean of 12 mice. **p=0.0038 and ***p=0.0003 and ***p=0.0001 (Mann-Whitney test). Data are representative of five experiments. See also Figure 3—source data 1. (D) Ratio of CD4 single positive (SP) cells over CD8 SP cells in TCRβhiCD69- thymocyte subpopulation. horizontal lines indicate the mean of 12 mice. ****p<0.0001 (Mann-Whitney test). Data are representative of five experiments. See also Figure 3—source data 1. (E) (left) Differential surface expression of CD5 and TCRβ was used to identify thymocyte population of different maturity in WT and Fam49b-KO mice. (right) Dot Plots show percentages of different thymocyte subpopulations from mice. Numbers adjust to outlined areas indicate percentage of thymocytes subset among total thymocytes. Floating bars (min to max). Horizontal lines indicate the mean of 12 mice. ***p=0.0005 and ***p=0.0002 and ****p<0.0001 (Mann-Whitney test). Data are representative of five experiments. See also Figure 3—source data 1. (F) Ratio of CD4 SP cells over CD8 SP cells in TCRβhiCD5hi thymocyte subpopulation. Small horizontal lines indicate the mean of 12 mice. ****p<0.0001 (Mann-Whitney test). Data are representative of five experiments. See also Figure 3—source data 1. (G) Frequency of TCRβhiCD24low thymocyte subpopulation among total live thymocytes. Small horizontal lines indicate the mean of 12 mice. ****p<0.0001 (Mann-Whitney test). Data are representative of five experiments. See also Figure 3—source data 1.
-
Figure 3—source data 1
The numerical data used to generate the Figure 3.
- https://cdn.elifesciences.org/articles/76940/elife-76940-fig3-data1-v1.xlsx
Figure 3—figure supplement 1
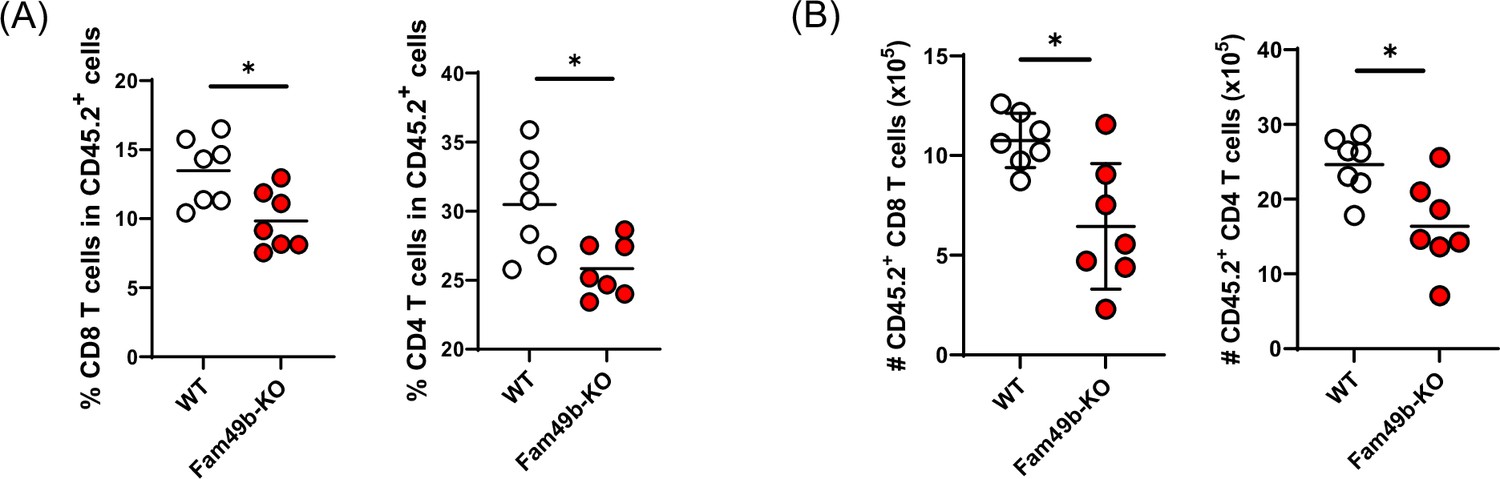
Lower frequencies and numbers of T cells in Family with sequence similarity 49 member B (Fam49b)-KO chimera mice.
(A) Frequency of CD8 T cells (left) or CD4 T cells (right) among CD45.2+ total lymph node cells from bone marrow chimera mice. Bone marrow from either wild-type (WT) or Fam49b-KO mice was injected i.v. into lethally irradiated CD45.1+ WT mice and chimeric mice were analyzed 8 weeks later. Small horizontal lines indicate the mean of 7 mice. **p=0.0262 (Mann-Whitney test). Data are pooled from two independent experiments. See also Figure 3—figure supplement 1—source data 1. (B) Absolute numbers of CD45.2+CD8 T cells (left) or CD45.2+CD4 T cells (right) in lymph node cells from bone marrow chimera mice. Bone marrow from either WT or Fam49b-KO mice was injected i.v. into lethally irradiated CD45.1+ WT mice and chimeric mice were analyzed 8 weeks later. Small horizontal lines indicate the mean of 7 mice. **=0.0102 or 0.0114 (Mann-Whitney test). Data are pooled from two independent experiments. See also Figure 3—figure supplement 1—source data 1.
-
Figure 3—figure supplement 1—source data 1
The numerical data used to generate the Figure 3—figure supplement 1.
- https://cdn.elifesciences.org/articles/76940/elife-76940-fig3-figsupp1-data1-v1.xlsx
Figure 3—figure supplement 2
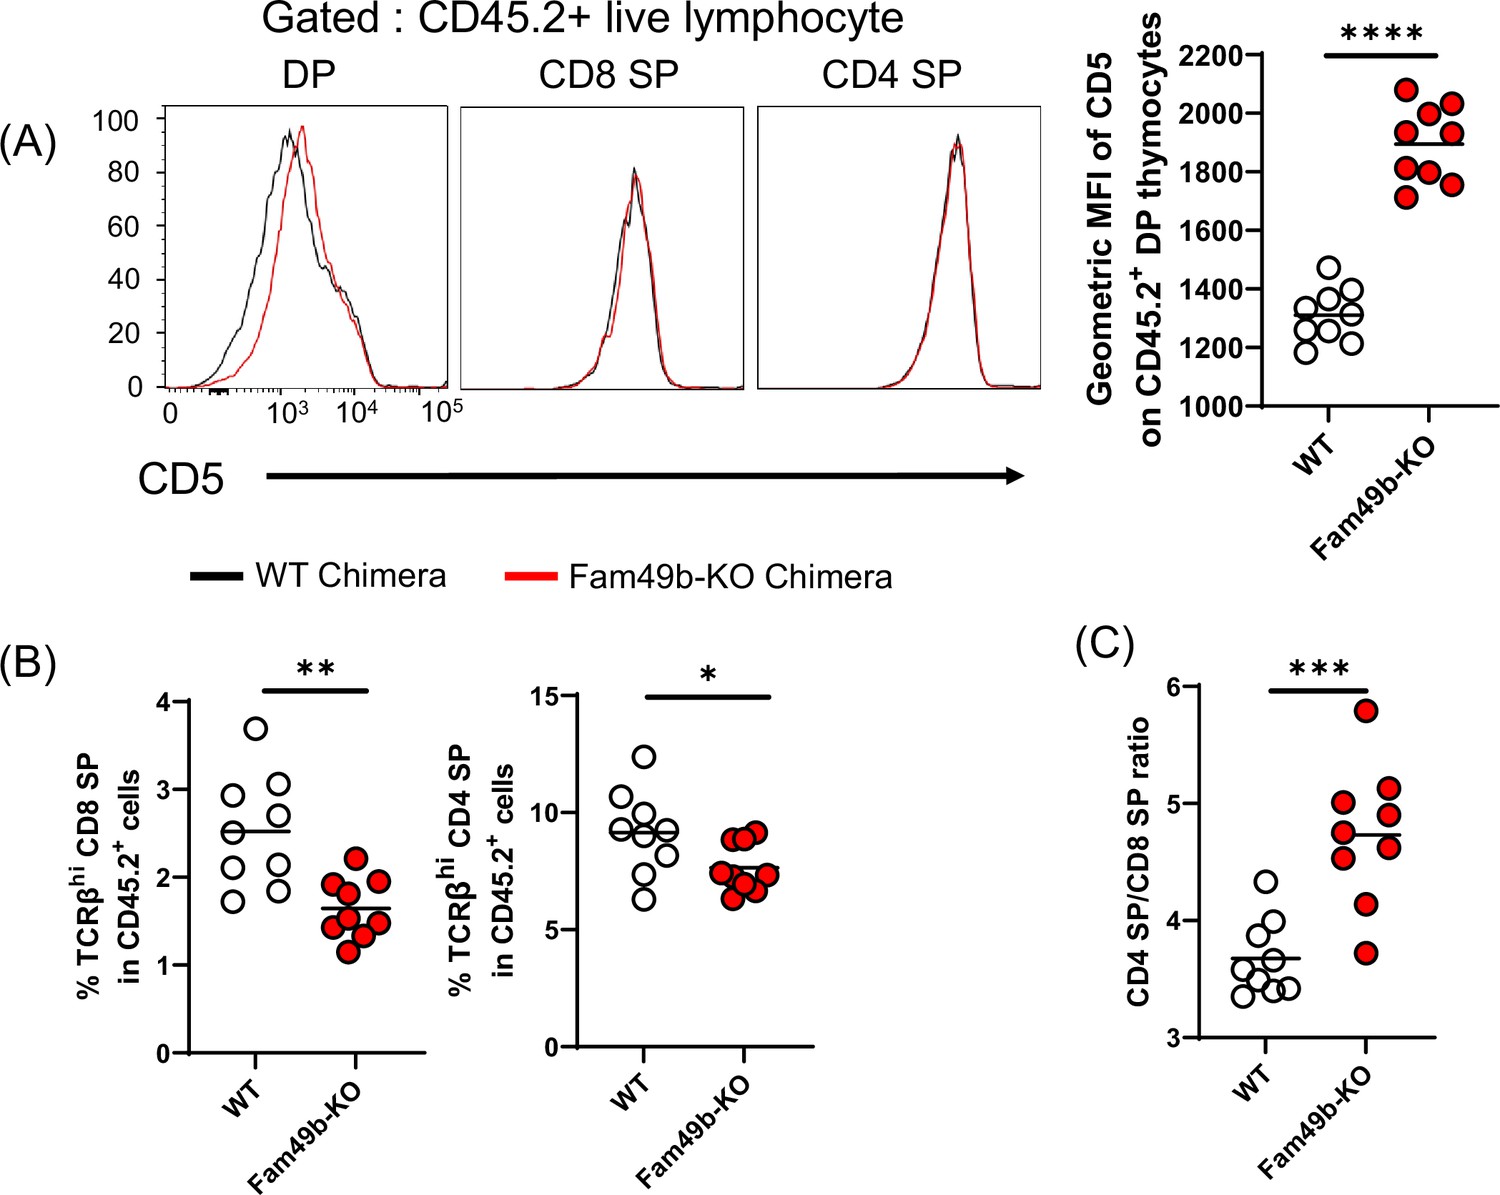
Analyzing thymocytes in Family with sequence similarity 49 member B (Fam49b)-KO chimera mice.
(A) Expression of activation marker CD5 on double positive (DP), TCRβhi CD8 single positive (SP), and TCRβhi CD4 SP thymocytes from wild-type (WT) chimera and Fam49b-KO chimera mice (left). Geometric MFI of CD5 on DP thymocytes (right). Small horizontal lines indicate the mean of 9 mice. ****p<0.0001 (Mann-Whitney test). Data are representative of two experiments. See also Figure 3—figure supplement 2—source data 1. (B) Percentage of TCRβhi CD8 SP in total CD45.2+ thymocytes (left), and TCRβhi CD4 SP in total CD45.2+ thymocytes (left) and ratio of TCRβhi CD4 SP cells over TCRβhi CD8 SP in total thymocytes (right) was shown from WT chimera and Fam49b-KO chimera mice. Each dot represents an individual mouse. Small horizontal lines indicate the mean of 9 mice. *p=0.049 and **p=0.0034 (Mann-Whitney test). Data are representative of two experiments. See also Figure 3—figure supplement 2—source data 1. (C) Ratio of TCRβhi CD4 SP cells over TCRβhi CD8 SP in total thymocytes (right) was shown from WT chimera and Fam49b-KO chimera mice. Each dot represents an individual mouse. Small horizontal lines indicate the mean of 9 mice. ***p=0.005 (Mann-Whitney test). Data are representative of two experiments. See also Figure 3—figure supplement 2—source data 1.
-
Figure 3—figure supplement 2—source data 1
The numerical data used to generate the Figure 3—figure supplement 2.
- https://cdn.elifesciences.org/articles/76940/elife-76940-fig3-figsupp2-data1-v1.xlsx
Figure 3—figure supplement 3
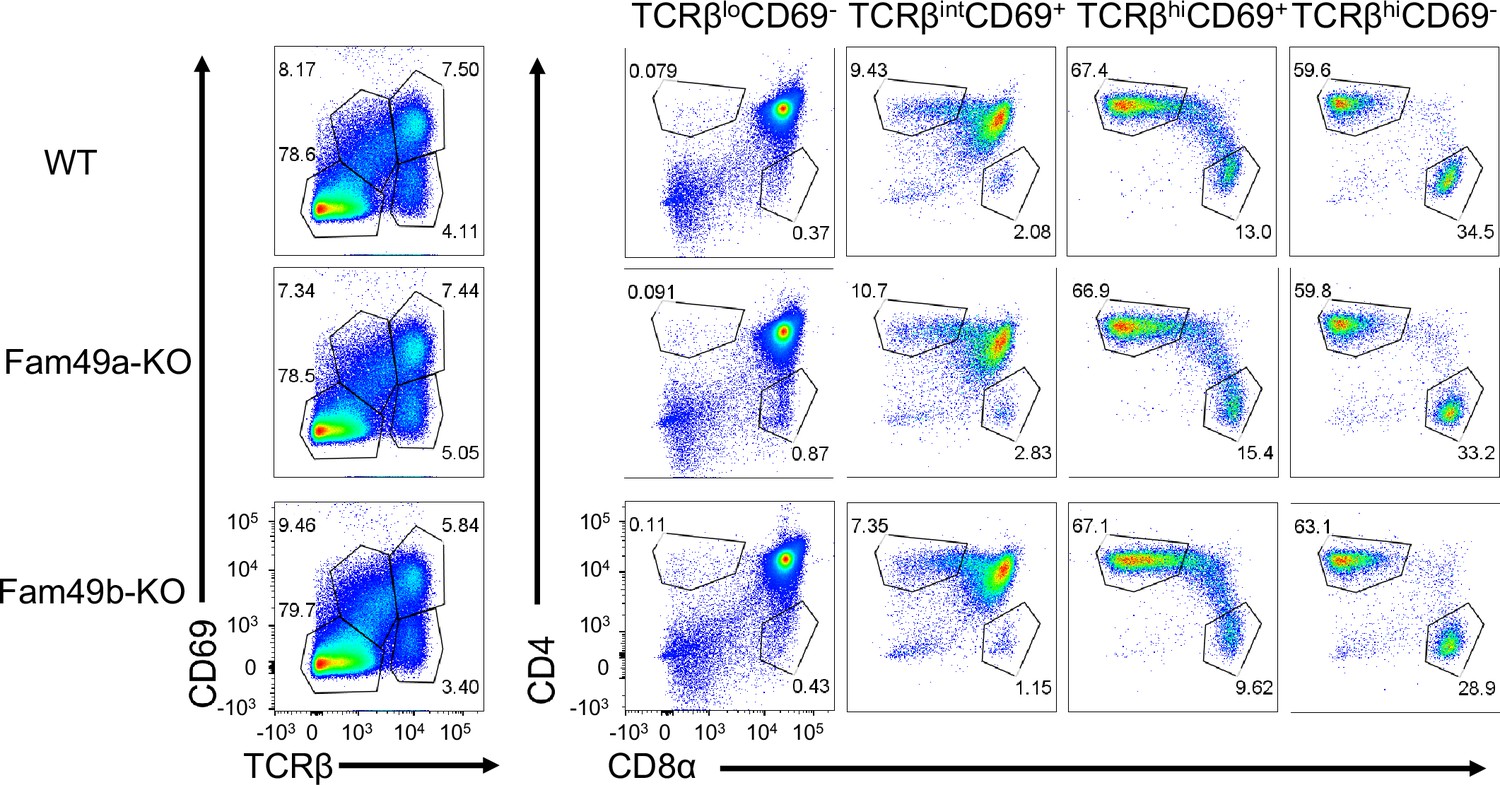
Analyzing thymic selection using TCRβ and CD69 expression in thymus.
Representative flow cytometry plot showing TCRβ and CD69 expression (left) in total thymocytes from wild-type (WT), Family with sequence similarity 49 member A (Fam49a)-KO, and Fam49b-KO mice. Numbers indicate percentage of CD4 single positive (SP) or CD8 SP (right) from TCRβ by CD69 profile gated (left). Data are representative of five experiments.
Figure 3—figure supplement 4
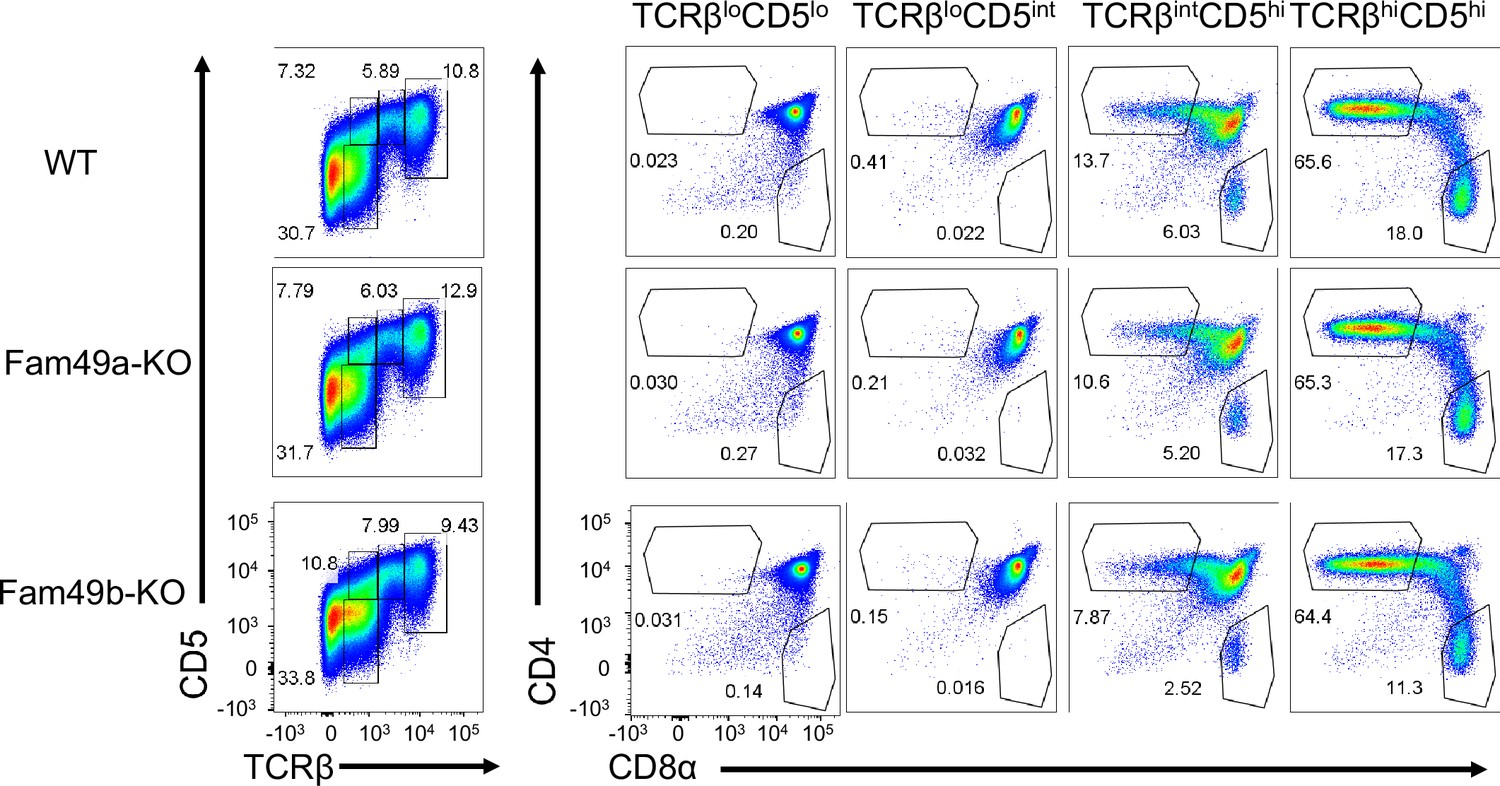
Analyzing thymic selection using TCRβ and CD5 expression in thymus.
Representative flow cytometry plot showing TCRβ and CD5 expression (left) in total thymocytes from wild-type (WT), Family with sequence similarity 49 member A (Fam49a)-KO, and Fam49b-KO mice. Numbers indicate percentage of CD4 single positive (SP) or CD8 SP (right) from TCRβ by CD5 profile gated (left). The Data are representative of five experiments.
Figure 4 with 1 supplement
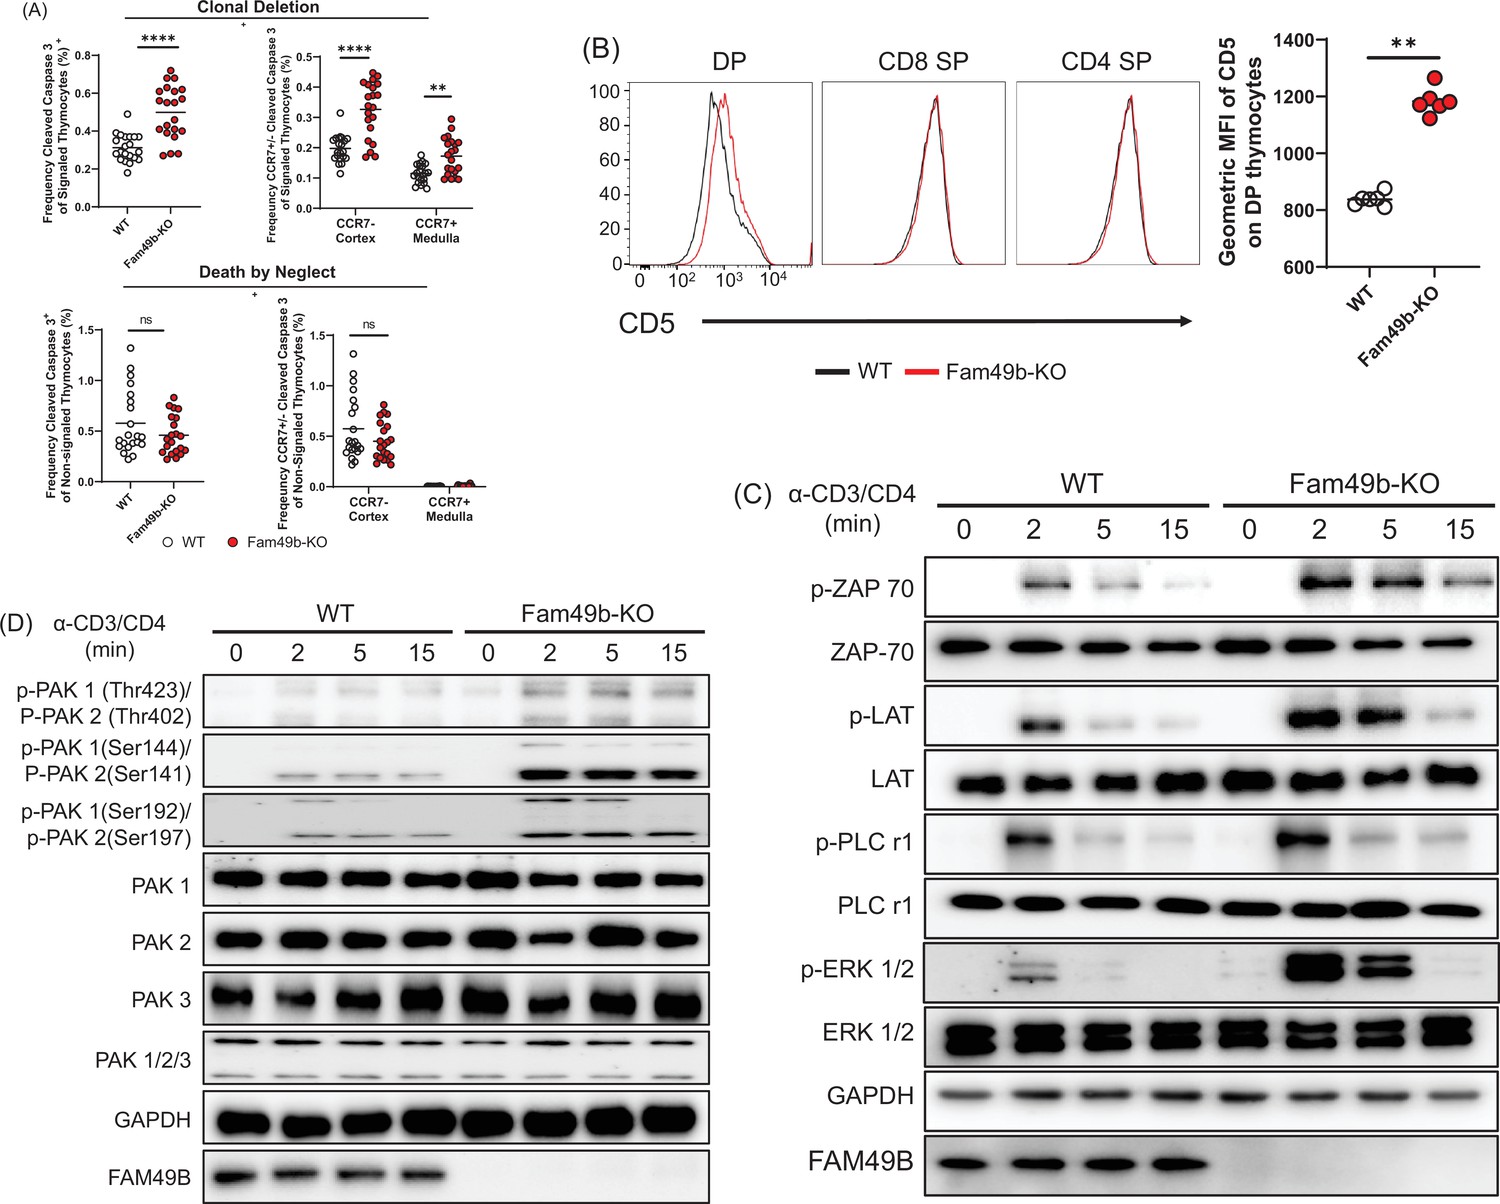
Enhanced negative selection due to elevated T cell receptor (TCR) signaling in Family with sequence similarity 49 member B (Fam49b)-KO thymocytes.
(A) Frequency of cleaved caspase 3+ cells among TCRβhiCD5hi (Signaled, upper left) and TCRβ-CD5- (Non-signaled, lower left) thymocytes. Frequency of CCR7+ cleaved caspase 3+ and CCR7- cleaved caspase 3+ cells among TCRβhiCD5hi (Signaled, upper right) and TCRβ-CD5- (Non-signaled, lower right) thymocytes. Small horizontal lines indicate the mean of 21 mice. **p=0.0017 and ****p<0.0001 (Mann-Whitney test). Data are pooled from three independent experiments. See also Figure 4—source data 1. (B) Expression of activation marker CD5 on double positive (DP), TCRβ+ CD4 single positive (SP), and TCRβ+ CD8 SP thymocytes from WT and Fam49b-KO mice (left). Geometric MFI of CD5 on DP thymocytes (right). Small horizontal lines indicate the mean of 6 mice. **p=0.0022 (Mann-Whitney test). Data are representative of seven experiments. See also Figure 4—source data 1. (C) Immunoblot analysis of TCR cascade component activation in total thymocytes from WT or Fan49b-KO mice. Total thymocytes were stimulated with soluble anti-CD3ε and anti-CD4 antibodies for the times indicated. The data are representative of three independent experiments. See also Figure 4—source data 2. (D) Immunoblot analysis of PAK cascade component activation in total thymocytes from WT or Fan49b-KO mice. The data are representative of four independent experiments. See also Figure 4—source data 3.
-
Figure 4—source data 1
The numerical data used to generate the Figure 4.
- https://cdn.elifesciences.org/articles/76940/elife-76940-fig4-data1-v1.xlsx
-
Figure 4—source data 2
Immunoblot for T cell receptor (TCR) signaling.
- https://cdn.elifesciences.org/articles/76940/elife-76940-fig4-data2-v1.zip
-
Figure 4—source data 3
Immunoblot for PAK signaling.
- https://cdn.elifesciences.org/articles/76940/elife-76940-fig4-data3-v1.zip
Figure 4—figure supplement 1
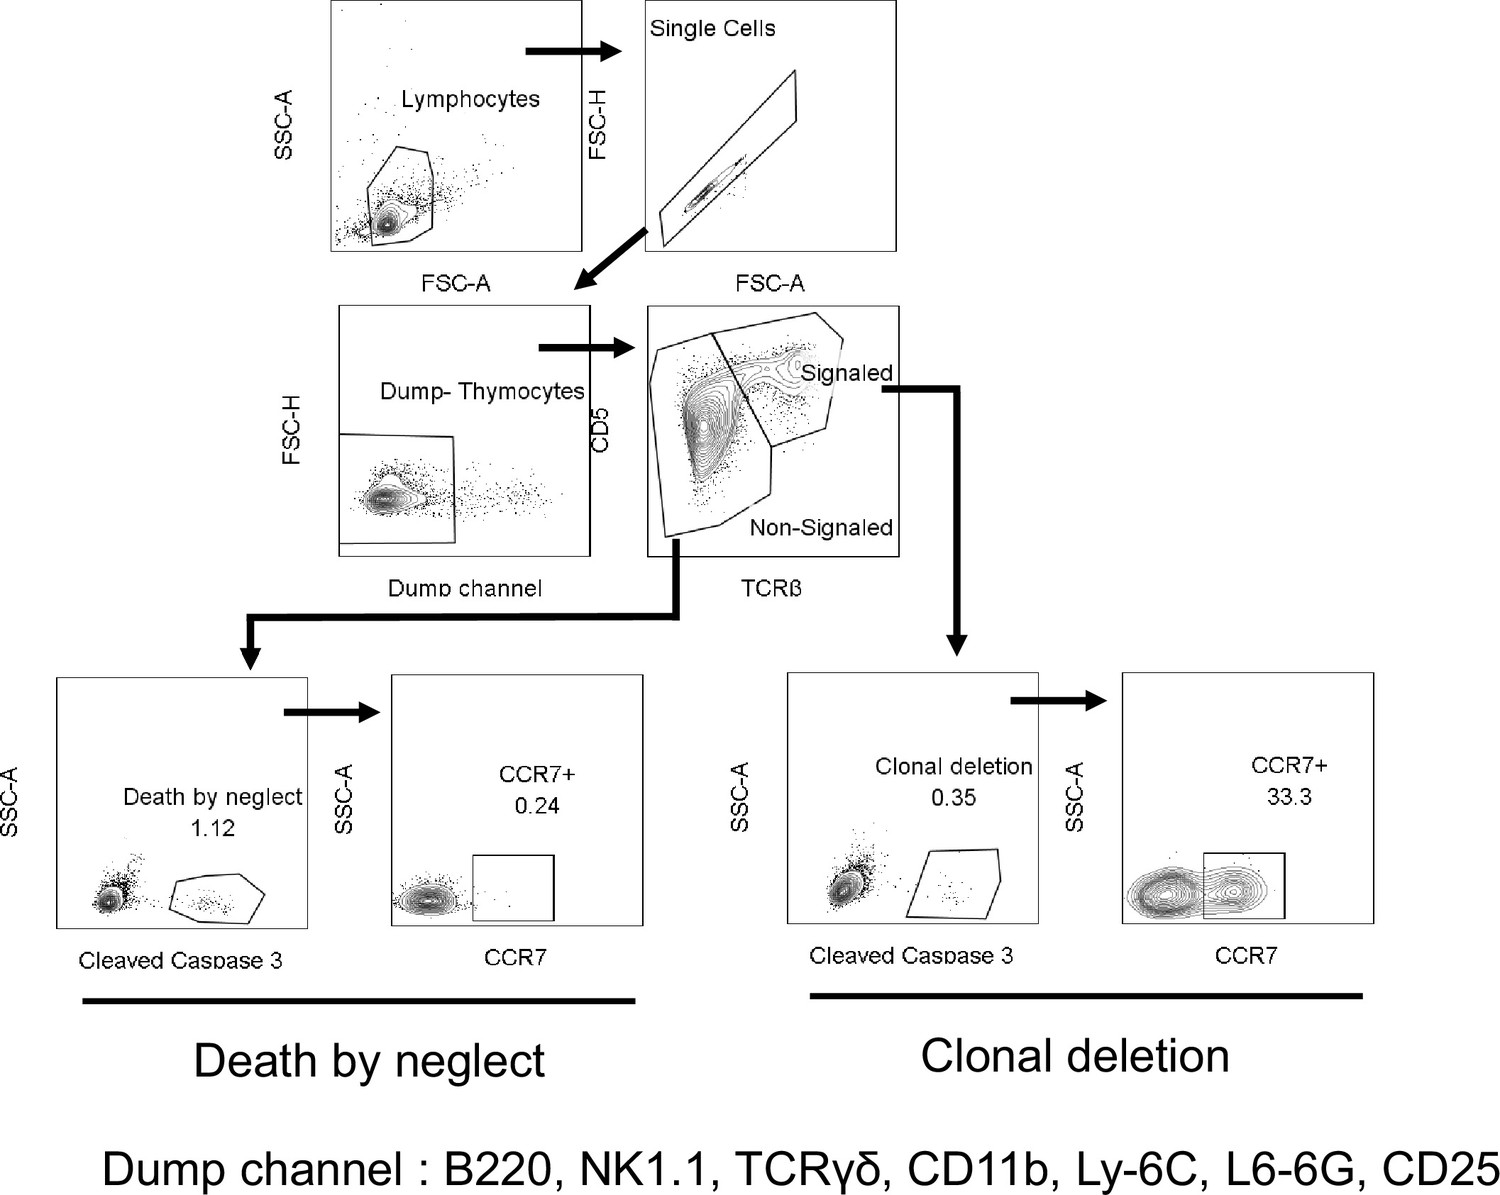
Flow cytometry gating strategies to measure clonal deletion and death by neglect.
Signaled and Non-signaled thymocytes identified by TCRβ and CD5 expression, excluding B220+, NK1.1+, TCRγδ+, CD11b+, Ly-6C+, Ly-6G+, CD25+ (Dump) cells. Clonal deletion and death by neglect identified by intracellular Cleaved Caspase 3 and anatomic location identified by CCR7. Numbers indicate percentage of cells in each.
Figure 5 with 1 supplement
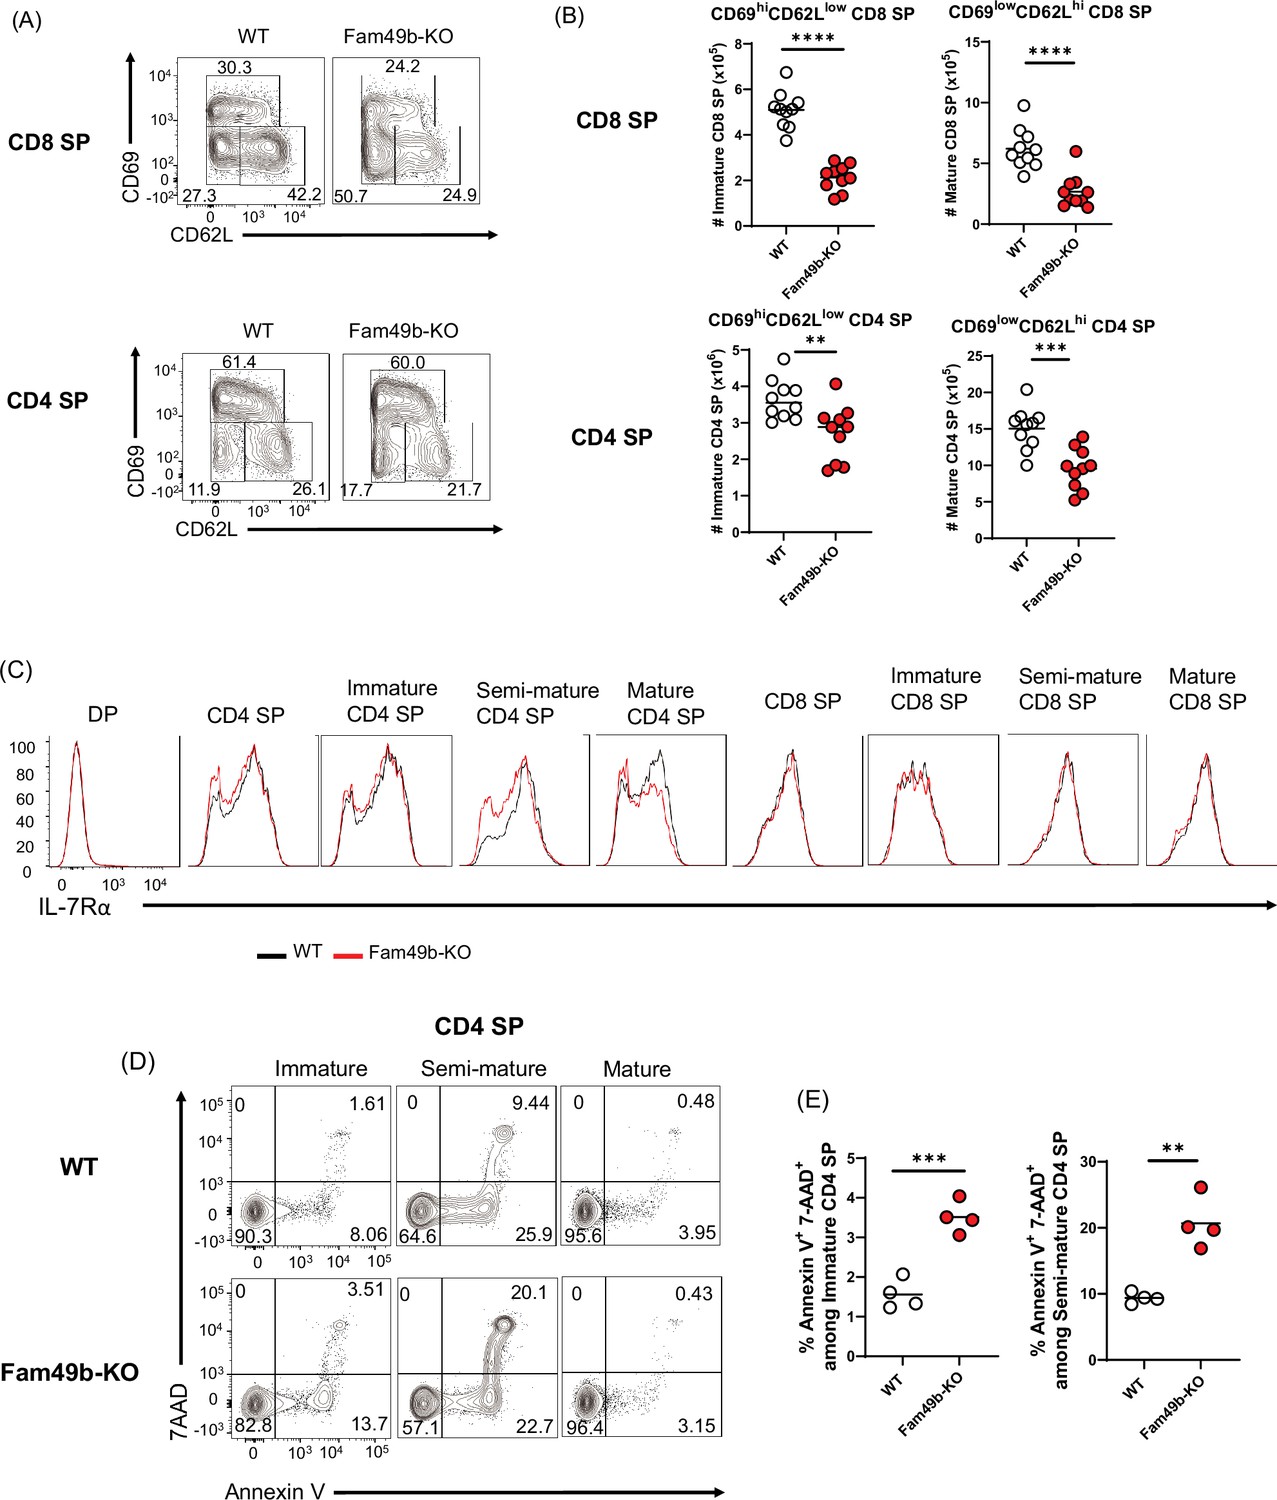
Elevated apoptosis in Family with sequence similarity 49 member B (Fam49b)-KO single positive (SP) thymocytes.
(A) Frequencies of immature (CD62LloCD69hi), semi-mature (CD62loCD69lo), and mature (CD62hiCD69lo) in the TCRβhi CD8 SP (upper) and TCRβhi CD4 SP thymocytes (lower) from wild-type (WT) and Fam49b-KO mice. Numbers adjust to outlined areas indicate percentage of each population among total SP TCRβ+ thymocytes. Shown are representative data of ten mice per genotype. (B) Quantification of cell numbers of immature and mature fraction in TCRβhi CD8 SP thymocytes (upper) and TCRβhi CD4 SP thymocytes (lower). Each dot represents an individual mouse. Horizontal lines indicate the mean of 10 mice. **p=0.0069 and ***p=0.0004 and ****p<0.0001 (Mann-Whitney test). Data are representative of three experiments. See also Figure 5—source data 1 (C) Decreased expression of IL-7Rα on double positive (DP), total CD4 SP, immature CD4 SP, semi-mature CD4 SP, mature CD4 SP, total CD8 SP, immature CD8 SP, semi-mature CD8 SP, and mature CD8 SP thymocytes from WT and Fam49b-KO mice. Shown are representative data of ten mice per genotype. (D) Apoptosis detected using 7AAD/Annexin V staining in freshly isolated Immature (CD62LloCD69hi), semi-mature (CD62loCD69lo), and mature (CD62hiCD69lo) TCRβhi CD4 SP thymocytes from WT (upper) and Fam49b-KO mice (lower). Shown are representative data of two independent experiments. (E) Frequency of 7AAD+ and Annexin V+ cells among immature CD4 SP (left) and semi-mature CD4 SP (right) thymocytes from WT and Fam49b-KO mice. Small horizontal lines indicate the mean of 4 mice. **p=0.0084 and ***p=0.0004 (Mann-Whitney test). Data are pooled from two independent experiments. See also Figure 5—source data 1.
-
Figure 5—source data 1
The numerical data used to generate the Figure 5.
- https://cdn.elifesciences.org/articles/76940/elife-76940-fig5-data1-v1.xlsx
Figure 5—figure supplement 1
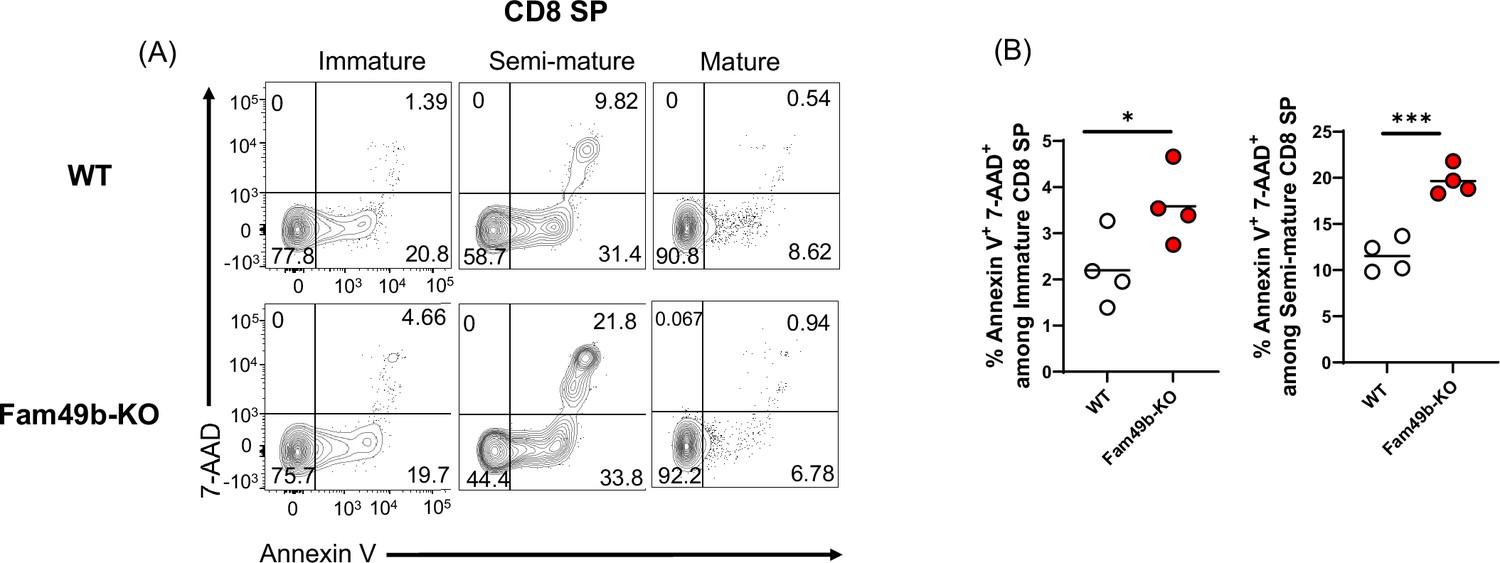
Elevated apoptosis in Family with sequence similarity 49 member B (Fam49b)-KO CD8 single positive (SP) thymocytes and peripheral T cells.
(A) Apoptosis detected using 7AAD/Annexin V staining in freshly isolated immature (CD62LloCD69hi), semi-mature (CD62loCD69lo), and mature (CD62hiCD69lo) TCRβhiCD8 SP thymocytes from wild-type (WT) (upper) and Fam49b-KO mice (lower). Shown are representative data of two independent experiments. (B) Frequency of 7AAD+ and Annexin V+ cells among immature CD8 SP (left) or semi-mature TCRβhiCD8 SP (right) thymocytes from WT and Fam49b-KO mice. Small horizontal lines indicate the mean of 4 mice. *p=0.0478 and **p=0.0006 (Mann-Whitney test). Data are pooled from two independent experiments. See also Figure 5—figure supplement 1—source data 1.
-
Figure 5—figure supplement 1—source data 1
The numerical data used to generate the Figure 5—figure supplement 1.
- https://cdn.elifesciences.org/articles/76940/elife-76940-fig5-figsupp1-data1-v1.xlsx
Figure 6 with 2 supplements
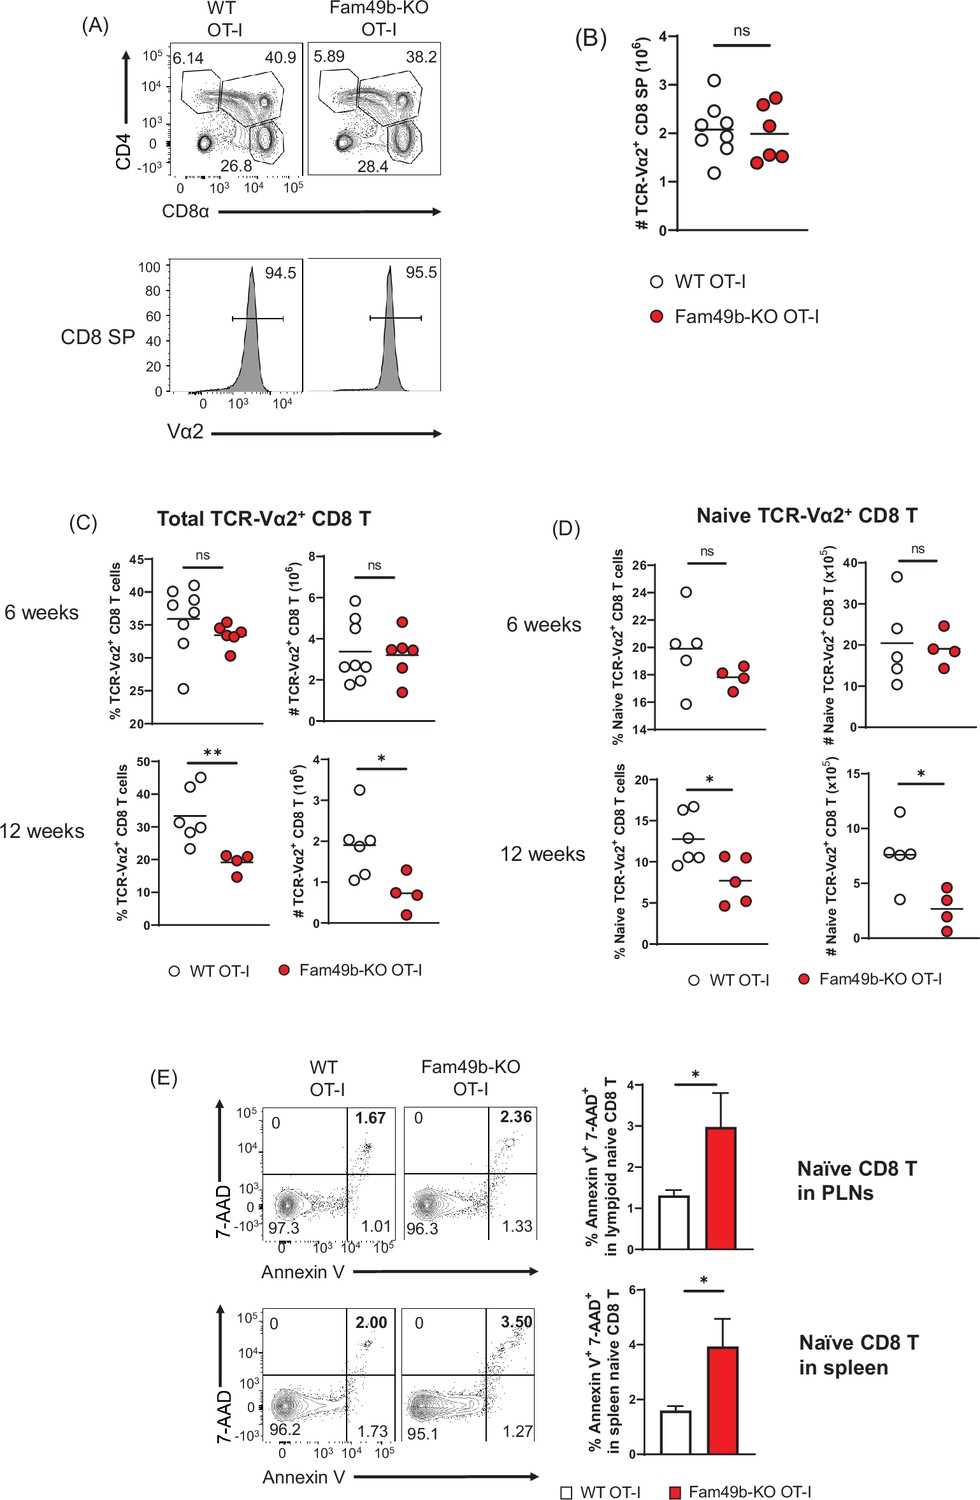
Dramatic loss of peripheral T cells, but not thymocytes, in Family with sequence similarity 49 member B (Fam49b)-KO OT-I mice with age.
(A) Flow cytometry analyzing the expression of CD4 and CD8 in thymocytes from OT-I and Fam49b-KO OT-I mice at 6 weeks of age (upper). Contour plots show percentage of DP, CD8 single positive (SP), and CD4 SP among total thymocytes. Staining with antibody to the OT-I-specific variable region Vα2 (lower). Numbers above outlined areas indicate percentage of TCR-Vα2+ cells among CD8 SP thymocytes. Shown are representative data of 6–8 mice per genotype. (B) Quantification of cell numbers of TCR-Vα2+ CD8 SP thymocytes from OT-I and Fam49b-KO OT-I mice at 6 weeks of age. Small horizontal lines indicate the mean of 6–8 mice. Data are pooled from two independent experiments. See also Figure 6—source data 1. (C) Percentage of TCR-Vα2+ CD8 T cells in lymph nodes from OT-I and Fam49b-KO OT-I mice at either 6 weeks (upper left) or 12 weeks (lower left) of age. Quantification of cell numbers of TCR-Vα2+ CD8 T cells in peripheral lymph nodes from OT-I and Fam49b-KO OT-I mice at either 6 weeks (upper right) or 12 weeks (lower right) of age. Small horizontal lines indicate the mean of 4–8 mice. Each dot represents an individual mouse. *p=0.0173 and **p=0.0077 (Mann-Whitney test). Data are pooled from three independent experiments. See also Figure 6—source data 1. (D) Percentage of TCR-Vα2+ CD62L+CD44lo CD8 T cells in peripheral lymph nodes from OT-I and Fam49b-KO OT-I mice at either 6 weeks (upper left) or 12 weeks (lower left) of age. Quantification of cell numbers of TCR-Vα2+ CD62L+CD44lo CD8 T cells in peripheral lymph nodes from OT-I and Fam49b-KO OT-I mice at either 6 weeks (upper right) or 12 weeks (lower right) of age. Small horizontal lines indicate the mean of 4–5 mice. Each dot represents an individual mouse. *p=0.0154 or 0.0204 (Mann-Whitney test). Data are pooled from two independent experiments. See also Figure 6—source data 1. (E) Apoptosis detected using 7AAD/Annexin V staining in fleshly isolated CD62L+CD44lo CD8 T cells in peripheral lymph nodes (top) and spleen (lower) from OT-I and Fam49b-KO OT-I mice at 16 weeks of age. Shown are representative data of 4 mice per genotype. Right panels show average frequencies of 7AAD+ and Annexin V+ cells among CD62L+CD44lo CD8 T cells in peripheral lymph nodes (mean and SEM, n=4) and spleen (mean and SEM, n=4). *p=0.0286 (Mann-Whitney test). Data are pooled from two independent experiments. See also Figure 6—source data 1.
-
Figure 6—source data 1
The numerical data used to generate the Figure 6.
- https://cdn.elifesciences.org/articles/76940/elife-76940-fig6-data1-v1.xlsx
Figure 6—figure supplement 1
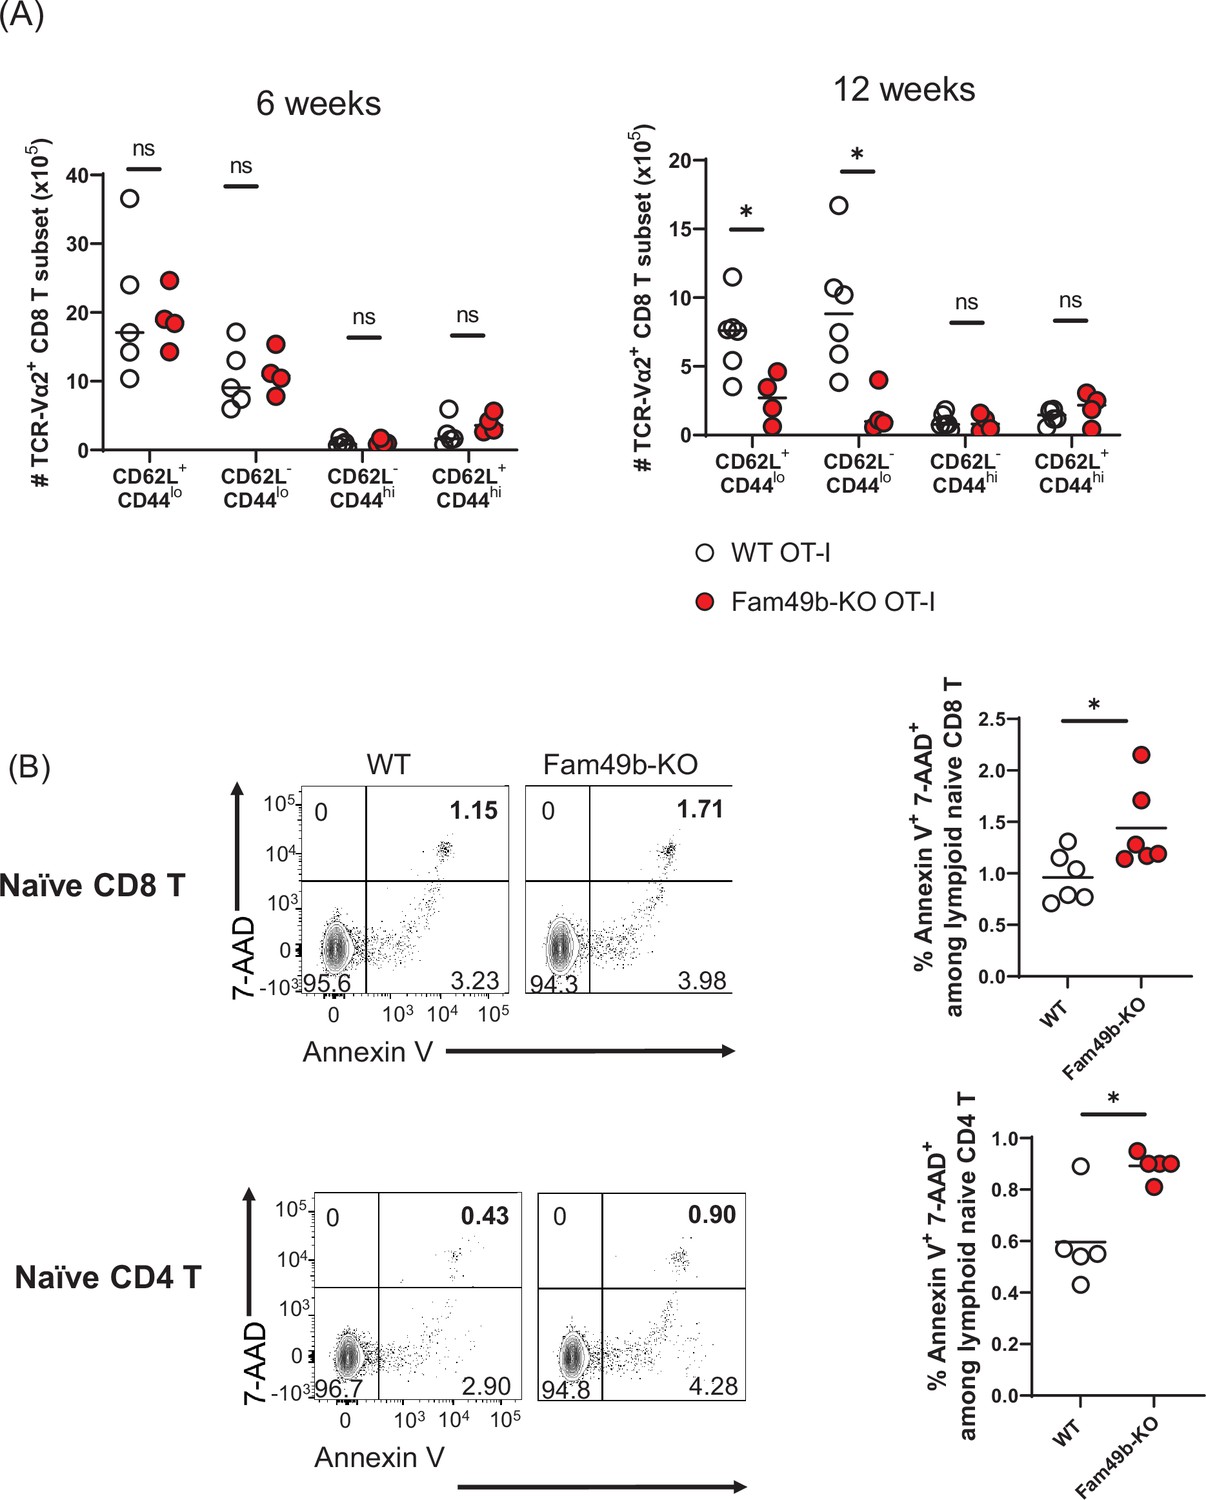
Dramatic loss of CD44lo peripheral T cells in Family with sequence similarity 49 member B (Fam49b)-KO OT-I mice at 12 weeks.
(A) Absolute numbers of TCR-Vα2+ CD8 T cell subset in peripheral lymph nodes from OT-I and Fam49b-KO OT-I mice at either 6 weeks (left) or 12 weeks (right) of age. TCR-Vα2+ CD8 T cell subset with phenotype of naïve (CD62L+CD44 lo), acute effector (CD62L-CD44lo), effector memory (CD62L-CD44hi), and central memory (CD62L+CD44 hi). Small horizontal lines indicate the mean of 4–6 mice. Each dot represents an individual mouse. *p=0.0190 (Mann-Whitney test). Data are pooled from two independent experiments. See also Figure 6—figure supplement 1—source data 1. (B) Frequency of 7AAD+ and Annexin V+ cells in fleshly isolated naïve CD8 T (upper) or naive CD4 T (lower) cells from wild-type (WT) and Fam49b-KO mice. Small horizontal lines indicate the mean of 4–6 mice. *p=0.0159 or 0.0411 (Mann-Whitney test). Data are pooled from two independent experiments. See also o Figure 6—figure supplement 1—source data 1.
-
Figure 6—figure supplement 1—source data 1
The numerical data used to generate the Figure 6—figure supplement 1.
- https://cdn.elifesciences.org/articles/76940/elife-76940-fig6-figsupp1-data1-v1.xlsx
Figure 6—figure supplement 2
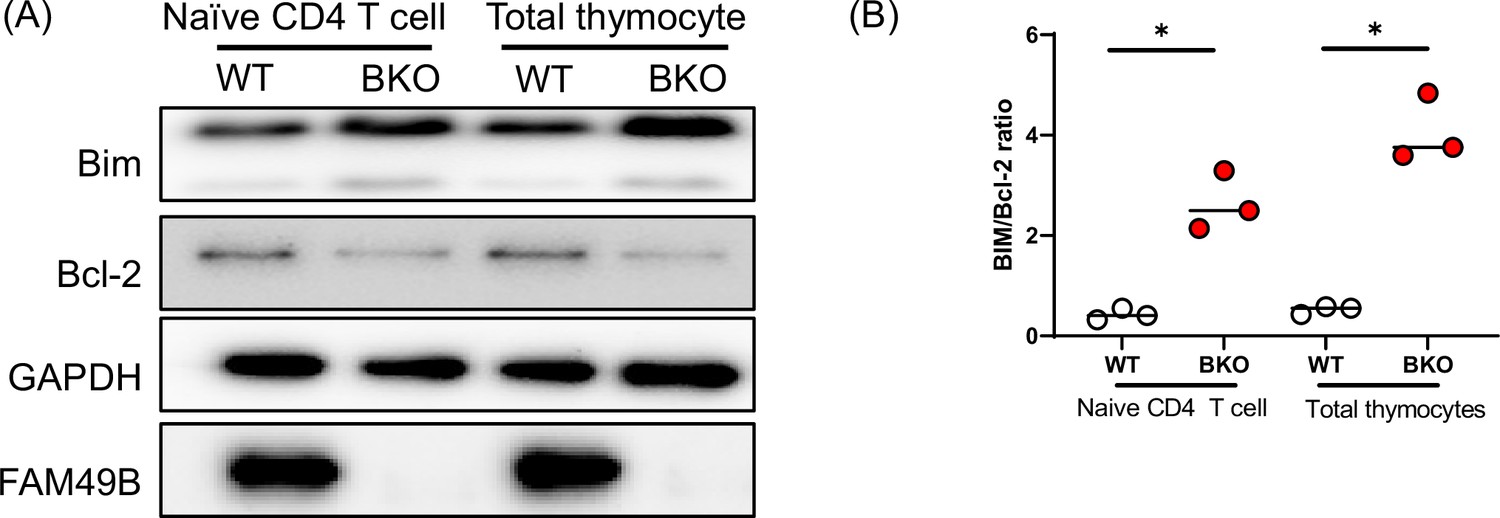
Elevated ratio of BIM to Bcl-2 in Family with sequence similarity 49 member B (Fam49b)-KO mice compared to wild-type (WT) mice.
(A) Western blot analysis of BIM and Bcl-2 in naïve CD4 T cells and total thymocytes from 6 to 8 week-old WT and Fam49b-KO mice. The data are representative of three independent experiments. See also Figure 6—figure supplement 2—source data 1. (B) BIM and Bcl-2 balance of naïve CD4 T cells and total thymocytes in 6–8 week-old WT or Fam49b-KO mice. The expression ratio of BIM/Bcl-2 was examined and calculated by western blot from three independent experiments. Small horizontal lines indicate the mean of 3 mice. See also Figure 6—figure supplement 2—source data 2.
-
Figure 6—figure supplement 2—source data 1
Immunoblot for BIM/Bcl-2.
- https://cdn.elifesciences.org/articles/76940/elife-76940-fig6-figsupp2-data1-v1.zip
-
Figure 6—figure supplement 2—source data 2
The numerical data used to generate the Figure 6—figure supplement 2.
- https://cdn.elifesciences.org/articles/76940/elife-76940-fig6-figsupp2-data2-v1.xlsx
Figure 7 with 3 supplements
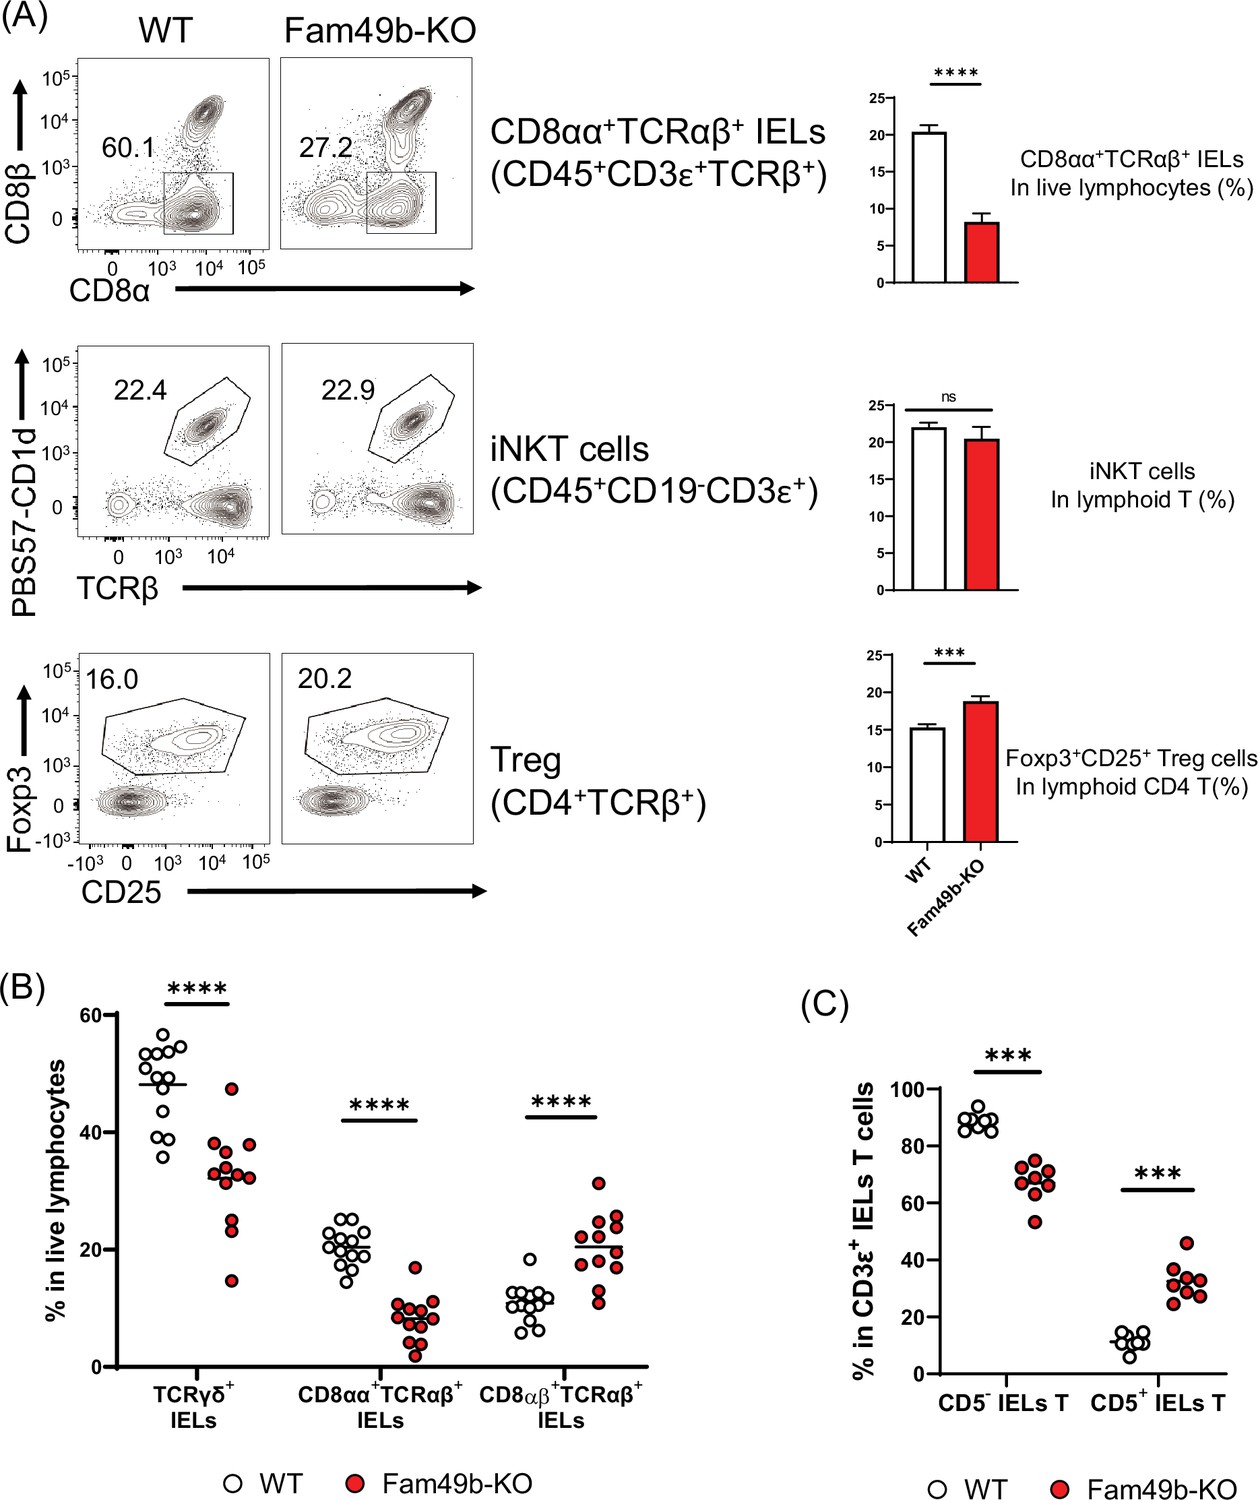
Family with sequence similarity 49 member B (Fam49b)-KO mice have lower frequency of CD8αα+TCRαβ+ and TCRγδ+ IELs T cells than wild-type (WT) mice.
(A) Flow cytometry analysis of CD8αα+ TCRβ+ IELs T cells (top), CD1d-tetramer+ iNKT cells in the liver (middle), and Foxp3+CD25+ lymphoid regulatory T cells in the peripheral lymph nodes (bottom) from WT and Fam49b-KO mice. Right panels show average frequencies of each population among total lymphocytes or CD4 T cells. ***p=0.0003 and ****p<0.0001 (Mann-Whitney test). Data are pooled from seven independent experiments (CD8αα+ TCRβ+ IELs; mean and SEM, n=12–13), representative of four experiments (iNKT cells; mean and SEM, n=6), or representative from seven independent experiments (Treg; mean and SEM, n=8). See also Figure 7—source data 1. (B) Frequency of TCRγδ+ IELs T cells, CD8αα+TCRαβ+ IELs T cells, and CD8αβ+TCRβ+ IELs T cells among total live IELs cells in WT and Fam49b-KO mice. Each dot represents an individual mouse. Small horizontal lines indicate the mean of 12–13 mice. ****p<0.0001 (Mann-Whitney test). Data are pooled from seven independent experiments. See also Figure 7—source data 1. (C) Frequency of CD5+ T cells and CD5- T cells among total CD3ε+ IELs T cells in WT and Fam49b-KO mice. Each dot represents an individual mouse. Small horizontal lines indicate the mean of 8 mice. ***p=0.0002 (Mann-Whitney test). Data are pooled from six independent experiments. See also Figure 7—source data 1.
-
Figure 7—source data 1
The numerical data used to generate the Figure 7.
- https://cdn.elifesciences.org/articles/76940/elife-76940-fig7-data1-v1.xlsx
Figure 7—figure supplement 1
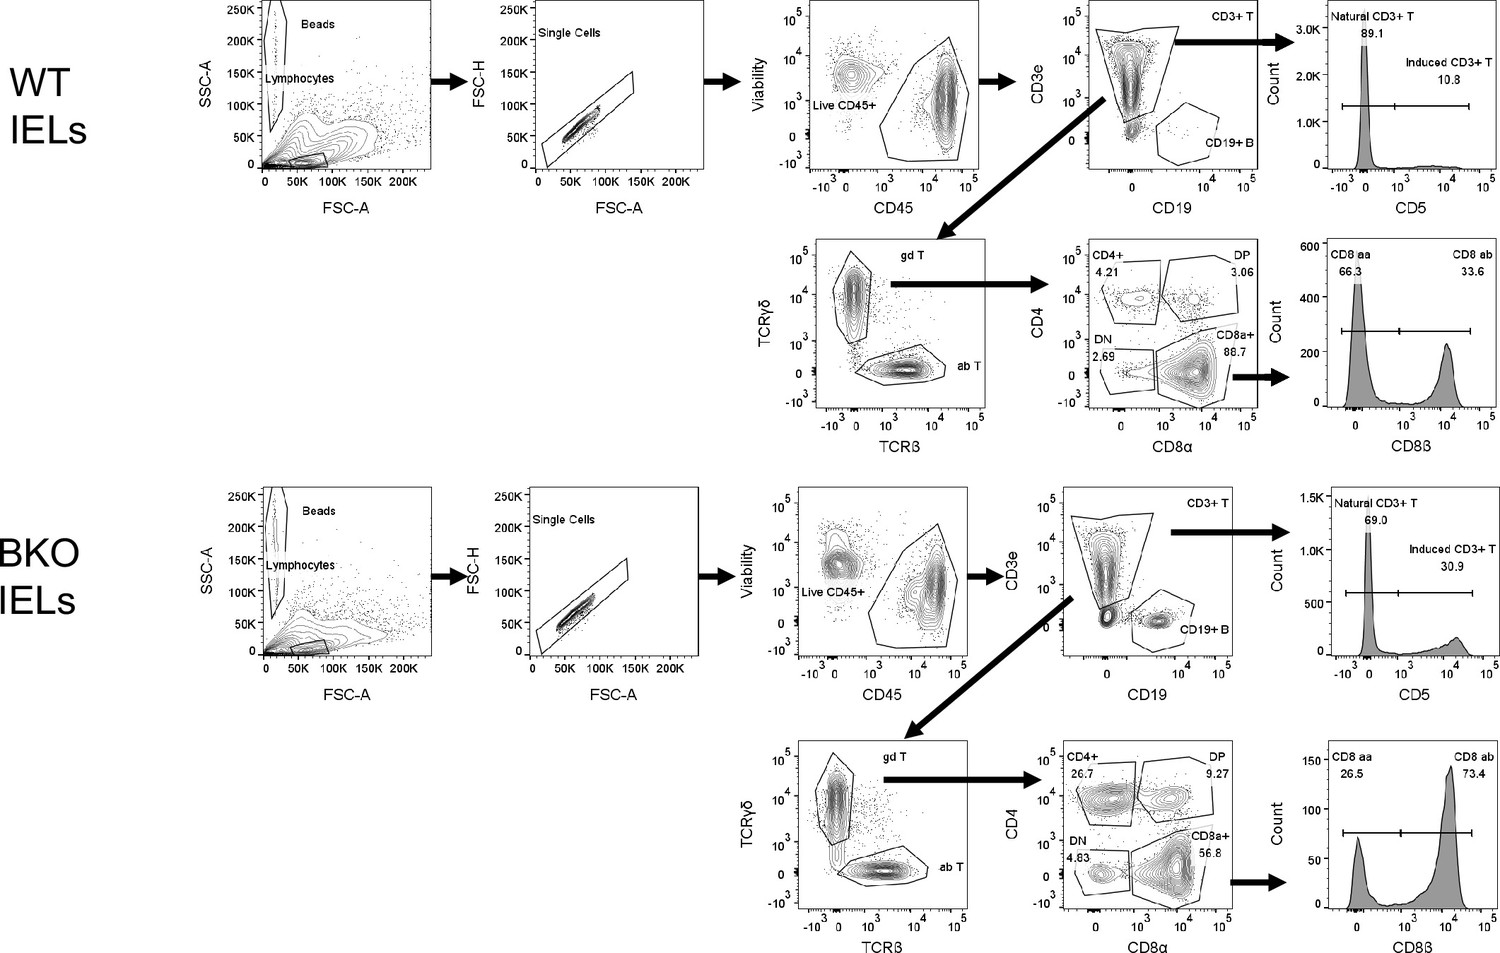
Flow cytometry gating strategies to analyze IELs T cells.
TCRγδ+IEL, CD8αα+TCRβ+IELs, CD8αβ+TCRαβ+IELs, CD4 +TCRαβ+IELs, CD4 +CD8α+TCRαβ, and CD4-CD8α -TCRαβ IELs T cells were analyzed in wild-type (WT) and Family with sequence similarity 49 member B (Fam49b)-KO mice.
Figure 7—figure supplement 2
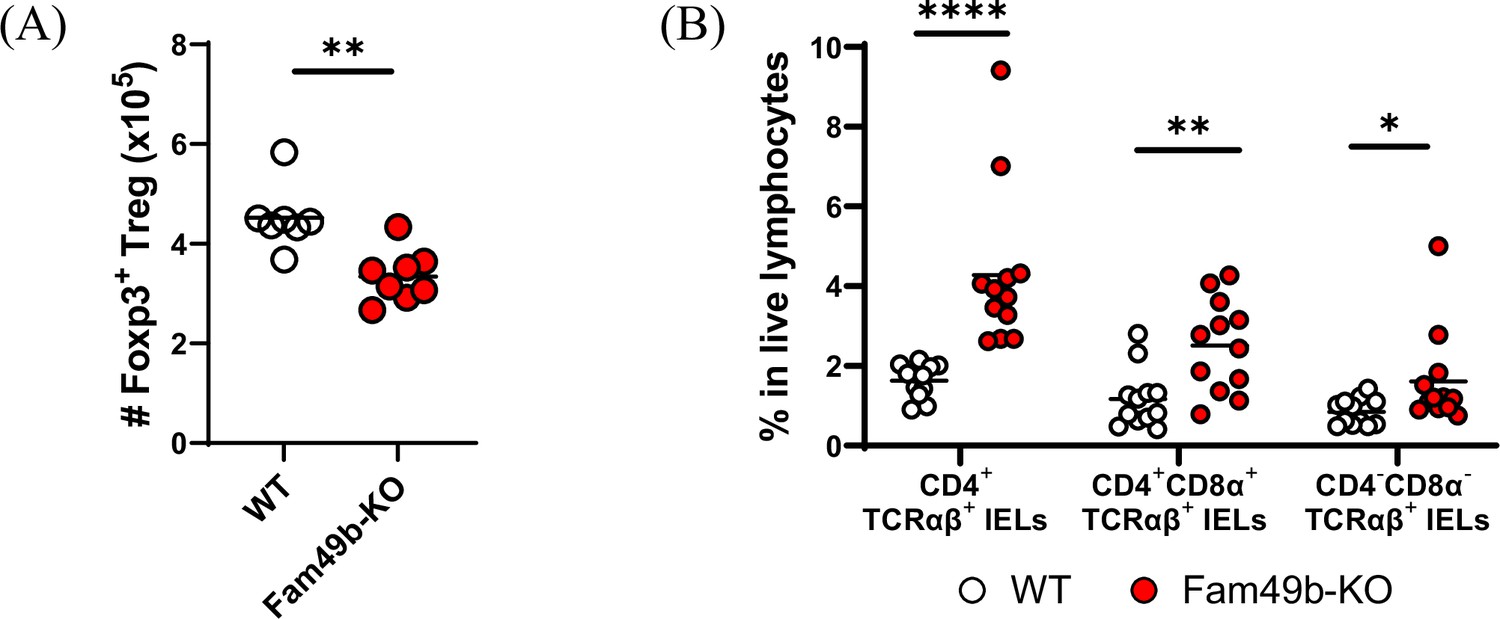
Total number of Treg cells in lymph nodes, and minor IELs T subsets.
(A) Total number of Foxp3+ regulatory T cells in peripheral lymph nodes from wild-type (WT) and Family with sequence similarity 49 member B (Fam49b)-KO mice. Each dot represents an individual mouse. Small horizontal lines indicate the mean of 7–8 mice. **p=0.0012 (Mann-Whitney test). Data are representative from seven independent experiments. See also Figure 7—figure supplement 2—source data 1 (B) Frequency of CD4+TCRαβ+ IELs, CD4+CD8α+TCRαβ IELs, and CD4-CD8α-TCRαβ IELs T among total live IELs T cells in WT and Fam49b-KO mice. Each dot represents an individual mouse. Small horizontal lines indicate the mean of 12 mice. *p=0.0235 and **p=0.0025 and ****p<0.0001 (Mann-Whitney test). Data are pooled from six independent experiments See also Figure 7—figure supplement 2—source data 1.
-
Figure 7—figure supplement 2—source data 1
The numerical data used to generate the Figure 7—figure supplement 2.
- https://cdn.elifesciences.org/articles/76940/elife-76940-fig7-figsupp2-data1-v1.xlsx
Figure 7—figure supplement 3
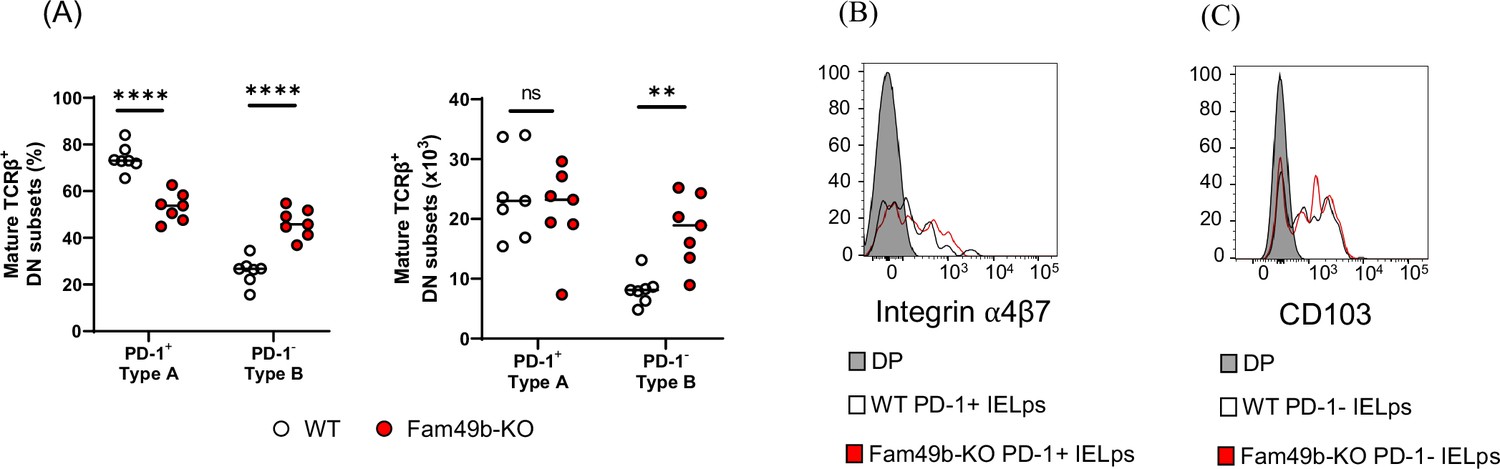
Intraepithelial lymphocyte (IEL) precursors in thymus.
(A) Two subsets of mature TCRβ+ double negative (DN) IEL precursor cells in thymus. Frequency (left) and Numbers (right) of PD-1+ (Type A) and PD-1- (Type B) mature TCRβ+ DN IEL precursor cells in wild-type (WT) and Family with sequence similarity 49 member B (Fam49b)-KO mice at 6–7 weeks of age. Each dot represents an individual mouse. Small horizontal lines indicate the mean of 7 mice. **p=0.003 and ****p<0.0001 (Mann-Whitney test). Data are representative of three experiments. See also Figure 7—figure supplement 3—source data 1. (B) Expression of Integrin α4β7 on PD-1+ TCRβ+ DN IEL precursor (Type A) of WT and Fam49b-KO mice or double positive (DP) (control) thymocytes. Data are representative of three experiments. Shown are representative data of seven mice per genotype. (C) Expression of CD103 (Integrin αE) on PD-1- TCRβ+ DN IEL precursor (Type B) of WT and Fam49b-KO mice or DP (control) thymocytes. Data are representative of three experiments. Shown are representative data of seven mice per genotype.
-
Figure 7—figure supplement 3—source data 1
The numerical data used to generate the Figure 7—figure supplement 3.
- https://cdn.elifesciences.org/articles/76940/elife-76940-fig7-figsupp3-data1-v1.xlsx
Author response image 1

(A) Flow cytometry profiles of the expression of CD4 and CD8 of lymphocytes with pre-gating TCRβ+ cells in peripheral lymph nodes from WT, Fam49a-KO, and Fam49b-KO mice.
Numbers adjust to outlined areas indicate percentage of cells among total TCRβ+ cells lymphocytes. (B) Frequencies of TCRβ+CD4-CD8α- cell cells among total lymphocytes in lymph nodes from WT, Fam49a-KO mice, and Fam49b-KO mice. Each dot represents an individual mouse. Small horizontal lines indicate the mean of 8 mice. ****p<0.0001 (One-way ANOVA). (C) Numbers of TCRβ+CD4-CD8α- cell in lymph nodes from WT, Fam49a-KO mice, and Fam49b-KO mice. Each dot represents an individual mouse. Small horizontal lines indicate the mean of 8 mice.
Author response image 2
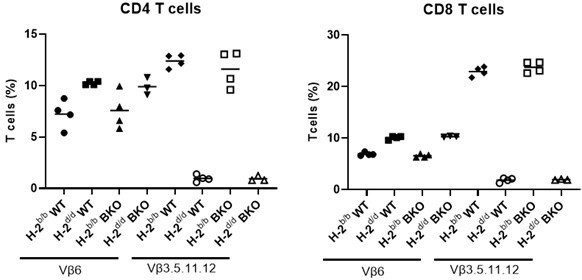
Negative selection in Fam49b-KO mice.
B6 mice (H-2b) bearing wild-type or mutated Fam49b allele were backcrossed or not onto Balb/c (H-2d) mice and the expression of indicated Vβ elements in CD4 (left) or CD8 (right) peripheral T cells was analyze3d by flow cytometry.
Author response image 3
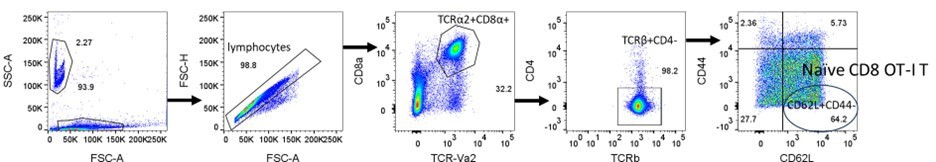
Naïve CD8 OT-I T cells identified by TCR-Vα2+, CD8α+, TCRβ+, CD4-, CD62L+, and CD44lo.
Author response image 4
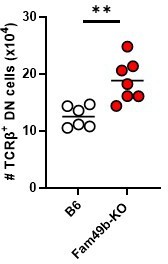
Numbers of TCRβ+ DN IEL precursor cells in WT and Fam49b-KO mice at 6-7 weeks of age.
Each dot represents an individual mouse. Small horizontal lines indicate the mean of 6-7 mice. **p=0.0031 (Mann-Whitney test). Data are representative of three experiments.
Author response image 5
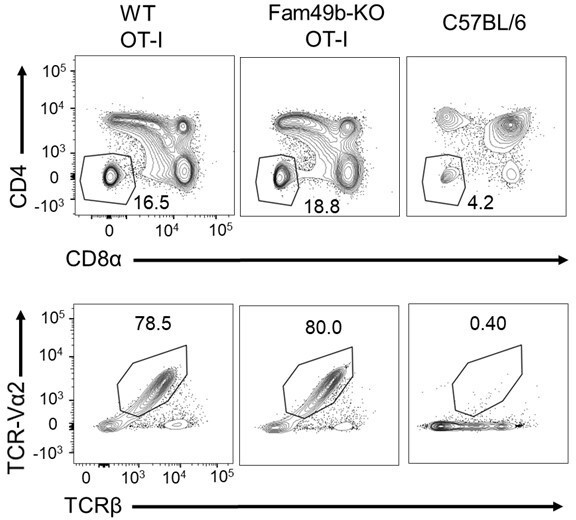
(A) Flow cytometry analyzing the expression of CD4 and CD8α in thymocytes from WT and Fam49b-KO OT-I mice (upper).
Flow cytometry analyzing the expression of OT-I-specific variable region TCR-Vα2 and TCRβ on gated CD4-CD8α- DN thymocytes from WT and Fam49b-KO OT-I mice at 6 weeks of age (lower). Shown are representative data of three-four mice per genotype.
Author response image 6

(A) Expression of activation marker CD5 on TCR-Vα2+ DP and TCR-Vα2+ CD8 SP thymocytes from WT and Fam49b-KO OT-I mice at 6 weeks of age.
(B) Geometric MFI of CD5 on TCR-Vα2+ DP. Small horizontal lines indicate the mean of 4 mice. *p=0.0278 (Mann-Whitney test). Shown are representative data of three independent experiment.
Author response image 7

(A) Differential surface expression of CD69 and TCRβ was used to identify thymocyte population of different maturity in WT and Fam49b-KO OT-I mice.
(right) Dot Plots show percentages of different thymocyte subpopulations among TCR-Vα2 positive thymocytes from WT and Fam49b-KO OT-I mice. Data are representative of two experiments. (B) Differential surface expression of CD5 and TCRβ was used to identify thymocyte population of different maturity in WT and Fam49b-KO OT-I mice. (right) Dot Plots show percentages of different thymocyte subpopulations among TCR-Vα2 positive thymocytes from WT and Fam49b-KO OT-I mice. Data are representative of two experiments.
Author response image 8

(A) Frequencies of immature (CD62LloCD69hi), semi-mature (CD62loCD69lo), and mature (CD62hiCD69lo) in the TCR-Vα2+TCRβ+ CD8 SP thymocytes from WT and Fam49b-KO OT-I mice.
Numbers adjust to outlined areas indicate percentage of each population among total TCR-Vα2+TCRβ+ CD8 SP thymocytes. Shown are representative data of three-four mice per genotype. (B) Quantification of cell numbers of immature and mature fraction in TCR-Vα2+TCRβ+ CD8 SP thymocytes. Each dot represents an individual mouse. Data are representative of two experiments.
Author response image 9

Expression of CD44 and CD62L on T cells (left) and absolute number of T cell subset (right) in peripheral lymph nodes in CD4 T cells (upper) and CD8 T cells (lower) from WT and Fam49b-KO mice.
T subset with phenotype of naïve (CD62L+CD44lo), acute effector (CD62L-CD44lo), effector memory (CD62L-CD44hi), and central memory (CD62L+CD44hi). Numbers adjust to outlined areas indicate percentage of T cells subset among total T cells. Each dot represents an individual mouse. Small horizontal lines indicate the mean of 5-6 mice.
Tables
Key resources table
| Reagent type (species) or resource | Designation | Source or reference | Identifiers | Additional information |
|---|---|---|---|---|
| Strain, strain background (Mus musculus) | C57BL/6 J | Jackson Laboratory | Stock No. 000664, RRID:IMSR_JAX:000664 | |
| Strain, strain background (Mus musculus) | CD45.1 | Jackson Laboratory | Stock No. 002014, RRID:IMSR_JAX:002014 | |
| Strain, strain background (Mus musculus) | Cyria-/- (C57BL/6 J background) | Generation of knockout mice in this paper | ||
| Strain, strain background (Mus musculus) | Cyrib-/- (C57BL/6 J background) | Generation of knockout mice in this paper | ||
| Antibody | Anti-human Fam49a (Rabbit polyclonal) | Millipore | Cat# SAB1103179 RRID:AB_10900801 | WB (1:1000) |
| Antibody | Anti-Fam49b (Mouse monoclonal, Clone D-8) | Santa Cruz | Cat# SC-390478 | WB (1:2000) |
| Antibody | Anti-GAPDH (Rabbit polyclonal) | Abcam | Cat# ab9485, RRID:AB_307275 | WB (1:2000) |
| Antibody | anti-PLCγ1 (Rabbit monoclonal, Clone D9H10) | Cell Signaling Technology | Cat# 5690 RRID:AB_10691383 | WB (1:1000) |
| Antibody | anti-p-PLCγ1 (Rabbit polyclonal) | Cell Signaling Technology | Cat# 2821 RRID:AB_330855 | WB (1:1000) |
| Antibody | anti-ZAP-70 (Rabbit monoclonal, Clone 99F2) | Cell Signaling Technology | Cat# 2705 RRID:AB_2273231 | WB (1:1000) |
| Antibody | anti-p-ZAP-70 (Rabbit monoclonal, Clone 65E4) | Cell Signaling Technology | Cat# 2717 RRID:AB_2218658 | WB (1:1000) |
| Antibody | anti-p44/42 MAPK (Erk1/2) (Rabbit polyclonal) | Cell Signaling Technology | Cat# 9102 RRID:AB_330744 | WB (1:1000) |
| Antibody | anti-p-p44/42 MAPK (Erk1/2) (Rabbit monoclonal, Clone 197G2) | Cell Signaling Technology | Cat# 4377 RRID:AB_331775 | WB (1:1000) |
| Antibody | anti-p-LAT (Rabbit monoclonal, Clone E3S5L) | Cell Signaling Technology | Cat# 20172 RRID:AB_3073971 | WB (1:1000) |
| Antibody | anti-LAT (Rabbit monoclonal, Clone E3U6J) | Cell Signaling Technology | Cat# 45533 | WB (1:1000) |
| Antibody | anti-BIM (Rabbit monoclonal, Clone C34C5) | Cell Signaling Technology | Cat# 2933 RRID:AB_1030947 | WB (1:1000) |
| Antibody | anti-Bcl-2 (Rabbit monoclonal, Clone D17C4) | Cell Signaling Technology | Cat# 3498 RRID:AB_1903907 | WB (1:1000) |
| Antibody | anti-p-PAK1 (Ser144)/ PAK2 (Ser141) (Rabbit polyclonal) | Cell Signaling Technology | Cat# 2606 RRID:AB_2299279 | WB (1:1000) |
| Antibody | anti-p-PAK1 (Ser199/204)/ PAK2 (Ser192/197) (Rabbit polyclonal) | Cell Signaling Technology | Cat# 2605 RRID:AB_2160222 | WB (1:1000) |
| Antibody | anti-p-PAK1 (Thr423)/ PAK2 (Thr402) (Rabbit polyclonal) | Cell Signaling Technology | Cat# 2601 RRID:AB_330220 | WB (1:1000) |
| Antibody | anti-PAK1 (Rabbit polyclonal) | Cell Signaling Technology | Cat# 2602 RRID:AB_330222 | WB (1:1000) |
| Antibody | anti-PAK2 (Rabbit monoclonal, Clone C17A10) | Cell Signaling Technology | Cat# 2615 RRID:AB_2267950 | WB (1:1000) |
| Antibody | anti-PAK3 (Rabbit polyclonal) | Cell Signaling Technology | Cat# 2609 RRID:AB_2225298 | WB (1:1000) |
| Antibody | anti-PAK1/2/3 (Rabbit polyclonal) | Cell Signaling Technology | Cat# 2604 RRID:AB_2160225 | WB (1:1000) |
| Antibody | Anti-mouse IgG (Dunkey polyclonal) | Licor | Cat# 926–68072, RRID:AB_10953628 | WB (1:10000) |
| Antibody | Anti-Rabbit IgG (Goat polyclonal) | Licor | Cat# 926–32211, RRID:AB_621843 | WB (1:1000) |
| Antibody | Anti-CD3ε-FITC (Rat monoclonal, Clone 17A2) | BioLegend | Cat# 100204, RRID:AB_312661 | FC (1:200) |
| Antibody | Anti-CD4-APC (Rat monoclonal, Clone RM4-5) | BioLegend | Cat# 100516, RRID:AB_312719 | FC (1:200) |
| Antibody | Anti-CD5-APC-Cy7 (Rat monoclonal, Clone 53–7.3) | BioLegend | Cat# 100649, RRID:AB_2860587 | FC (1:200) |
| Antibody | Anti-CD8α-BV421 (Rat monoclonal, Clone 53–6.7) | BioLegend | Cat# 100738, RRID:AB_11204079 | FC (1:200) |
| Antibody | Anti-CD8β-PE-Cy7 (Rat monoclonal, Clone 53–5.8) | BioLegend | Cat# 140416, RRID:AB_2564385 | FC (1:200) |
| Antibody | Anti-CD11b-PerCP-Cy5.5 (Rat monoclonal, Clone M1/70) | BioLegend | Cat# 101228, RRID:AB_893232 | FC (1:200) |
| Antibody | Anti-CD19-PerCP-Cy5.5 (Rat monoclonal, Clone 6D5) | BioLegend | Cat# 115534, RRID:AB_2072925 | FC (1:200) |
| Antibody | Anti-CD24-FITC (Rat monoclonal, Clone M1/69) | BioLegend | Cat# 101806, RRID:AB_312839 | FC (1:200) |
| Antibody | Anti-CD25-APC (Rat monoclonal, Clone PC61) | BioLegend | Cat# 102012, RRID:AB_312861 | FC (1:200) |
| Antibody | Anti-CD44-Pacific Blue (Rat monoclonal, Clone IM7) | BioLegend | Cat# 103020, RRID:AB_493683 | FC (1:200) |
| Antibody | Anti-CD45-Pacific Blue (Rat monoclonal, Clone 30-F11) | BioLegend | Cat# 103126, RRID:AB_493535 | FC (1:200) |
| Antibody | Anti-CD45.1-PE (Mouse monoclonal, Clone A20) | BioLegend | Cat# 110708, RRID:AB_313497 | FC (1:200) |
| Antibody | Anti-CD45.2-FITC (Mouse monoclonal, Clone 104) | BioLegend | Cat# 109806, RRID:AB_313443 | FC (1:200) |
| Antibody | Anti-CD45R/B220-PerCP-Cy5.5 (Rat monoclonal, Clone RA3-6B2) | BioLegend | Cat# 103236, RRID:AB_893354 | FC(1:400) |
| Antibody | Anti-CD62L-APC (Rat monoclonal, Clone MEL-14) | BioLegend | Cat# 104412, RRID:AB_313099 | FC (1:200) |
| Antibody | Anti-CD69-PE (Armenian Hamster monoclonal, Clone H1.2F3) | BioLegend | BioLegend Cat# 104507, RRID:AB_313110 | FC (1:200) |
| Antibody | Anti-CD103-Alexa Fluor 700 (Armenian Hamster monoclonal, Clone 2E7) | BioLegend | BioLegend Cat# 121442, RRID:AB_2813993 | FC (1:200) |
| Antibody | Anti-CD197/CCR7-BV421 (Rat monoclonal, Clone 4B12) | BioLegend | Cat# 120120, RRID:AB_2561446 | FC (1:50) |
| Antibody | Anti-Ly6G-PerCP-Cy5.5 (Rat monoclonal, Clone 1A8) | BioLegend | Cat# 127616, RRID:AB_1877271 | FC (1:200) |
| Antibody | Anti-Ly6C-PerCP-Cy5.5 (Rat monoclonal, Clone HK1.4) | BioLegend | Cat# 128012, RRID:AB_1659241 | FC (1:200) |
| Antibody | Anti-NK1.1-PerCP-Cy5.5 (Mouse monoclonal, Clone PK136) | BioLegend | Cat# 108728, RRID:AB_2132705 | FC (1:200) |
| Antibody | Anti-TCRβ-PE/Cy7 (Armenian Hamster monoclonal, Clone H57-597) | BioLegand | Cat# 109222, RRID:AB_893625 | FC (1:200) |
| Antibody | Anti-TCRγδ-PE (Armenian Hamster monoclonal, Clone GL3) | BioLegend | Cat# 118108, RRID:AB_313832 | FC (1:200) |
| Antibody | Anti-CD16/CD32 (Rat monoclonal, Clone 93) | Thermo Fisher Scientific | Cat# 14-0161-85, RRID:AB_467134 | FC (1:200) |
| Antibody | Anti-Cleaved Caspase 3-PE (Rabbit monoclonal, Clone D3E9) | Cell Signaling Technology | Cat# 12768, RRID:AB_2798021 | FC (1:50) |
| Antibody | Anti-Foxp3-PE (Rab monoclonal, Clone FJK16s) | eBioscience | Cat# 12-5773-82, RRID:AB_465936 | FC (1:200) |
| Antibody | Anti-TCRVα2-FITC (Rat monoclonal, Clone H57-597) | BioLegand | Cat# 127806, RRID:AB_1134188 | FC (1:200) |
| Antibody | Anti-IL-7RαBV650 (Rat monoclonal, Clone A7R34) | BioLegand | Cat# 135043, RRID:AB_2629681 | FC (1:200) |
| Antibody | Anti-PD-1 APC (Rat monoclonal, Clone RMP1-30) | BioLegand | Cat# 109112, RRID:AB_10612938 | FC (1:200) |
| Antibody | Anti- LPAM-1 (Integrin α4β7) PE (Rat monoclonal, Clone DATK32) | BioLegand | Cat# 120606, RRID:AB_493267 | FC (1:200) |
| Antibody | Biotin anti-mouse CD3 antibody | Biolegend | Cat# 100244 RRID:AB_2563947 | 60 μg/ml |
| Antibody | Biotin anti-mouse CD4 antibody | Biolegend | Cat# 100404 RRID:AB_312688 | 60 μg/ml |
| Peptide, recombinant protein | Streptavidin | SouthernBiotech | Cat# 7100–01 | 60 μg/ml |
| Sequence-based reagent | Cyrib_F | This paper | PCR primers | AGGAGCTGGCCACGAAATAC |
| Sequence-based reagent | Cyrib_R | This paper | PCR primers | GGCGTACTAGTCAAGGCTCC |
| Sequence-based reagent | Actb_F | This paper | PCR primers | CCTGAACCCTAAGGCCAACC |
| Sequence-based reagent | Actb_R | This paper | PCR primers | ATGGCGTGAGGGAGAGCATA |
| Commercial assay or kit | RNeasy Plus Micro Kit | QIAGEN | Cat# 74034 | |
| Commercial assay or kit | SuperScript IV Firs-Strand Synthesis Reaction, | Thermo Fisher Scientific | Cat# 18091050 | |
| Commercial assay or kit | PowerUp SYBR Green Master Mix | Thermo Fisher Scientific | Cat# A25741 | |
| Commercial assay or kit | Liver dissociation kit, mouse | MACS | Cat# 130-105-807 | |
| Chemical compound, drug | DTT | Fisher Scientific | Cat# BP172-5 | (1 mM) |
| Software, algorithm | Image Studio Lite | RRID:SCR_013715 | v5.2.5 | |
| Software, algorithm | FlowJo | FlowJo | RRID:SCR_008520 | v10.7.1 |
| Software, algorithm | GraphPad Prism | GraphPad Software | RRID:SCR_002798 | v9 |
| Other | Ghost Dye Violet 510 Viability dye | Tonbo Bioscience | Cat# 13–0870 T100 | FC (1:1000) |
Additional files
Download links
A two-part list of links to download the article, or parts of the article, in various formats.
Downloads (link to download the article as PDF)
Open citations (links to open the citations from this article in various online reference manager services)
Cite this article (links to download the citations from this article in formats compatible with various reference manager tools)
Fam49b dampens TCR signal strength to regulate survival of positively selected thymocytes and peripheral T cells
eLife 13:e76940.
https://doi.org/10.7554/eLife.76940


