Global variation in force-of-infection trends for human Taenia solium taeniasis/cysticercosis
- Department of Infectious Disease Epidemiology and London Centre for Neglected Tropical Disease Research (LCNTDR), Faculty of Medicine, School of Public Health, Imperial College London, United Kingdom
- MRC Centre for Global Infectious Disease Analysis, Department of Infectious Disease Epidemiology Faculty of Medicine, School of Public Health, Imperial College London, United Kingdom
- SCI Foundation, Edinburgh House, United Kingdom
- Department of Neurology, Center for Global Health, Technical University Munich (TUM), Germany
- Centre for Global Health, Institute of Health and Society, University of Oslo, Norway
- Grupo de Parasitología, Instituto Nacional de Salud, Colombia
- Ahmadu Bello University, Nigeria
- Department of Pathobiology and Population Sciences and London Centre for Neglected Tropical Disease Research (LCNTDR), Royal Veterinary College, United Kingdom
Figures
Figure 1 with 1 supplement
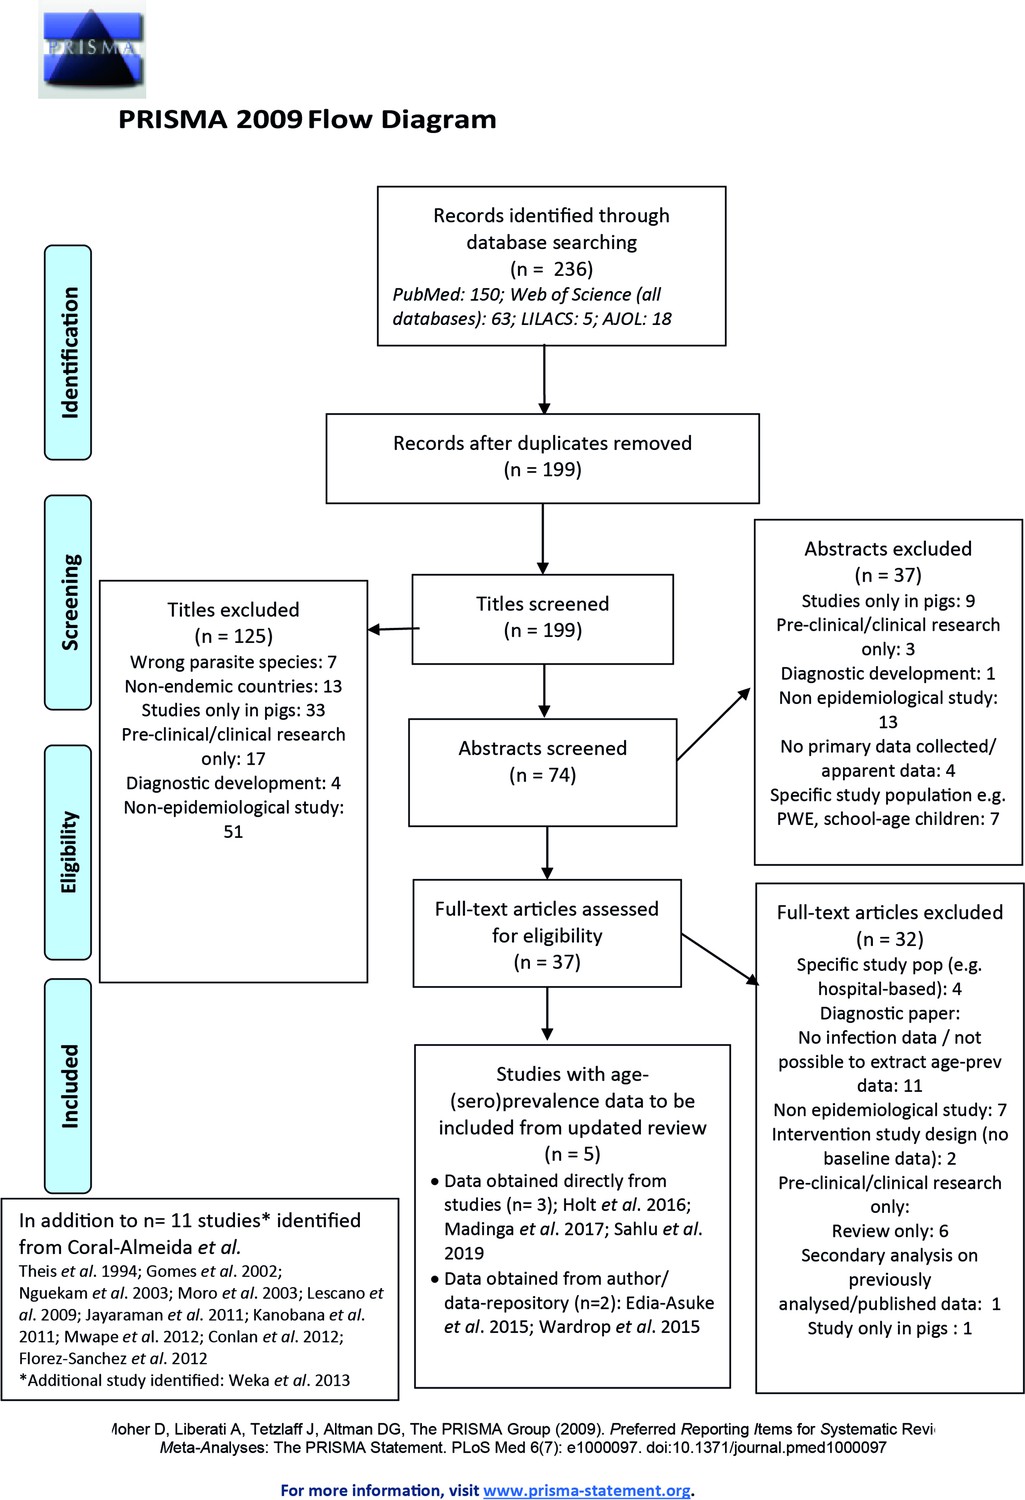
Published articles on age-(sero)prevalence profiles identified in the updated literature search using a Moher et al., 2015 search.
Additional studies identified from the Coral-Almeida et al., 2015 review also shown. LILAC: Latin American and Caribbean Health Sciences Literature; AJOL: African Journals Online.
Figure 1—figure supplement 1
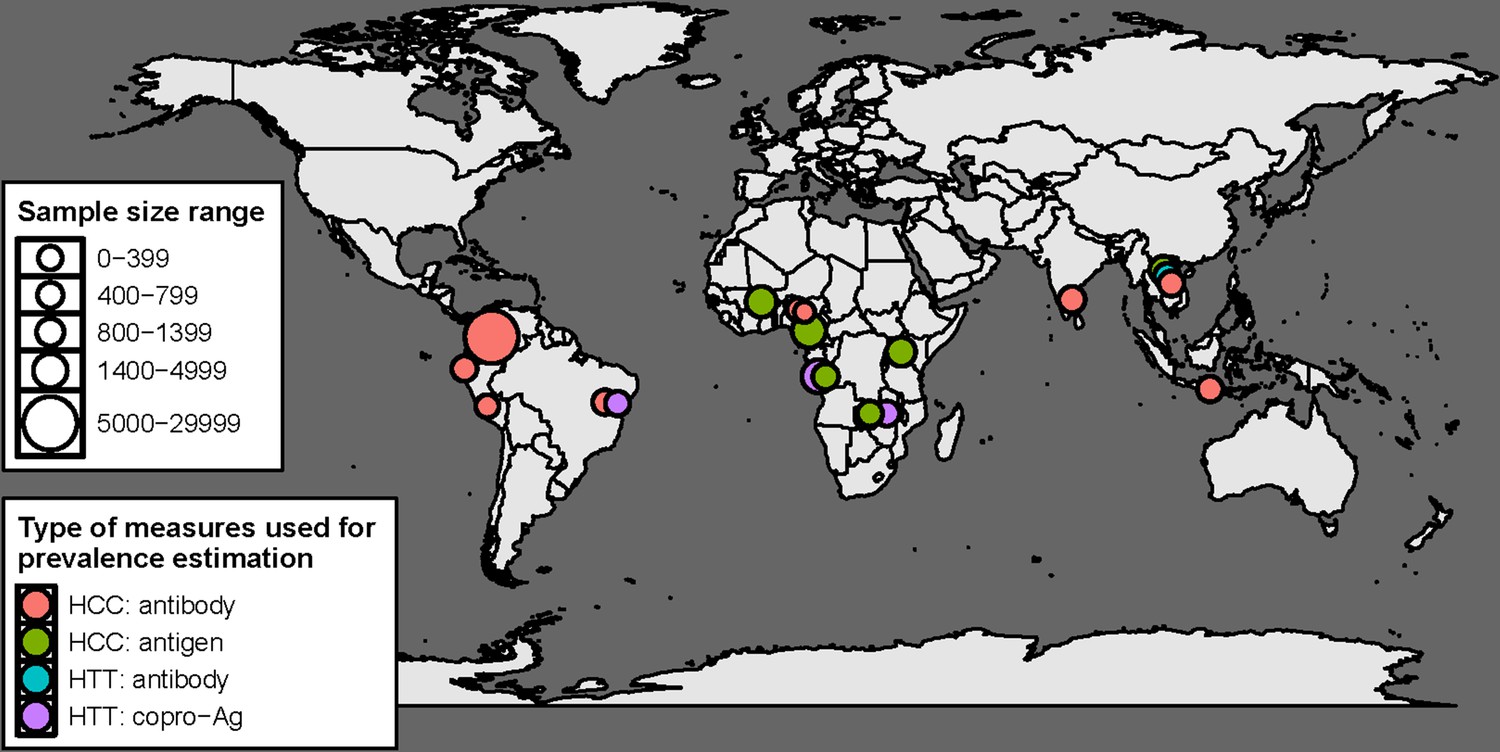
Geographical distribution of studies with human taeniasis (HTT) and human cysticercosis (HCC) age-(sero) prevalence data included in the final analysis (n=16) by diagnostic target.
There are 19 indicators in total, as three studies provided more than one indicator (Gomes et al., 2002; Mwape et al., 2012; Holt et al., 2016).
Figure 2
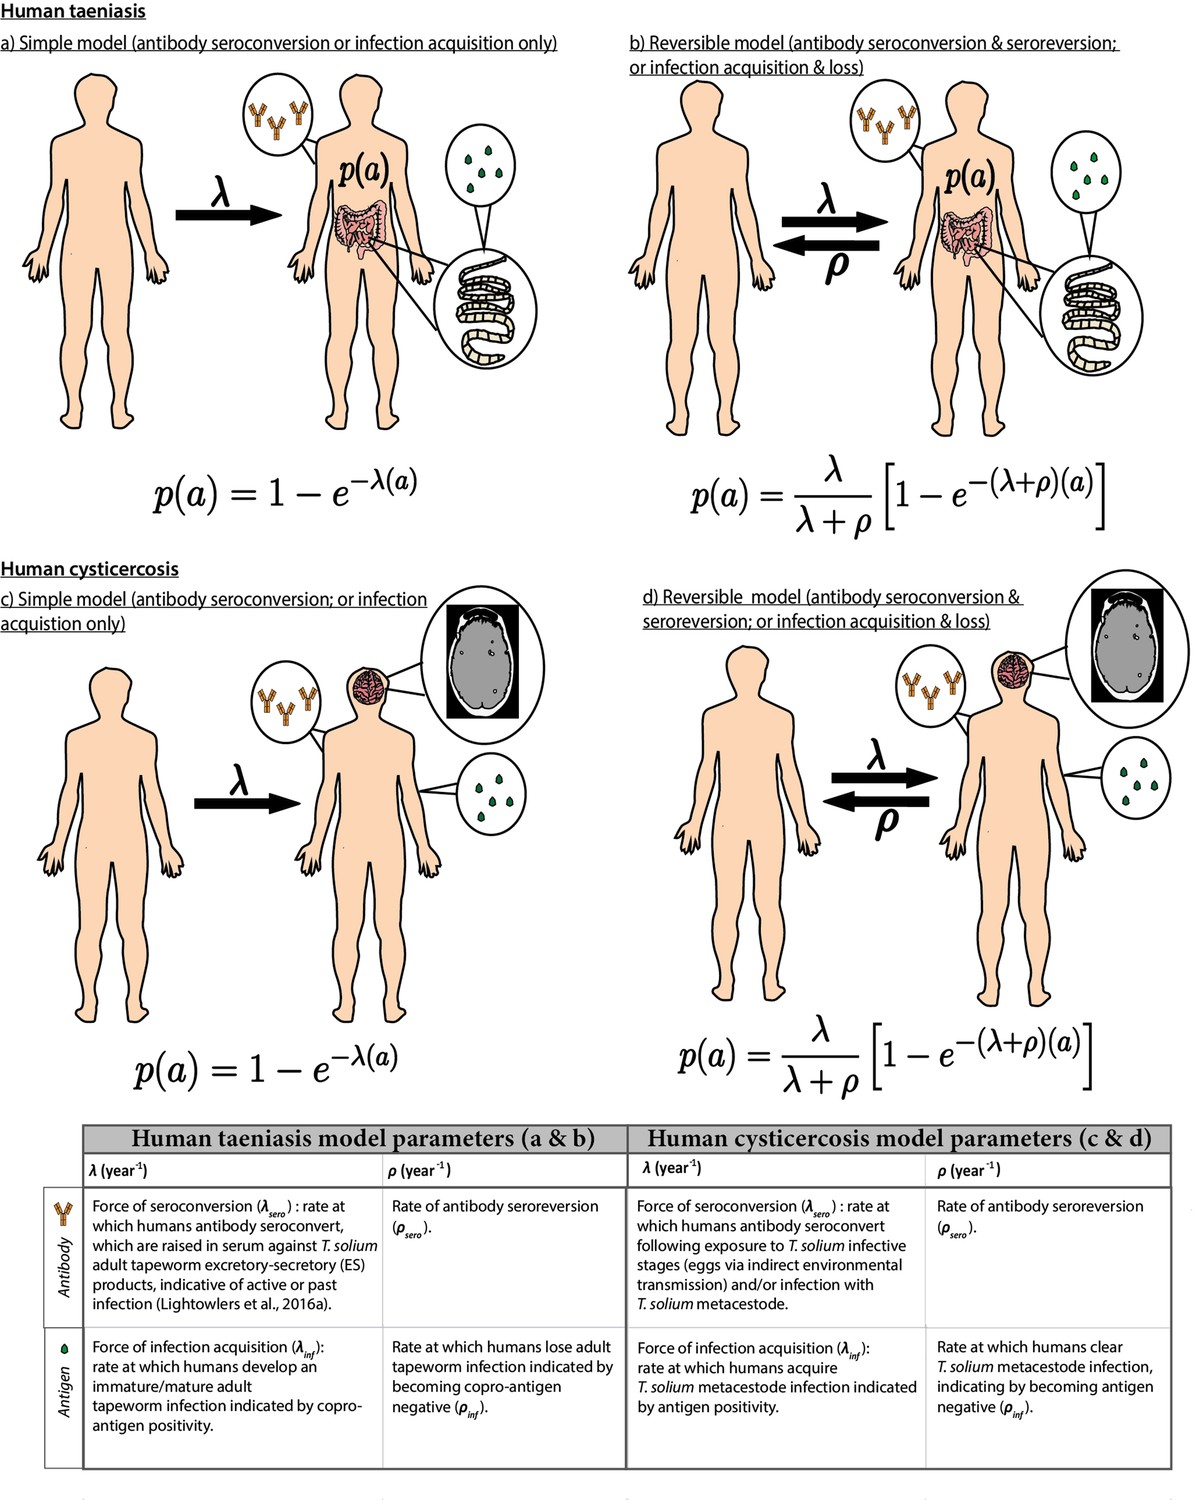
Simple and reversible catalytic model structure and equations fitted to data on the age (a)-specific (sero)prevalence (p(a)) data, where λ is the force-of-infection (rate of antibody (Ab)-seroconversion or infection acquisition) and ρ the rate of Ab-seroreversion or infection loss.
The general mathematical form of the catalytic models (equations 1a to 1d) fitted to the human taeniasis (HTT)/human cysticercosis (HCC) Ab, HCC Ag and HTT copro-Ag prevalence datasets to estimate the prevalence (p) at human age (a). The saturating (sero)prevalence is given by λ/(λ + ρ) which for the simple model is 100%, if the humans lived sufficiently long. The accompanying tables provide information on the definitions of the catalytic model parameters depending on the diagnostic method. Presence of adult tapeworm excretory-secretory products indicative of active or past HTT infection, as outlined by Lightowlers et al., 2016a.
Figure 3
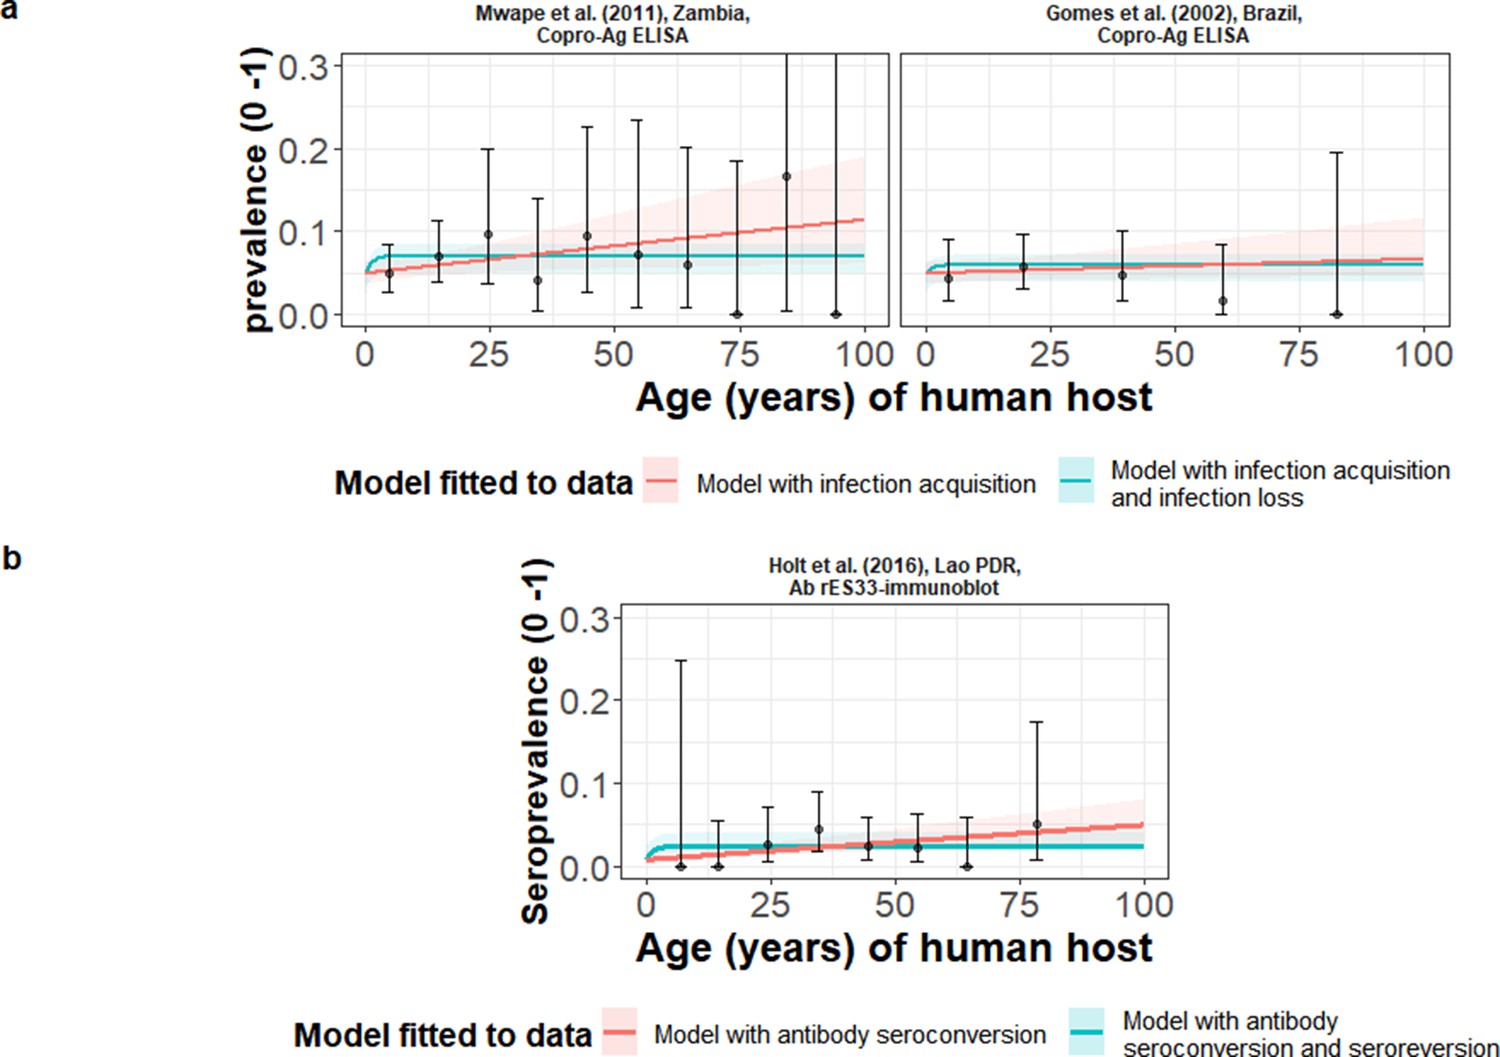
The relationship between human taeniasis copro-antigen (Copro-Ag) and antibody (sero)prevalence and human age (in years) for each dataset.
Human taeniasis (HTT) infection acquisition (simple) or acquisition with infection loss (reversible) catalytic models jointly fitted to multiple datasets (where single diagnostic sensitivity and specificity values were estimated; dataset-specific λ and ρ estimates were obtained) in a; HTT antibody (Ab)-seroconversion (simple) or Ab-seroconversion with Ab-seroreversion to a single dataset in b. 95% confidence intervals associated with observed (sero)prevalence point estimates are also presented. Bayesian Markov chain Monte Carlo methods were used to fit the models to data, with the parameter posterior distributions used to construct predicted (all age) (sero)prevalence curves and associated 95% Bayesian credible intervals (BCIs). Best-fitting model selected by deviance information criterion (DIC); both models presented if difference between DIC < 2 (both models have similar support based on the data); a difference > 10 units indicates that the models are significantly different and therefore only superior fitting model (lowest DIC) is presented. The non-zero predicted (sero)prevalence at age 0 is due to less than 100% specificity for all tests. The 95% confidence intervals (95% CI) for age-(sero)prevalence data-points are calculated by the Clopper-Pearson exact method.
Figure 4
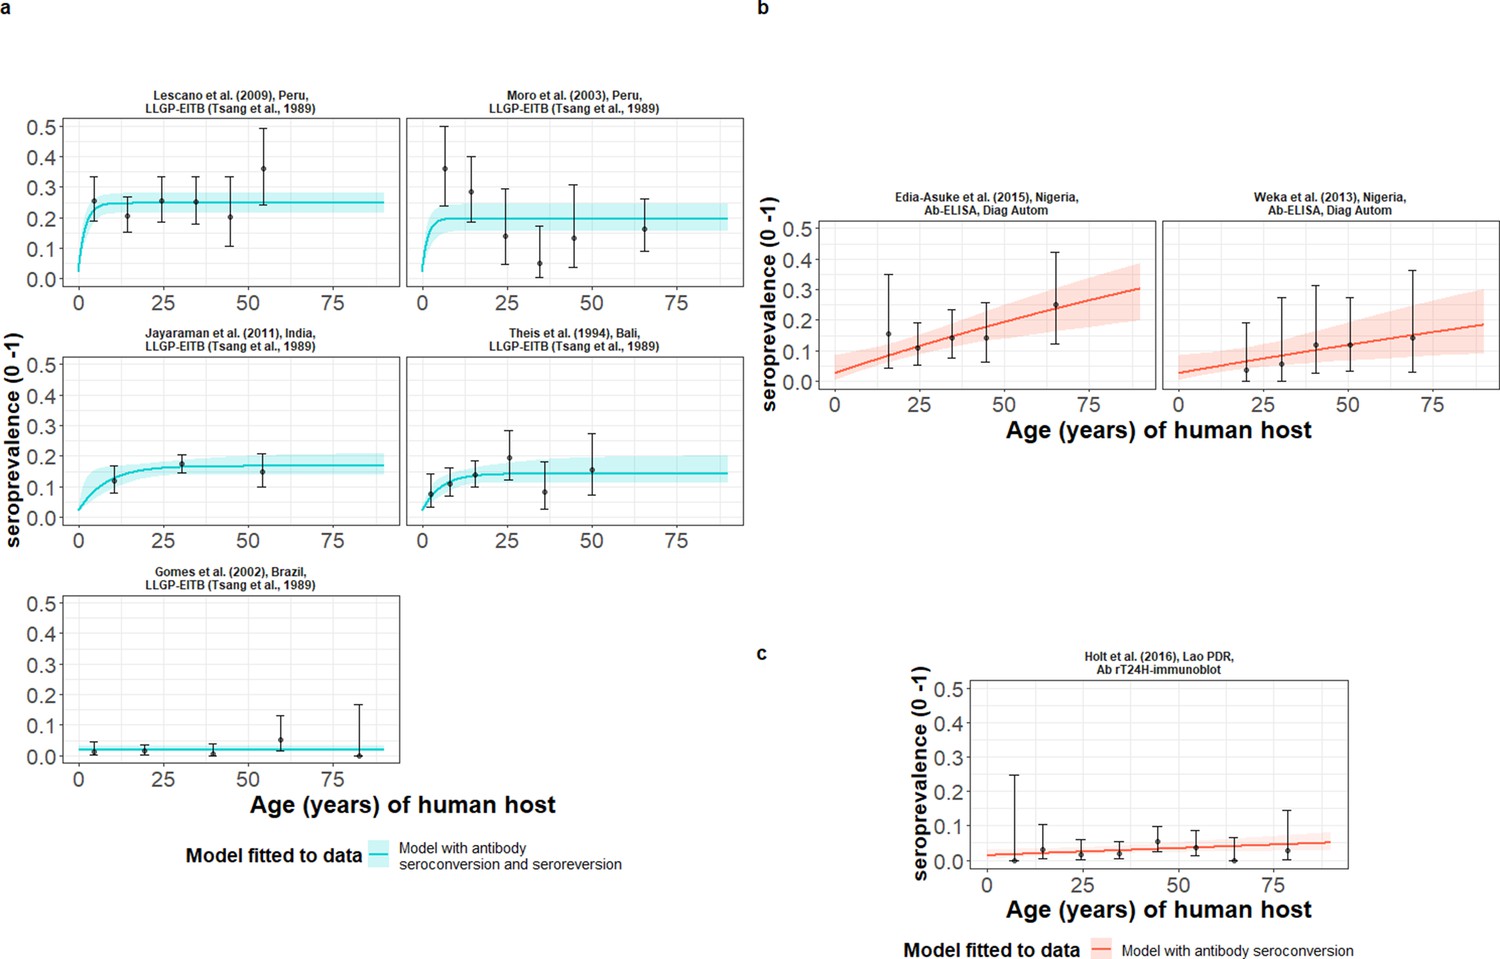
The relationship between human cysticercosis antibody (Ab)-seroprevalence and human age (in years) for each dataset.
Ab-seroconversion (simple) or Ab-seroconversion with Ab-seroreversion (reversible) catalytic models (a & b) jointly fitted to multiple datasets (single diagnostic sensitivity and specificity values estimated; dataset-specific and estimates obtained) and (c) models independently fitted to a single dataset, including 95% confidence intervals associated with observed Ab-seroprevalence point estimates. Bayesian Markov chain Monte Carlo methods were used to fit the models to data, with the estimated parameter posterior distributions used to construct predicted (all age) seroprevalence curves and associated 95% Bayesian credible intervals (BCIs). Best-fitting models were selected using the deviance information criterion (DIC); both models presented if difference between DIC < 2 (both models have similar support based on the data); a difference > 10 units indicates that the models are significantly different and therefore only superior fitting model (lowest DIC) is presented. The non-zero predicted seroprevalence at age 0 is due to less than 100% specificity for all tests. The 95% confidence intervals (95% CIs) for age-seroprevalence data-points are calculated by the Clopper-Pearson exact method.
Figure 5
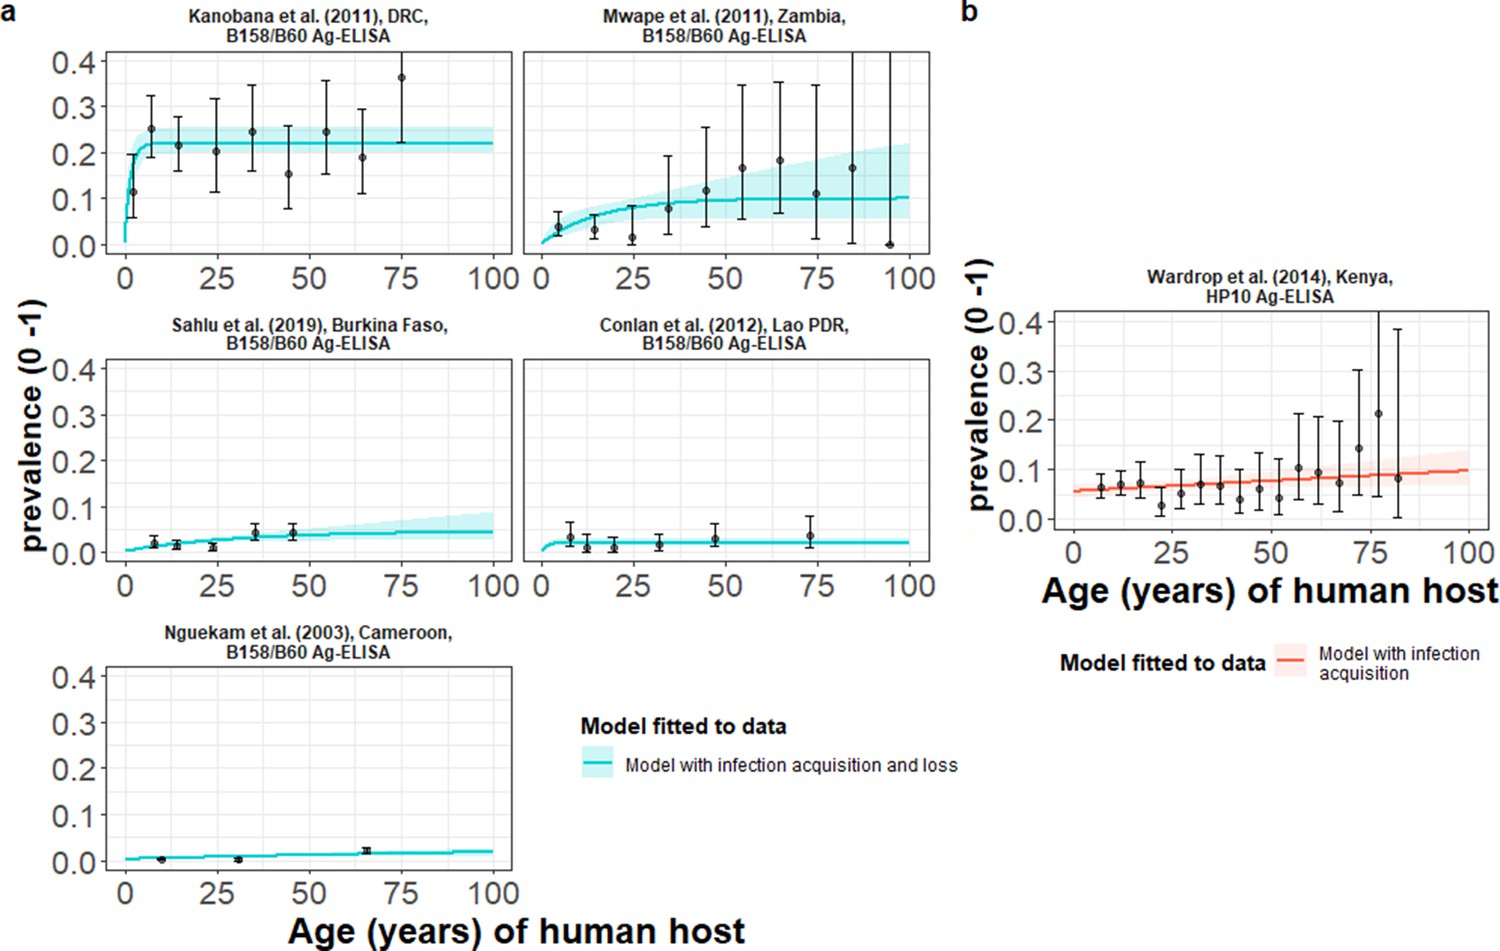
The relationship between human cysticercosis antigen (Ag)-seroprevalence and human age (in years) for each dataset.
Infection acquisition (simple) or infection acquisition and loss (reversible) catalytic models (a) jointly fitted to multiple datasets (single diagnostic sensitivity and specificity values estimated; dataset-specific λinf and ρinf estimates obtained) and (b) models independently fitted to a single dataset, including 95% confidence intervals associated with observed Ag-seroprevalence point estimates. Bayesian Markov chain Monte Carlo methods were used to fit the models to data, with the parameter posterior distributions used to construct predicted (all age) seroprevalence curves and associated 95% Bayesian credible intervals (BCIs). Best-fitting model selected by deviance information criterion (DIC); both models presented if difference between DIC < 2 (both models have similar support based on the data); a difference > 10 units indicates that the models are significantly different and therefore only superior fitting model (lowest DIC) is presented. The non-zero predicted seroprevalence at age 0 is due to less than 100% specificity for all tests. The 95% confidence intervals (95% CI) for age-seroprevalence data-points are calculated by the Clopper-Pearson exact method.
Figure 6 with 3 supplements
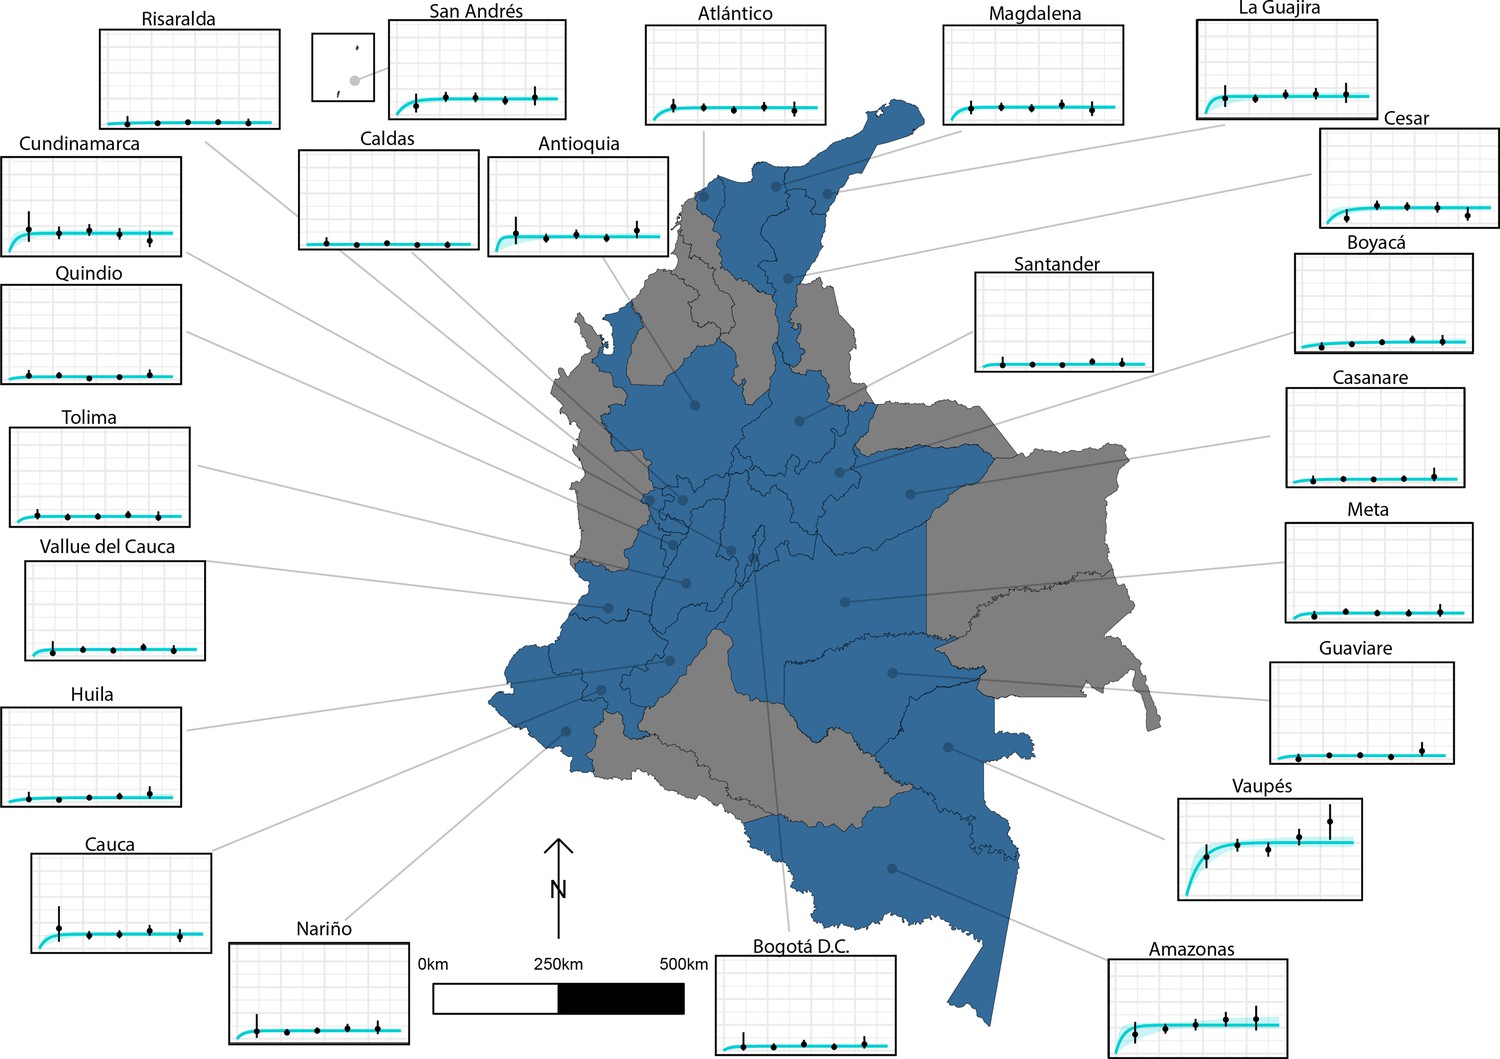
The relationship between human cysticercosis antibody (Ab)-seroprevalence and human age (in years) for 23 departments in Colombia.
Each graph shows observed human cysticercosis Ab age-seroprevalence data (black points) and fitted reversible model (Ab-seroconversion with Ab-seroreversion; best-fitting model). Y-axis units are from 0 to 1 (HCC Ab-seroprevalence), with major y-axis gridlines at 0, 0.2, 0.4, and 0.6 seroprevalence. X-axis units are from 0 to 80 years (human age), with major x-axis gridlines at 0, 20, 40, 60, and 80 years of age.
Figure 6—figure supplement 1

Human cysticercosis antibody (Ab) age-seroprevalence profiles and (selected by Deviance Information Criterion) model with seroconversion and seroreversion model fits to (a) medium all-age Ab-seroprevalence Colombian Departments (6.33–14.37%) and (b) low all-age Ab-seroprevalence Colombian Departments (0.48–4.92%).
For (a) and (b), Departments are arranged in order of highest to lowest overall Department Ab-seroprevalence. Note the different y-axis scale for (a) medium all-age Ab-seroprevalence Departments (0–0.3) and (b) low all-age Ab-seroprevalence Departments (0–0.15).
Figure 6—figure supplement 2

Human cysticercosis antibody serosurvey sample size by department in Colombia.
Blue departments are those included in the model fitting for this chapter. Bolivar* was not included in the model fitting (hence the Department is coloured in grey) - a full assessment is provided in the Results/Discussion of the main text regarding the exclusion of Bolivar. Data from Flórez Sánchez et al., 2013 and the Instituto National de Salud (INS).
Figure 6—figure supplement 3

Colombia (a) age- antibody (Ab) seroprevalence profile stratified by sex for each department (to determine whether profiles clearly differ by sex) and compared to (b) age- Ab-seroprevalence (non-sex stratified) profiles for all 24 departments.
Figure 7 with 1 supplement
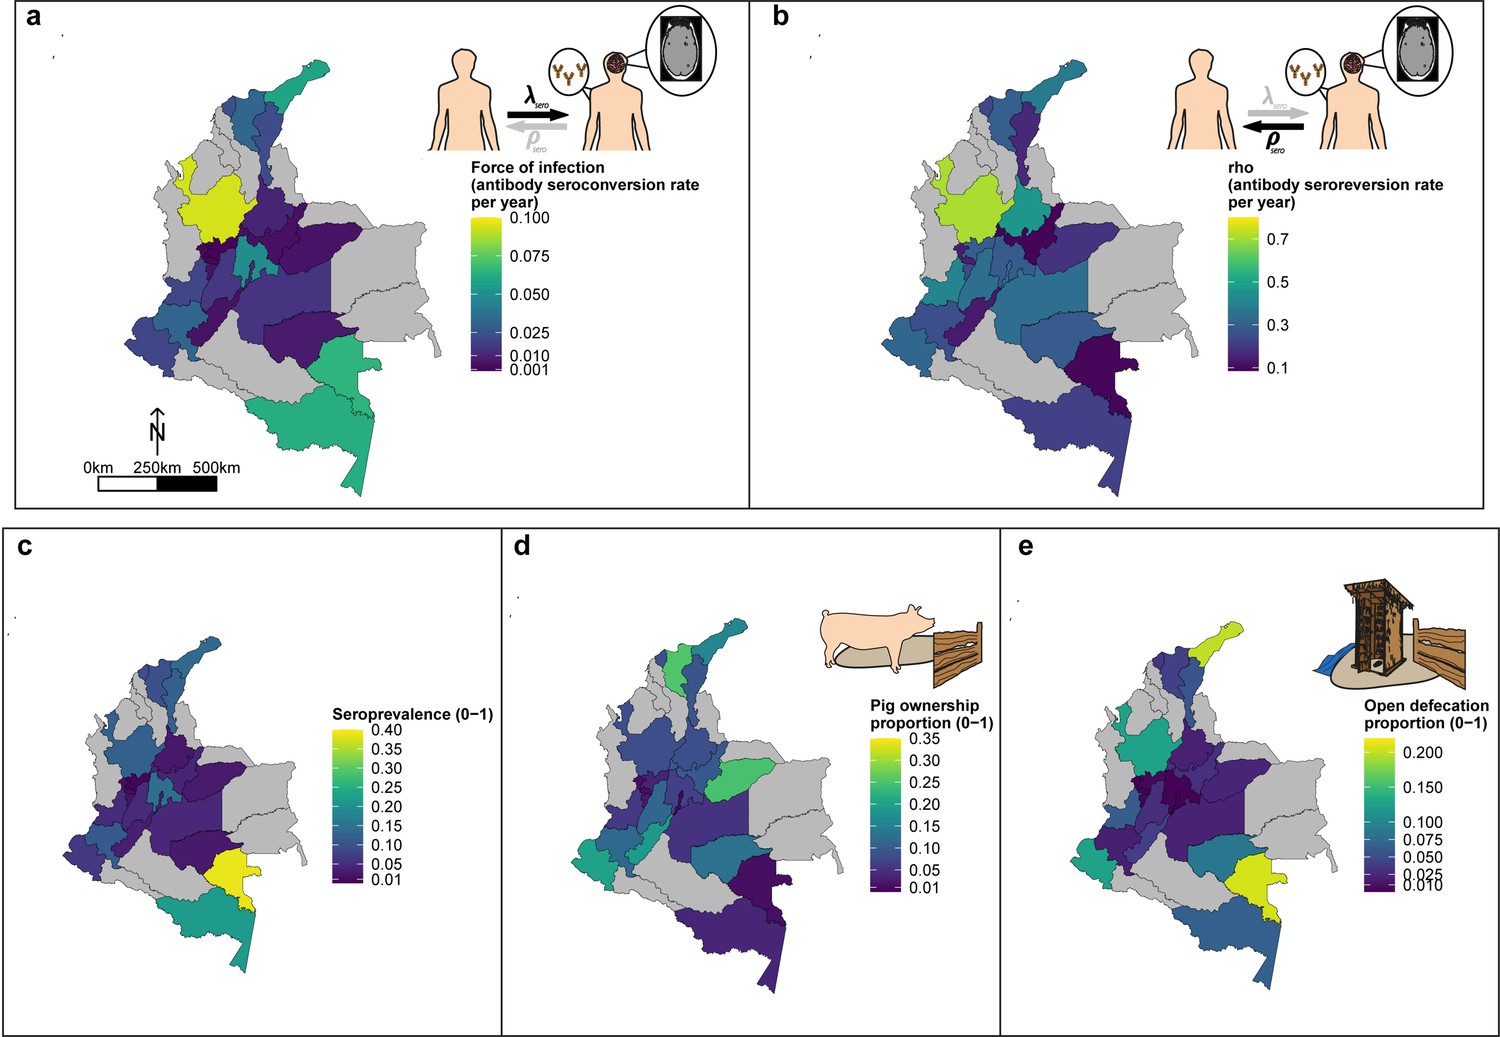
Geographic variation in, (a) HCC antibody (Ab)-seroconversion rate (λsero or FoI), and (b) HCC Ab-seroreversion rate (ρsero), (c) human cysticercosis Ab all-age seroprevalence data, (d) pig ownership proportion and (e) open defecation reported proportion by department.
The FoI (λsero) and Ab-seroreversion (ρsero) rates are parameter estimates obtained from the best-fit model with HCC Ab-seroconversion and Ab-seroreversion (reversible model). Note that San Andrés department is not clearly shown because of its size (small islands located in the top-left of a-c maps). For context, an all-age HCC Ab-seroprevalence=0.126, HCC Ab-seroconversion rate (FoI or λsero)=0.023 year-1, and HCC Ab-seroreversion rate (ρsero)=0.19 year-1 was obtained in San Andrés.
Figure 7—figure supplement 1
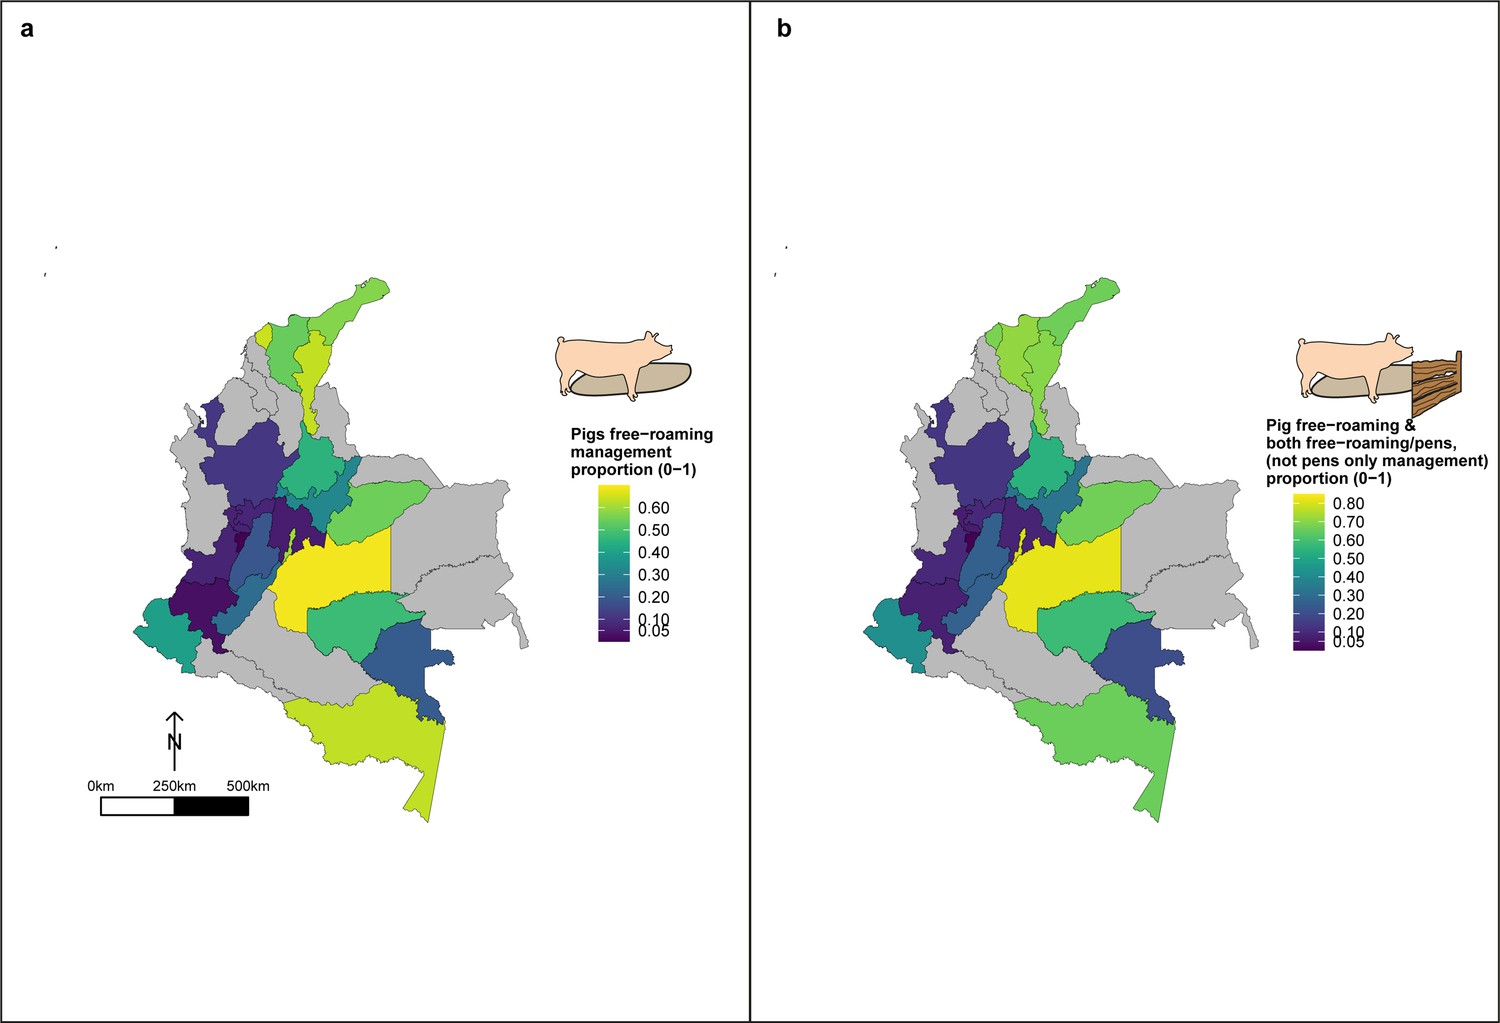
Geographic variation in, (a) proportion of pigs which free-roam as a management strategy and (b) proportion of pigs which free roam or are held in mixed systems as a management strategy.
These proportions are for a subset of the total dataset, only analysing those owning pigs (n=3,157).
Figure 8 with 2 supplements
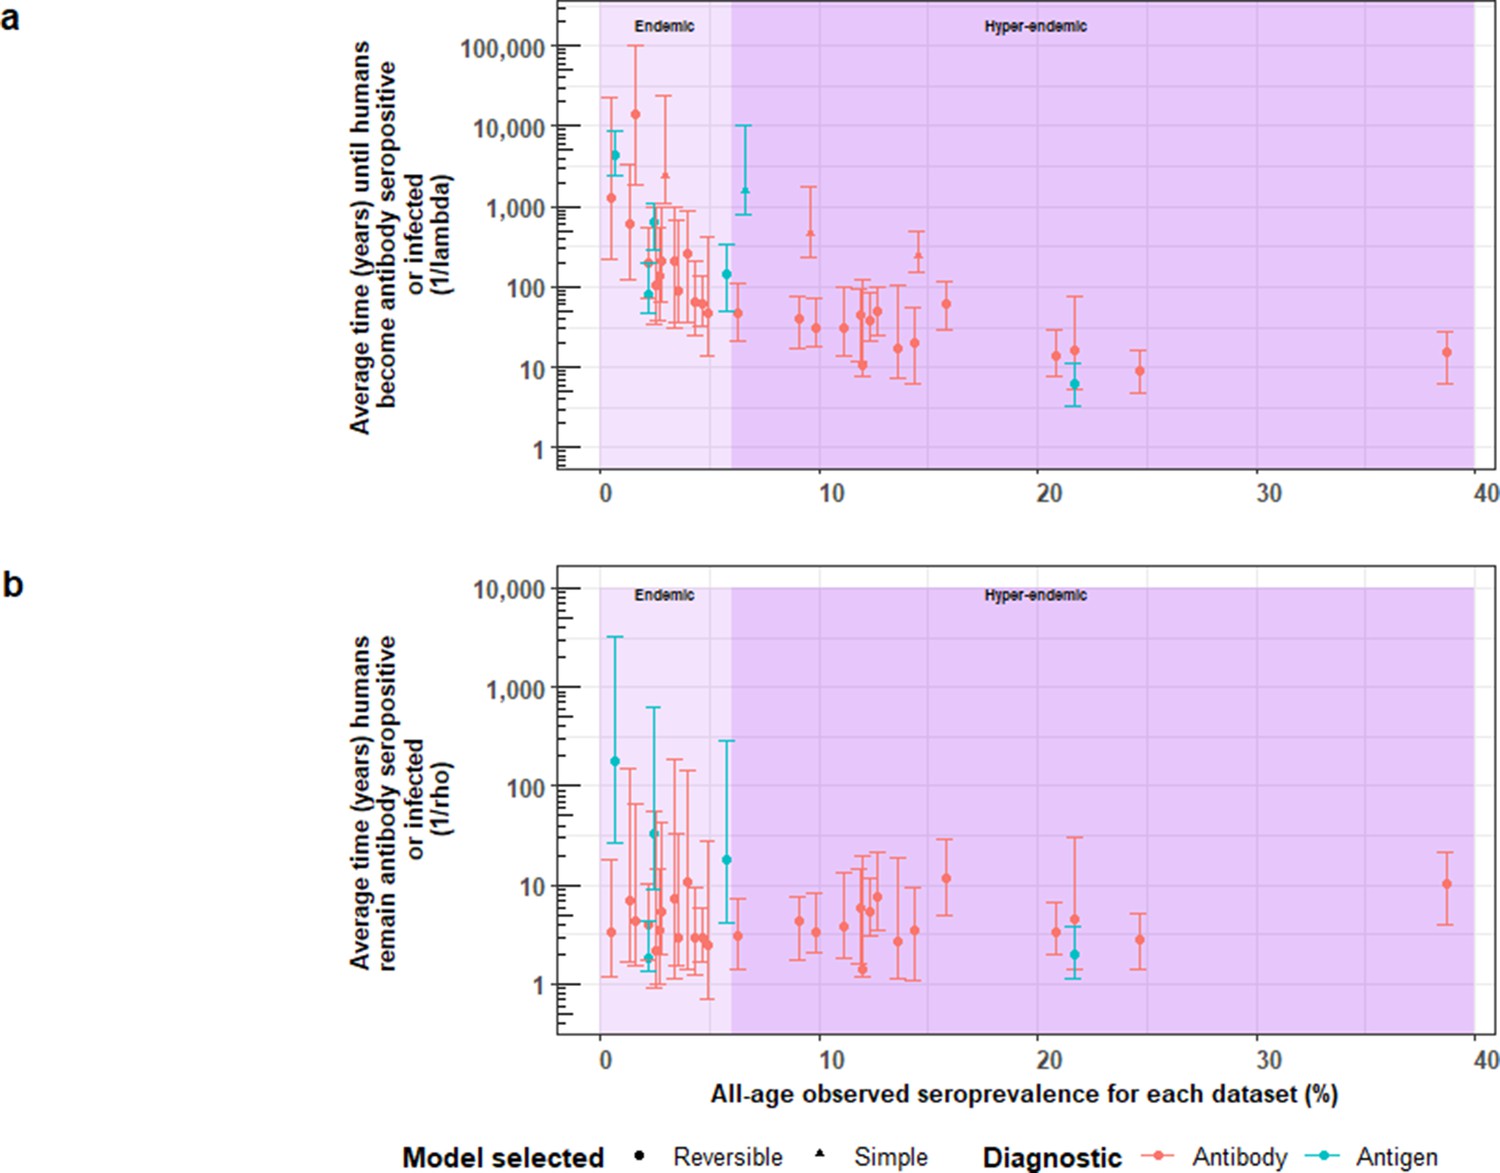
The relationship between (a) the average time until humans become cysticercosis antibody (Ab)-seropositive or infected (1/λ) and overall (all-age) seroprevalence, and (b) the average time humans remain cysticercosis Ab seropositive or infected (1/ρ) and overall (all-age) seroprevalence.
The plot is stratified by proposed endemicity levels defined as endemic (>0% and<6% all-age HCC seroprevalence), and hyperendemic (≥6% all-age HCC seroprevalence).
Figure 8—figure supplement 1
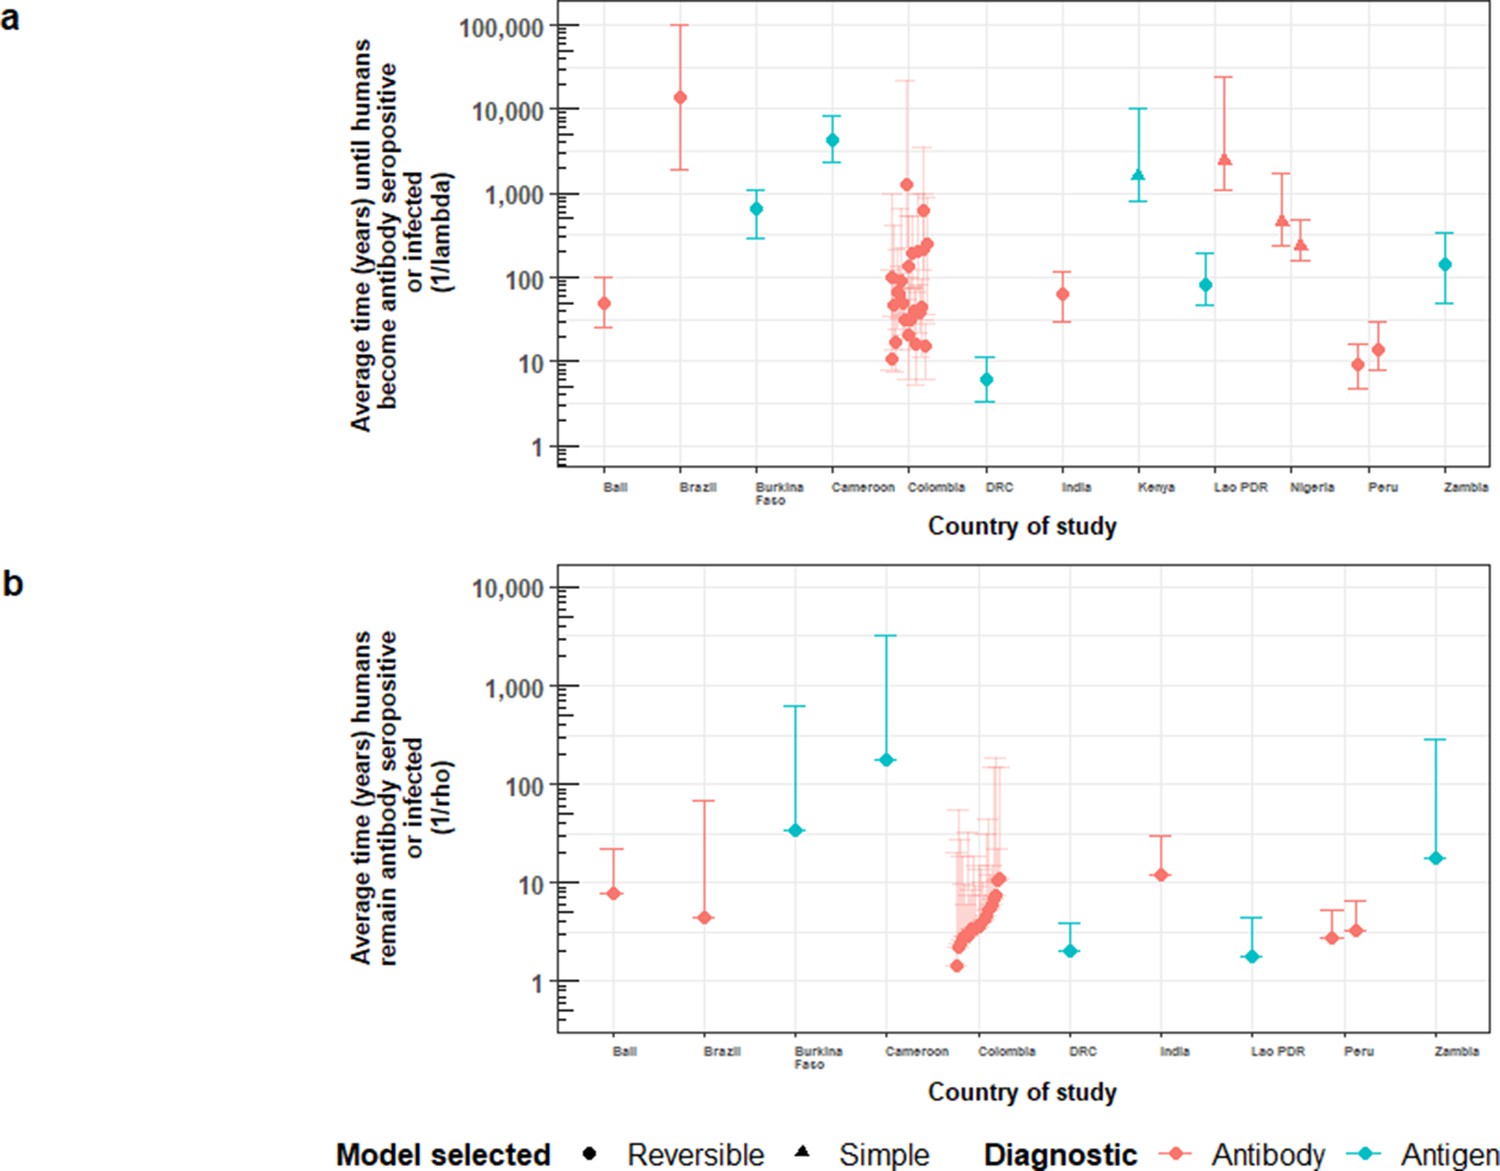
Country-specific estimates of (a) the average time (in years) until humans become cysticercosis antibody (Ab)-seropositive or infected (1/λ, vertical axis), and (b) the average time (in years) humans remain HCC Ab-seropositive or infected (1/ρ, vertical axis).
Marker colour denotes: red = Ab-seroprevalence; blue = antigen seroprevalence. Solid diamonds denote the use of the reversible catalytic model; circles are for the simple (Ab-seroconversion-only) model. Error bars are 95% Bayesian Credible Intervals around estimates. Colombia department error-bars are translucid to improve visibility of median estimates.
Figure 8—figure supplement 2
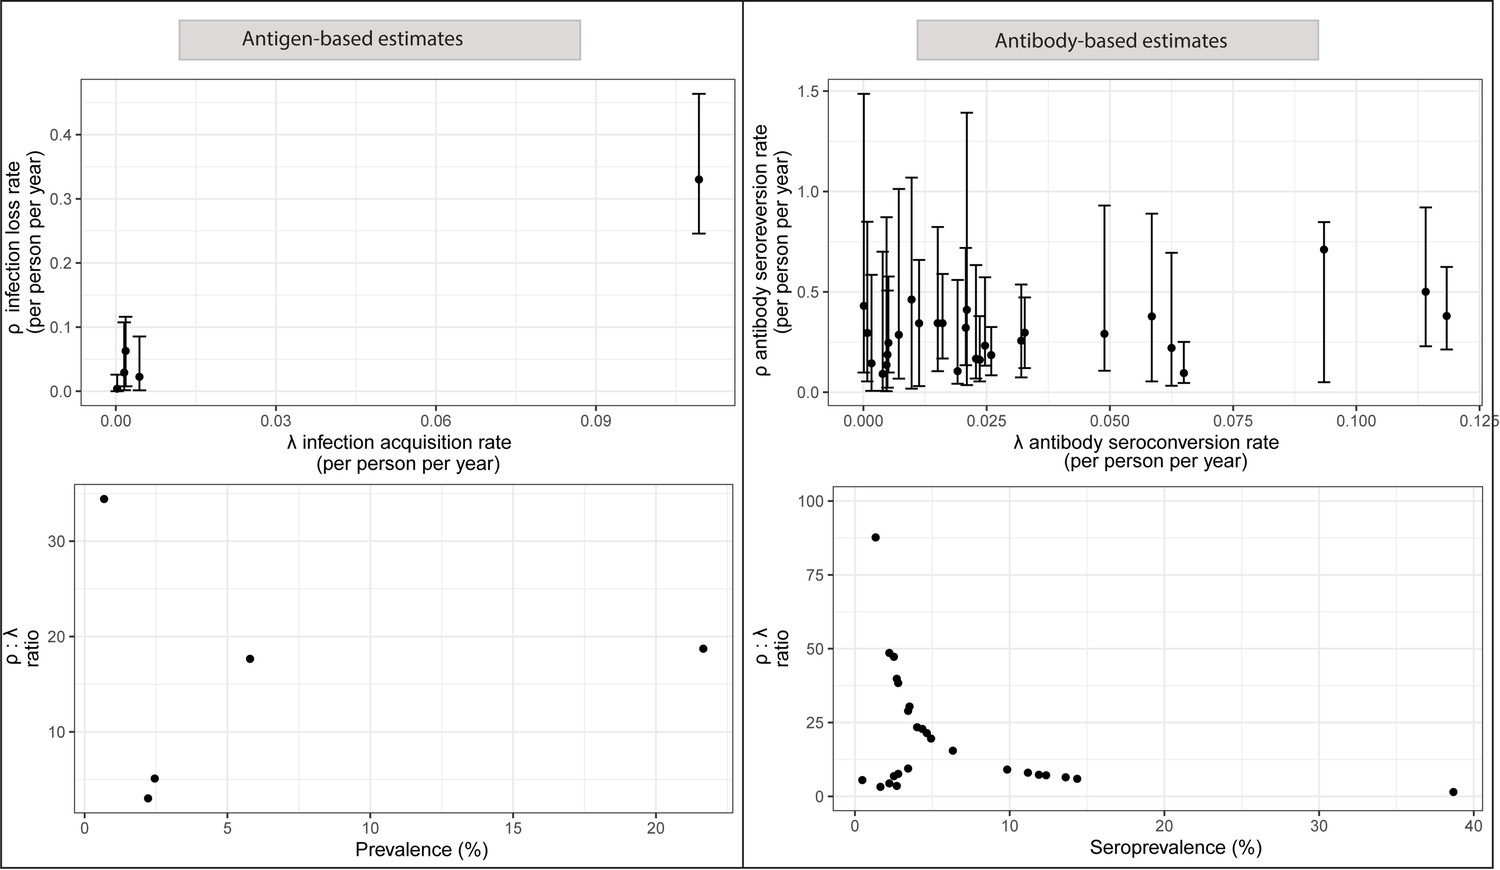
Trends in ρ for increasing force-of-infection (FoI; λ) estimates for antigen-based estimates (a) and antibody (Ab)-based estimates (b), and trends in the infection loss (ρinf) to infection acquisition (λinf) rates by increasing prevalence for antigen-based estimates (c) and trends in Ab-seroreversion (ρsero) to Ab-seroconversion (λsero) rates by increasing Ab-seroprevalence for Ab-based estimates (d).
The bottom panels show whether the magnitude in difference between ρ: λ with increasing (sero)prevalence (as a proxy for transmission intensity).
Figure 9
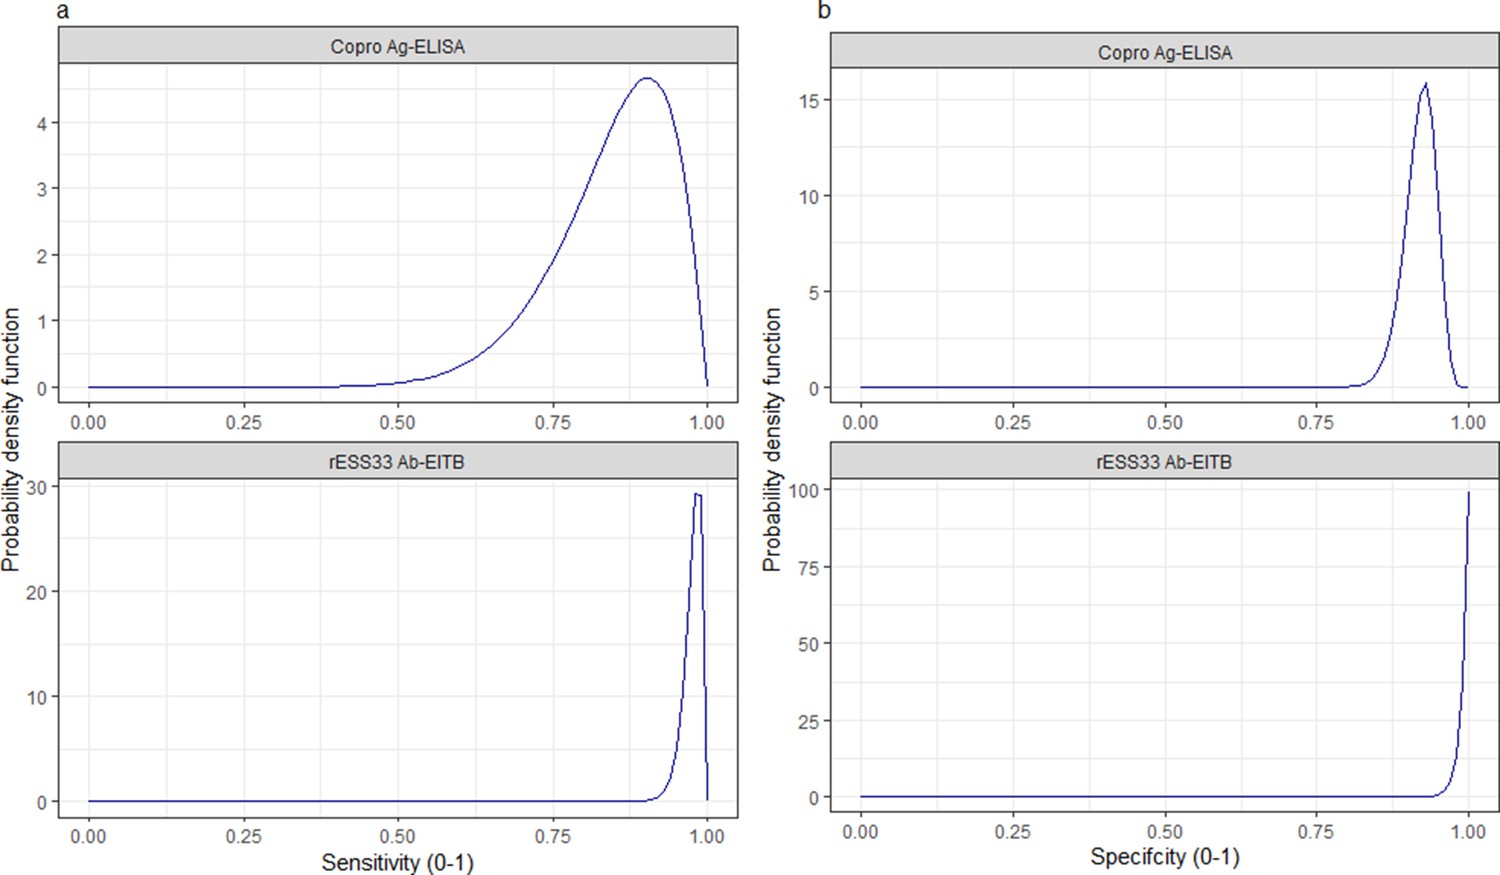
Informative beta distribution priors constructed for sensitivity and specificity parameters for each human taeniasis diagnostic.
β prior distributions for: (a) sensitivity (se) (left-hand column plots); (b) specificity (sp) (right-hand column plots) of each diagnostic, constructed with α and β shape parameters provided in Supplementary file 1. The β distribution provides a more flexible alternative to the uniform distribution, where the parameters of interest are constrained between 0 and 1. The shape parameters were chosen based on the literature estimates of se and sp (whereby α/(α+β)) equals the mean of the distribution (Lambert, 2018), and adapted where required to ensure that the spread of the prior distribution included the 95% confidence intervals identified in the literature. Ag: antigen; ELISA: enzyme-linked immunosorbent assay; Ab: antibody; EITB: enzyme-linked immunoelectrotransfer blot.
Figure 10
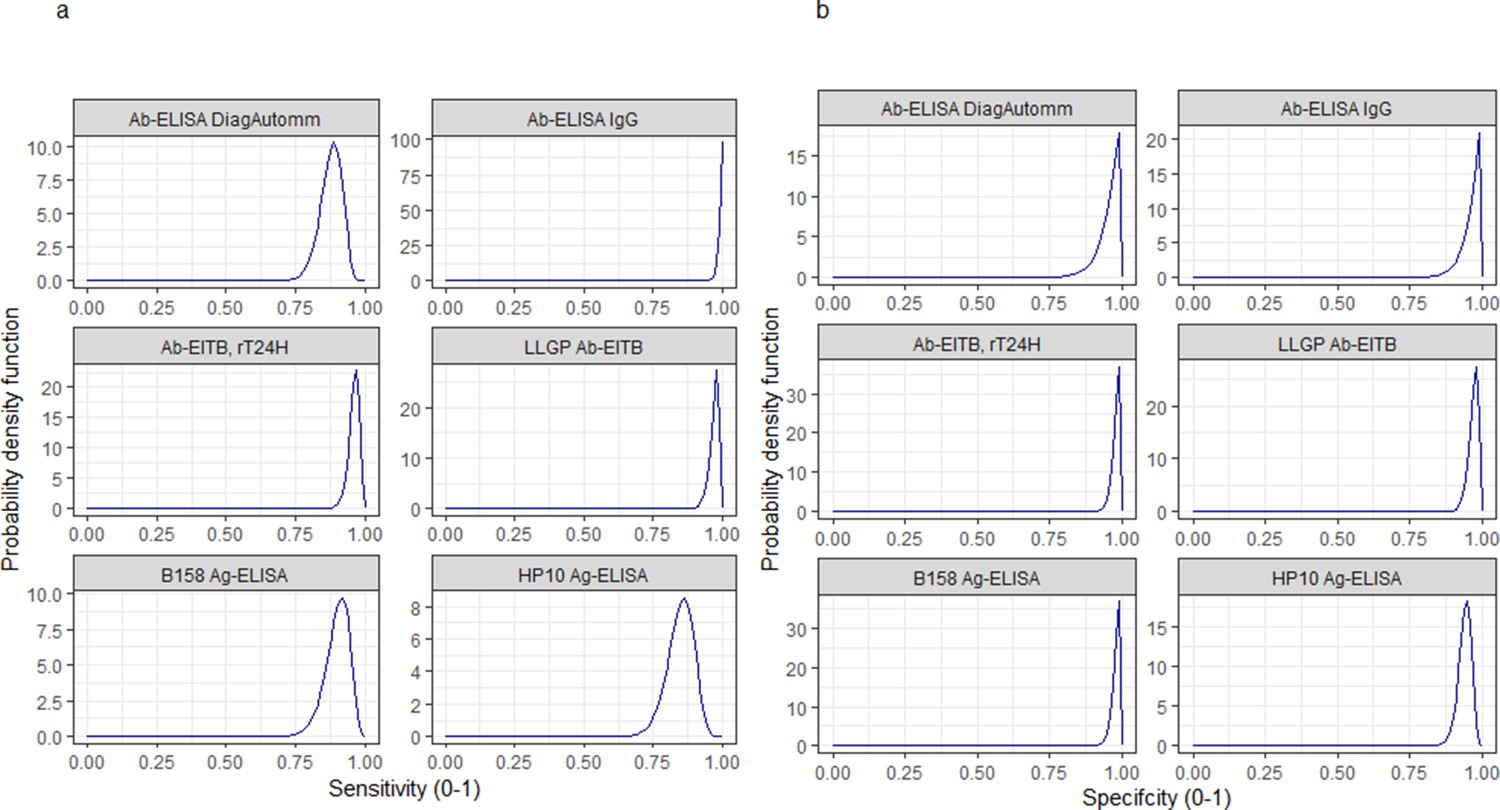
Informative beta distribution priors constructed for sensitivity and specificity parameters for each human cysticercosis diagnostic.
β prior distributions for: (a) sensitivity (se) and (b) specificity (sp) of each diagnostic, constructed with α and β shape parameters provided in Supplementary file 1. The β distribution provides a more flexible alternative to the uniform distribution where the parameters of interest are constrained between 0 and 1 (Lambert, 2018). The shape parameters were chosen based on the literature estimates of se and sp (whereby α/(α+β)) equals the mean of the distribution (Lambert, 2018), and adapted where required to ensure that the spread of the prior distribution included the 95% confidence intervals identified in the literature. Ab: antibody; ELISA: enzyme-linked immunosorbent assay; EITB: enzyme-linked immunoelectrotransfer blot; LLGP: lentil lectin-purified glycoprotein; Ig: immunoglobulin; Ag: antigen.
Tables
Table 1
Parameter posterior estimates for the best-fit catalytic models fitted to human taeniasis age-(sero)prevalence datasets (ordered by decreasing all-age (sero)prevalence).
Parameters estimated from antibody-based datasets measure exposure dynamics, with seroconversion λsero and seroreversion ρsero rates. Parameters estimated from antigen-based datasets measure active infection dynamics, with infection acquisition λinf and infection loss ρinf rates.
| Dataset; Country | All-age observed (sero)- prevalence (%)(95% CI)* | Catalytic model | Diagnostic sensitivity(95% BCI) | Diagnostic specificity(95% BCI) | λ=infection acquisition (λinf) or Ab-seroconversion (λsero) rate, year–1(95% BCI)† | ρ=infection loss (ρinf) orAb-seroreversion (ρsero) rate, year–1(95% BCI)† |
|---|---|---|---|---|---|---|
| Models jointly fitted to multiple datasets (Copro-Ag ELISA) ‡ | ||||||
| Mwape et al., 2012; Zambia Antigen § | 6.32 (4.65–8.37) | Reversible ¶ | 0.824 (0.533–0.972) | 0.959 (0.941–0.976) | 0.021 (0.0038–0.062) | 0.768 (0.362–0.991) |
| Gomes et al., 2002; Brazil Antigen** | 4.51 (2.97–6.54) | 0.0096 (0.00072–0.032) | 0.731 (0.379–0.978) | |||
| Models independently fitted to single datasets (rES33-immunoblot)†† | ||||||
| Holt et al., 2016; Lao PDR Antibody | 2.49 (1.51–3.87) | Simple ‡ ‡ | 0.982 (0.959–0.996) | 0.992 (0.978–0.999) | 0.00044 (0.000103–0.00082) | NA |
-
*
Observed (sero)prevalence data are accompanied by 95% confidence intervals (95% CI) calculated by the Clopper-Pearson exact method.
-
†
Parameter median posterior estimates are presented with 95% Bayesian credible intervals (95% BCI).
-
‡
Diagnostic sensitivity and specificity jointly fitted for the Copro-Ag ELISA (Allan et al., 1990) across age-prevalence datasets; model parameters interpreted in terms of representing infection, with infection acquisition (λinf) and infection loss (ρinf) rates.
-
§
Based on the Allan et al., 1990 protocol.
-
¶
Best-fitting model determined by DIC (models jointly fitted to multiple dataset).
-
**
no protocol specified (assumed to be the Allan et al., 1990 protocol). NA = Not applicable;, PDR: People’s Democratic Republic.
-
††
Model parameters for antibody-based age-seroprevalence data (based on the rES33-immunoblot Wilkins et al., 1999), interpreted in terms of exposure, with Ab-seroconversion (λsero) and Ab-seroreversion (ρsero) rates.
-
‡ ‡
Best-fitting model determined by DIC (models independently fitted to single dataset).
Table 2
Antibody seroprevalence and parameter estimates for the best-fit catalytic models fitted to each observed human cysticercosis (antibody) age-seroprevalence dataset (ordered by decreasing all-age seroprevalence).
Antibody seroconversion and seroreversion rates represent markers of exposure.
| Dataset;Country | All-age observed sero- prevalence (%)(95% CI)* | Catalytic model | Diagnostic sensitivity(95% BCI) | Diagnostic specificity(95% BCI) | λserosero seroconversion rate, year–1(95% BCI)† | ρserosero seroreversion rate, year–1(95% BCI)† |
|---|---|---|---|---|---|---|
| Models jointly fitted to multiple datasets (LLGP-EITB assay) ‡ | ||||||
| Lescano et al., 2009; Peru | 24.66 (21.59–27.94) | Reversible§ | 0.976 (0.937–0.994) | 0.980 (0.967–0.988) | 0.12 (0.067–0.19) | 0.38 (0.21–0.62) |
| Moro et al., 2003; Peru | 20.82 (16.48–25.71) | 0.11 (0.0504–0.21) | 0.501 (0.23–0.92) | |||
| Jayaraman et al., 2011; India | 15.81 (13.66–18.16) | 0.019 (0.0095–0.093) | 0.105 (0.042–0.56) | |||
| Theis et al., 1994; Bali | 12.68 (10.48–15.16) | 0.024 (0.011–0.052) | 0.16 (0.054–0.38) | |||
| Gomes et al., 2002; Brazil | 1.64 (0.82–2.93) | 0.000086 (0.000011–0.00066) | 0.43 (0.098–1.49) | |||
| Models jointly fitted to multiple datasets (IgG Ab-ELISA) ¶ | ||||||
| Edia-Asuke et al., 2015; Nigeria | 14.53 (10.72–19.06) | Simple§ | 0.872 (0.784–0.942) | 0.974 (0.916–0.998) | 0.0044 (0.0018–0.0064) | NA |
| Weka et al., 2013; Nigeria | 9.60 (5.06–16.17) | 0.0023 (0.00053–0.0046) | NA | |||
| Models independently fitted to an single dataset (rT24H-immunoblot)** | ||||||
| Holt et al., 2016; Lao PDR | 2.96 (1.86–4.44) | Simple†† | 0.964 (0.914–0.988) | 0.986 (0.969–0.997) | 0.00044 (0.000049–0.00090) | NA |
-
*
Observed seroprevalence data are accompanied by 95% confidence intervals (95% CI) calculated by the Clopper-Pearson exact method.
-
†
Parameter median posterior estimates are presented with 95% Bayesian credible intervals (95% BCI). NA = Not applicable; PDR: People’s Democratic Republic.
-
‡
Diagnostic sensitivity and specificity jointly fitted for the LLGP-EITB assay (Tsang et al., 1989) across datasets.
-
§
Best-fitting model determined by DIC (models jointly fitted to multiple datasets).
-
¶
Diagnostic sensitivity and specificity jointly fitted for the IgG Ab-ELISA (DiagnosticAutomation/CortezDiagnostic, Inc, 2016) across datasets.
-
**
Best-fitting model determined by DIC (models independently fitted to a single dataset).
-
††
Based on the rT24H-immunoblot (Hancock et al., 2006).
Table 3
Antigen seroprevalence and parameter estimates for the best-fit catalytic models fitted to each observed human cysticercosis (antigen) age-seroprevalence dataset (ordered by decreasing all-age seroprevalence).
Antigen-based infection acquisition and infection loss rates represent markers of active infection.
| Dataset;Country | All-age observed seroprevalence (%) (95% CI)* | Catalytic model | Diagnostic sensitivity(95% BCI) | Diagnostic specificity(95% BCI) | λinfinf infection acquisition rate, year–1(95% BCI)† | ρinfinf infection loss rate, year–1(95% BCI)† |
|---|---|---|---|---|---|---|
| Models jointly fitted to multiple datasets (the B158/B60 Ag-ELISA) ‡ | ||||||
| Kanobana et al., 2011; DRC | 21.66 (19.01–24.49) | Reversible § | 0.909 (0.810–0.967) | 0.999 (0.995–0.999) | 0.11 (0.077–0.17) | 0.330 (0.246–0.464) |
| Mwape et al., 2012; Zambia | 5.79 (4.19–7.77) | 0.0044 (0.0027–0.0088) | 0.023 (0.001–0.085) | |||
| Sahlu et al., 2019; Burkina Faso | 2.45 (1.93–3.08) | 0.0016 (0.00091–0.0032) | 0.029 (0.0016–0.11) | |||
| Conlan et al., 2012; Lao PDR | 2.22 (1.49–3.17) | 0.0018 (0.00073–0.0034) | 0.063 (0.0076–0.12) | |||
| Nguekam et al., 2003; Cameroon | 0.68 (0.47–0.95) | 0.00017 (0.000077–0.00030) | 0.004 (0.00018–0.026) | |||
| Models independently fitted to a single dataset (the HP10 Ag-ELISA) ¶ | ||||||
| Wardrop et al., 2015; Kenya | 6.61 (5.57–7.76) | Simple** | 0.850 (0.735–0.927) | 0.944 (0.930–0.959) | 0.00054 (0.000053–0.0013) | NA |
-
NA = Not applicable;.DRC: Democratic Republic of the Congo; PDR: People’s Democratic Republic.
-
*
*Observed seroprevalence data are accompanied by 95% confidence intervals (95% CI) calculated by the Clopper-Pearson exact method.
-
†
Parameter median posterior estimates are presented with 95% Bayesian credible intervals (95% BCI).
-
‡
Diagnostic sensitivity and specificity jointly fitted for the B158/B60 Ag-ELISA (Brandt et al., 1992; Dorny et al., 2000).
-
§
Best-fitting model determined by DIC (models jointly fitted to multiple datasets).
-
¶
Based on the HP10 Ag-ELISA (Harrison et al., 1989).
-
**
Best-fitting model determined by DIC (models independently fitted to a single dataset).
Table 4
Range for force-of-infection (FoI), λ, and seroreversion / infection loss, ρ, uniform priors.
| T.T. solium indicator | λ: limits on uniform prior (year–1) | ρ: limits on uniform prior (year–1) | Rationale |
|---|---|---|---|
| HTT (copro-antigen (Ag) and antibody (Ab)) | Minimum: 0 Maximum: 12 | Minimum: 0.333 Maximum: 1 | λ: maximum seroconversion rate of 12 year–1=1 month–1 (1/λ), representing the lower limit before humans become copro-Ag positive (i.e., infected) or Ab-seropositive of 1 month ρ: minimum Ab-seroreversion or infection loss rate of 0.333 year–1=0.0277 month–1, or 36 month duration (1/ρ) for humans to remain copro-Ag (i.e. infected) or Ab- seropositive, reflecting the upper average limit assumed for the life- expectancy of adult Taenia solium of 3 years (Gonzalez and Rosenheck, 2002); a maximum of 0.0833 month–1 represents the minimum time humans remain copro-Ag (i.e., infected) or Ab-seropositive reflecting the minimum life-expectancy of the adult worm of 12 months (García et al., 2003) (1/ ρ) |
| HCC (antigen and antibody) | Minimum: 0 Maximum: 12 | Minimum: 0 Maximum: 12 | Both λ and ρ: maximum infection acquisition/loss or Ab-seroconversion / Ab-seroreversion rate of 12 year–1=1 month–1 represents the lower limit before humans acquire infection or become Ab-seropositive (1/λ), or remain HCC antigen (i.e., infected) or Ab-seropositivity (1/ρ) of 1 month. |
-
N.B. The reciprocal of the rates of λ and ρ give the duration of susceptibility (1/λ; 1/λsero for Ab-based, or 1/λinf for Ag-based) or of remaining infected or Ab-seropositive (1/ρ; 1/ρsero for Ab-based, or 1/ρinf for Ag-based). HTT: human taeniasis; Ab: antibody; Ag: antigen; HCC: human cysticercosis.
Additional files
-
Supplementary file 1
Summary of studies included in final analysis and the diagnostic parameters used to set the probabilistic constraints for sensitivity and specificity of each test.
†Sensitivity and specificity estimated in a Bayesian framework by Praet et al., 2013; †† sensitivity and specificity based on exposure estimated in a Bayesian framework by Praet et al., 2010; *limited information on the specific protocol used for the copro-antigen assay; * Flórez Sánchez et al., 2013 indicate that this diagnostic is suitable to determine exposure through detection of anti-cysticercus immunoglobulin G (IgG) antibodies and was evaluated in Colombian patients to assess cross-reactions with different infectious agents (Taenia saginata, Hymenolepis nana, Echinococcus sp., Fasciola hepatica, Entamoeba histolytica, Ascaris lumbricoides, Mansonella ozzardi, Treponema pallidum, Cryptococcus neoformans and HIV); ** sensitivity and specificity estimated in a Bayesian framework by Praet et al., 2010; ‡ 95%CIs not provided to inform priors, therefore minimal uncertainty introduced around the sensitivity and specificity estimates to construct priors. Original data for two datasets available (under the Creative Commons Attribution License; CC BY 4.0) from the ‡‡International Livestock Research Institute open-access repository (http://data.ilri.org/portal/dataset/ecozd) referenced in Holt et al., 2016 and ‡‡‡University of Liverpool open-access repository (http://datacat.liverpool.ac.uk/352/) referenced in Fèvre et al., 2017; ⱡ sensitivity and specificity estimated in Fleury et al., 2007. DRC: Democratic Republic of the Congo; LPDR: Lao People’s Democratic Republic; Ag; antigen; Ab: antibody; ELISA: enzyme-linked immunosorbent assay; LLGP-EITB: Lentil lectin-purified glycoprotein enzyme-linked immunoelectrotransfer blot; Ig: immunoglobulin; km: kilometers, PCC: porcine cysticercosis; RCT: randomized controlled trial.
- https://cdn.elifesciences.org/articles/76988/elife-76988-supp1-v1.docx
-
Supplementary file 2
Observed prevalence estimates from sub-Saharan Africa, South America, and Asia for studies referring to “hyper-“or “highly-“endemic setting for human taeniasis (HTT) and human cysticercosis (HCC).
* rES38 Ab-immunblot (Wilkins et al., 1999) ** rT24H Ab-ELISA (Hancock et al., 2006) †B158/B60 Ag-ELISA (Brandt et al., 1992; Dorny et al., 2000) †† LLGP-EITB (Tsang et al., 1989) ⱡAb-ELISA confirmed by immunoblot (Sato et al., 2018) ⱡ ⱡCopro-PCR (Sato et al., 2018). DRC: Democratic Republic of the Congo (DRC); Lao PDR: Lao People’s Democratic Republic.
- https://cdn.elifesciences.org/articles/76988/elife-76988-supp2-v1.docx
-
Supplementary file 3
The deviance information criterion (DIC) and parameter estimates for simple and reversible catalytic models fitted to each observed human taeniasis (antibody and antigen) age-seroprevalence dataset (ordered by decreasing value of all-age seroprevalence).
For diagnostic methods used see the corresponding study in Supplementary file 1. Seroprevalence results are accompanied by 95% confidence intervals (95% CI) calculated by the Clopper-Pearson exact method. Parameter median posterior estimates are presented with 95% Bayesian credible intervals (95% BCI) and Deviance information criterion (DIC) model fitting scores; * Diagnostic sensitivity and specificity jointly fitted for the Copro-Ag ELISA (Coral-Almeida et al., 2015). † Best-fitting model determined by DIC (jointly-fitted dataset). †† Best-fitting model determined by DIC (individually-fitted dataset). NA = Not applicable; PDR: People’s Democratic Republic.
- https://cdn.elifesciences.org/articles/76988/elife-76988-supp3-v1.docx
-
Supplementary file 4
The deviance information criterion (DIC) and parameter estimates for simple and reversible catalytic models fitted to each observed human cysticercosis antibody age-seroprevalence dataset (ordered by decreasing value of all-age seroprevalence).
For diagnostic methods used see the corresponding study in Supplementary file 1. Seroprevalence results are accompanied by 95% confidence intervals (95% CI) calculated by the Clopper-Pearson exact method. Parameter median posterior estimates are presented with 95% Bayesian credible intervals (95% BCI) and Deviance information criterion (DIC) model fitting scores; * Diagnostic sensitivity and specificity for the antibody lentil lectin-purified glycoprotein enzyme-linked immunoelectrotransfer blot (Ab LLGP-EITB) assay (Tsang et al., 1989) were jointly fitted across datasets. ** Diagnostic sensitivity and specificity for the antibody Ab-ELISA (DiagnosticAutomation/CortezDiagnostic (2006)) assay were jointly fitted across datasets. † Best-fitting model determined by DIC (jointly-fitted dataset). †† Best-fitting model determined by DIC (individually-fitted dataset). NA = Not applicable; PDR: People’s Democratic Republic.
- https://cdn.elifesciences.org/articles/76988/elife-76988-supp4-v1.docx
-
Supplementary file 5
The deviance information criterion (DIC) and parameter estimates for simple and reversible catalytic models fitted to each observed human cysticercosis antigen age-seroprevalence dataset (ordered by decreasing value of all-age seroprevalence).
For diagnostic methods used see the corresponding study in Supplementary file 1. Seroprevalence results are accompanied by 95% confidence intervals (95% CI) calculated by the Clopper-Pearson exact method. Parameter median posterior estimates are presented with 95% Bayesian credible intervals (95% BCI) and Deviance information criterion (DIC) model fitting scores; * Diagnostic sensitivity and specificity for the B158/B60 Ag-ELISA (Brandt et al., 1992; Dorny et al., 2000). † Best-fitting model determined by DIC (jointly-fitted dataset). †† Best-fitting model determined by DIC (individually-fitted dataset). NA = Not applicable; DRC: Democratic Republic of the Congo; PDR: People’s Democratic Republic.
- https://cdn.elifesciences.org/articles/76988/elife-76988-supp5-v1.docx
-
Supplementary file 6
The deviance information criterion (DIC) and parameter estimates for the reversible catalytic model jointly fitted (for diagnostic sensitivity and specificity) to the observed human cysticercosis antibody age-seroprevalence for each available department in Colombia (n=23, ordered by decreasing value of all-age seroprevalence).
For diagnostic methods used see the corresponding study in Supplementary file 1. DIC score for the reversible model was –401.78. Jointly-fitted diagnostic sensitivity was 0.989 (95%BCI: 0.946–0.999) and specificity was 0.998 (95%BCI: 0.993–0.999). Seroprevalence results are accompanied by 95% confidence intervals (95% CI) calculated by the Clopper-Pearson exact method. Parameter median posterior estimates are presented with 95% Bayesian credible intervals (95% BCI) and Deviance information criterion (DIC) model fitting scores.
- https://cdn.elifesciences.org/articles/76988/elife-76988-supp6-v1.docx
-
Supplementary file 7
The deviance information criterion (DIC) and parameter estimates for the simple catalytic model jointly fitted (for diagnostic sensitivity and specificity) to the observed human cysticercosis antibody age-seroprevalence for each available department in Colombia (n=23, ordered by decreasing value of all-age seroprevalence).
For diagnostic methods used see the corresponding study in Supplementary file 1. DIC score for the simple model was –442.7. Jointly-fitted diagnostic sensitivity was 0.987 (95%BCI: 0.966–0.999) and specificity was 0.980 (95%BCI: 0.975–0.984). Seroprevalence results are accompanied by 95% confidence intervals (95% CI) calculated by the Clopper-Pearson exact method. Parameter median posterior estimates are presented with 95% Bayesian credible intervals (95% BCI) and Deviance information criterion (DIC) model fitting scores.
- https://cdn.elifesciences.org/articles/76988/elife-76988-supp7-v1.docx
-
Supplementary file 8
PRIME-NTD (Policy-Relevant Items for Reporting Models in Epidemiology of Neglected Tropical Diseases) Summary.
Adapted from Behrend et al., 2020. Full formulation of the principles:
Don't do it alone. Engage stakeholders throughout, from the formulation of questions to the discussions on the implications of the findings.
Reproducibility is key! Prepare and make available (preferably open-source) a complete technical documentation of all model code, mathematical formulas, assumptions and their justification, allowing others to reproduce the model.
Model calibration, goodness-of-fit and validation are fundamental processes of scientific modelling. All data used should be described in sufficient detail to allow the reader to assess the type and quality of these analyses. When using data by reference, use Principle 2.
Communicating uncertainty is a hallmark of good modelling practice. Perform a sensitivity analysis of all key parameters, and for each paper reporting model predictions include an uncertainty assessment of those model outputs within the paper.
Model outcomes should be articulated in the form of testable hypotheses. This allows comparison with other models and future events as part of the ongoing cycle of model improvement. Incorporating prior work by reference in the paper is sufficient. Write what relevant information is contained in the prior work; then note its reference number in the summary table. Please verify that the whole chain of steps in referenced work is actually complete and up-to-date.
- https://cdn.elifesciences.org/articles/76988/elife-76988-supp8-v1.docx
-
Transparent reporting form
- https://cdn.elifesciences.org/articles/76988/elife-76988-transrepform1-v1.pdf
Download links
A two-part list of links to download the article, or parts of the article, in various formats.
Downloads (link to download the article as PDF)
Open citations (links to open the citations from this article in various online reference manager services)
Cite this article (links to download the citations from this article in formats compatible with various reference manager tools)
Global variation in force-of-infection trends for human Taenia solium taeniasis/cysticercosis
eLife 11:e76988.
https://doi.org/10.7554/eLife.76988


