Blocking Kir6.2 channels with SpTx1 potentiates glucose-stimulated insulin secretion from murine pancreatic β cells and lowers blood glucose in diabetic mice
- Department of Physiology, Perelman School of Medicine University of Pennsylvania, United States
Figures
Figure 1
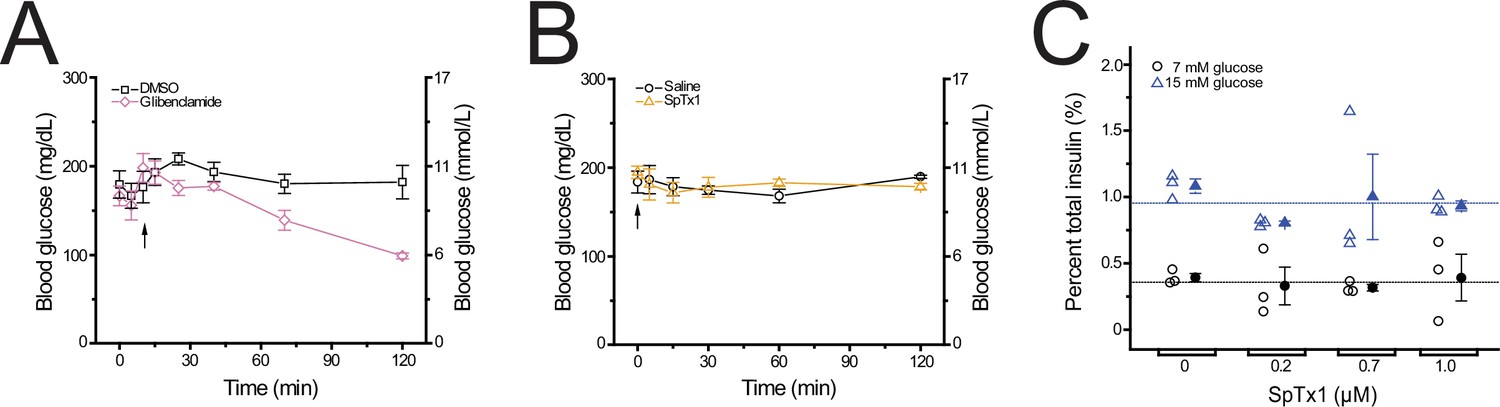
SpTx1 does not affect the blood glucose level or potentiate glucose-stimulated insulin secretion (GSIS) from isolated pancreatic islets of wild-type B6J mice.
(A, B) Blood glucose levels (mean ± standard error of the mean [SEM], n = 5 independent experiments for each dataset) of overnight-fasted mice (8–12 weeks of age) measured at indicated time points during a 2-hr observation period. (A) Glibenclamide (40 mg/kg, purple diamonds) or its vehicle DMSO (black squares) was administered by an intraperitoneal injection (arrow). (B) SpTx1 (1 mg/kg, orange triangles) or its vehicle saline solution (black circles) was administered by an intravenous injection (arrow). (C) Dot plots of GSIS from isolated pancreatic islets of 8- to 12-week-old mice. For each independent experiment under specified conditions, individual groups of five islets were placed in the wells of a microwell plate for insulin release assay. The secreted insulin as a percentage of the total insulin content of the islets from each experiment is plotted against the indicated concentration of SpTx1 in the presence of 7 mM (open black circles) or 15 mM (open blue triangles) glucose, with the mean ± SEM of each group presented to the right of the respective dataset (filled black circles or blue triangles, n = 3 independent sets of experiments). The blue or black horizonal line indicates the average of data for all SpTx1 concentrations in 7 or 15 mM glucose.
-
Figure 1—source data 1
Related to Figure 1A–C.
- https://cdn.elifesciences.org/articles/77026/elife-77026-fig1-data1-v1.xlsx
Figure 2
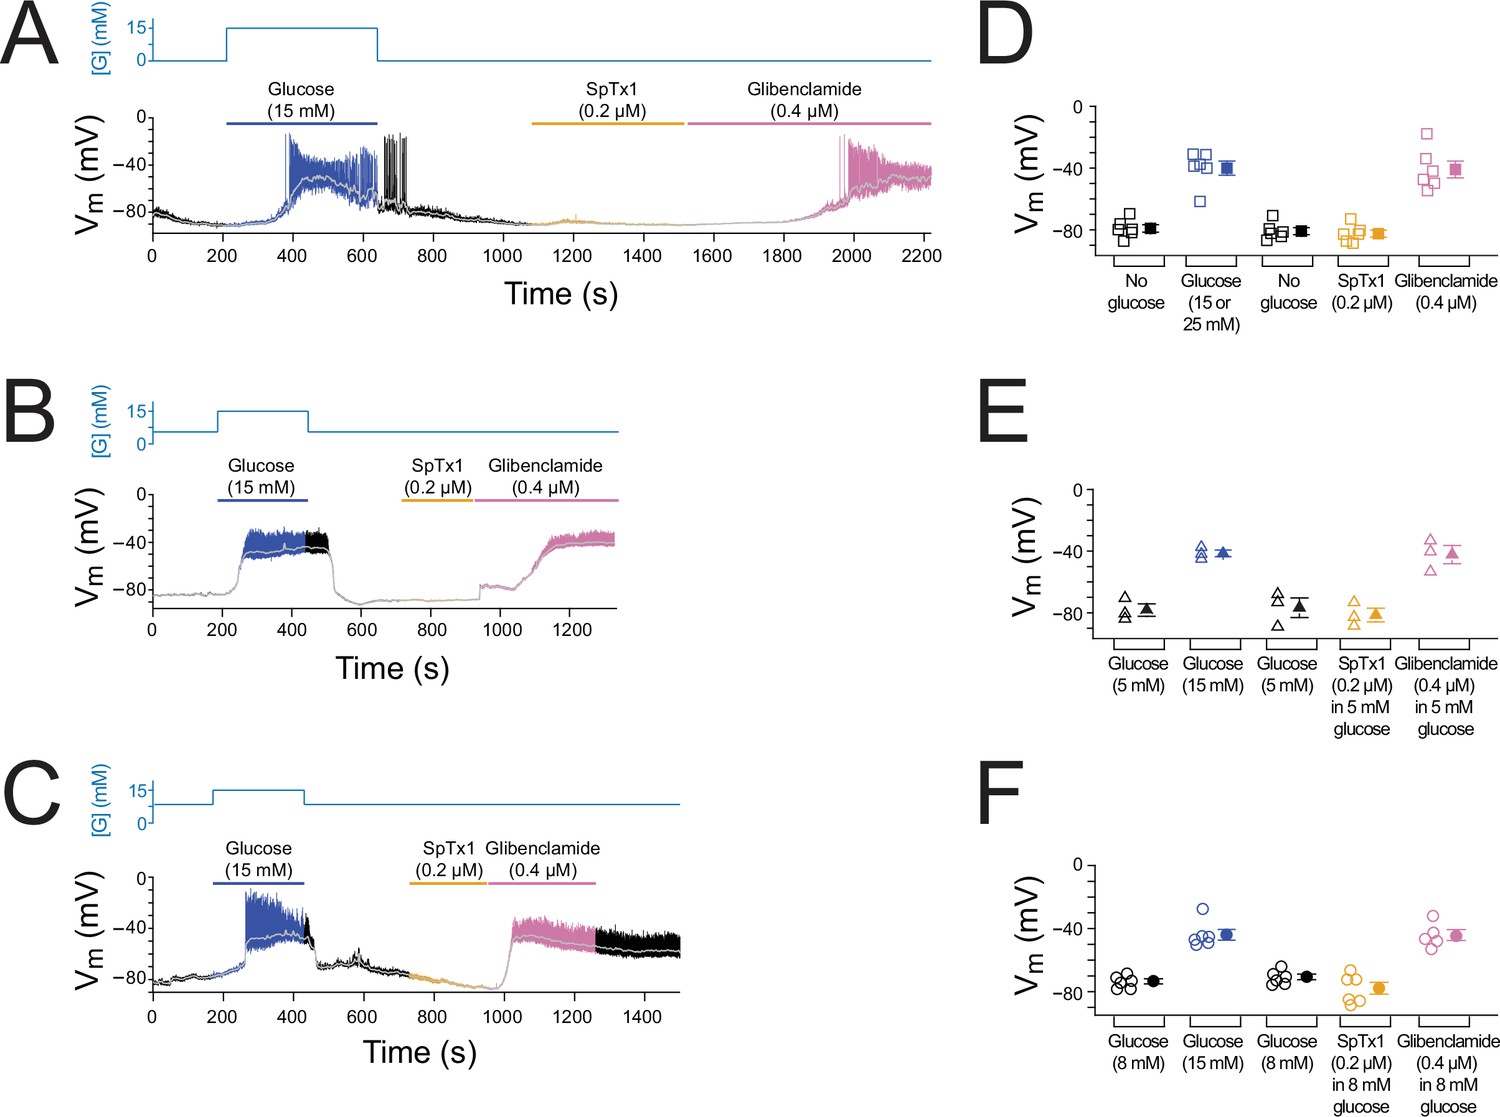
SpTx1 does not depolarize the membrane potential (Vm) of β cells in isolated pancreatic islets from wild-type mice.
(A–C) Vm traces recorded in the perforated whole-cell mode from individual β cells near the surface of isolated but intact islets from B6J wild-type mice (8–12 weeks of age). The switching of the glucose concentration from 0 mM (A), 5 mM (B), or 8 mM (C) to 15 mM and back is indicated by the blue schematic line at the top, and the application of 0.2 µM SpTx1 (orange) or 0.4 µM glibenclamide (purple) or the presence of 15 mM glucose in the bath solution (blue) is as indicated by their color-coded lines above the Vm trace. The light gray curve overlaid on the Vm trace was obtained by (offline) filtering of the recorded trace at 0.1 Hz using a low-pass Gaussian routine. (D–F) Dot plots of filtered Vm values for individual cells from multiple islets under the conditions of the corresponding illustrative traces shown in (A–C), where their mean ± standard error of the mean (SEM) are plotted on the right as filled symbols with errors bars. Squares, n = 6 independent experiments, are as plotted in (D); triangles, n = 3 in (E); circles, n = 5 or 6 in (F). 15 or 25 mM glucose was used and data for these conditons were plotted together in (D).
-
Figure 2—source data 1
Related to Figure 2A–F.
- https://cdn.elifesciences.org/articles/77026/elife-77026-fig2-data1-v1.xlsx
Figure 3 with 1 supplement
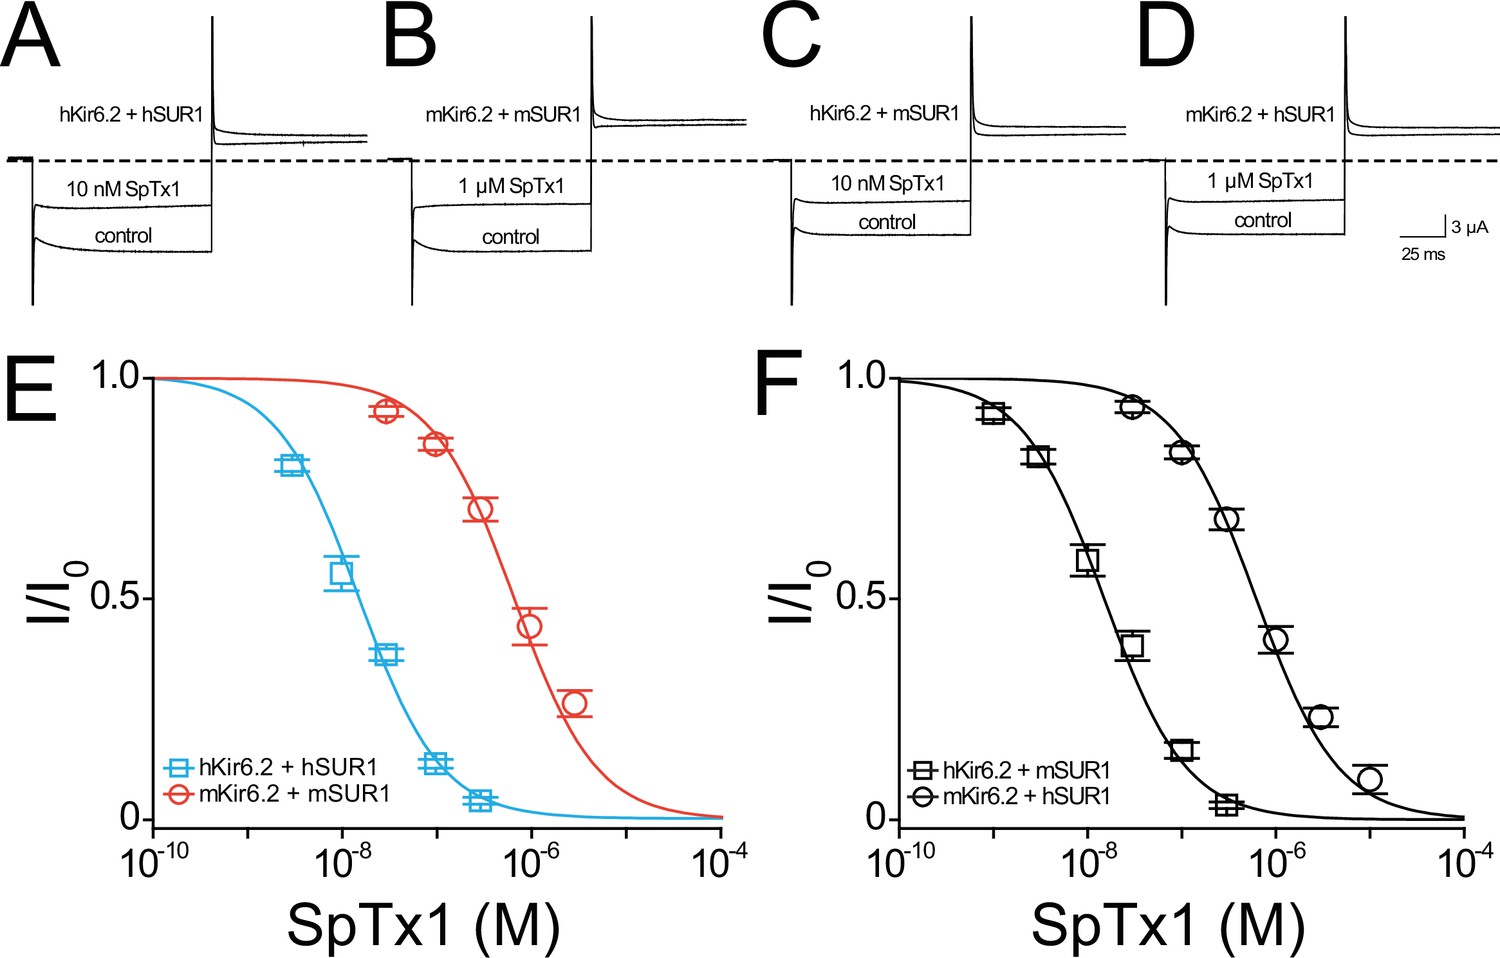
SpTx1 inhibits hKir6.2 and mKir6.2 with markedly different affinities.
Currents through hKir6.2 coexpressed with hSUR1 (hKATP; A), mKir6.2 with mSUR1 (mKATP; B), hKir6.2 with mSUR1 (C), and mKir6.2 with hSUR1 (D) activated by adding 3 mM azide to the 100 mM K+-containing bath solution and recorded in the absence (control) or presence of 10 nM (A, C) or 1 μM (B, D) SpTx1. The currents were elicited by stepping voltages from the holding potential of 0 to −80 mV and then to +80 mV. The dashed line indicates zero-current level. (E, F) Fractions of remaining channel currents (I/Io) plotted against the concentration of SpTx1. The curves superimposed on data correspond to the fits of an equation for a bimolecular reaction. The fitted Kd values are 1.53 (±0.13) × 10−8 M for hKir6.2 coexpressed with hSUR1 (E, cyan squares), 6.27 (±1.02) × 10−7 M for mKir6.2 with mSUR1 (E, vermilion circles), 1.47 (±0.14) × 10−8 M for hKir6.2 with mSUR1 (F, black squares), and 6.44 (±0.69) × 10−7 M for mKir6.2 with hSUR1 (F, black circles), where data are plotted as mean ± standard error of the mean (SEM; n = 5 independent experiments).
-
Figure 3—source data 1
Related to Figure 3A–F.
- https://cdn.elifesciences.org/articles/77026/elife-77026-fig3-data1-v1.xlsx
Figure 3—figure supplement 1
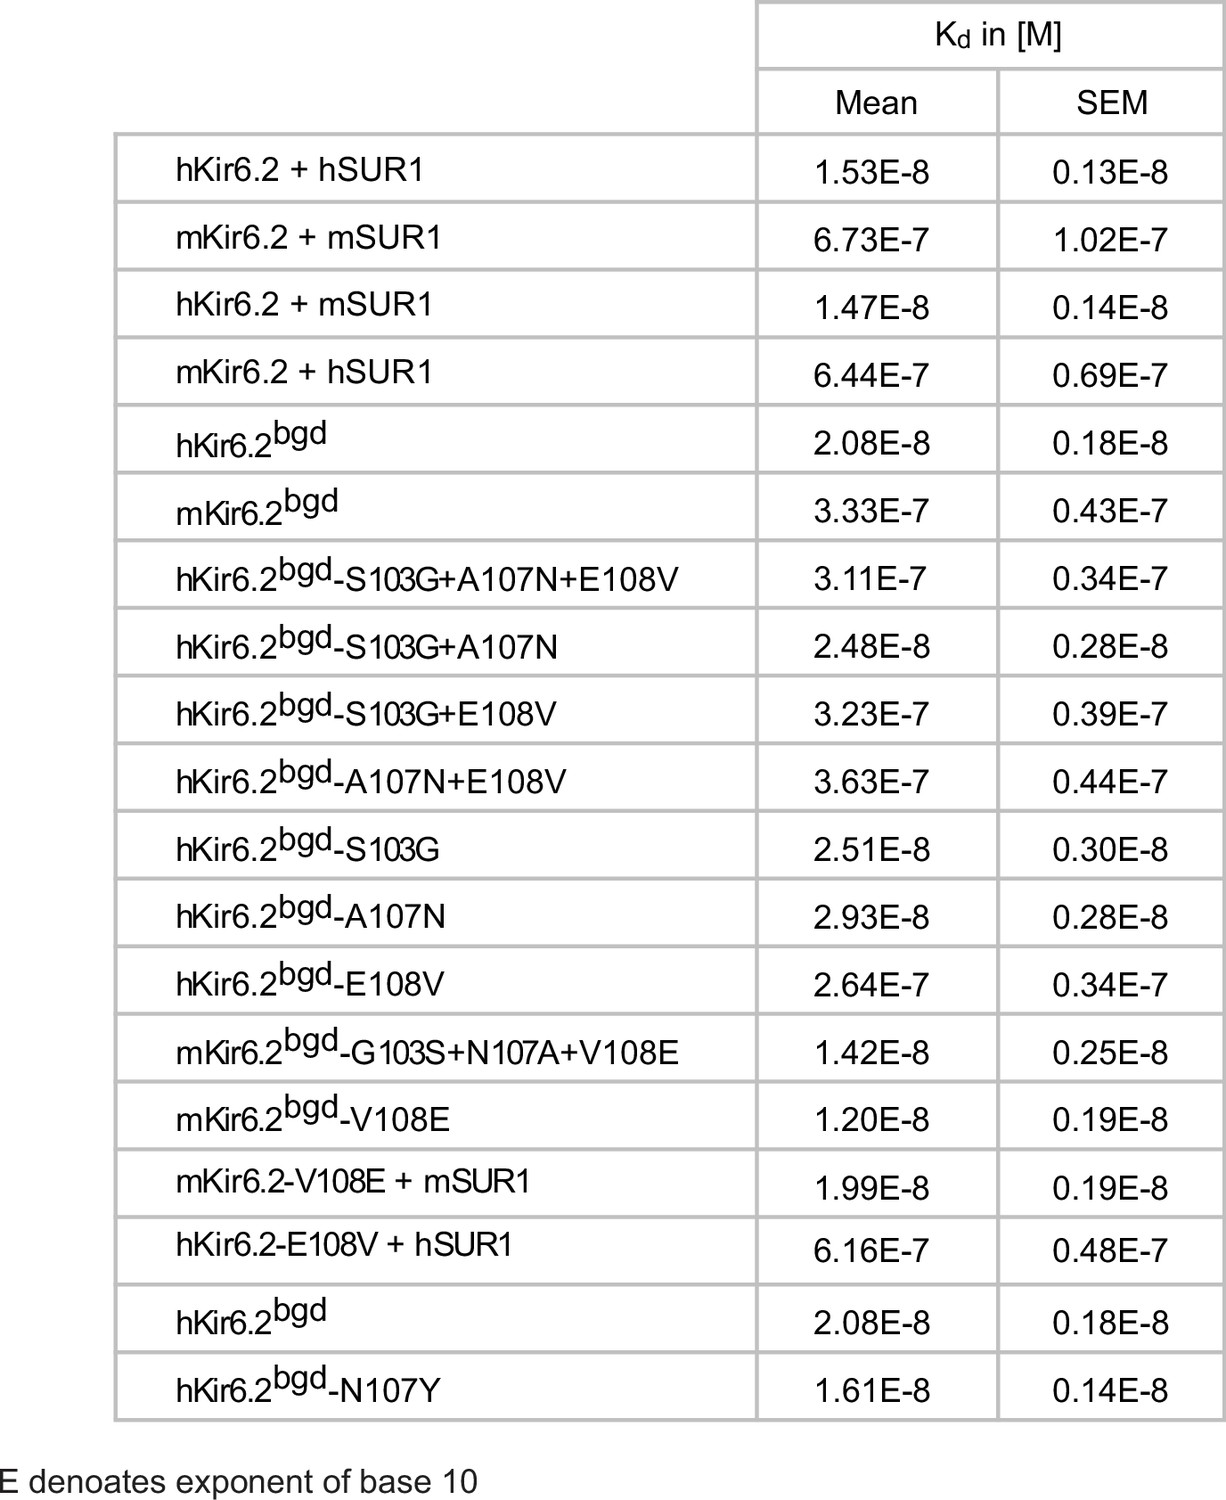
SpTx1 affinities of Kir6.2 and of its variants in the study.
-
Figure 3—figure supplement 1—source data 1
Related to Figure 3—figure supplement 1.
- https://cdn.elifesciences.org/articles/77026/elife-77026-fig3-figsupp1-data1-v1.xlsx
Figure 4
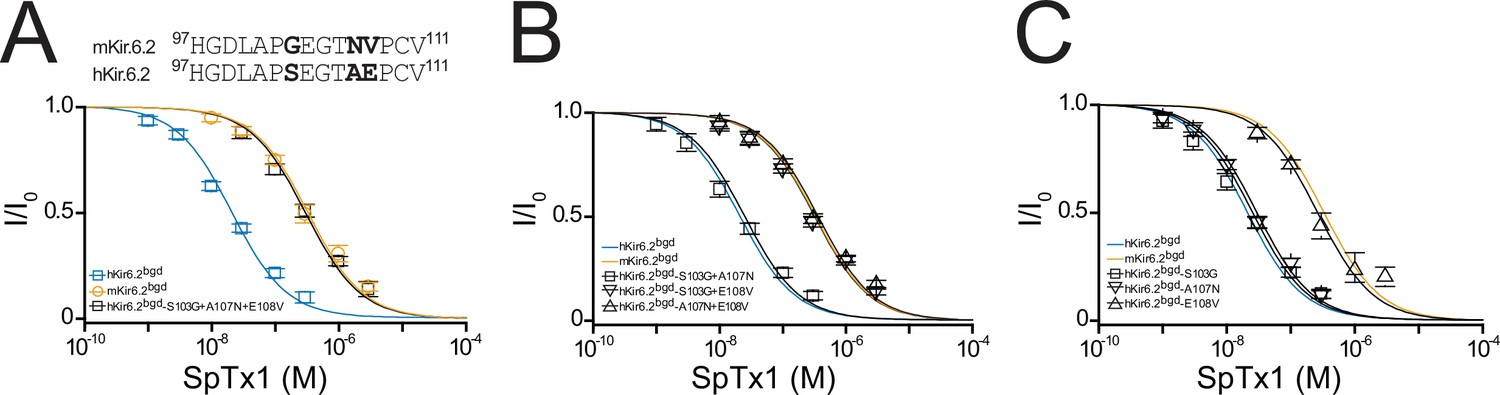
Residue E108 underlies the high affinity of hKir6.2 for SpTx1.
(A) Shown at the top is a comparison of partial amino acid sequences of the extracellular vestibule of the pore between the first and second transmembrane segments in hKir6.2 and mKir6.2. The three residues that differ between the two sequences are bolded. Shown below are fractions of remaining currents of hKir6.2bgd and mKir6.2bgd plotted against the concentration of SpTx1 along with those of hKir6.2bgd containing an additional triple mutation (S103G + A107N + E108V) to mimic mKir6.2bgd. The curves superimposed on data correspond to the fits of an equation for a bimolecular reaction. The fitted Kd values are 2.08 (±0.18) × 10−8 M for hKir6.2bgd (blue squares), 3.33 (±0.43) × 10−7 M for mKir6.2bgd (orange circles), and 3.11 (±0.34) × 10−7 M for hKir6.2bgd with the triple mutation (black squares). Fractions of remaining currents of hKir6.2bgd containing additional individual double (B) or single (C) mutations. The fitted Kd values are 2.48 (±0.28) × 10−8 M for hKir6.2bgd containing the double mutations S103G and A107N (squares), 3.23 (±0.39) × 10−7 M for hKir6.2bgd containing S103G and E108V (inverse triangles), and 3.63 (±0.44) × 10−7 M for hKir6.2bgd containing A107N and E108V (triangles) in (B), or 2.51 (±0.30) × 10−8 M for hKir6.2bgd containing the single mutation S103G (squares), 2.93 (±0.28) × 10−8 M for hKir6.2bgd containing A107N (inverse triangles), and 2.64 (±0.34) × 10−7 M for hKir6.2bgd containing E108V (triangles) in (C). For ease of comparison, the fitted curves (blue and orange) for hKir6.2bgd and mKir6.2bgd from (A) are also replotted in (B, C). All data are plotted as mean ± standard error of the mean (SEM; n = 5 independent experiments).
-
Figure 4—source data 1
Related to Figure 4A–C.
- https://cdn.elifesciences.org/articles/77026/elife-77026-fig4-data1-v1.xlsx
Figure 5
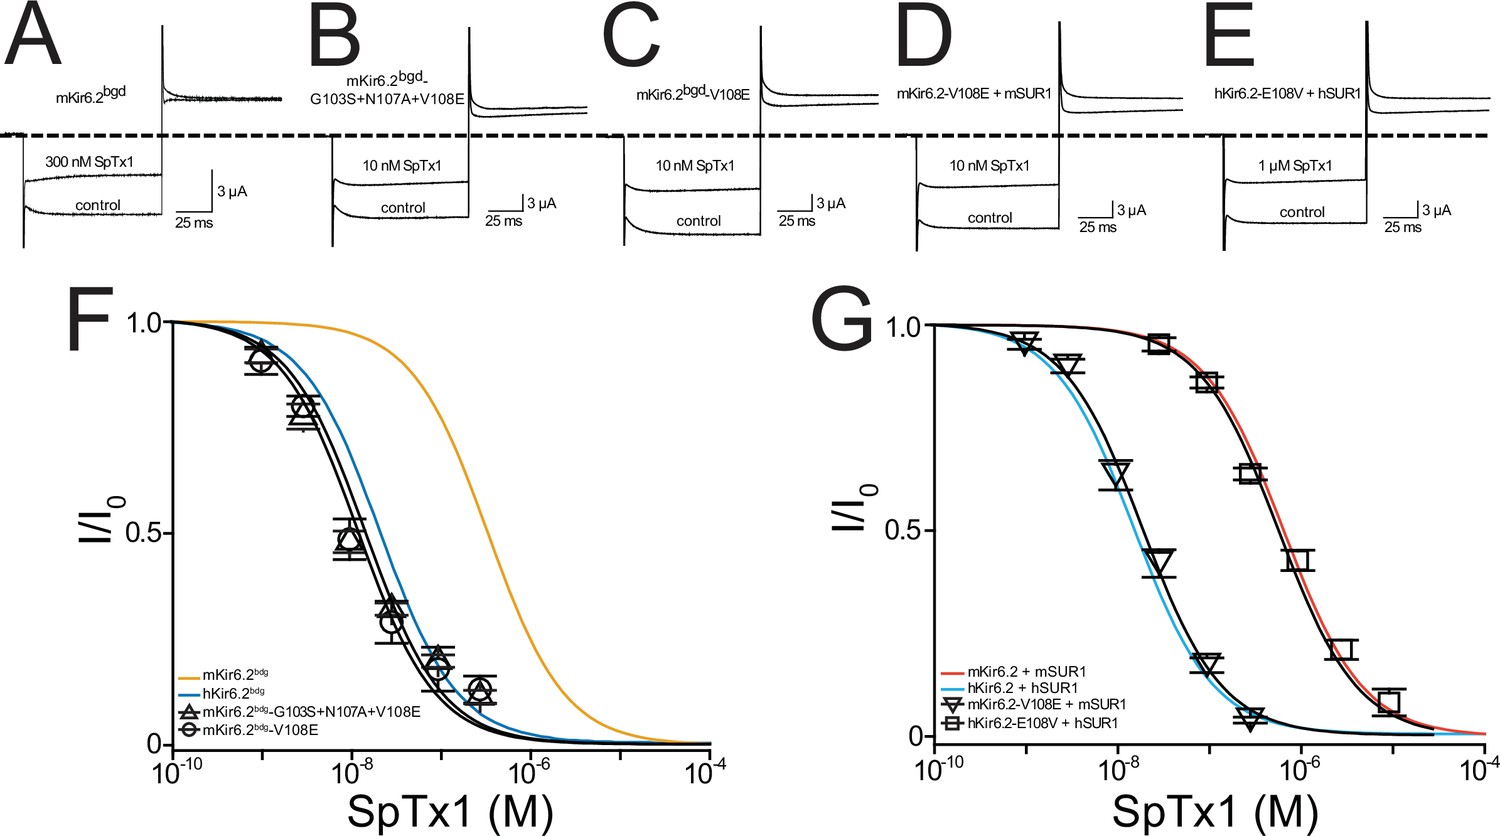
A single-point mutation confers high SpTx1 affinity on mKir6.2bgd and switches the affinities of hKATP and mKATP channels for SpTx1.
Currents of mKir6.2bgd (A), mKir6.2bgd containing the triple mutations G103S, N107A, and V108E (B), mKir6.2bgd containing the single mutation V108E (C), azide-activated mKir6.2-V108E coexpressed with mSUR1 (D), or azide-activated hKir6.2-E108V with hSUR1 (E). The currents were elicited by stepping voltages from the holding potential of 0 to −80 mV and then to +80 mV in the presence of 100 mM K+ in the bath solution, and recorded in the absence (control) or presence of SpTx1 as indicated. The dashed line indicates zero-current level. (F, G) Fractions of remaining channel currents plotted against the concentration of SpTx1. The curves superimposed on data correspond to the fits of an equation for a bimolecular reaction. The fitted Kd values are 1.42 (±0.25) × 10−8 M for mKir6.2bgd containing the triple mutations (triangles) and 1.20 (±0.19) × 10−8 M for mKir6.2bgd containing V108E (circles) in (F), or 1.99 (±0.19) × 10−8 M for mKir6.2-V108E coexpressed with mSUR1 (inverse triangles) and 6.16 (±0.48) × 10−7 M for hKir6.2-E108V with hSUR1 (squares) in (G), where data are plotted as mean ± standard error of the mean (SEM; n = 5 independent experiments). For ease of comparison, the fitted curves (blue and orange) for hKir6.2bgd and mKir6.2bgd in (F) are replotted from Figure 4A, and those curves (cyan and vermilion) for hKir6.2 with hSUR1 and mKir6.2 with mSUR1 in (G) are replotted from Figure 3E.
-
Figure 5—source data 1
Related to Figure 5A–G.
- https://cdn.elifesciences.org/articles/77026/elife-77026-fig5-data1-v1.xlsx
Figure 6 with 1 supplement
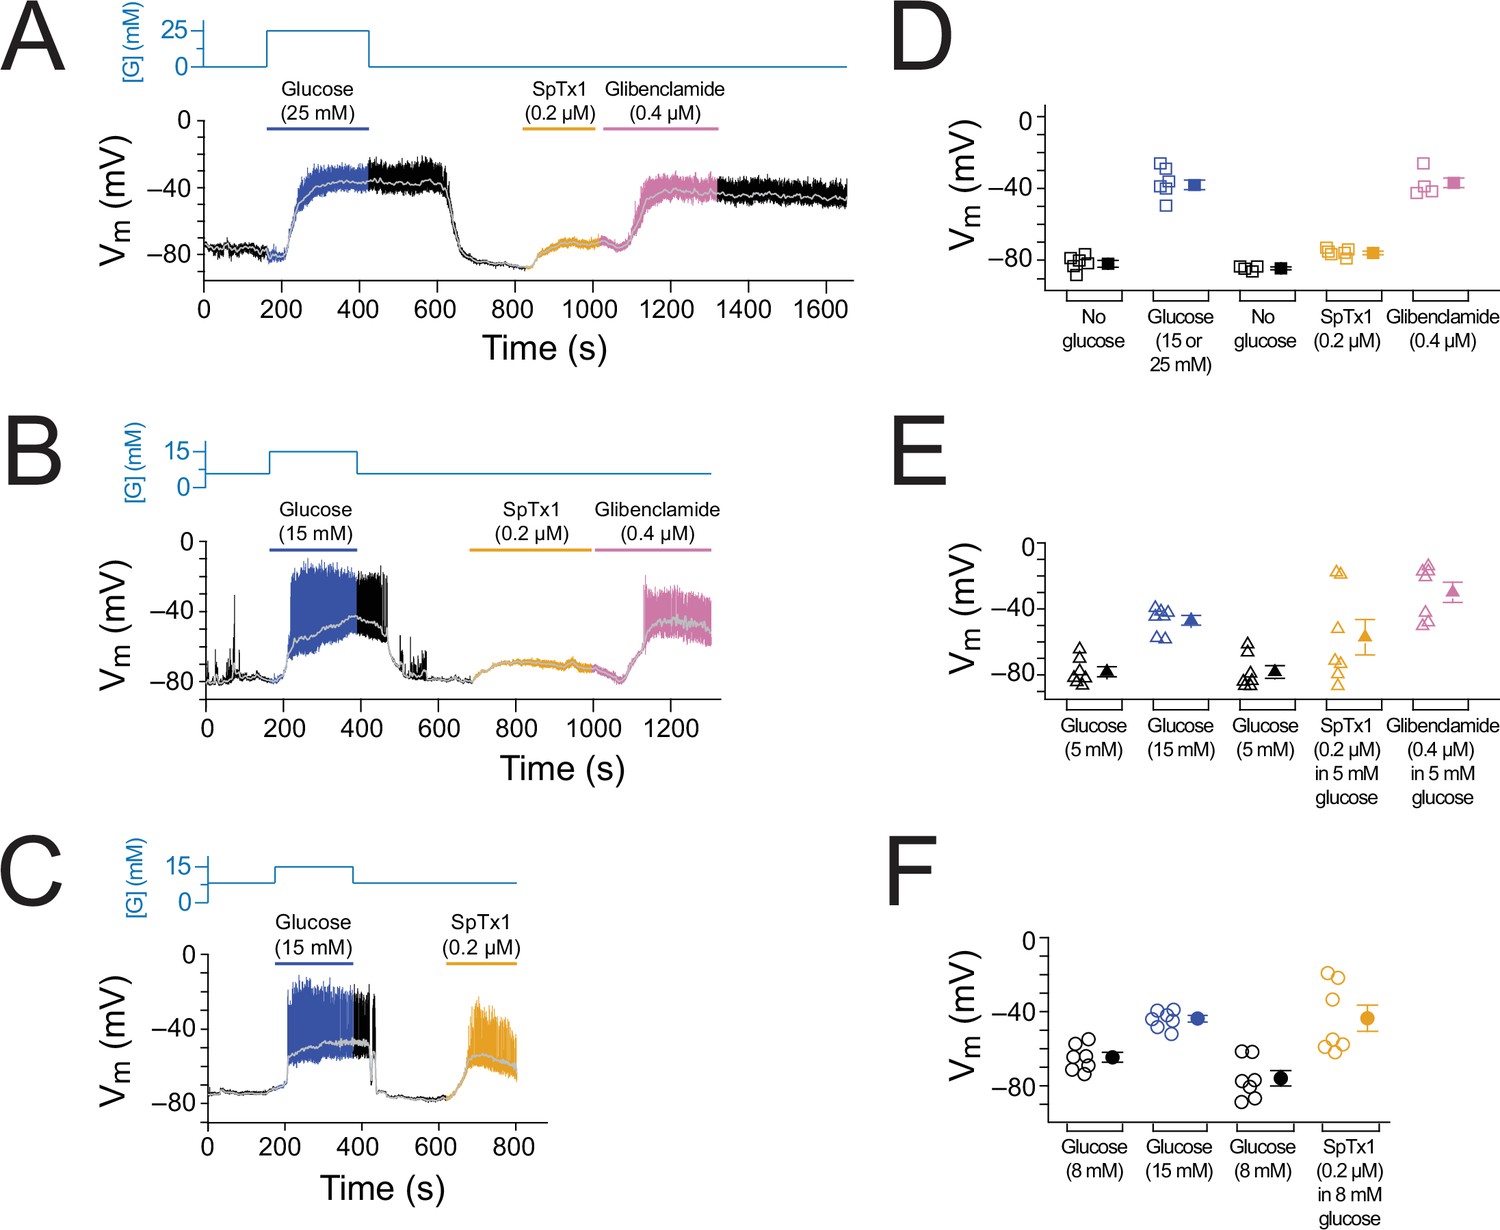
SpTx1 depolarizes the membrane potential (Vm) of β cells in isolated pancreatic islets from EndomKir6.2V108E mice.
(A–C) Vm traces recorded in the perforated whole-cell mode from individual β cells near the surface of isolated intact islets from EndomKir6.2V108E mice (8–12 weeks of age). The switching of the glucose concentration from 0 mM (A), 5 mM (B), or 8 mM (C) to 15 or 25 mM and back is indicated by the blue schematic line at the top, and the application of 0.2 µM SpTx1 (orange) or 0.4 µM glibenclamide (purple) or the presence of 15 or 25 mM glucose in the bath solution is as indicated by their color-coded lines above the Vm trace. The light gray curve overlaid on the Vm trace was obtained by filtering the recorded trace at 0.1 Hz using a low-pass Gaussian routine. (D–F) Dot plots of filtered Vm values for individual cells from multiple islets under the conditions of the corresponding illustrative traces shown in (A–C), where their mean ± standard error of the mean (SEM) are plotted on the right as filled symbols with errors bars. Squares, n = 4 or 6 independent experiments, are as plotted in (D); triangles, n = 7 in (E); circles, n = 7 in (F). Under the 5 mM glucose condition, SpTx1 had variable effect on Vm of β cells in multiple islets (E), but the toxin did not elicit any action potentials regardless of the magnitude of apparent depolarization.
-
Figure 6—source data 1
Related to Figure 6A–F.
- https://cdn.elifesciences.org/articles/77026/elife-77026-fig6-data1-v1.xlsx
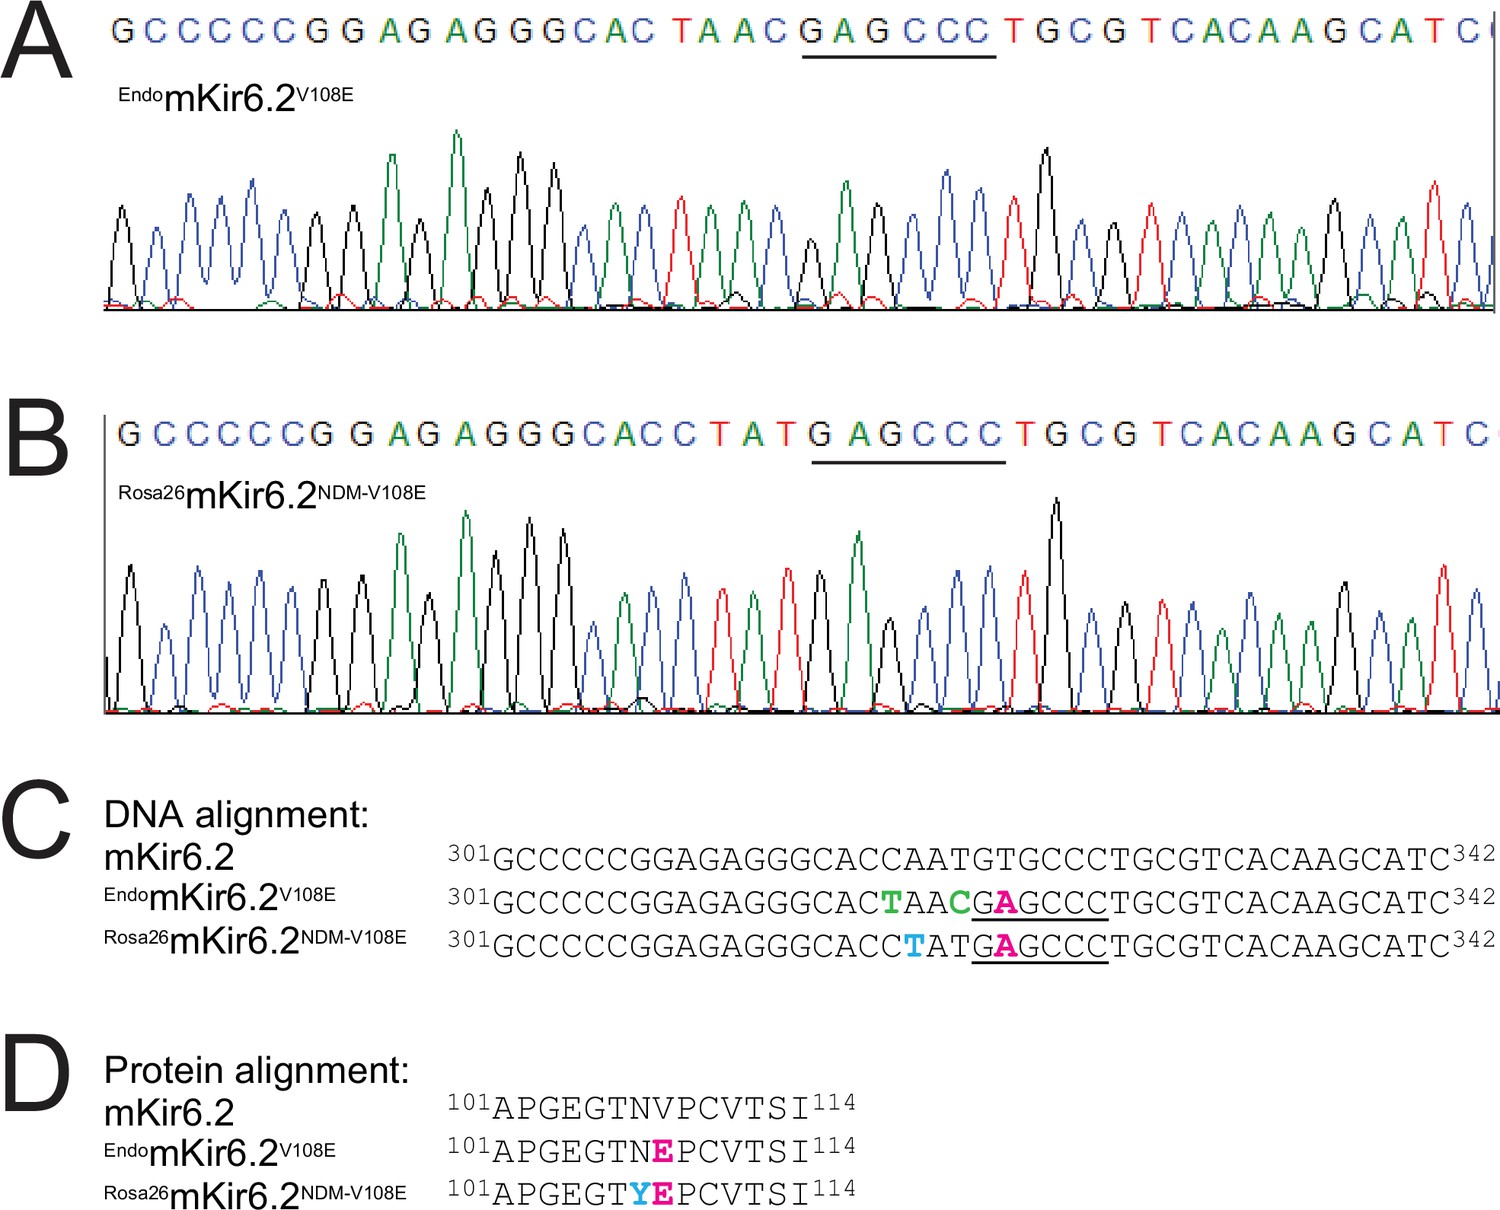
Figure 6—figure supplement 1
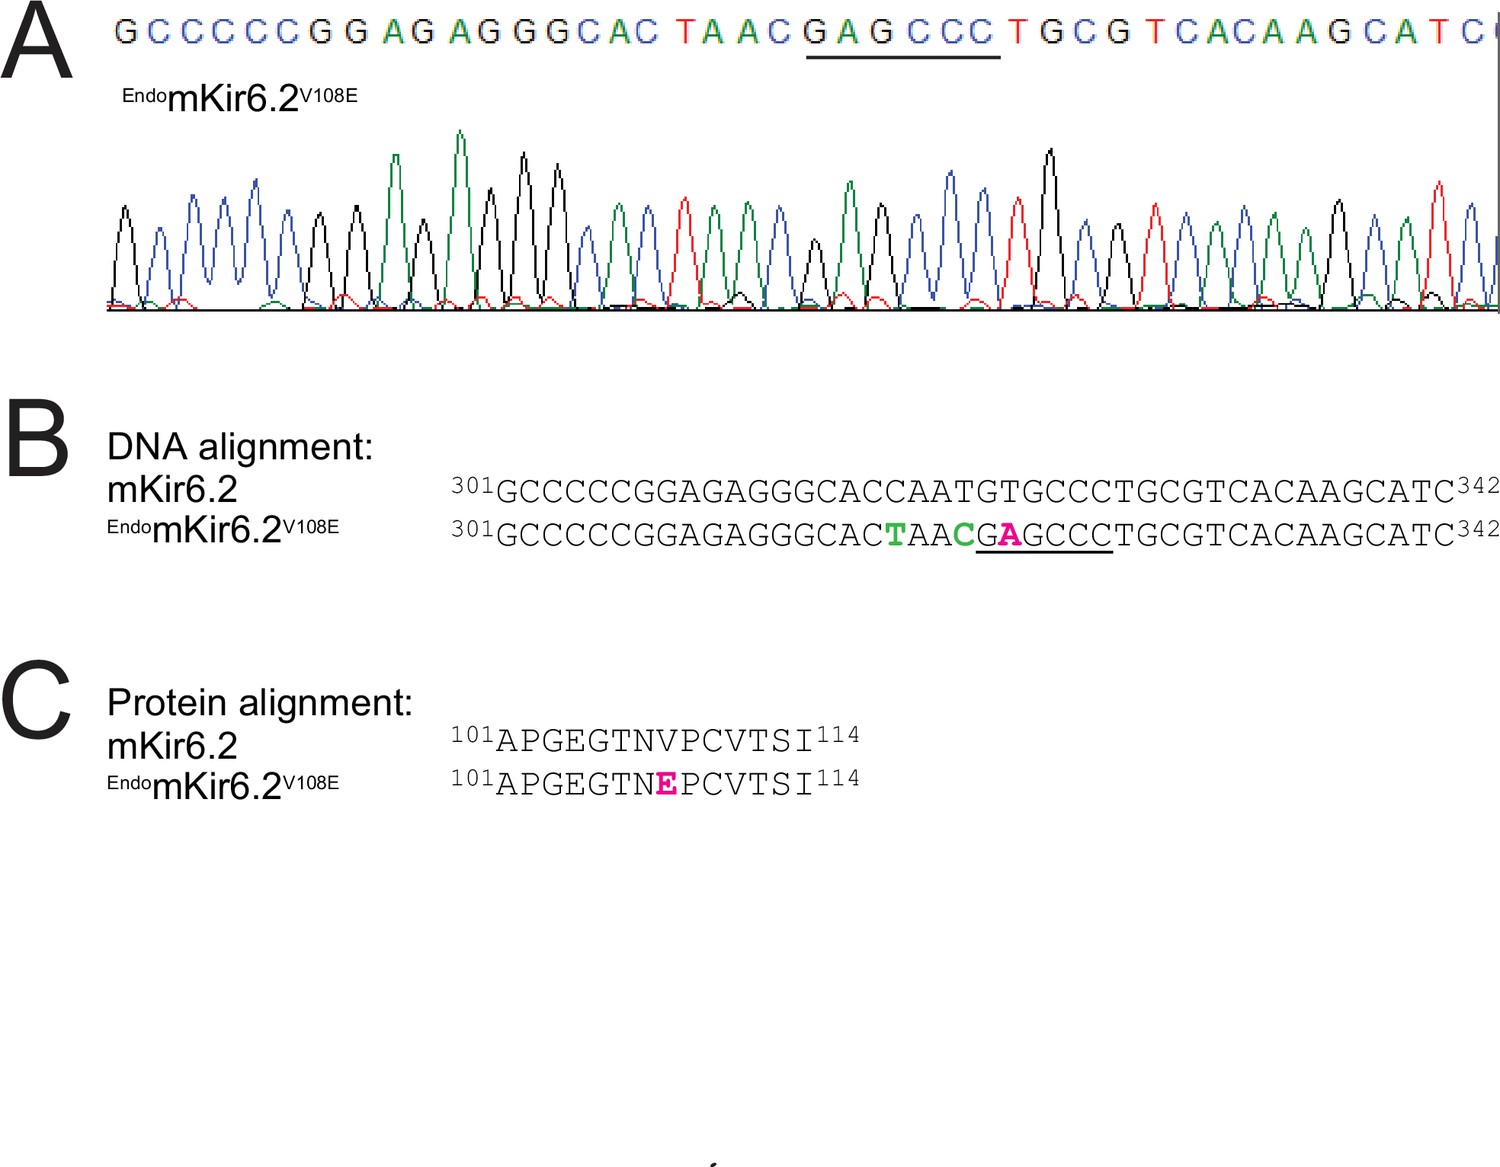
DNA sequencing result and analysis of EndomKir6.2V108E mice.
(A) Chromatogram showing the sequence of a 42-nucleotide segment within the PCR-amplified products of the mKir6.2 gene in the endogenous locus; the engineered-in restriction enzyme (BanII) cleave site is indicated by the black line (see also Methods). (B) Partial DNA sequence of the wild-type Kir6.2 gene aligned with that, shown in (A), from the mutant Kir6.2 gene in the endogenous locus. Intended nonsynonymous or synonymous mutations are colored magenta or lime; the BanII cleave site is underlined. The Kir6.2 gene at the endogenous locus contained three intended mutations that include: a nonsynonymous substitution of T323A (magenta) in the targeted DNA site that causes the valine-to-glutamate mutation at position 108 in the protein to confer higher SpTx1 sensitivity on the mouse Kir6.2 channel; and two synonymous substitutions of C318T and T321C (lime) in the targeted DNA site to prevent re-editing by Cas9 while preserving the original amino acids threonine 106 and asparagine 107 in the translated Kir6.2 protein. (C) Alignment of wild-type and mutant amino acid sequences, which correspond to the DNA sequences (B) of the Kir6.2 gene in endogenous locus that contains the intended V108E mutation colored magenta.
-
Figure 6—figure supplement 1—source data 1
DNA sequencing chromatogram containing the proximal region of the endogenous Kir6.2 gene in EndomKir6.2V108E mice related to Figure 6—figure supplement 1A.
- https://cdn.elifesciences.org/articles/77026/elife-77026-fig6-figsupp1-data1-v1.zip
-
Figure 6—figure supplement 1—source data 2
DNA sequencing chromatogram containing the distal region of the endogenous Kir6.2 gene in EndomKir6.2V108E mice related to Figure 6—figure supplement 1A.
- https://cdn.elifesciences.org/articles/77026/elife-77026-fig6-figsupp1-data2-v1.zip
Figure 7
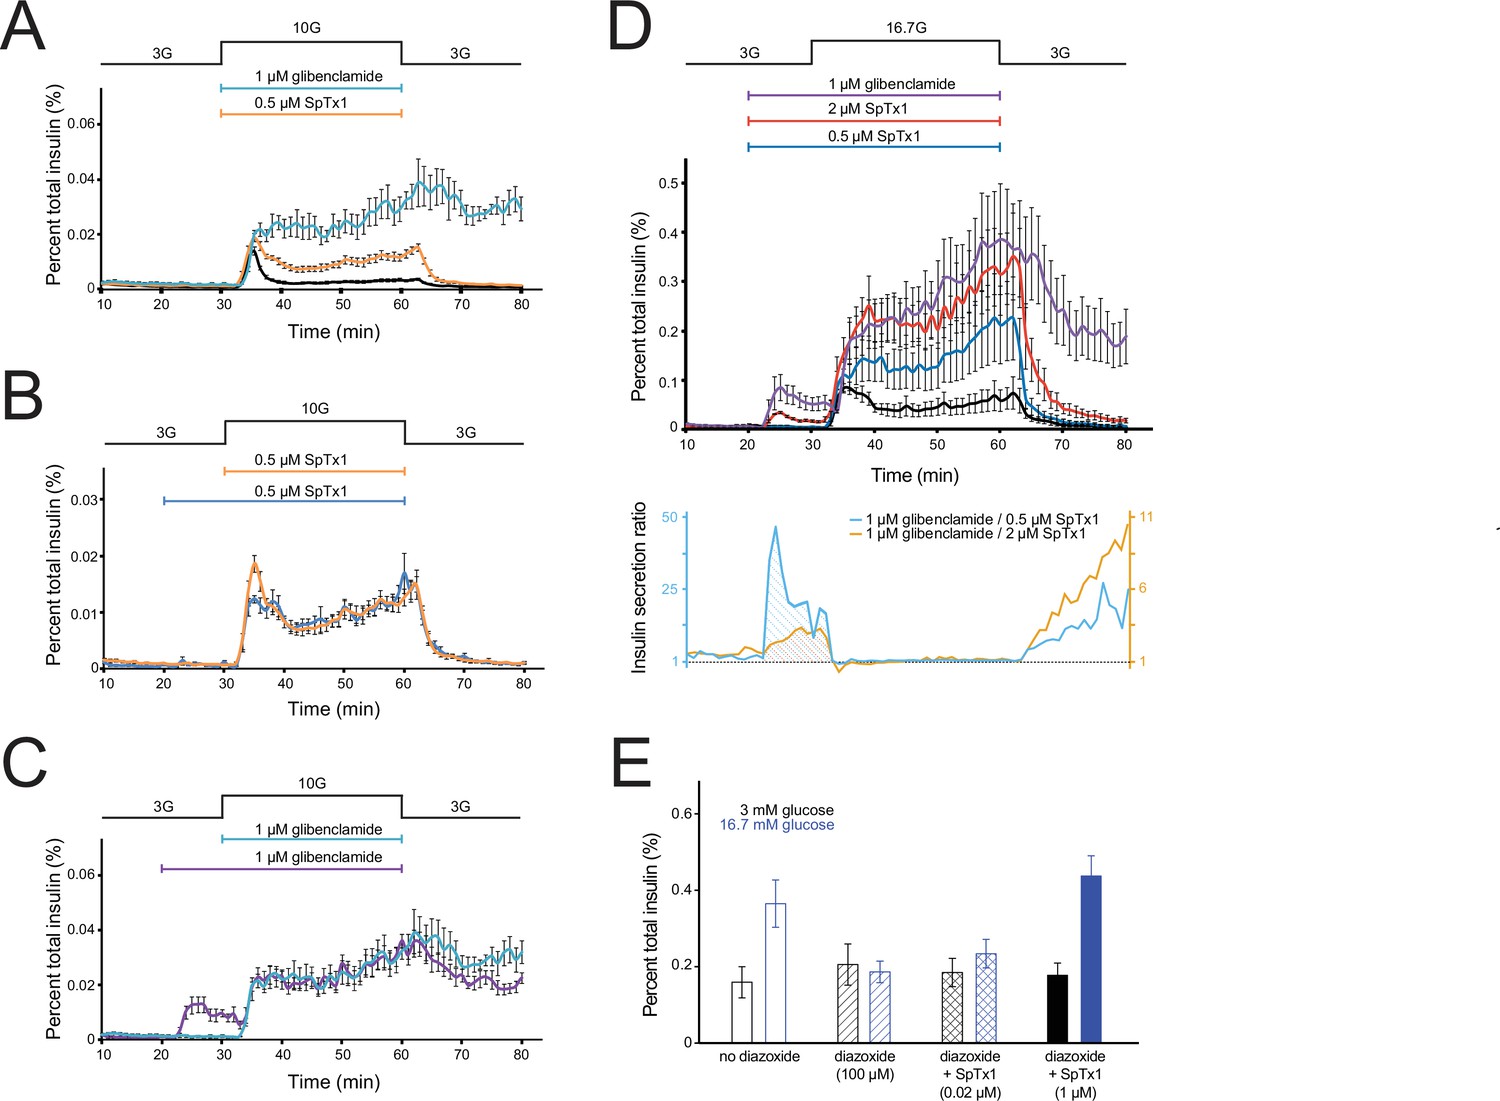
SpTx1 potentiates glucose-stimulated insulin secretion (GSIS) from isolated pancreatic islets of EndomKir6.2V108E mice and counteracts the effect of diazoxide on GSIS.
(A–D) The amount of insulin per ml perifusion solution released from ~180 isolated islets of EndomKir6.2V108E mice (8–12 weeks of age) as a percentage of the total insulin content is plotted against time. The rate of perifusion was 1 ml/min. All data points are plotted as mean ± SEM connected by lines color coded for specified conditions. The elevation of the glucose concentration in the perifusion solution from 3 to 10 mM (A–C) or 16.7 mM (D) and the return to 3 mM are as indicated by the black schematic outline at the top. In (A), the cyan, orange, or black data plot represents the insulin secretion profile with the inclusion of 1 μM glibenclamide (n = 4 independent experiments), 0.5 μM SpTx1 (n = 6), or neither (n = 6). In (B), the blue or orange data plot represents the insulin secretion profile with the inclusion of 0.5 μM of SpTx1 either 10 min prior to (n = 4) or at the time of raising the glucose concentration. In (C), the purple or cyan data plot represents the insulin secretion profile with the inclusion of 1 μM of glibenclamide either 10 min prior to (n = 4) or at the time of raising the glucose concentration. For ease of comparison, the orange data curve in (B) and cyan data curve in (C) are replotted from (A). In (D), the purple, vermilion, blue, and black data plots represent the insulin secretion profile with the inclusion of 1 μM glibenclamide (n = 3), 2 μM SpTx1 (n = 3), 0.5 μM SpTx1 (n = 3), or neither inhibitor (n = 3). The orange or cyan curve shown below the insulin secretion profiles represents the ratio between the amounts of insulin secreted in the presence of 1 μM glibenclamide and that in the presence of 0.5 μM SpTx1 (cyan) or 2 μM SpTx1 (orange). (E) Histograms of GSIS from isolated pancreatic islets of 8- to 12-week-old EndomKir6.2V108E mice. For each independent experiment under a specified condition, individual groups of 5 or 10 islets were placed in the wells of a microwell plate for insulin release assay. The secreted insulin as a percentage of the total insulin content of the islets (mean ± standard error of the mean [SEM]; n = 6 for each case) is presented as histograms where black or blue color codes for the presence of 3 or 16.7 mM glucose in the bathing medium. The fill pattern inside each pair of rectangles represents a tested condition: glucose only (open), glucose + 100 μM diazoxide (diagonal lines), glucose + 100 μM diazoxide + 0.02 μM SpTx1 (crossed lines), and glucose + 100 μM diazoxide + 1 μM SpTx1 (filled). For the two key group comparisons, the p value of two-tailed Student’s t-test is 0.034 between the glucose only group and the glucose + 100 μM diazoxide group and is 0.003 between the glucose + 100 μM diazoxide group and the glucose + 100 μM diazoxide + 1 μM SpTx1 group, all in the presence of 16.7 mM glucose.
-
Figure 7—source data 1
Related to Figure 7A–E.
- https://cdn.elifesciences.org/articles/77026/elife-77026-fig7-data1-v1.xlsx
Figure 8 with 2 supplements

SpTx1 triggers a transient rise of plasma insulin and lowers the elevated blood glucose level in diabetic Rosa26mKir6.2NDM-V108E mice.
Blood glucose (A, B) and corresponding plasma insulin (C, D) levels (mean ± standard error of the mean [SEM]) of overnight-fasted mice (8–12 weeks of age) at indicated time points during a 2-hr observation period. (A, C) SpTx1 (1 mg/kg, filled orange triangles) or its vehicle saline (open orange triangles) was intravenously administered in Rosa26mKir6.2NDM mice (n = 5 independent experiments for each case) and glibenclamide (40 mg/kg, filled cyan circles) or its vehicle DMSO (open cyan circles) was intraperitoneally administered in Rosa26mKir6.2NDM-V108E mice (n = 5 each) as indicated by the arrow. (B, D) SpTx1 (1 mg/kg, filled symbols) or its vehicle saline (open symbols) was intravenously administered in wild-type (black squares, n = 5 each), EndomKir6.2V108E (green diamonds, n = 5 each), and Rosa26mKir6.2NDM-V108E (magenta circles, n = 10 each) mice as indicated by the arrow. For the comparison of the plasma insulin levels of Rosa26mKir6.2NDM-V108E mice at 5-min post administration, the p value of two-tailed Student’s t-test is 0.011 between the vehicle group and the SpTx1 group.
-
Figure 8—source data 1
Related to Figure 8A–D.
- https://cdn.elifesciences.org/articles/77026/elife-77026-fig8-data1-v1.xlsx
Figure 8—figure supplement 1
DNA sequencing results and analysis of Rosa26mKir6.2NDM-V108E mice.
(A) Chromatogram showing the sequences of a 42-nucleotide segment within the PCR-amplified products of the mKir6.2 gene in the endogenous (A) or Rosa26 (B) locus; the engineered-in restriction enzyme (BanII) cleave site in each is indicated by the black line (see also Methods). (C) Partial DNA sequence of the wild-type Kir6.2 gene aligned with those, shown in (A, B), from the mutant Kir6.2 gene in the endogenous or the Rosa26 locus. Intended nonsynonymous or synonymous mutations are colored magenta or lime whereas an unintended nonsynonymous mutation is colored blue; the BanII cleave site is underlined. The Kir6.2 gene at the endogenous locus contained three intended mutations that include: a nonsynonymous substitution of T323A (magenta) in the targeted DNA site that causes the valine-to-glutamate mutation at position 108 in the protein to confer higher SpTx1 sensitivity on the mouse Kir6.2 channel; and two synonymous substitutions of C318T and T321C (lime) in the targeted DNA site to prevent re-editing by Cas9 while preserving the original amino acids threonine 106 and asparagine 107 in the translated Kir6.2 protein. However, the NDM-causing mutant Kir6.2 transgene at the Rosa26 locus contained the same intended nonsynonymous substitution of T323A (magenta) besides an unintended nonsynonymous substitution of A319T (blue) in the DNA that leads to an additional mutation of N107Y in the translated Kir6.2 protein. (D) Alignment of amino acid sequences, which correspond to the DNA sequences (C) of the Kir6.2 gene in endogenous locus that contains the intended V108E mutation colored magenta or that in Rosa26 locus that contains the intended V108E mutation colored magenta and unintended N107Y mutation colored blue. This unintended mutation is not expected to meaningfully affect the channel’s affinity for SpTx1 based on the results shown in Figure 8—figure supplement 2.
-
Figure 8—figure supplement 1—source data 1
DNA sequencing chromatogram containing the proximal region of the endogenous Kir6.2 gene in Rosa26mKir6.2NDM-V108E mice related to Figure 8—figure supplement 1A.
- https://cdn.elifesciences.org/articles/77026/elife-77026-fig8-figsupp1-data1-v1.zip
-
Figure 8—figure supplement 1—source data 2
DNA sequencing chromatogram containing the distal region of the endogenous Kir6.2 gene in Rosa26mKir6.2NDM-V108E mice related to Figure 8—figure supplement 1A.
- https://cdn.elifesciences.org/articles/77026/elife-77026-fig8-figsupp1-data2-v1.zip
-
Figure 8—figure supplement 1—source data 3
DNA sequencing chromatogram containing the proximal region of the NDM-causing mutant Kir6.2 transgene in Rosa26mKir6.2NDM-V108E mice related to Figure 8—figure supplement 1B.
- https://cdn.elifesciences.org/articles/77026/elife-77026-fig8-figsupp1-data3-v1.zip
-
Figure 8—figure supplement 1—source data 4
DNA sequencing chromatogram containing the mid region of the NDM-causing mutant Kir6.2 transgene in Rosa26mKir6.2NDM-V108E mice related to Figure 8—figure supplement 1B.
- https://cdn.elifesciences.org/articles/77026/elife-77026-fig8-figsupp1-data4-v1.zip
-
Figure 8—figure supplement 1—source data 5
DNA sequencing chromatogram containing the distal region of the NDM-causing mutant Kir6.2 transgene in Rosa26mKir6.2NDM-V108E mice related to Figure 8—figure supplement 1B.
- https://cdn.elifesciences.org/articles/77026/elife-77026-fig8-figsupp1-data5-v1.zip
Figure 8—figure supplement 2
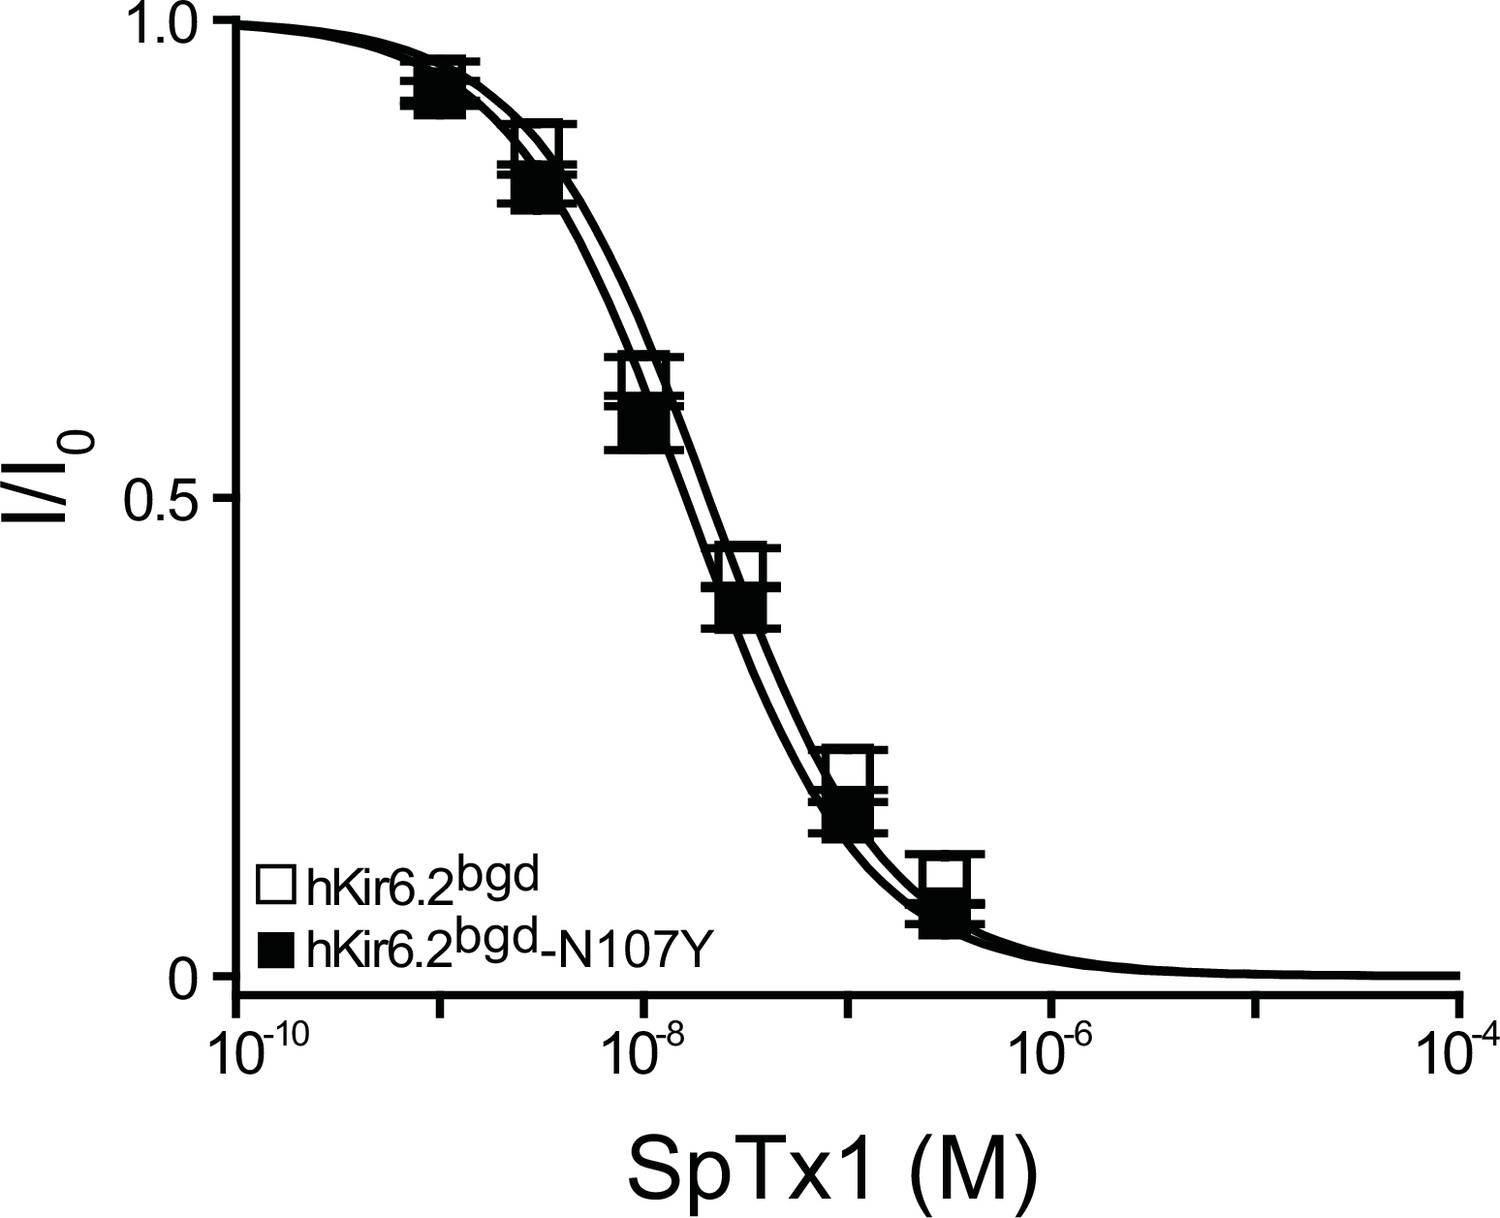
The N107Y mutation does not reduce the SpTx1 sensitivity of hKir6.2bgd.
Fractions of remaining channel currents (I/Io) of hKir6.2bgd (open squares) or hKir6.2bgd-N107Y (filled squares) plotted against the concentration of SpTx1. The curves superimposed onto the data correspond to the fits of an equation for a bimolecular reaction. The fitted Kd values are 2.08 (±0.18) × 10−8 M for hKir6.2bgd, and 1.61 (±0.14) × 10−8 M for hKir6.2bgd-N107Y, where data are plotted as mean ± standard error of the mean (SEM; n = 3 independent experiments).
-
Figure 8—figure supplement 2—source data 1
The N107Y mutation does not alter SpTx1 sensitivity of hKir6.2 related to Figure 8—figure supplement 2.
- https://cdn.elifesciences.org/articles/77026/elife-77026-fig8-figsupp2-data1-v1.xlsx
Additional files
Download links
A two-part list of links to download the article, or parts of the article, in various formats.
Downloads (link to download the article as PDF)
Open citations (links to open the citations from this article in various online reference manager services)
Cite this article (links to download the citations from this article in formats compatible with various reference manager tools)
Blocking Kir6.2 channels with SpTx1 potentiates glucose-stimulated insulin secretion from murine pancreatic β cells and lowers blood glucose in diabetic mice
eLife 11:e77026.
https://doi.org/10.7554/eLife.77026


