The CIC-ERF co-deletion underlies fusion-independent activation of ETS family member, ETV1, to drive prostate cancer progression
- Department of Medicine, University of California, United States
- Helen Diller Family Comprehensive Cancer Center, University of California, United States
- Department of Radiation Oncology, University of California, United States
Figures
Figure 1 with 1 supplement

Capicua (CIC) and ETS2 repressor factor (ERF) are co-deleted in aggressive prostate cancer (PCa) and associate with worse clinical outcomes.
(A) CIC transcriptionally represses ETV1/4/5. (B) The 19q13.2 genomic locus demonstrating the physical location of ERF and CIC. (C) 15 PCa studies (cBioPortal) demonstrating the co-occurrence of ERF and CIC homozygous and heterozygous deletions. The co-occurrence of ERF and CIC alterations is highly significant (p<0.001 co-occurrence, Fisher exact test). (D) ERF-CIC co-deleted PCa stratified by Gleason score and tumor stage. (E) Frequency of ERF and CIC alterations in primary PCa (top) and metastatic castrate resistant prostate cancer (mCRPC; bottom), demonstrating enrichment in mCRPC. (F) Onco-print of known genetic drivers (ERG, ETV1, ETV4, SPOP, and FOXA1) of PCa aligned with CIC and ERF (cBioPortal). CIC-ERF co-deleted prostate tumors (red box) do not frequently co-occur with other known oncogenic events. (G) Survival analysis performed using 15 PCa datasets from cBioPortal. Disease-free survival (DFS) and progression-free survival (PFS) in patients harboring the ERF-CIC co-deletion (red) vs. no ERF-CIC co-deletion (blue). p=value, log-rank.
-
Figure 1—source data 1
Prostate cancer studies identified in cBioPortal demonstrating the total number of patients, number of patients with shallow or deep deletions in Capicua (CIC)-ETS2 repressor factor (ERF), and the frequency of CIC-ERF alterations in each cohort.
Studies that analyzed predominantly primary prostate cancers (green) and metastatic castrate resistant prostate cancer (mCRPC; yellow) are highlighted.
- https://cdn.elifesciences.org/articles/77072/elife-77072-fig1-data1-v1.xlsx
Figure 1—figure supplement 1
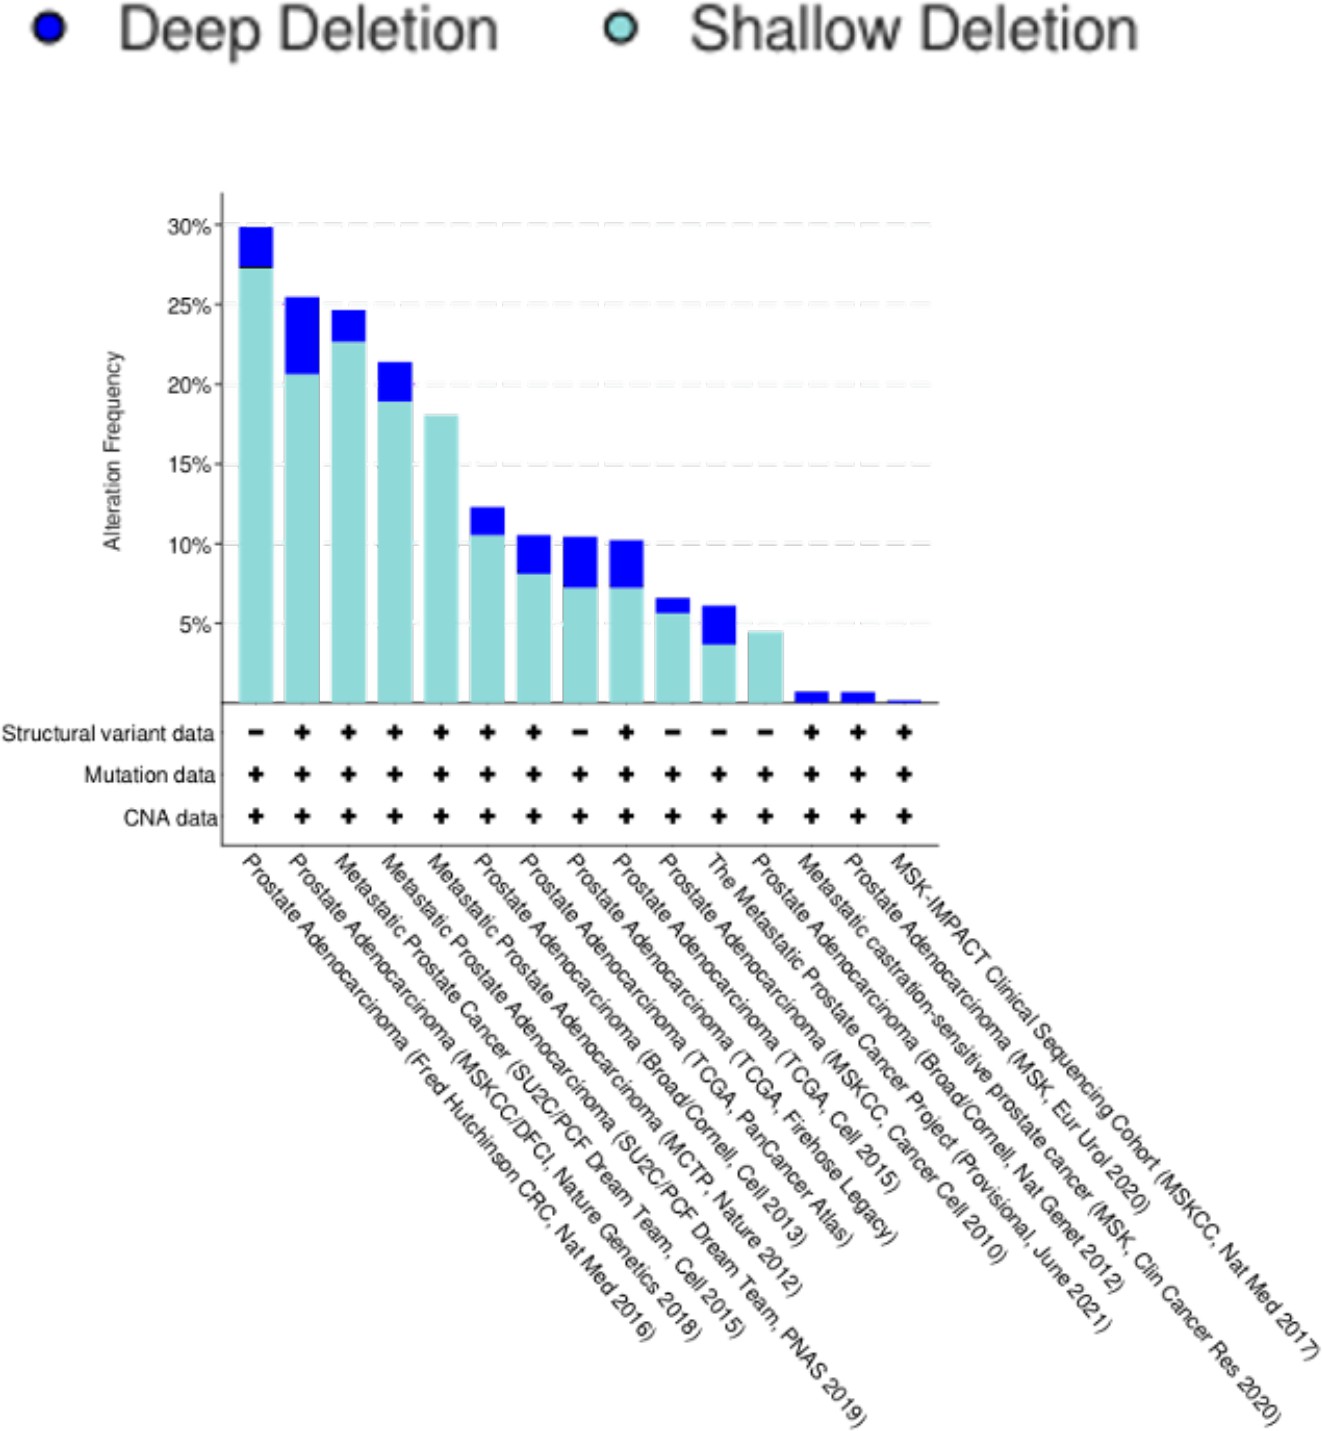
ETS2 repressor factor (ERF)-Capicua (CIC) co-deletion frequency across 15 prostate cancer studies.
Figure 2 with 1 supplement
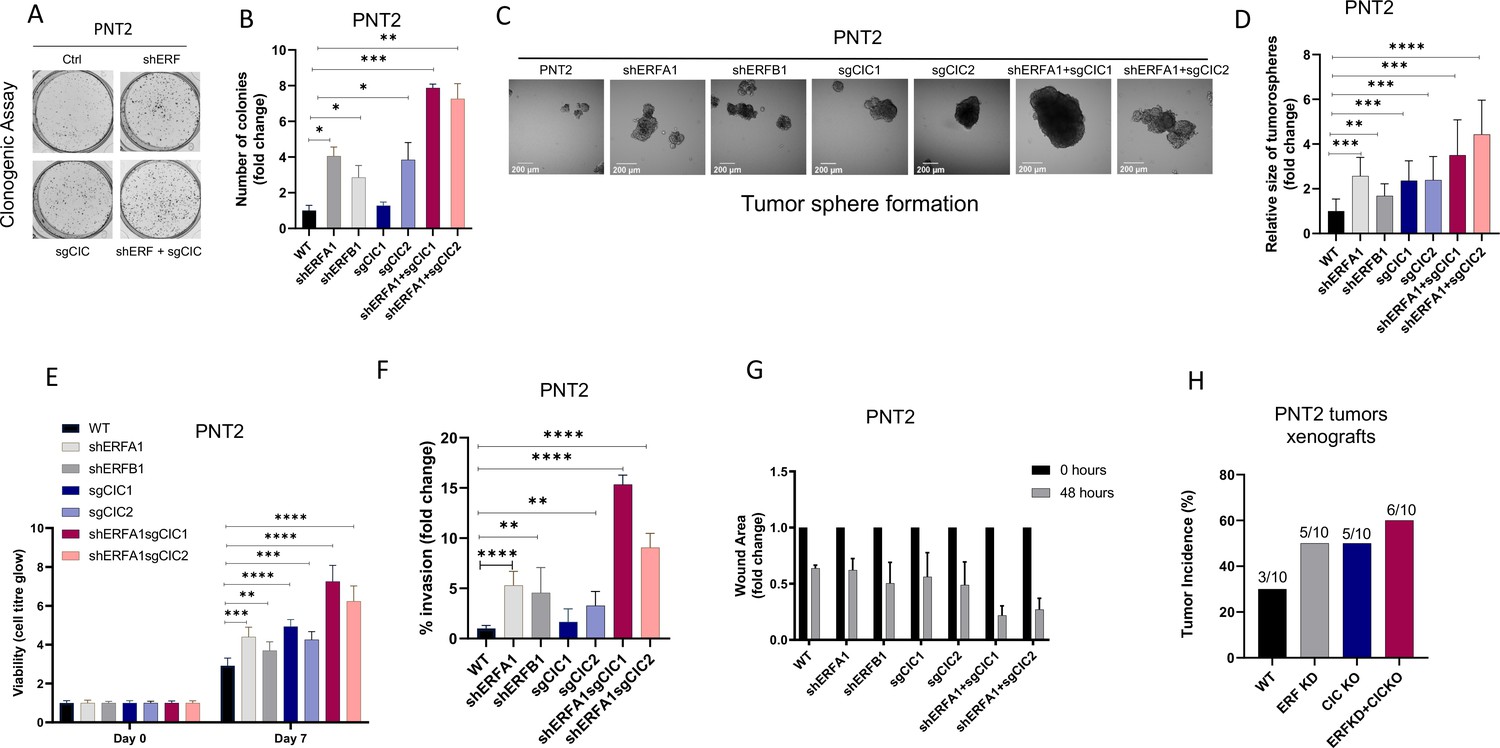
Capicua (CIC) and ETS2 repressor factor (ERF) loss promote tumor formation and control malignant potential in prostate epithelial cells.
(A) Clonogenic assay comparing prostate epithelial cells (PNT2) with ERF KD, CIC KO, or ERF KD+CIC KO compared to control. (B) Number of colonies for each condition in (A) (n=3). (C) Spheroid growth assay using PNT2 cells expressing ERF KD, CIC KO, ERF KD+CIC KO vs. control. (D) Size of the sphere for each condition in (C) (n=6). Error bars represent SD. p Values were calculated using Student’s t test. *p<0.05, **p<0.01, ***p<0.001, and ****p<0.0001. (E) Cell-titer glo viability assay (n=6), (F) transwell assay (n=3), and (G) wound healing assay comparing PNT2 ERF KD, CIC KO, and ERF KD+CIC KO to control (n=4). Error bars represent SD. p Values were calculated using Student’s t test. (H) Bar graph comparing the incidence of PNT2 parental (N=3/10), PNT2 ERF KD (5/10), PNT2 CIC KO (N=5/10), or PNT2 ERF KD+CIC KO (N=6/10) tumor formation in immunodeficient mice. **p<0.01, ***p<0.001, and ****p<0.0001.
Figure 2—figure supplement 1
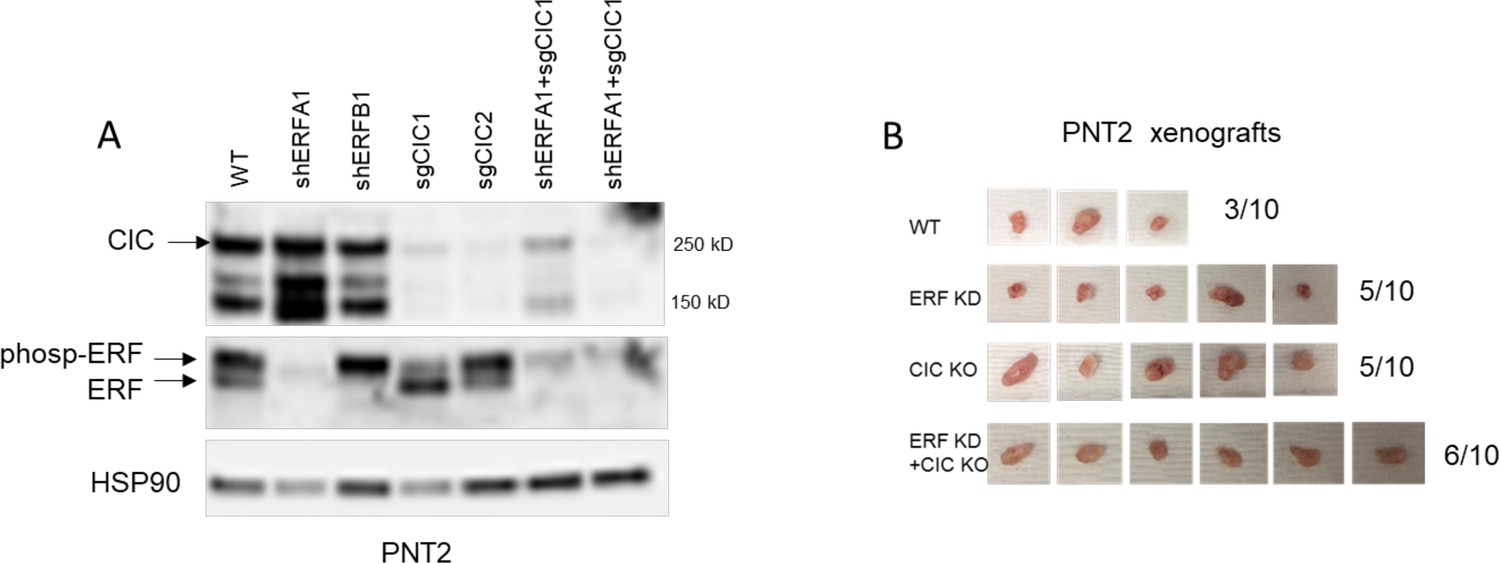
Capicua (CIC) and ETS2 repressor factor (ERF) loss enhances tumor formation in prostate epithelial cells (PNT2).
(A) Immunoblot of CIC, ERF, and HSP90 in PNT2 and its different variants. Representative figure; performed in duplicate. Arrows indicate CIC and ERF bands. (B) Tumor explants from mice in Figure 2E.
-
Figure 2—figure supplement 1—source data 1
Full length western blot images of Capicua (CIC), ETS2 repressor factor (ERF) and HSP90 in prostate epithelial cells (PNT2) and its variants with associated raw images.
- https://cdn.elifesciences.org/articles/77072/elife-77072-fig2-figsupp1-data1-v1.zip
Figure 3 with 1 supplement
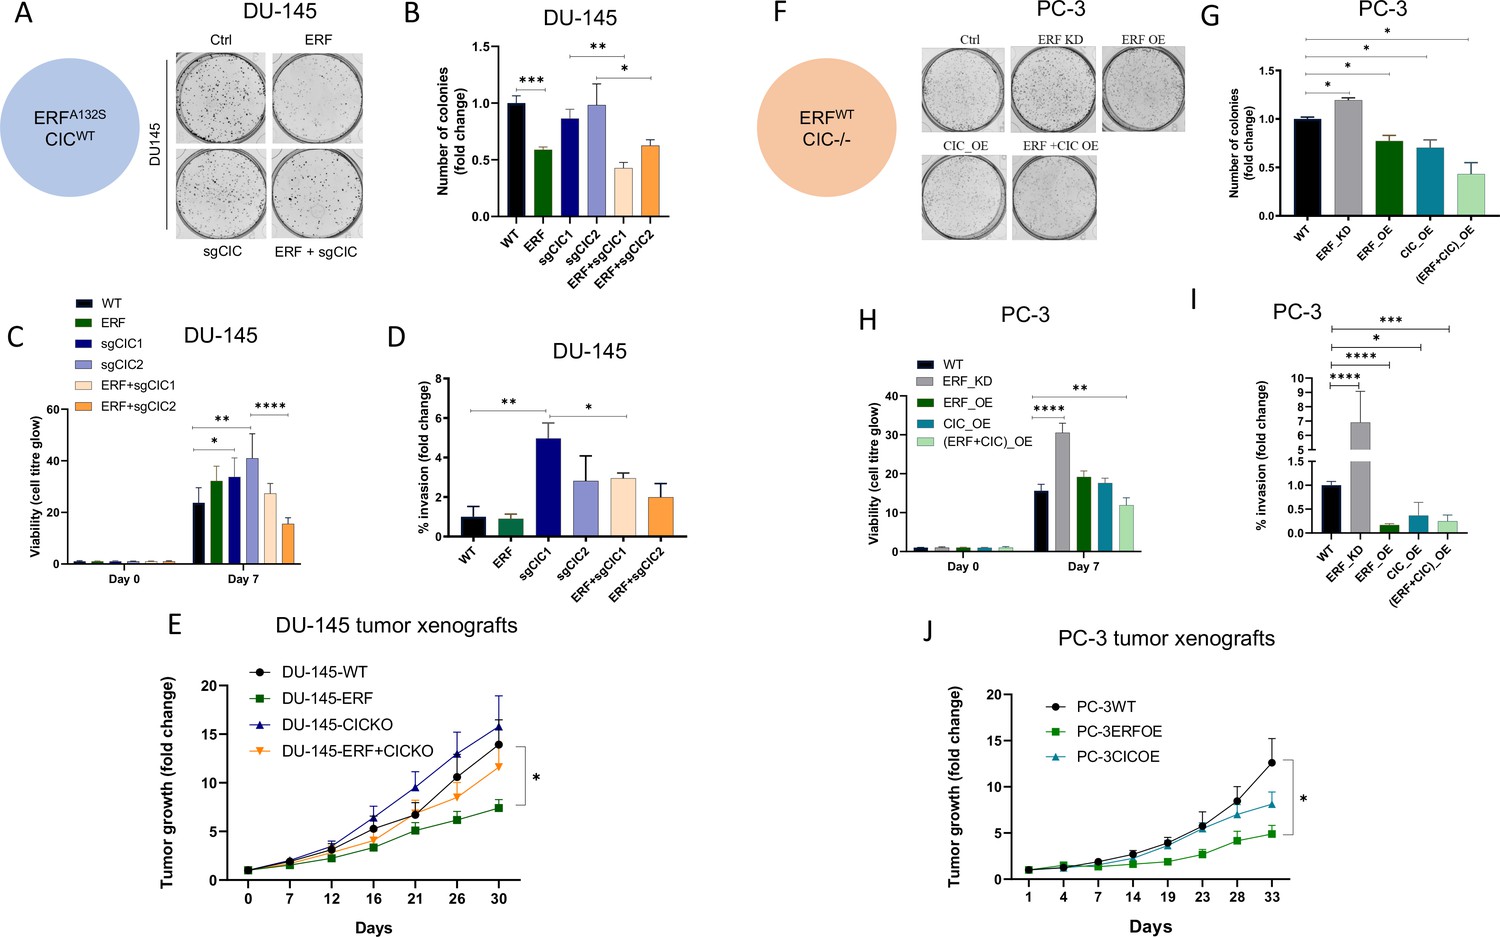
Capicua (CIC) and ETS2 repressor factor (ERF) mutually suppress malignant phenotypes in human prostate cancer (PCa).
(A) Clonogenic assay of DU-145 cells with ERF rescue, CIC knockout (KO), or ERF rescue +CIC KO compared to parental control. (B) Number of colonies for each condition in (A) (n=3). (C) Cell-titer glo viability assay (n=6) and (D) transwell assay comparing DU-145 parental cells to DU-145 with ERF rescue, CIC KO, or ERF rescue +CIC KO (n=3). p Values were calculated using Student’s t test. *p<0.05, **p<0.01, ***p<0.001, and ****p<0.0001. Error bars represent SD. (E) Relative tumor volume in mice bearing DU-145 parental, DU-145 ERF, DU-145 with CIC KO, or DU-145 ERF +CIC KO xenografts (N=10). p Values were calculated using Student’s t test. *p<0.05. Error bars represent SEM. (F) Clonogenic assay in PC-3 cells expressing ERF knockdown (KD), ERF overexpression (OE), CIC OE, or ERF +CIC OE compared to control. (G) Number of colonies for each condition in (F) (n=3). (H) Cell-titer glo viability assay (n=6) and (I) transwell assay comparing different groups in PC-3 cells (WT, ERF KD, ERF OE, CIC OE, or ERF +CIC OE) (n=3). p Values were calculated using Student’s t test. *p<0.05, **p<0.01, ***p<0.001, and ****p<0.0001. Error bars represent SD. (J) Relative tumor volume in mice bearing PC-3 parental cells, PC-3 ERF OE, or PC-3 CIC OE (N=10) over 33 days. p Values were calculated using Student’s t test. *p<0.05. Error bars indicate SEM.
Figure 3—figure supplement 1
DU-145 and PC-3 prostate cancer cells are well defined model systems to study Capicua (CIC) and ETS2 repressor factor (ERF) function.
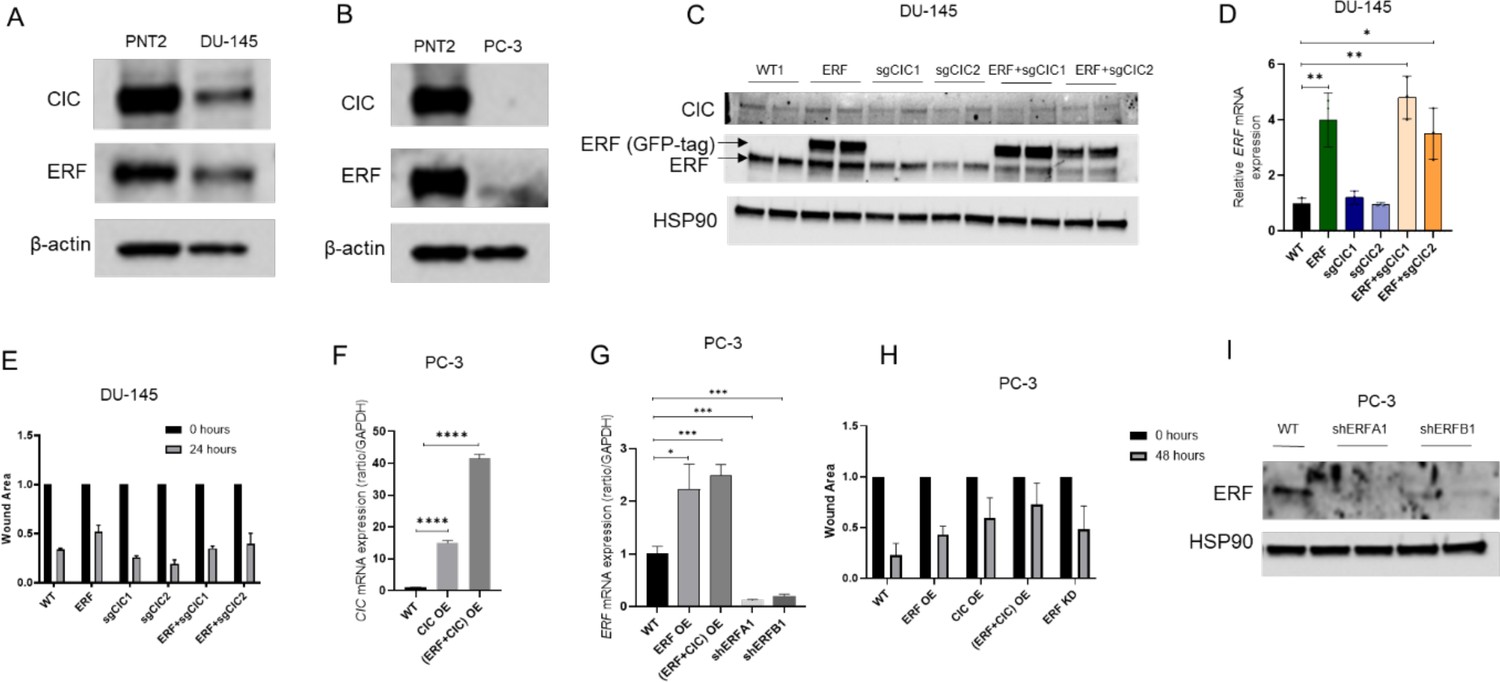
(A) Immunoblot of CIC, ERF, and beta-actin in DU-145 cells compared to prostate epithelial cells (PNT2). (B) Immunoblot of CIC, ERF, and beta-actin in PC-3 cells compared to PNT2 cells. (C) Immunoblot of CIC, ERF, and HSP90 in parental DU-145 cells and engineered DU-145 different variants. Representative figure; performed in duplicate. (D) Relative ERF mRNA expression in DU-145 parental, ERF rescue, CIC knockout (KO), and ERF rescue +CIC KO (n=3), Student’s t-test, ***p<0.001, and ****p<0.0001. (E) Wound healing assay in DU-145 cells with ERF rescue, CIC KO, or ERF rescue +CIC KO compared to parental (n=2). (F) CIC mRNA expression in PC-3 parental, PC-3 CIC overexpression (OE), and PC-3 (ERF +CIC) OE (n=3). p Value = ****p<0.0001 (G) Relative ERF mRNA expression in PC-3 parental, PC-3 ERF OE, PC-3 (ERF +CIC) OE, and PC-3 ERF knockdown (KD) (n=3). p Value = *p<0.05, **p<0.01, and ***p<0.001. (H) Wound healing assay in PC-3 cells expressing ERF OE, CIC OE, (ERF +CIC) OE, or ERF KD compared to control (n=6). (I) Immunoblot of ERF and HSP90 in PC-3 cells with ERF KD.
-
Figure 3—figure supplement 1—source data 1
Full-length western blot images of basal levels of Capicua (CIC), ETS2 repressor factor (ERF), and β-actin in prostate epithelial cells (PNT2), DU145, and PC3 cells and associated raw images.
- https://cdn.elifesciences.org/articles/77072/elife-77072-fig3-figsupp1-data1-v1.zip
-
Figure 3—figure supplement 1—source data 2
Full-length western blot images of CIC, ETS2 repressor factor (ERF), and HSP90 in DU145 cells with its variants and associated raw images.
- https://cdn.elifesciences.org/articles/77072/elife-77072-fig3-figsupp1-data2-v1.zip
-
Figure 3—figure supplement 1—source data 3
Full-length western blot images of ETS2 repressor factor (ERF) and HSP90 in PC3 cells with its variants and associate raw images.
- https://cdn.elifesciences.org/articles/77072/elife-77072-fig3-figsupp1-data3-v1.zip
Figure 4 with 1 supplement
Capicua (CIC) and ETS2 repressor factor (ERF) cooperatively bind an ETV1 regulatory element to suppress ETV1 expression and transcriptional activity.
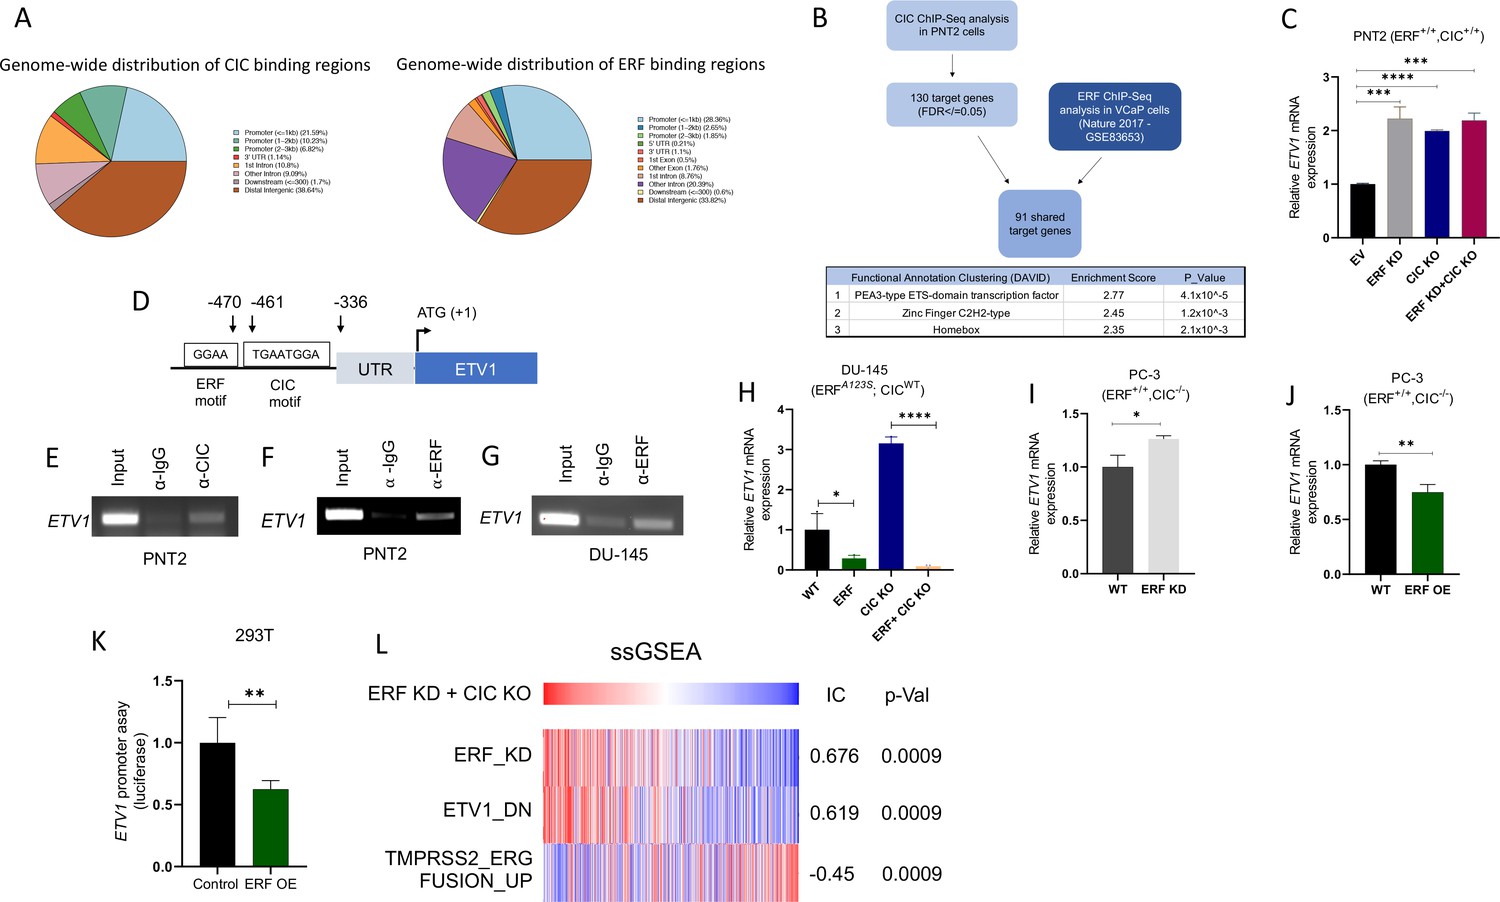
(A) Percentage of CIC and ERF peaks located in defined genomic regions. (B) Schematic algorithm to identify shared CIC and ERF target genes in prostate cells (top). Functional Clustering Analysis of the 91 shared CIC and ERF target genes using DAVID (bottom table). (C) ETV1 mRNA expression in prostate epithelial cells (PNT2) (CIC-ERF-replete) cells with ERF knockdown (KD), CIC knockout (KO), or ERF KD +CIC KO (n=3). (D) Schematic of CIC and ERF DNA-binding motifs in the ETV1 promoter. (E) Chromatin immunoprecipitation (ChIP)-PCR from PNT2 cells showing CIC occupancy on the ETV1 promoter. (F–G) ChIP-PCR with ERF occupancy on the ETV1 promoter. (H) ETV1 mRNA expression in DU-145 (ERF-deficient) cells with ERF rescue, CIC KO, or ERF rescue +CIC KO (n=3). ETV1 mRNA expression in PC-3 cells with (I) ERF KD (n=3) and (J) ERF overexpression (OE) (n=3). p Values were calculated using Student’s t test. *p<0.05, **p<0.01, and ****p<0.0001. Error bars represent SD. Performed in triplicate. (K) ETV1 luciferase promoter assay in 293T cells comparing Empty vector (EV) with ERF OE (n=6). Student’s t test, *p<0.05. Error bars represent SD. (L) Single sample gene set enrichment analysis (ssGSEA) alignments comparing gene expression patterns in PNT2 cells with ERF KD and CIC KO. IC = information coefficient.
-
Figure 4—source data 1
Full-length PCR gel images of ETV1 after Capicua (CIC) pull down in prostate epithelial cells (PNT2).
Cropped images and description shown in Figure 4E.
- https://cdn.elifesciences.org/articles/77072/elife-77072-fig4-data1-v1.zip
-
Figure 4—source data 2
Full-length PCR gel images of ETV1 after ETS2 repressor factor (ERF) pull down in prostate epithelial cells (PNT2).
Cropped images and description shown in Figure 4F.
- https://cdn.elifesciences.org/articles/77072/elife-77072-fig4-data2-v1.zip
-
Figure 4—source data 3
Full-length PCR gel images of ETV1 after ETS2 repressor factor (ERF) pull down in DU-145 cells.
Cropped images and description shown in Figure 4G.
- https://cdn.elifesciences.org/articles/77072/elife-77072-fig4-data3-v1.zip
Figure 4—figure supplement 1

ETV1, but not ETV4 or ETV5, is a transcriptional target of both ETS2 repressor factor (ERF) and Capicua (CIC).
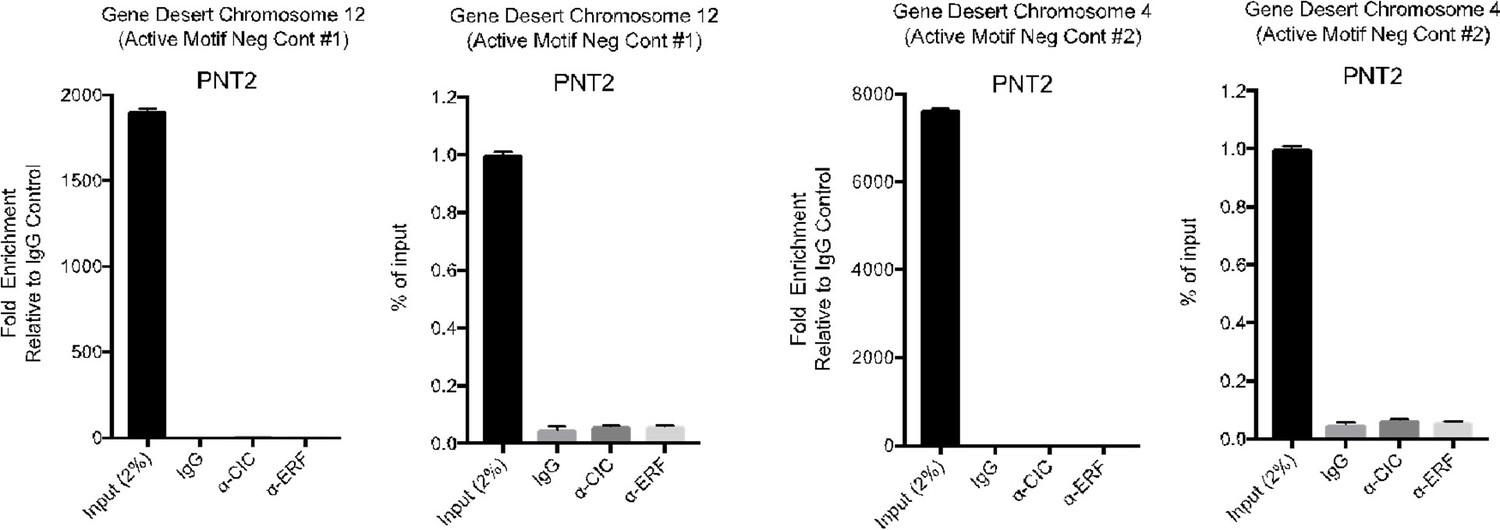
(A–C) Relative ETV1, ETV4, and ETV5 mRNA expression in prostate epithelial cells (PNT2) parental and PNT2 CIC knockout (KO) cells (n=3). (D–F) Relative ETV1, ETV4, and ETV5 mRNA expression in PNT2 parental and PNT2 ERF knockdown (KD) +CIC KO cells (n=3). (G) Relative ERF, (H) ETV1, (I) ETV4, and (J) ETV5 mRNA expression in parental PNT2 and PNT2 ERF KD cells (n=3). (K) Co-immunoprecipitation using GFP-tagged ERF (pulldown) and immunoblotting for ERF and CIC. (L) Co-immunoprecipitation using Myc-tagged CIC (pulldown) and immunoblotting for ERF and CIC. (M) ETV1 chromatin immunoprecipitation (ChIP)-PCR fold enrichment of CIC compared to IgG control in PNT2 cells (n=3). (N) ETV1 ChIP-PCR fold enrichment of ERF compared to IgG control in PNT2 cells (n=3). (O) Gene Desert quantitative PCR (Active Motif Negative control) comparing CIC and ERF to IgG control. (P) Gene Desert quantitative PCR (Active Motif Negative control) comparing CIC, ERF, and IgG to input control. Relative (Q) ERF, (R) ETV1, (S) ETV4, and (T) ETV5 mRNA expression in parental DU-145 and DU-145 ERF cells (n=3). p Values for all figures = *p<0.05, **p<0.01, ***p<0.001, and ****p<0.0001. Error bars represent SD.
-
Figure 4—figure supplement 1—source data 1
Co-immunoprecipitation using GFP-tagged ETS2 repressor factor (ERF) and immunoblotting for Capicua (CIC; bottom panel) and ETS2 repressor factor (ERF; top panel) with associated raw images.
- https://cdn.elifesciences.org/articles/77072/elife-77072-fig4-figsupp1-data1-v1.zip
-
Figure 4—figure supplement 1—source data 2
Co-immunoprecipitation using myc-tagged Capicua (CIC) and immunoblotting for ETS2 repressor factor (ERF; top panel) and CIC (bottom panel) with associated raw images.
- https://cdn.elifesciences.org/articles/77072/elife-77072-fig4-figsupp1-data2-v1.zip
Figure 5 with 2 supplements

Combinatorial CIC and ETS2 repressor factor (ERF) loss can modulate ETV1 inhibitor sensitivity in prostate cells.
(A) DU-145 cells were transfected with either siScramble (siSCM) or siCIC. After 48 hr, BRD32048 (ETV1 inhibitor) was added to both the transfected groups at the defined concentrations (0 μM, 25 μM, 50 μM). After 24 hr of BRD32048 treatment, cells were replated for crystal violet assay (0.4%) and images were taken and analyzed after 5 days (n=3). siCIC was compared to siSCRM conditions in each respective drug concentration. (B) Crystal violet viability assay (n=3). siETV1 groups were compared to siSCRM control groups +/- CIC expression (sgCtrl, sgCIC1, or sgCIC2). (C) DU-145 cells were transfected with either siScramble (siSCM) or siCIC. After 48 hr, BRD32048 was added to the transfected groups at defined concentrations (0 μM or 50 μM). Transwell invasion assays (n=3) were performed 24 hr after the addition of BRD32048. siCIC was compared to siSCRM in the 0 μM and 50 μM concentration groups. (D) Transwell invasion assays (n=3) comparing siETV1 to siSCRM control +/-CIC expression (sgCtrl, sgCIC1, or sgCIC2). p value = *p<0.05, **p<0.01 for all figures. Error bars represent SD.
Figure 5—figure supplement 1
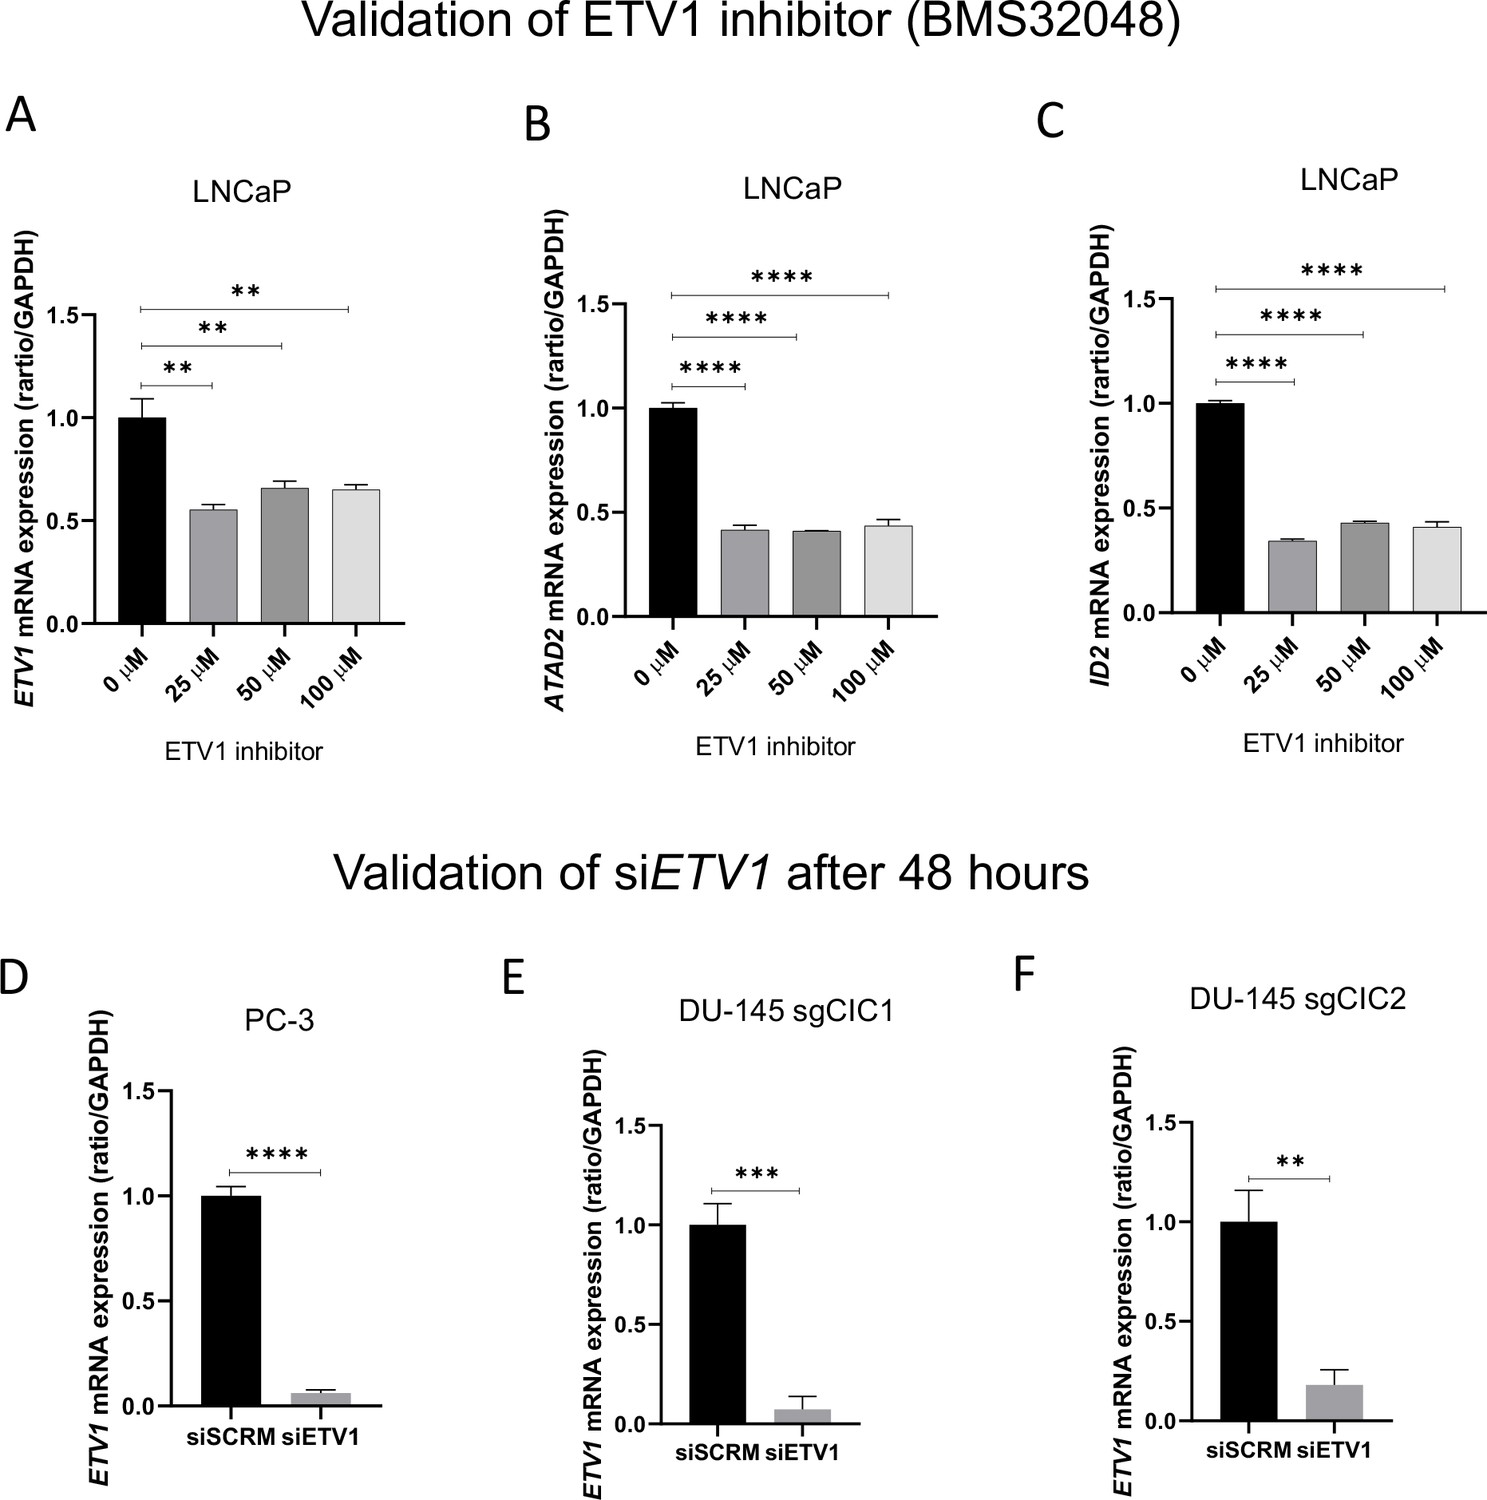
Validation of ETV1 chemical (BMS32048) and genetic inhibition in prostate cancer cells.
(A–C) Relative ETV1, ATAD2, and ID2 mRNA expression in LNCaP cells with or without BMS32048 (ETV1 inhibitor) treatment (n=3). (D) Relative ETV1 mRNA expression in PC-3 cells, (E) DU-145 +sgCIC1 and (F) DU-145 +sgCIC2 with or without siETV1 (n=3). p values for all figures = **p<0.01, ***p<0.001, ****p<0.0001.
Figure 5—figure supplement 2
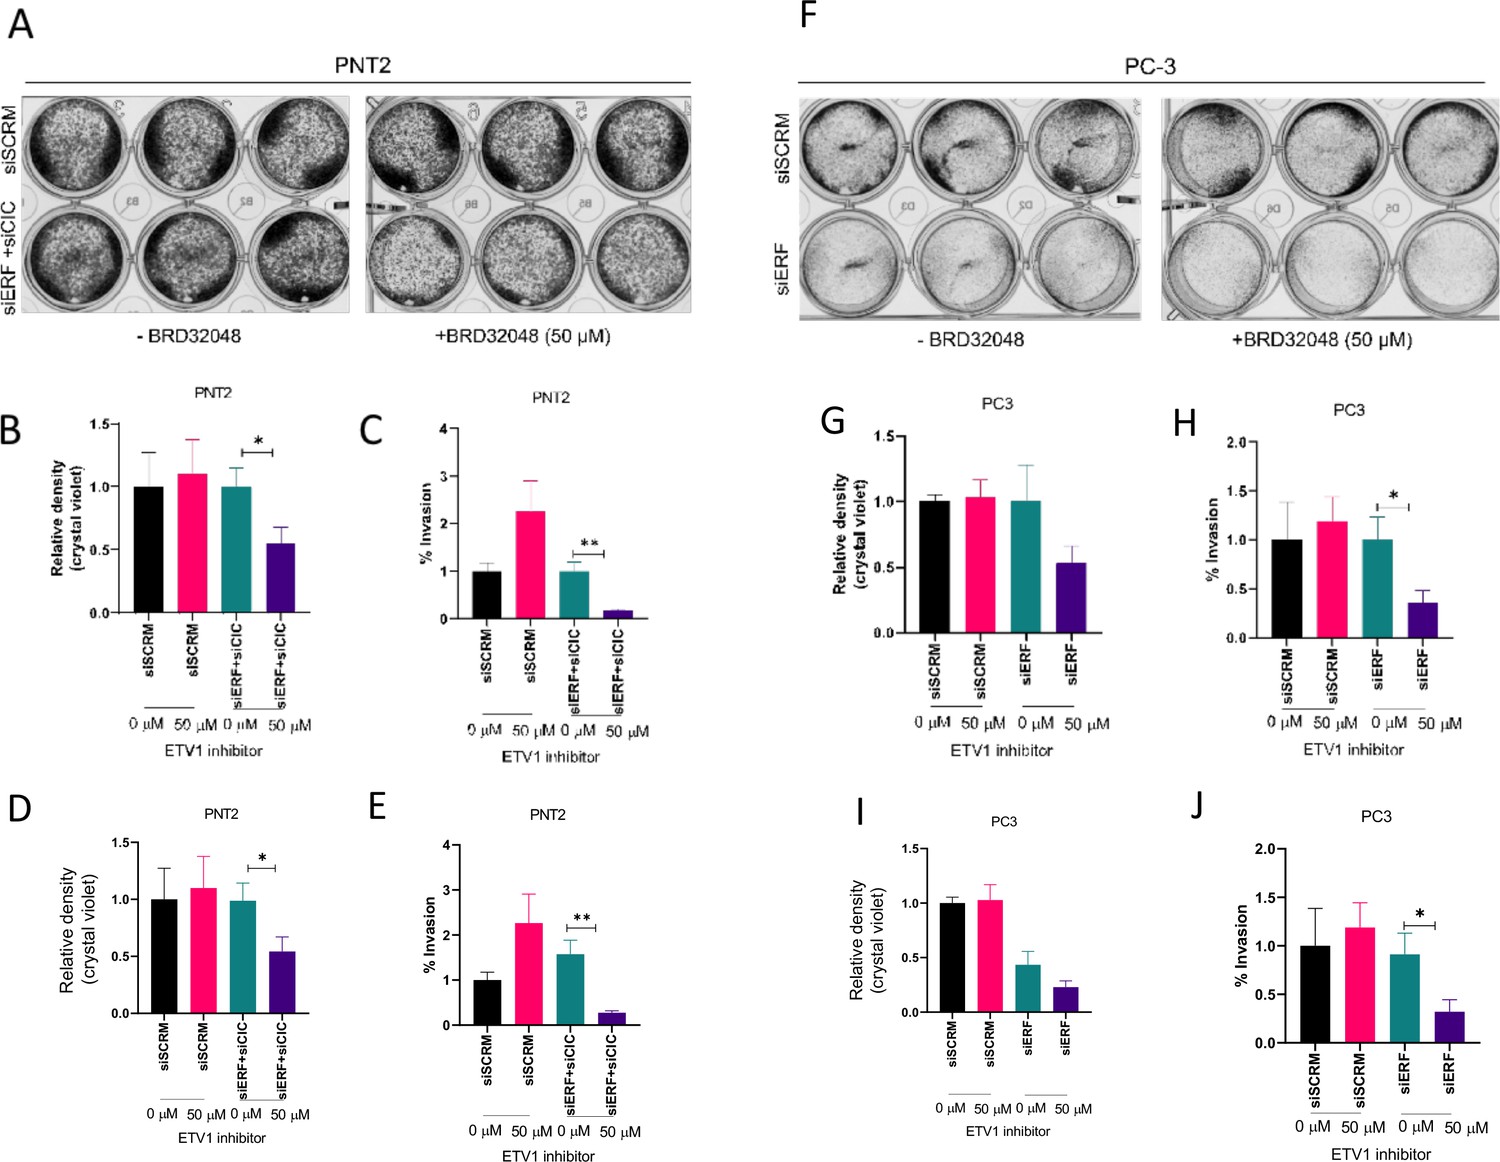
CIC and ETS2 repressor factor (ERF) expression modulate sensitivity to ETV1 inhibitor, BRD32048.
(A) BRD32048 treatment of PNT2 cells expressing siCIC and siERF compared to siSCRM control. (B) Relative density of crystal violet assays performed in (A) (n=3). (C) Transwell assay comparing BRD32048 treated PNT2 cells (n=3). BRD32048 (0 μM) columns were set to ‘1’ in the siSCRM and siERF +siCIC groups for relative comparison in (B–C). (D) Relative density of crystal violet assays performed in (A) (n=3). (E) Transwell assay comparing BRD32048 treated PNT2 cells (n=3). siSCRM column (0 µM) was set to ‘1’ for relative comparison to other groups in (D–E). (F) BRD32048 treatment of PC-3 cells expressing siERF compared to siSCRM control. (G) Relative density of crystal violet assays performed in (F) (n=3). (H) Transwell assay comparing BRD32048 treated PC-3 cells (n=3). BRD32048 (0 μM) columns were set to ‘1’ in the siSCRM and siERF groups for relative comparison in (G–H). (I) Relative density of crystal violet assays performed in (F) (n=3). (J) Transwell assay comparing BRD32048 treated PC-3 cells (n=3). siSCRM column (0 µM) was set to ‘1’ for relative comparison to other groups in (I–J). Students t-test, p values *p<0.05, **p<0.01 for all figures.
Author response image 1
Author response image 2
Author response image 3
Author response image 4
Author response image 5
Author response image 6
Tables
Key resources table
| Reagent type (species) or resource | Designation | Source or reference | Identifiers | Additional information |
|---|---|---|---|---|
| Gene CIC (Homo sapiens) | CIC | Pubmed gene database | Gene ID: 23152 | |
| Gene ERF (Homo sapiens) | ERF | Pubmed gene database | Gene ID: 2077 | |
| Gene ETV1 (Homo sapiens) | ETV1 | Pubmed gene database | Gene ID: 2115 | |
| Cell line (Homo-sapiens) | HEK293T | ATCC | Cell line maintained in DMEM with 10% FBS and 1% PSN | |
| Cell line (Homo-sapiens) | PNT2 | Sigma | Cell line maintained in DMEM with 10% FBS and 1% PSN | |
| Cell line (Homo-sapiens) | DU-145 | ATCC | Cell line maintained in RPMI with 10% FBS and 1% PSN | |
| Cell line (Homo-sapiens) | PC3 | ATCC | Cell line maintained in RPMI with 10% FBS and 1% PSN | |
| Transfected construct (human) | ERF shRNA #1 | Sigma-Aldrich | CAT# TRCN000001391 TRCN0000013912 | Lentiviral construct to transfect and express ERF shRNA. |
| Transfected construct (human) | sgRNAs | Addgene | CAT#74959 and #74953 | |
| Transfected construct (human) | Lentiviral GFP-tagged ERF | GeneCopoeia | CAT# EX-S0501-Lv122 | |
| Transfected construct (human) | CIC-Myc-tag plasmid | Origene | CAT#: RC215209 | |
| Transfected construct (human) | siRNA to ETV1 SMARTpool | Dharmacon | CAT# L-003801-00-0005 | |
| Transfected construct (human) | siRNA to CIC SMARTpool | Dharmacon | CAT# L-015185-01-0005 | |
| Antibody | CIC (Rabbit polyclonal) | Thermo Fisher Scientific | CAT# PA146018 | WB (1:1000) For ChIP |
| Antibody | ERF (Rabbit monoclonal) | Thermo Fisher Scientific | CAT# PA530237 | WB (1:1000) For ChIP |
| Antibody | HSP90 (Rabbit polyclonal) | Cell Signaling | CAT# 4874 S | WB (1:1000) |
| Antibody | Actin (Rabbit monoclonal) | Cell Signaling | CAT# 4970 S | WB (1:1000) |
| Sequence-based reagent | ETV1-CIC-Forward-1 | This paper | ChIP-PCR primers | 5’ CAGGACAAAGAGGAGGCAGCGAGCTG-3’ |
| Sequence-based reagent | ETV1-CIC-Reverse-1 | This paper | ChIP-PCR primers | 5’ GTTTATTGCTGACCCCTCAGCGCTCCGC 3’ |
| Sequence-based reagent | ETV1-ERF-Forward-1- | This paper | ChIP-PCR primers | 5’-CCAGGTCCGGGGTTGAGTGCTGTGC- 3 |
| Sequence-based reagent | ETV1-ERF-Reverse-1 | This paper | ChIP-PCR primers | 5’-CATTTGTGACCAGAACTAGTGACC-3 |
| Sequence-based reagent | ETV1 promoter | SwitchGear Genomics | Product ID: S720645 | |
| Sequence-based reagent | Empty promoter | SwitchGear Genomics | Product ID: S790005 | |
| Chemical compound, drug | BRD32048 | Sigma Aldrich | Cat#: SML1346 | ETV1 inhibitor |
Additional files
-
Supplementary file 1
List of 91 CIC and ERF shared putative target genes used for DAVID analysis.
- https://cdn.elifesciences.org/articles/77072/elife-77072-supp1-v1.xlsx
-
Supplementary file 2
Promoter primer sequences for ChIP-PCR and ChIP-Seq experiments.
- https://cdn.elifesciences.org/articles/77072/elife-77072-supp2-v1.docx
-
Transparent reporting form
- https://cdn.elifesciences.org/articles/77072/elife-77072-transrepform1-v1.pdf
Download links
A two-part list of links to download the article, or parts of the article, in various formats.
Downloads (link to download the article as PDF)
Open citations (links to open the citations from this article in various online reference manager services)
Cite this article (links to download the citations from this article in formats compatible with various reference manager tools)
The CIC-ERF co-deletion underlies fusion-independent activation of ETS family member, ETV1, to drive prostate cancer progression
eLife 11:e77072.
https://doi.org/10.7554/eLife.77072


