Structure-based electron-confurcation mechanism of the Ldh-EtfAB complex
- Departments of Molecular Membrane Biology of the Max-Planck-Institut for Biophysics, Germany
- Department of Molecular Microbiology & Bioenergetics, Institute of Molecular Biosciences, Goethe University, Germany
- Central Electron Microscopy Facility, Max Planck Institute of Biophysics, Germany
- SYNMICRO Research Center and Department of Chemistry, Philipps University, Germany
Figures
Figure 1 with 1 supplement
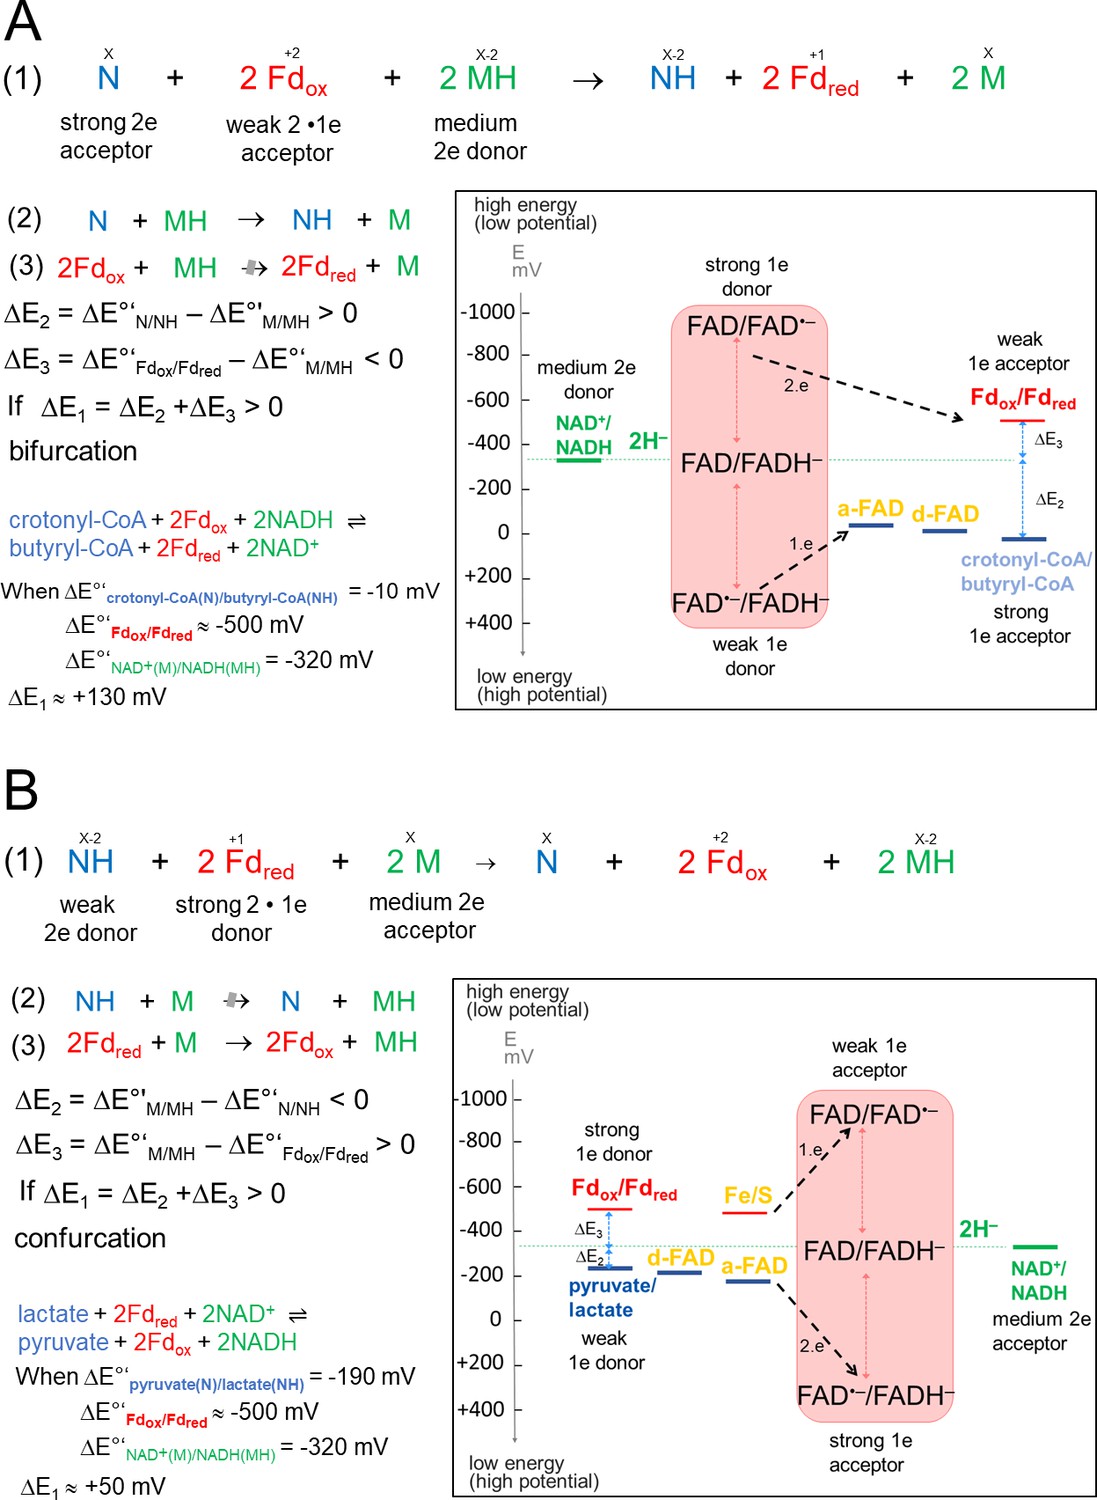
Thermodynamic basis.
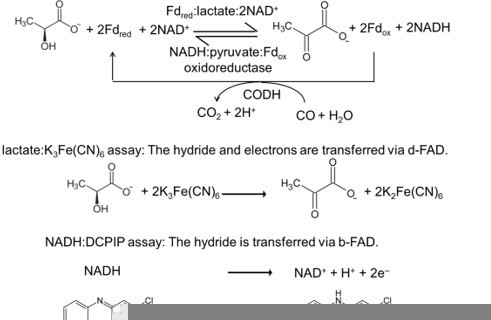
(A) The FBEB reaction (1). It involves two reduction reactions (2+3) using the same electron donor (MH) of medium redox potential and two electron acceptors (N and Fdox) of high and low redox potential. Fd can be only replaced by flavodoxin (Chowdhury et al., 2016). Biochemical reactions are normally characterized by a pair-wise exchange of electrons between substrates that are protonated in their reduced state. FBEB occur when the positive difference redox potential ΔE2 between the strong electron acceptor (N) and the medium electron donor (MH) has a higher absolute value than the negative ΔE3 between Fdox and MH. In other words, ΔE1 has to be positive resulting in a negative Gibbs free energy (ΔG = -nFΔE, n: moles of electrons exchanged, F: Faraday constant). As example, the electrochemical treatment and the thermodynamic scheme was provided for the reaction of the bifurcating Bcd-EtfAB complex, in which the b-FAD reduced by NADH endergonically donates one electron via a-FAD to d-FAD and then exergonically one electron to Fdox. (B) The reverse FBEC reaction (1) calalyzing two oxidation reaction (2+3) with the same electron acceptor (M). Here, positive ΔE3 has a higher absolute value than the negative ΔE2. In the Ldh-EtfAB reaction low-potential Fdred donates an electron to b-FAD via one [4Fe-4S] cluster in an endergonic reaction that is driven by the exergonic ET from d-FAD, via a-FAD to b-FAD•−. The generated b-FADH‒ transfers a hydride to NAD+. For the FBEB/FBEC process the first uphill ET step to b-FAD is reversed except when instanteneously pulled out by the second downhill ET step termed as escapement-type mechanism (Baymann et al., 2018). This tight coupling implicates catalytic inactivity in the absence of one of the three substrates and prevention of short circuit reactions e.g. from b-FAD•− to a-FAD•− and undesirable side reactions.
of the highly reactive b-FAD•−.
Figure 1—figure supplement 1
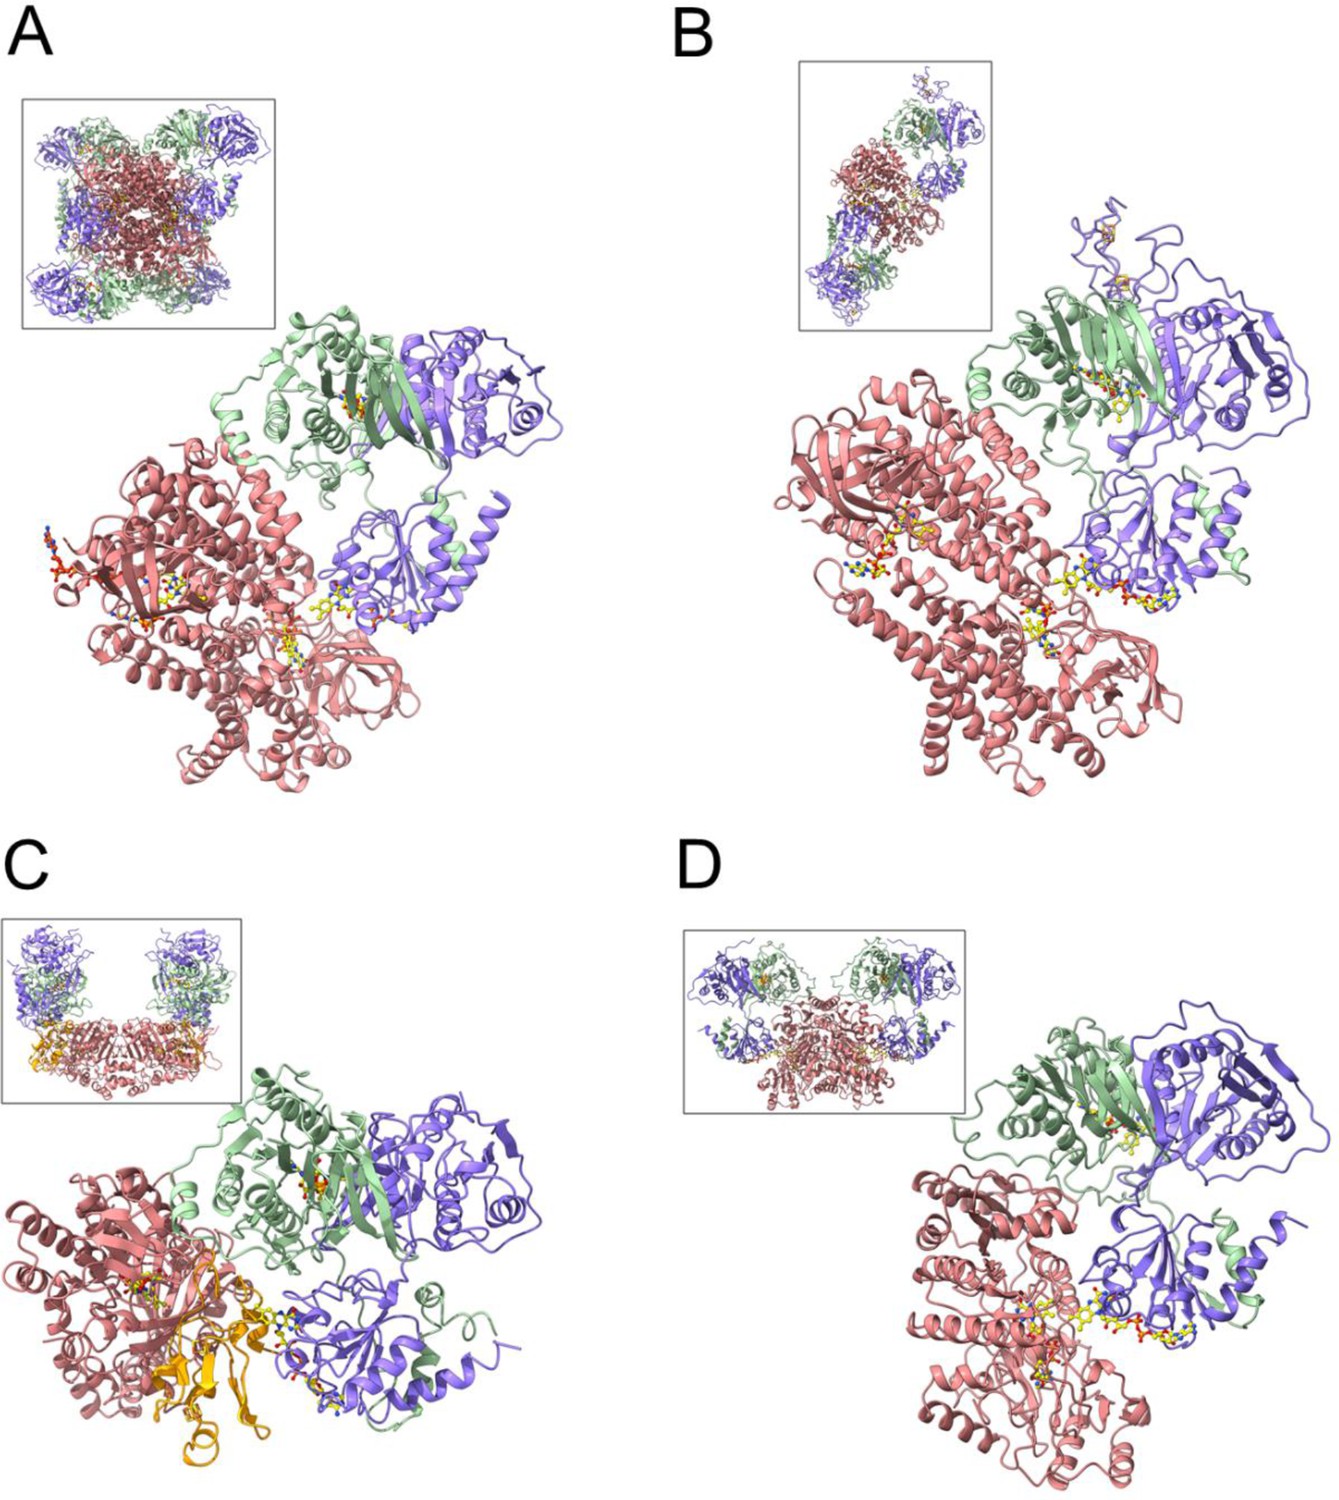
The four structurally charcterized EtfB family members; functional units of Bcd-EtfAB (A), CarCDE (B), FixCX-EtfAB (C) and for comparison Ldh-EtfAB (D).
EtfA, EtfB, and the dehydrogenase/oxidreductase subunits are drawn in blue, green, and salmon, respectively. The EtfAB module for all oxidoreductase-EtfAB complexes are presented in the same orientation. The entire (Bcd-EtfAB)4, (CarCDE)4 and (FixCX-EtfAB)2 and (Ldh-EtfAB)2 structures are shown in insets.
Figure 2 with 1 supplement
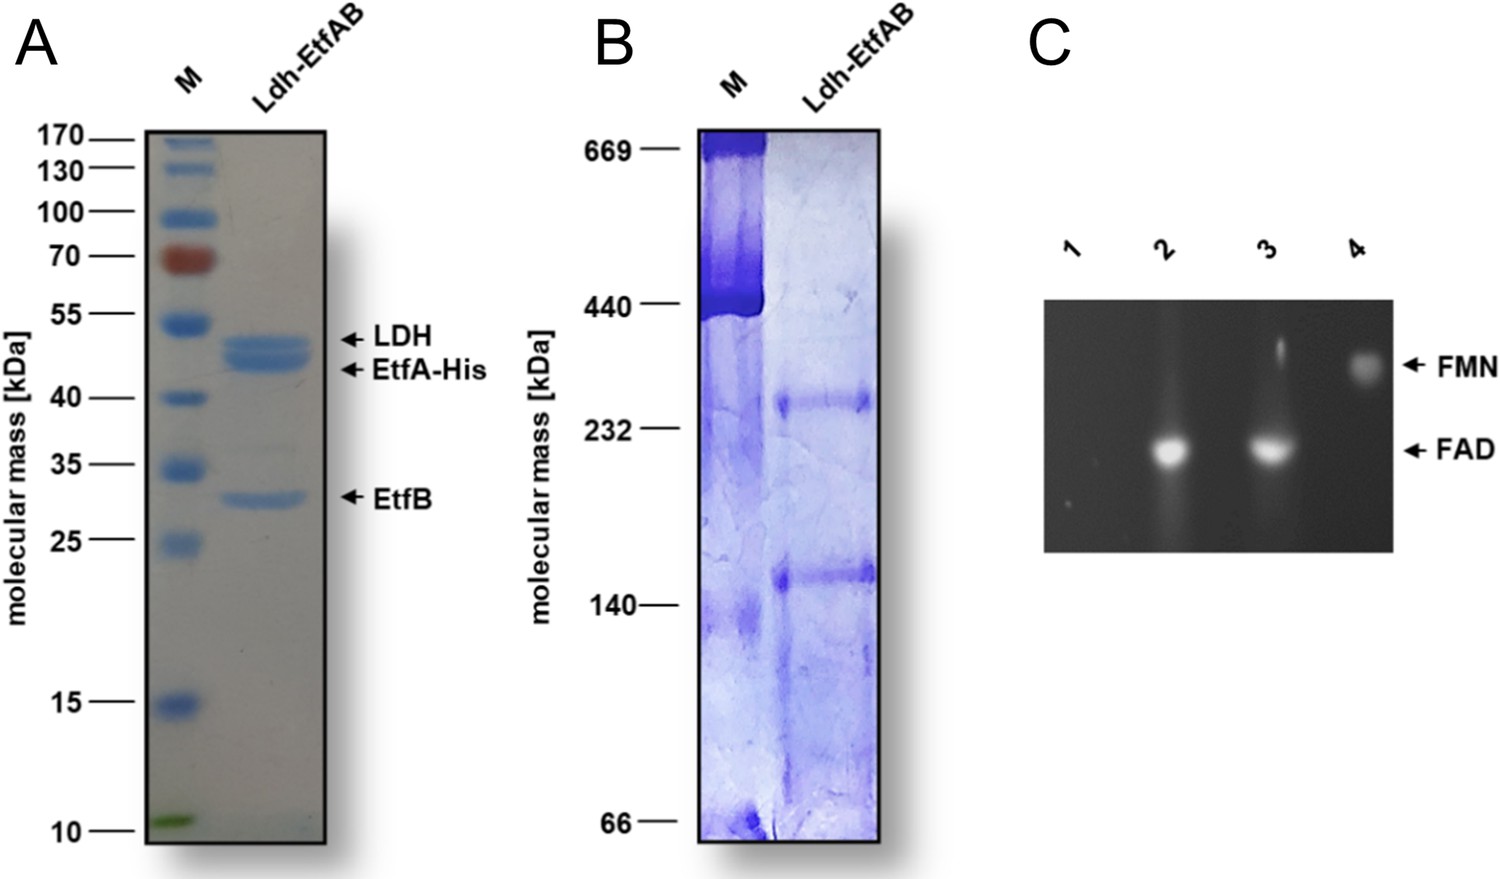
Biochemical analysis of the purified Ldh-EtfAB complex.
The Ldh-EtfAB complex was anaerobically purified by strep-tactin affinity and Superdex 200 size exclusion chromatography. (A) 12% SDS-PAGE and (B) native PAGE using 5 µg or 20 µg of the purified protein for separation, respectively. Coomassie Brilliant Blue G250 was applied for protein staining. (C) Flavin determination. Flavins of ~1 nmol Ldh-EtfAB were separated on a TLC plate using 60% [v/v] n-butanol, 15% [v/v] glacial acetic acid and 25% [v/v] H2O as the mobile phase. 1 nmol of FAD and FMN were used as standards. For this experiment Ldh-EtfAB was purified with buffers additionally mixed with 5 µM FAD and FMN. Flavins were visualized under UV light. lane 1, buffer; lane 2, Ldh-EtfAB; lane 3, FAD; lane 4, FMN; M, Prestained PageRuler.
-
Figure 2—source data 1
SDS-PAGE, native PAGE gels and TLC plate for Figure 2.
- https://cdn.elifesciences.org/articles/77095/elife-77095-fig2-data1-v1.zip
Figure 2—figure supplement 1

Disassembly of the Ldh-EtfAB complex.
(A) Gel filtration elution profile. The concentrated sample was separated with a flow rate of 0.5 ml/min on a Superdex 200 10/300 GL column, previously equilibrated with buffer W. The graph shows the extinction at 280 nm. (B) SDS-PAGE analysis of the peaks. 10 µg of the eluted protein peaks (1, 2, 3) were separated by a 12% SDS-PAGE. Coomassie Brilliant Blue G250 was used for protein staining. M, Prestained PageRuler.
Figure 3
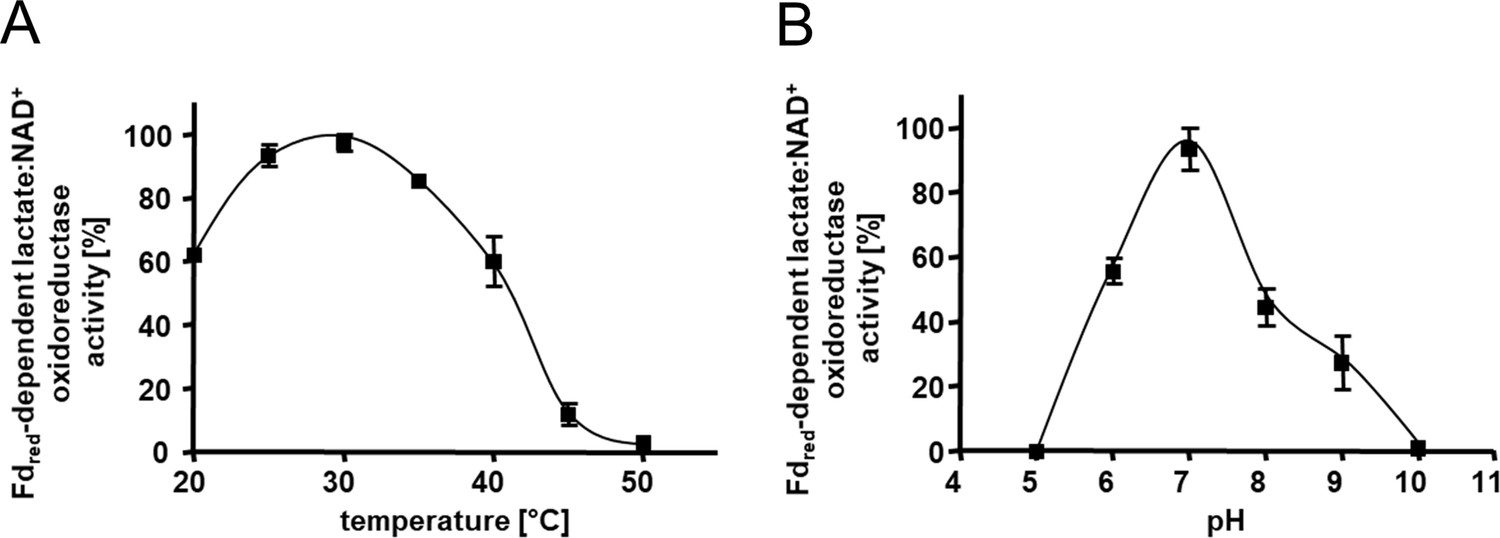
Kinetic characterization of the Ldh-EtfAB complex.
(A) The temperature- and (B) the pH- dependency of the FBEC activity. The assay contained 30 μM Fdox, 17 μg carbon monoxide dehydrogenase (CODH); isolated from A. woodii (Hess et al., 2013), 4 mM NAD+ and 5 μg LDH-EtfAB in a 100% CO gas atmosphere. After 5 min incubation at the appropriate temperature, the reaction was started by adding 50 mM D/L-lactate. The buffer used for measuring the temperature optima was 50 mM Bis-Tris, 50 mM CaCl2, pH 7.0. The buffer used for pH optima determination contained 50 mM MES, 50 mM CHES, 50 mM CAPS, 50 mM Bis-Tris, 50 mM Tris, and 50 mM CaCl2. The reduction of NAD+ was measured by absorption spectroscopy at 340 nm. The data represents the mean and standard deviation of two independent experiments (n=2), each performed in triplicate.
Figure 4 with 2 supplements
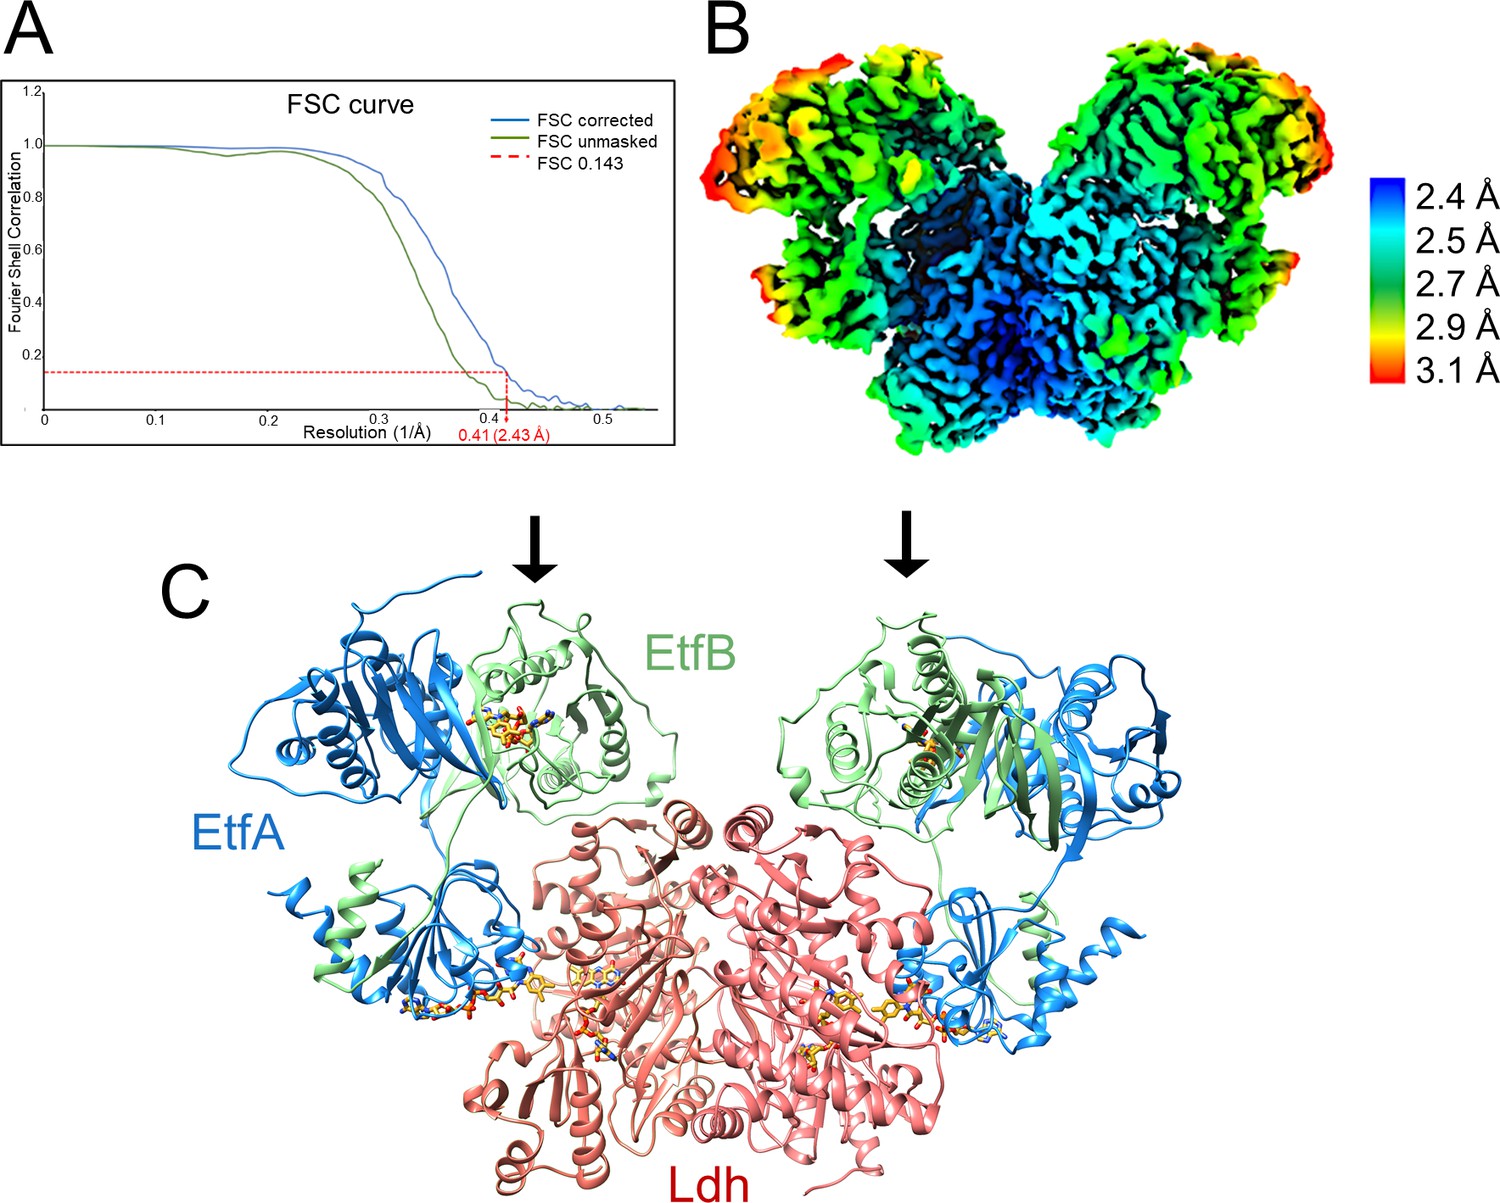
Structure of (Ldh-EtfAB)2 complex in the D-state.
(A) Fourier Shell Correlation curve of unmasked and corrected 3D maps at 0.143 ‘gold standard’ (B) Cryo-EM map at 2.43 Å resolution. The density is colored according to the local resolutions. (C) Ribbon representation. The Ldh dimer is drawn in red, EtfA in blue and EtfB in green. The 255 kDa heterohexameric complex has an overall size of 150 Å x 100 Å x 60 Å. The docking sites of the two Fd-like domains are marked with black arrows.
Figure 4—figure supplement 1
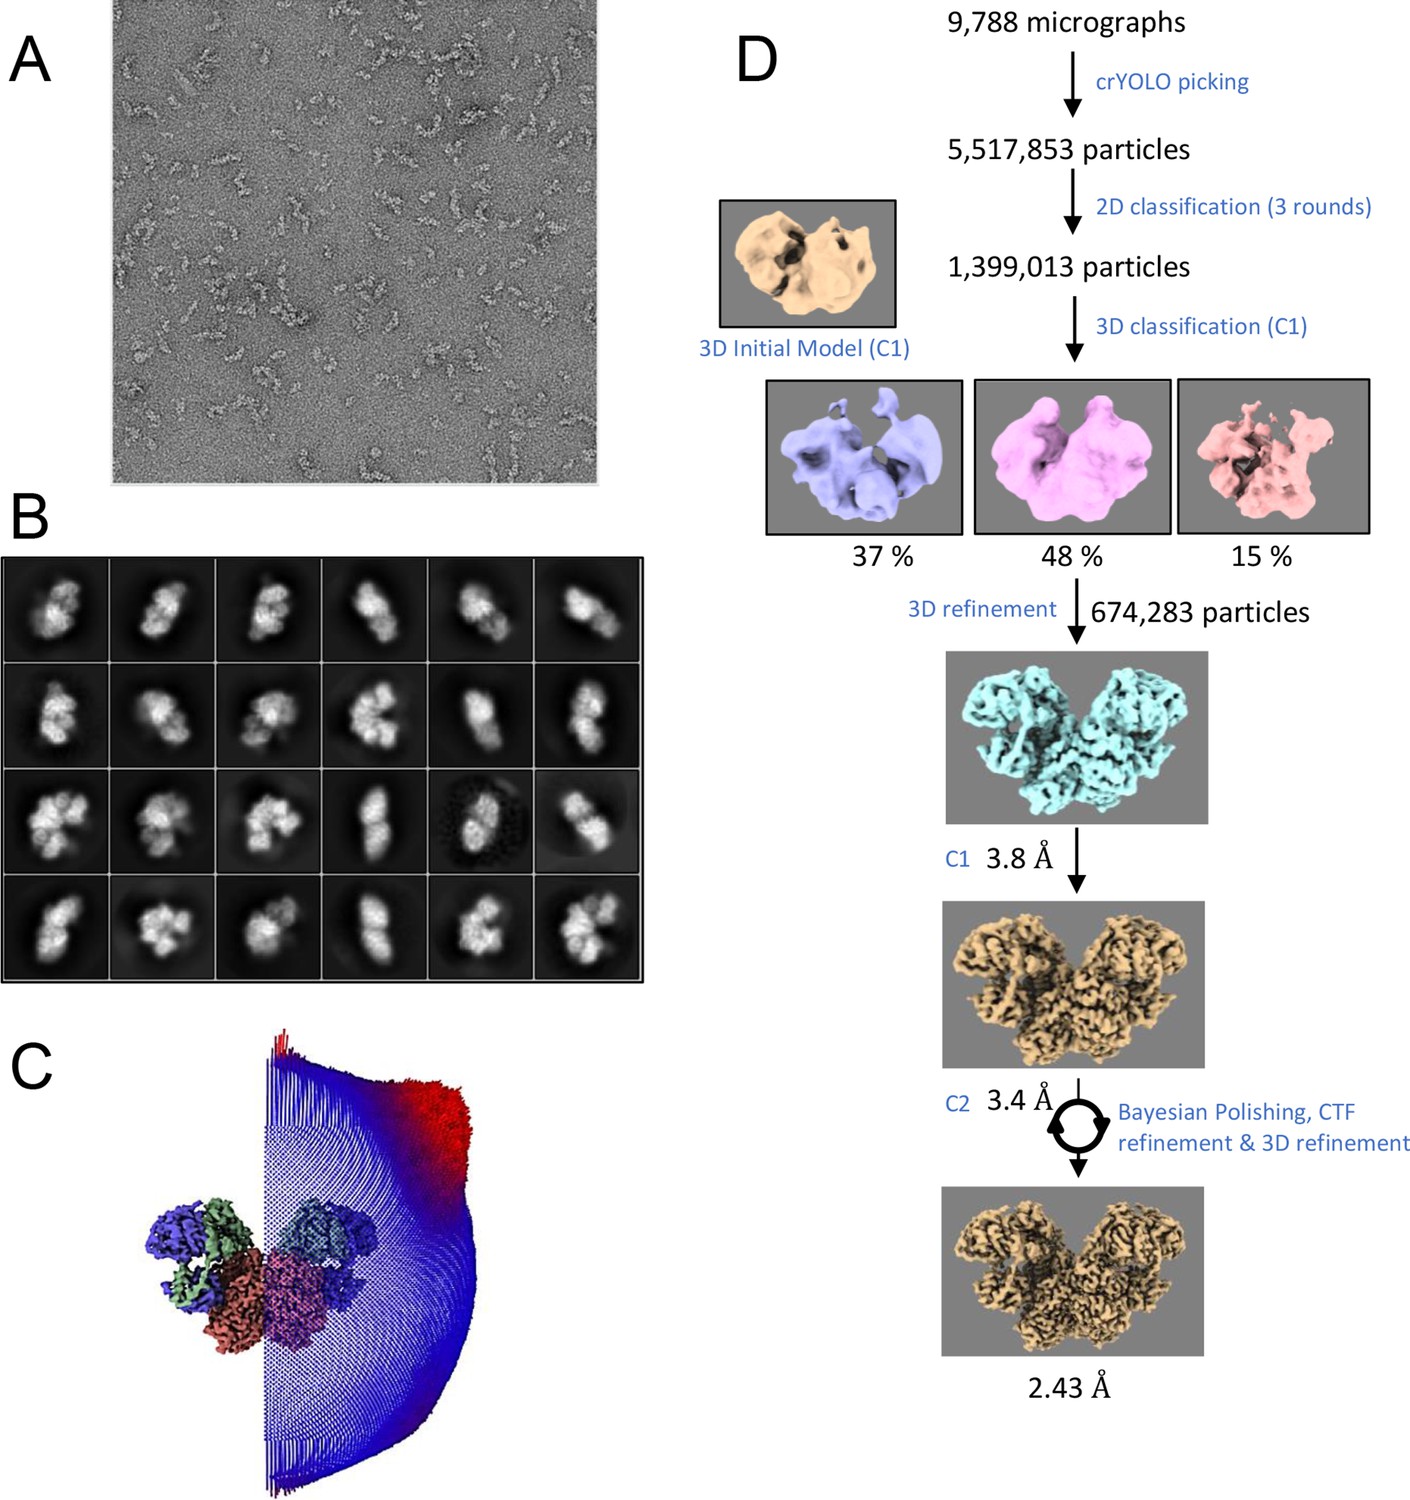
Electron microscopy (EM) data.
(A) Negative-staining EM. For screening the quality of the sample, negative-staining was performed with ca. 82 nM protein and stained using 0.75% uranyl formate for about 90 seconds. The grids used consists of QuantiFoil R1.2/1.3 Cu-200-mesh coated with collodion solution (cellulose nitrate, 2% in amyl acetate, Sigma). For protein sample support and distribution the grids were subsequently sputter-coated with 4.33 nm carbon thread. Before applying the sample, grids were glow-discharged twice with a PELCO easiGlow device at 15 mA for 90 s. (B) Single particle cryo-EM: Selected 2D classes for 3D map reconstruction. (C) Particle distribution projected on a C2-symmetry EM map indicating high uniformity (D) Relion image processing work flow used for the structure determination of the Ldh-EtfAB complex.
Figure 4—figure supplement 2
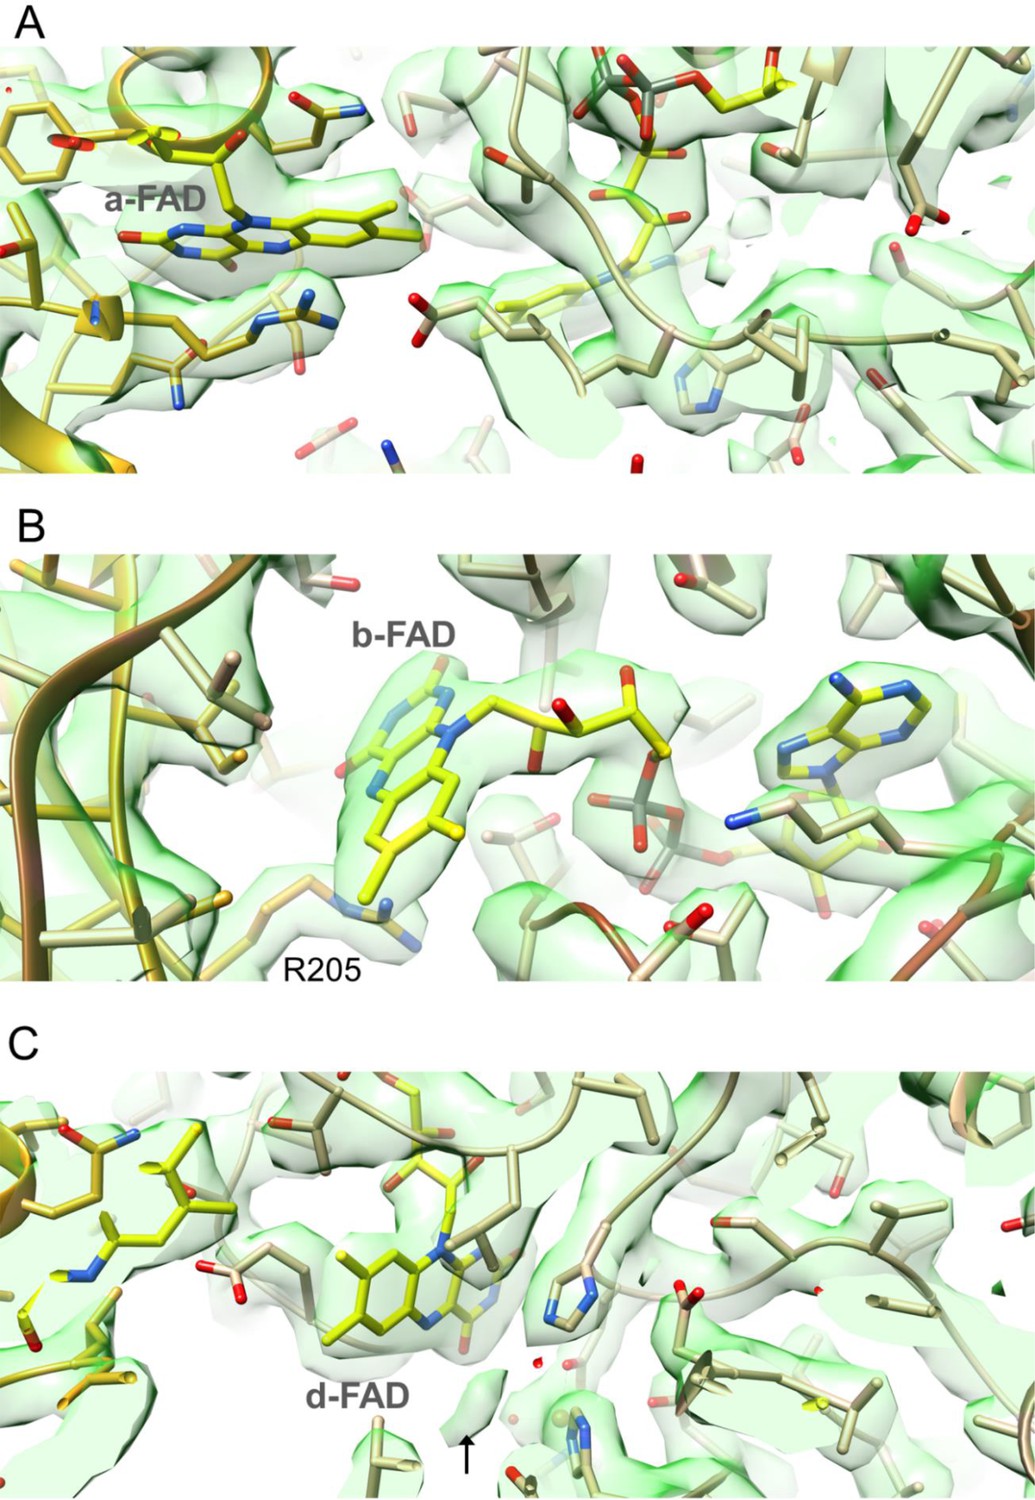
Cryo-EM density at 2.43 Å resolution in the surrounding of a-FAD (A), b-FAD (B) and d-FAD (C).
Density for the putative acetate or pyruvate was indicated by an arrow.
Figure 5 with 3 supplements

Structural states of the (Ldh-EtfAB)2 complex.
(A) The experimentally characterized D-state. The EtfAB shuttle domain (red) is spatially separated from the rigid EtfAB base (EtfA domain I in gold and EtfB domain III in brown) and attached to Ldh (green). a-FAD and d-FAD are 3.7 Å, a-FAD and b-FAD ca. 37 Å apart from each other. (B) The B-state. By combining the experimental EM data and Alphafold2 calculations a plausible B-state could be established for the first time. Starting from the D-state the EtfAB shuttle domain swings 75° to adjust an ET distance between a-FAD and b-FAD. The shortest distance between the isoalloxazine rings is 11.8 Å. Upon rotation the contact to Ldh is largely lost while that to the EtfAB base is formed.
Figure 5—figure supplement 1
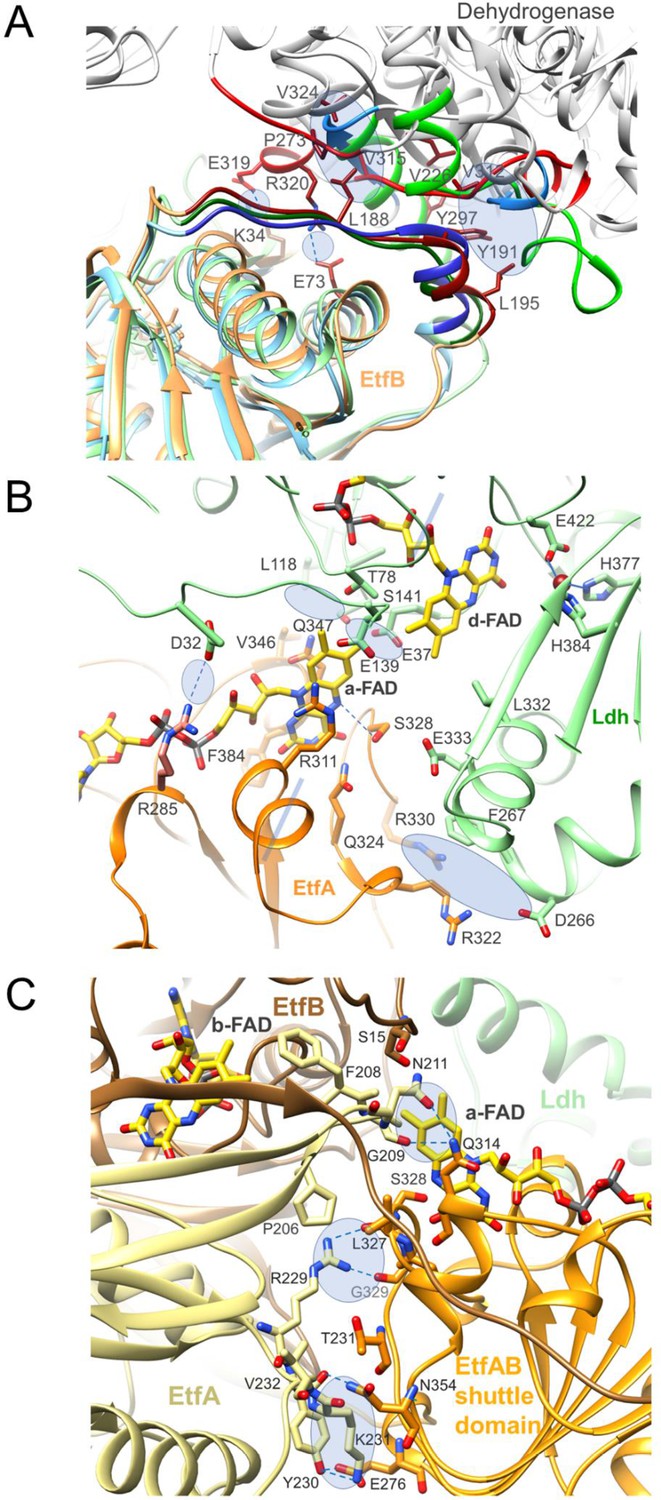
Interfaces between Ldh, the EtfAB base and the EtfAB shuttle domain.
Interface regions are marked by blue transparent ellipse and hydrogen-bond interactions by blue dashes. (A) Contact area between three different dehydrogenases and the EtfAB base. Superimposed EtfB of the Ldh-EtfAB, Bcd-EtfAB and non-bifurcating trimethylamine dehydrogenase-EtfAB complexes (1O95) are shown in light-orange, light-green, and light-blue. Their recognition loops of the three EtfB subunits serving as interface regions are highly conserved in contrast to the contact area of the associated dehydrogenases highlighted in red, green, and blue. The residual parts of the differently folded dehydrogenase subunits are drawn in gray. As reported for non-bifurcating EtfAB in a similar manner the side chain of Tyr191 of EtfB protrudes into the hydrophobic pocket formed by Leu195 and Tyr297 of EtfB, and Ala301, Val312, and Val226 of Ldh. In addition, a second small hydrophobic patch (Leu188 of EtfB and Pro273, Leu277, Tyr297, Val315 and Val324 of Ldh) and two remote salt bridges (Lys34 of EtfB - Glu319 of Ldh, Glu73 of EtfB - Arg320 of Ldh) are formed. (B) Contact region between Ldh and the EtfAB shuttle domain in the D-state. The major contact point is formed around a-FAD and d-FAD, which are in van der Waals contact to each other. Above and underneath the central flavin interface lies three rather small hydrophobic and hydrophilic contact patches, respectively, involving the FAD and cap domains of Ldh and a single salt bridge between Arg285 of EtfA and Asp32 of Ldh. (C) Contact region between the EtfAB base and the EtfAB shuttle domain in the B-state. The interface area (700 Å2) is essentially formed between the EtfAB shuttle domain (orange) and EtfA (paleyellow). Solely, a-FAD contacts EtfB. The first region is formed by Tyr230, Lys231, Val232 of the EtfA base and Glu276 and Asn354 of the EtfAB shuttle domain, the second between Arg229 and Leu327 as well as Gly329 and the third between Gly209 as well as Asn211 and Gln314.
Figure 5—figure supplement 2
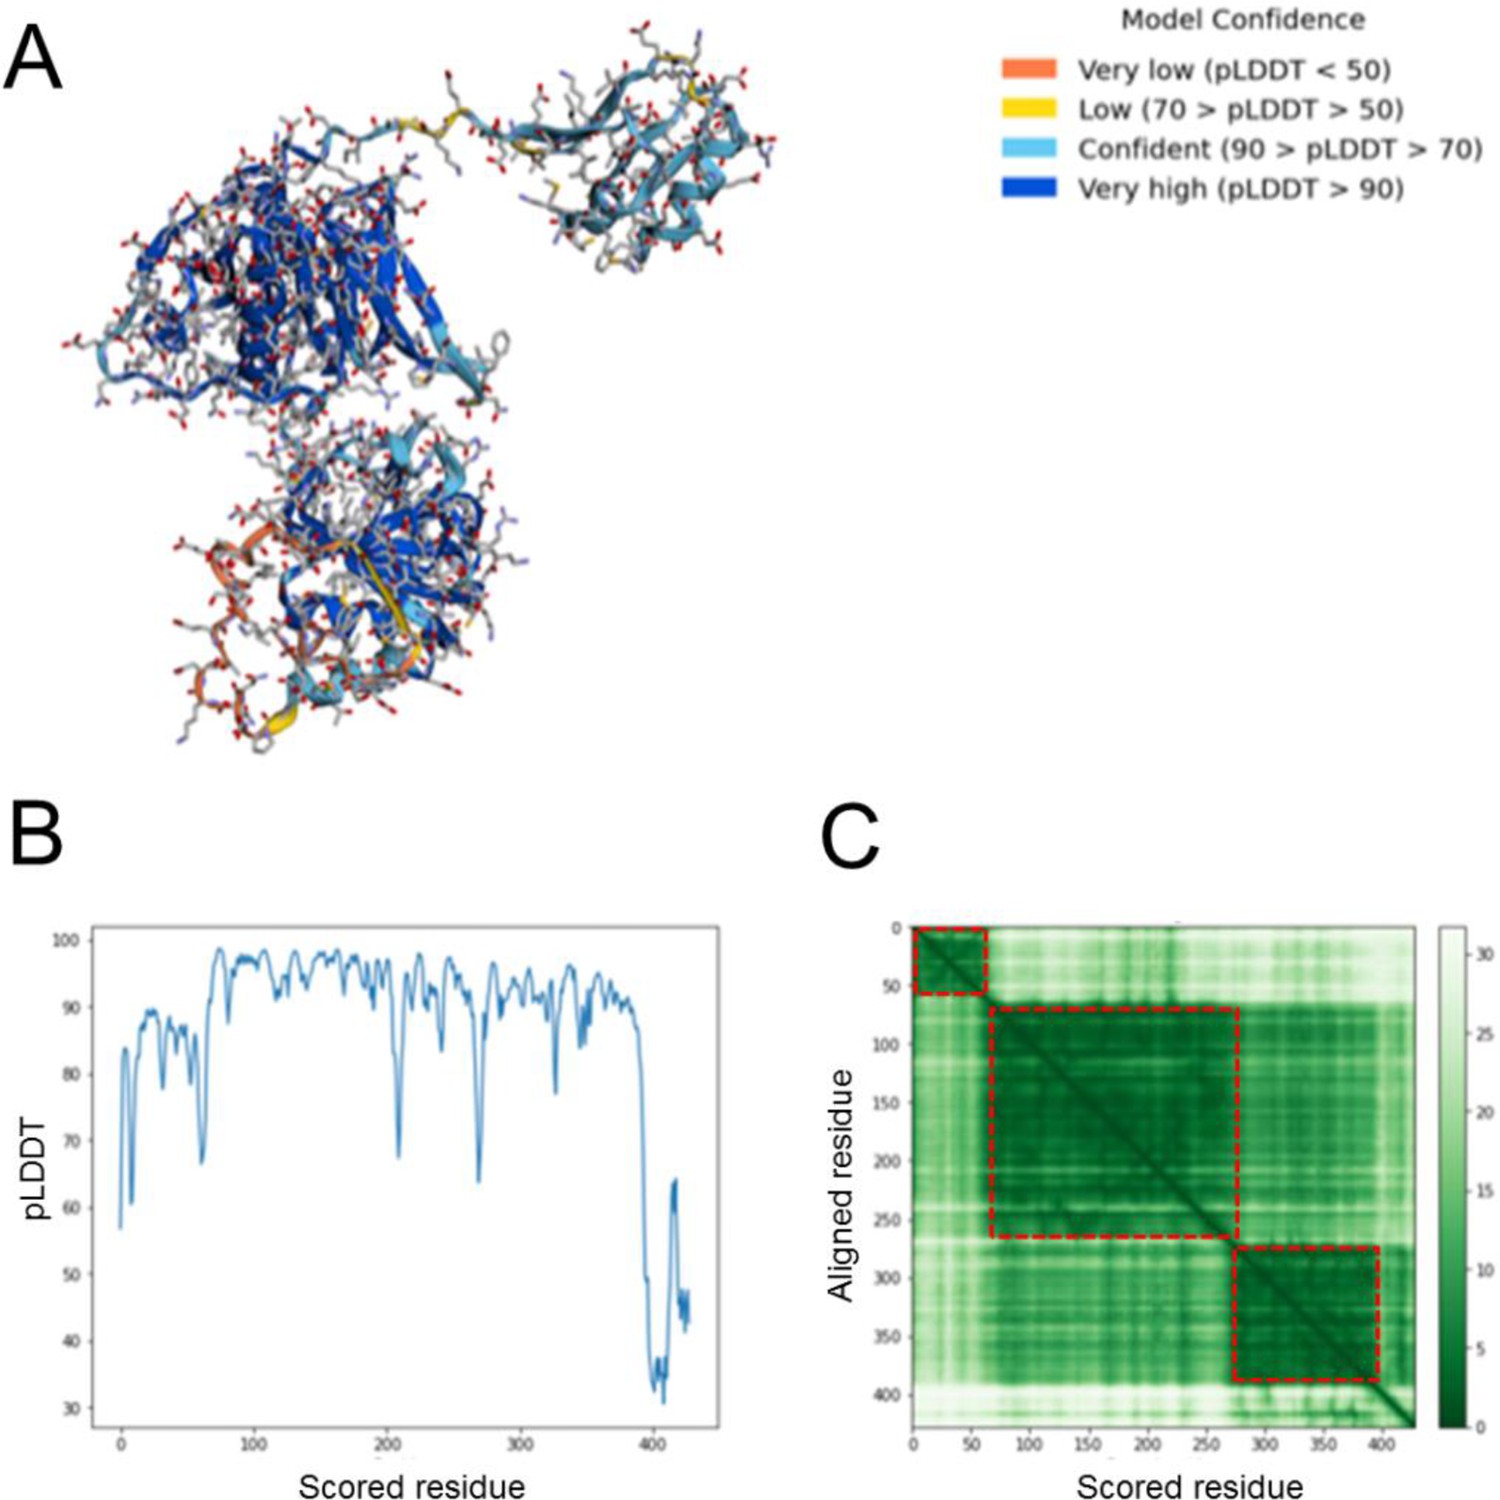
Quality of the AlphaFold2 EtfA model.
Only the sequence of EtfA was provided for structure determination. (A) Model confidence analysis. The reliability is marked by colors ranging from dark blue to orange representing highest to lowest model confidence, respectively. (B) Predicted LDDT. The confidence measure ranges from 0 to 100. pLDDT >70 are considered as higly reliable. The last 30 residues are modeled with a low confidence. (C) Predicted alignment error. AlphaFold2 exactly identified the domains of EtfA marked as red dotted squares. The aligment error is, in particular, small within the Fd domain, domain I (EtfA fraction of the EtfAB base) and domain II (EtfA fraction of the EtfAB shuttle domain) and larger between them (brighter green). These results are in agreement with the experimental data, which indicated flexible linkers between the Fd domain and domain I as well as between domains I and II. The rms deviation between the AlphaFold2 EtfA model and the experimental model was 1.31 Å for the EtfA base (domain I) and 0.98 Å for EtfA shuttle domain (domain II) arguing for an excellent fit.
Figure 5—video 1
Transition between the D- and B-states.
Figure 6
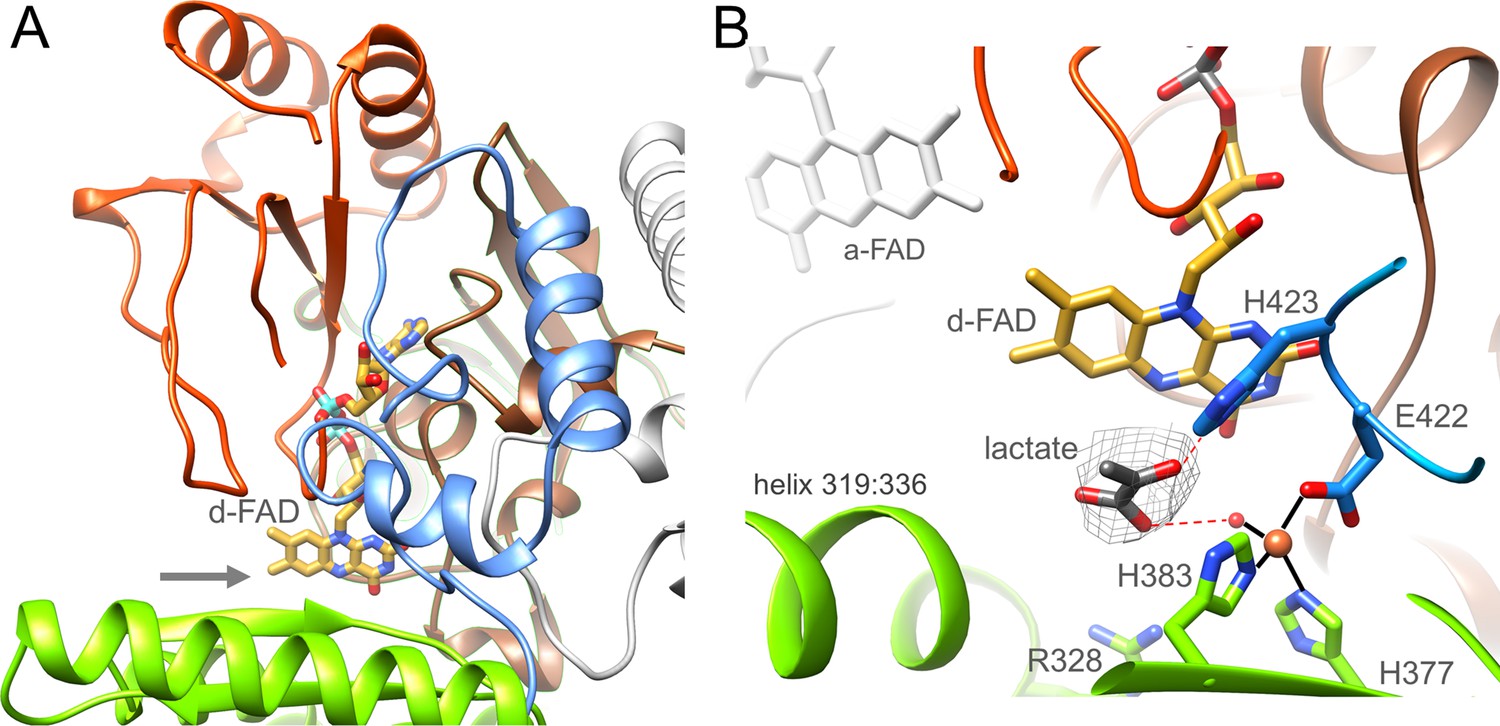
Ldh.
(A) The overall structure. The Ldh subunit belongs to the CMH flavoenzyme family composed of two α + β subdomains (orange-red and brown), a cap domain (green) and a C-terminal extension (blue). d-FAD (as stick with carbon in gold) is positioned between them. The isoalloxazine ring is fixed by several van der Waals contacts and two hydrogen-bonds between FAD N3C2O and Gly153CONH and between FAD O4 and Gly138NH of Ldh. The entrance of lactate is marked by a grey arrow. (B) The active site. Lactate was tentatively modeled into a density (gray) in front of the N5 of d-FAD involving a metal site for its binding. Its hydroxy group appears to be activated by His423. We tentatively assigned the metal as Fe2+ (orange) due to its addition during purification.
-
Figure 6—source data 1
Sequence alignment of Ldh.
WP_032489501.1, p-cresol methylhydroxylase of Pseudomonas putida; P56216.1, vanillyl-alcohol oxidase of Penicillium simplicissimum; WP_142969782.1, membrane-bound D-lactate dehydrogenase of Cronobacter sakazakii; WP_000097403.1, Escherichia. coli; WP_042389759.1, Pseudescherichia vulneris; WP_012062089.1 (highlighted in yellow); bifurcating lactate dehydrogenase of Alkaliphilus metalliredigens; WP_125071830.1, Lactiplantibacillus garii; WP_020224474.1, Holdemania massiliensis; WP_013278754.1, Acetohalobium arabaticum; WP_196599230.1, Pectinatus frisingensis; WP_113919857.1, Alkalibaculum bacchi; WP_014355267.1, A. woodii; WP_013387436.1, Ilyobacter polytropus; WP_012103837.1, Clostridium kluyveri; WP_195514995.1, Paraclostridium bifermentans. The postulated acid catalyst His423 is marked in red, the residues ligating the metal ion in green and Glu39 and Glu137 in cyan.
- https://cdn.elifesciences.org/articles/77095/elife-77095-fig6-data1-v1.docx
Figure 7 with 1 supplement
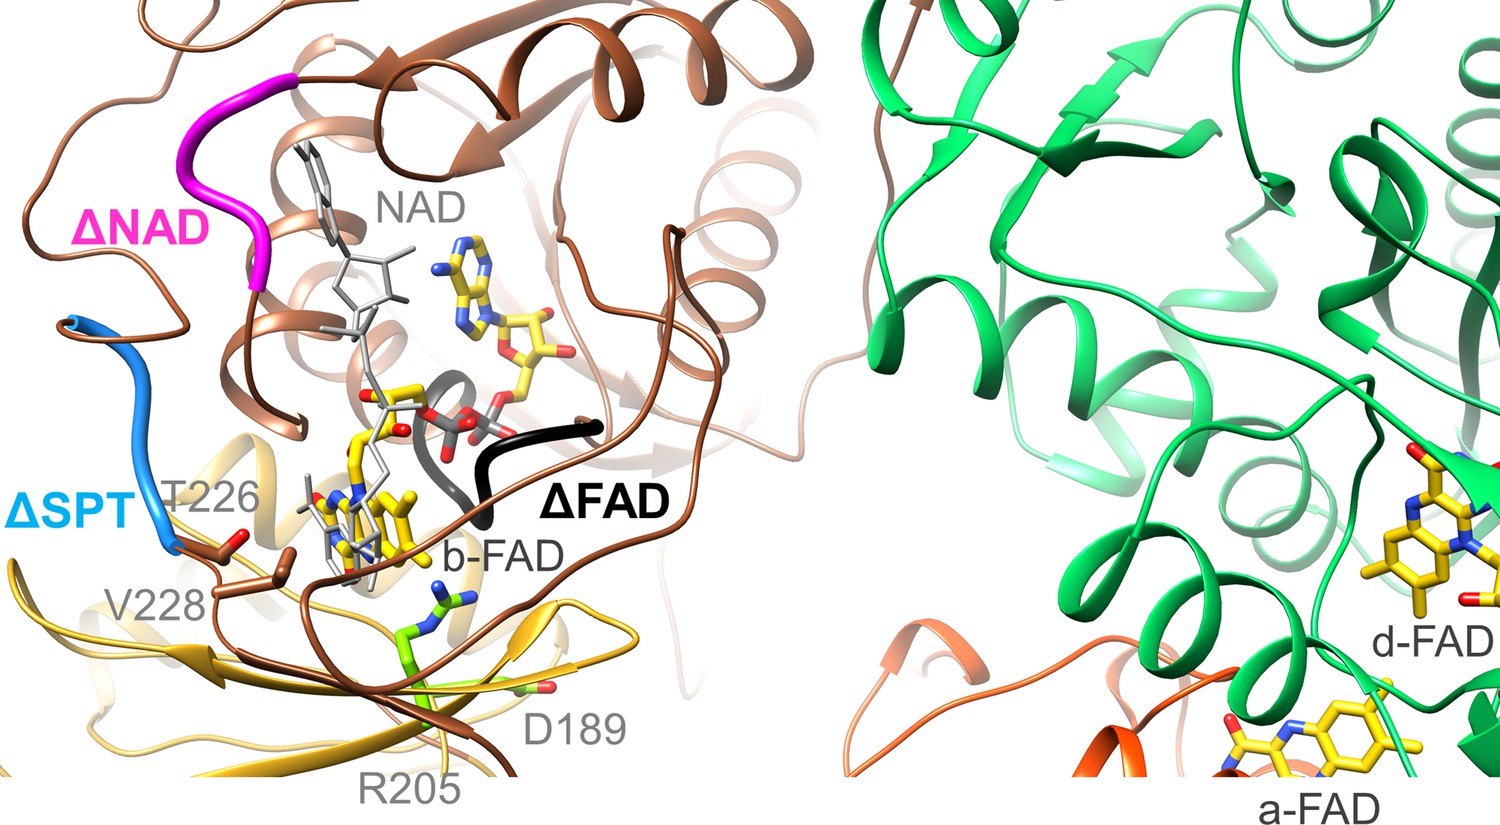
Location of the EtfA and EtfB mutations.
The highly conserved segments 122DGDTAQVGP130, 87RXFXG91 and 223SPT225 of the Δb-FAD, ΔNAD+ and ΔSPT variants are highlighted in blacks, magenta and blue. The positions of R205 and D189 are shown as ball-and-sticks. NAD+ was modeled as gray stick.
Figure 7—figure supplement 1
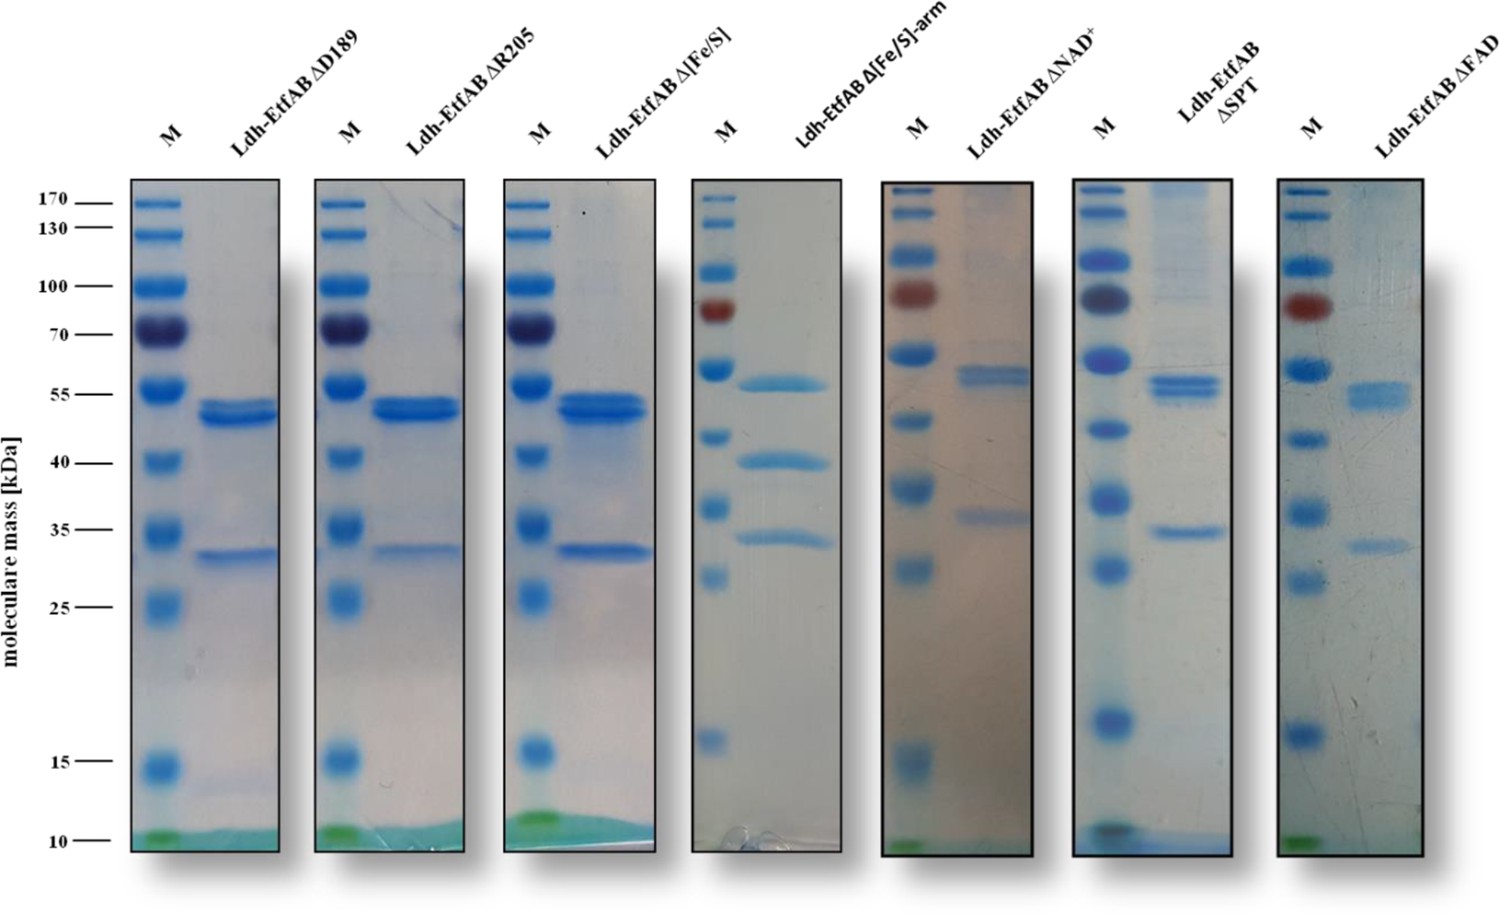
SDS-PAGE of the site-specifically changed Ldh-EtfAB variants. The Ldh-EtfAB variants were anaerobically purified by strep-tactin affinity and Superdex 200 size exclusion chromatography.
Five µg of the purified protein was separated by a 12% SDS-PAGE. Coomassie Brilliant Blue G250 was used for protein staining. M, Prestained PageRuler.
-
Figure 7—figure supplement 1—source data 1
SDS-PAGE gels for Figure 7—figure supplement 1.
- https://cdn.elifesciences.org/articles/77095/elife-77095-fig7-figsupp1-data1-v1.zip
Figure 8
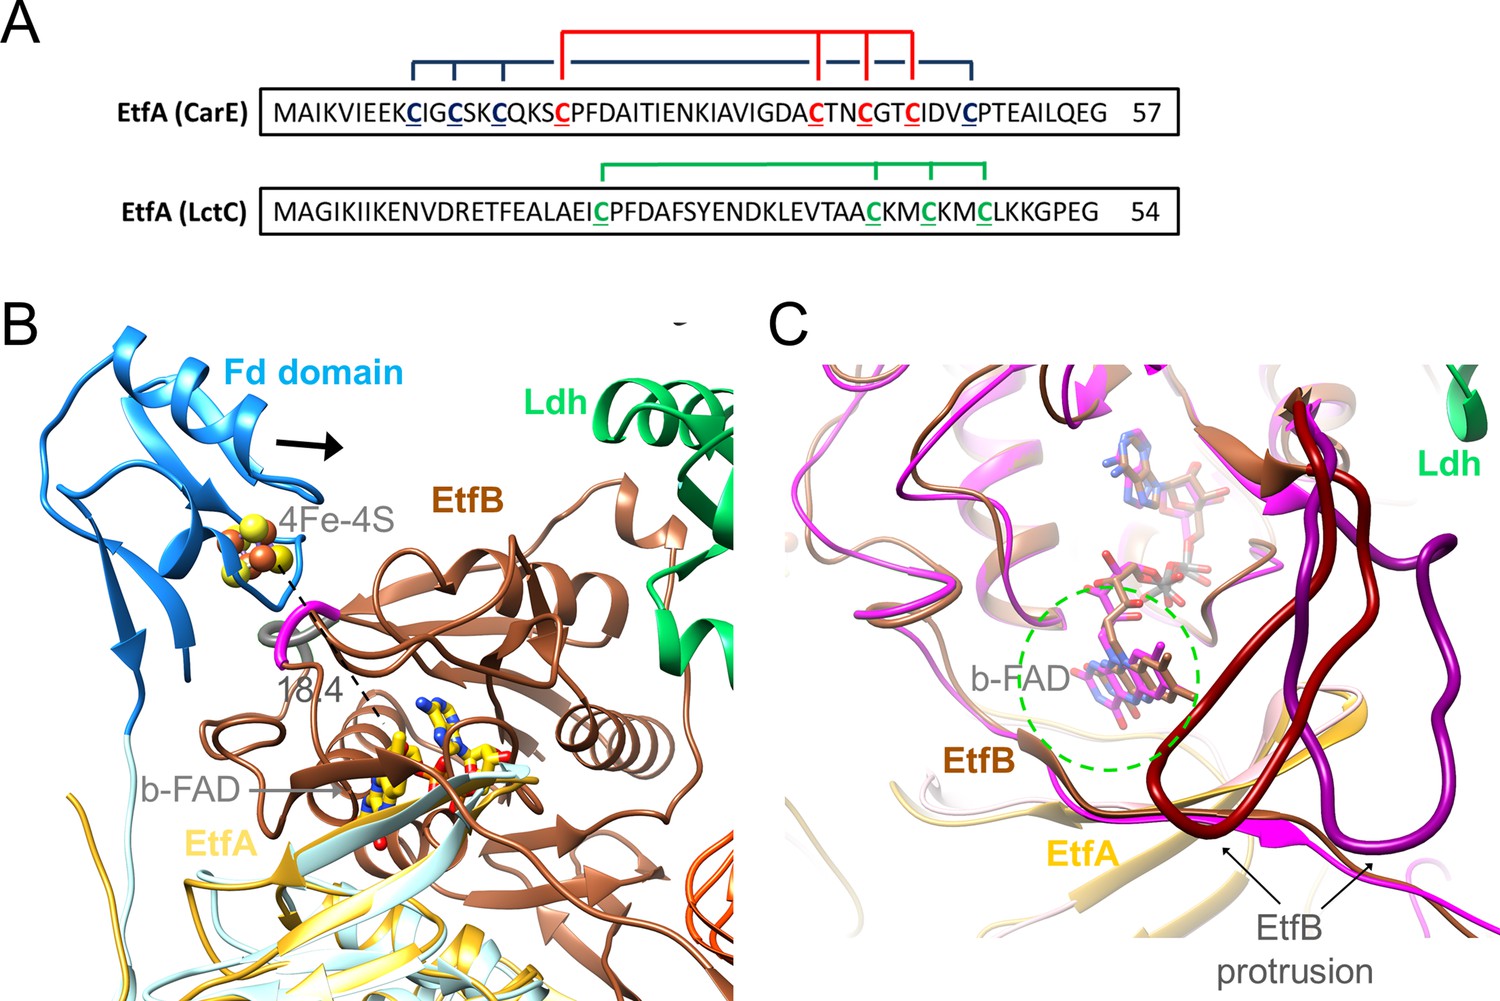
Ferredoxin (Fd) domain.
(A) The sequence of the N-terminal Fd domain of the CarCDE and the Ldh-EtfAB complexes. EtfA of the Ldh-EtfAB complex contains one [4Fe-4S] cluster ligated with four cysteines marked in green. In comparison, the equivalent CarE of the CarCDE complex possesses two [4Fe-4S] clusters marked in blue and red. The latter is shared between Ldh-EtfAB and CarCDE. (B) The cryo-EM structure of the Ldh-EtfAB complex (EtfA, lightorange; EtfB, brown; Ldh, green) superimposed with EtfA (lightblue) including the Fd domain (dodger blue) calculated by AlphaFold2. The Fd domain interacts with EtfB via the segment (gray) linking the anchor of the EtfB arm (225-232) and the terminal strand 203:207 of the central β-sheet and via the loop (magenta) following strand 81:85. The [4Fe-4S] cluster (in ball-and-stick) of the Fd domain was modeled based on the properly positioned four cysteine sulfurs. For productive ET the Fd domain moves toward EtfB (black arrow). (C) Accessibility of b-FAD. b-FAD is more shielded in Ldh-EtfAB (colors as in A) than in the superimposed CarCDE (hotpink) due to the reoriented EtfB protrusion such that an arriving external Fd might not find a docking site sufficiently close to b-FAD. The approximate diameter of Fd is drawn as dashed green circle.
Figure 9
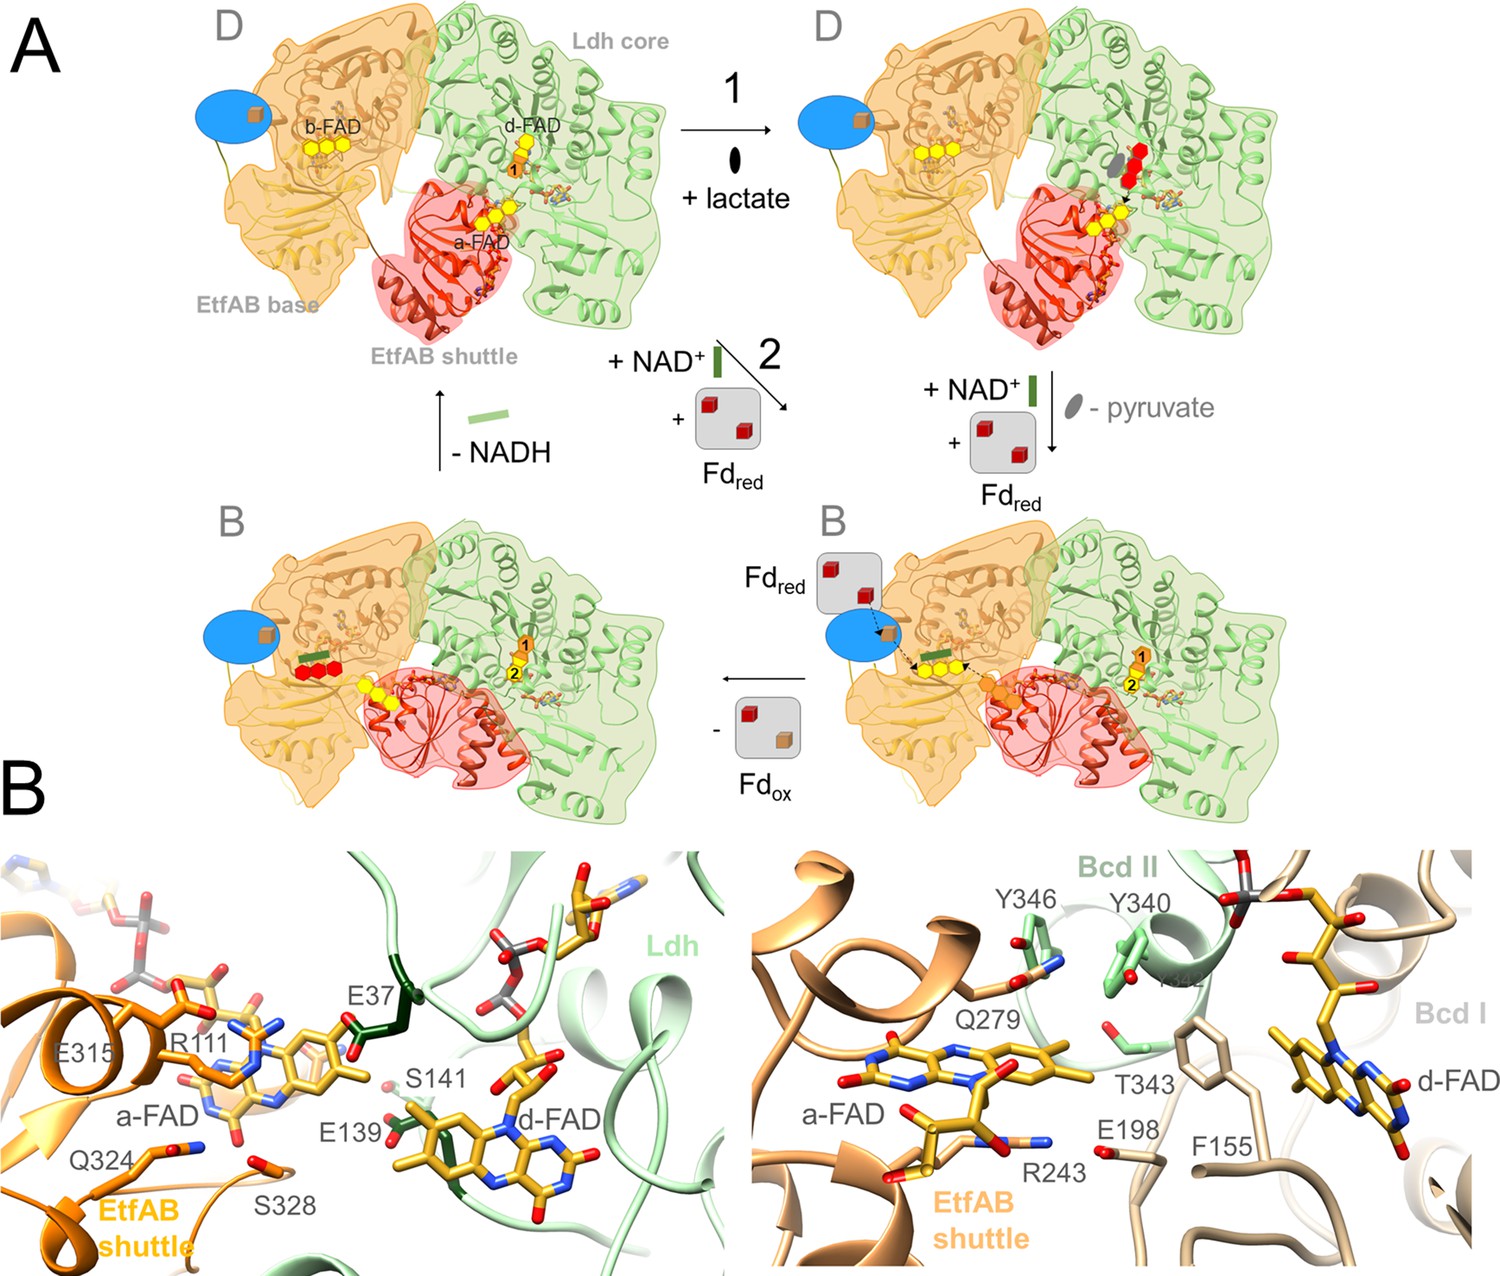
The Ldh-EtfAB reaction.
(A) The mechanism. The reaction cycle was outlined in the direction of the thermodynamically preferred confurcation direction. It starts from the structurally characterized D-state and runs through two rounds (termed 1+2). The three-membered rings of FAD, FAD•− / FADH• and FADH− are drawn in yellow, orange and red. The d-FAD isoalloxazine is shown with orange and yellow moieties representing in the 1. round FADH• (FAD•–) and in the 2. round FAD. The Fd domain is drawn as blue ellipse and the external Fd as grey box. Ldh-EtfAB is normally present in the resting, FBEC inactive D-state. A D- to B-state transition upon 75° rotation of the EtfAB shuttle domain and an induced-fit event upon Fd binding momentary build up the acitive site for firing two electrons from two directions to b-FAD (right-bottom panel). (B) Microenvironments of a-FAD and d-FAD in the D-state of Ldh-EtfAB (left panel) and Bcd-EtfAB (right panel). In Ldh-EtfAB the two isoalloxazine rings are closer and the protein surrounding is significantly different compared to Bcd-EtfAB/CarCDE. Glu37 and Glu139 (dark green) contacting a-FAD and d-FAD may destabilize an electron-rich reduced state resulting in a lower redox potential (Figure 1B).
Author response image 1
Tables
Table 1
Cryo-EM statistics.
| Experimental data | |
|---|---|
| Protein | Ldh-EtfAB complex |
| State | Resting D-state |
| Data collection and Processing | |
| Microscope | Thermo Scientific Titan Krios G3i |
| Voltage (kV) | 300 |
| Camera | Gatan K3 summit |
| Exposure time (s) | 6.52 |
| Total dose (e-/Å2) | 106.17 |
| Dose per frame (e-/Å2) | 1.01 |
| Defocus range (μm) | 1.2–2.1 |
| Pizel size (Å) (calibrated) | 0.837 |
| Magnification (nominal) | 105,000 x |
| Symmetry imposed | C2 |
| No. of micrographs | 9,788 |
| Initial particle number | 5,517,853 |
| Final particle number | 674,283 |
| Map resolution (Å) | 2.43 |
| FSC threshold | 0.143 |
| Refinement | |
| Map-sharpening B factor (Å2) | –67 |
| Model composition | |
| Chains | 6 |
| Protein (Residues) | 2,140 |
| Ligands | FAD: 6; FE: 2 |
| RMSD Bond Length (Å) | 0.005 |
| RMSD Bond Angles (°) | 1.17 |
| MolProbity score | 2.77 |
| Clash score | 4.39 |
| Ramachandran plot (%) | |
| Favored | 97.0 |
| Allowed | 2.9 |
| Outliers | 0.1 |
| Rotamer outliers (%) | 1.9 |
| ADP (B-factor) (min/max/mean) | |
| Protein | 55.1/151.3/90.6 |
| Ligand | 60.6/93.4/79.2 |
Table 2
Specific activities of recombinant Ldh-EtfAB and site-specifically changed variants with artificial electron donors/acceptors.
| WT | ∆Fe/S | ∆Fe/S-arm | D189A | R205A | ∆b-FAD | ∆NAD+ | ∆SPT | |
|---|---|---|---|---|---|---|---|---|
| Fdred:lactate: NAD+ (340 nm) | 12.3±2.3 | 0.1±0.05 | 0.1±0.06 | 7,7±2.6 | 0.01±0.01 | 0.9±0.3 | 0.2±0.1 | 1.1±0.3 |
| NADH:pyruvate:Fdox (340 nm) | 1.2±0.2 | 0.5±0.03 | 0.1±0.1 | 0.9±0.1 | 0.02±0.02 | 0.06±0.02 | 0.01±0.01 | 0.01±0.05 |
| lactate:K3[Fe(CN)6] (420 nm) | 19.0±5.2 | 13.9±5.4 | 14.6±4.8 | 11.1±6.7 | 15.8±4.3 | 8.3±9.2 | 8.5±7.3 | 8.7±6.5 |
| NADH:DCPIP (600 nm) | 8.8±2.5 | 7.3±0.2 | 9.7±1.5 | 5.6±2.5 | 6.3±2.3 | 0.4±0.2 | 0.2±0.1 | 9.2±0.4 |
-
NAD+, Fd, ferricyanide or DCPIP reduction was measured at 340, 430, 450 or 600 nm, respectively. Values are given as specific activities in U/mg protein.
Additional files
-
Supplementary file 1
I. Table of corresponding primers used.
II. Cloning of pET21a_lctBC-StrepD.
- https://cdn.elifesciences.org/articles/77095/elife-77095-supp1-v1.docx
-
Transparent reporting form
- https://cdn.elifesciences.org/articles/77095/elife-77095-transrepform1-v1.docx
-
Source data 1
SDS-PAGE, native PAGE and TLC plate or Figure 2.
- https://cdn.elifesciences.org/articles/77095/elife-77095-data1-v1.zip
Download links
A two-part list of links to download the article, or parts of the article, in various formats.
Downloads (link to download the article as PDF)
Open citations (links to open the citations from this article in various online reference manager services)
Cite this article (links to download the citations from this article in formats compatible with various reference manager tools)
Structure-based electron-confurcation mechanism of the Ldh-EtfAB complex
eLife 11:e77095.
https://doi.org/10.7554/eLife.77095


