Figures
Figure 1
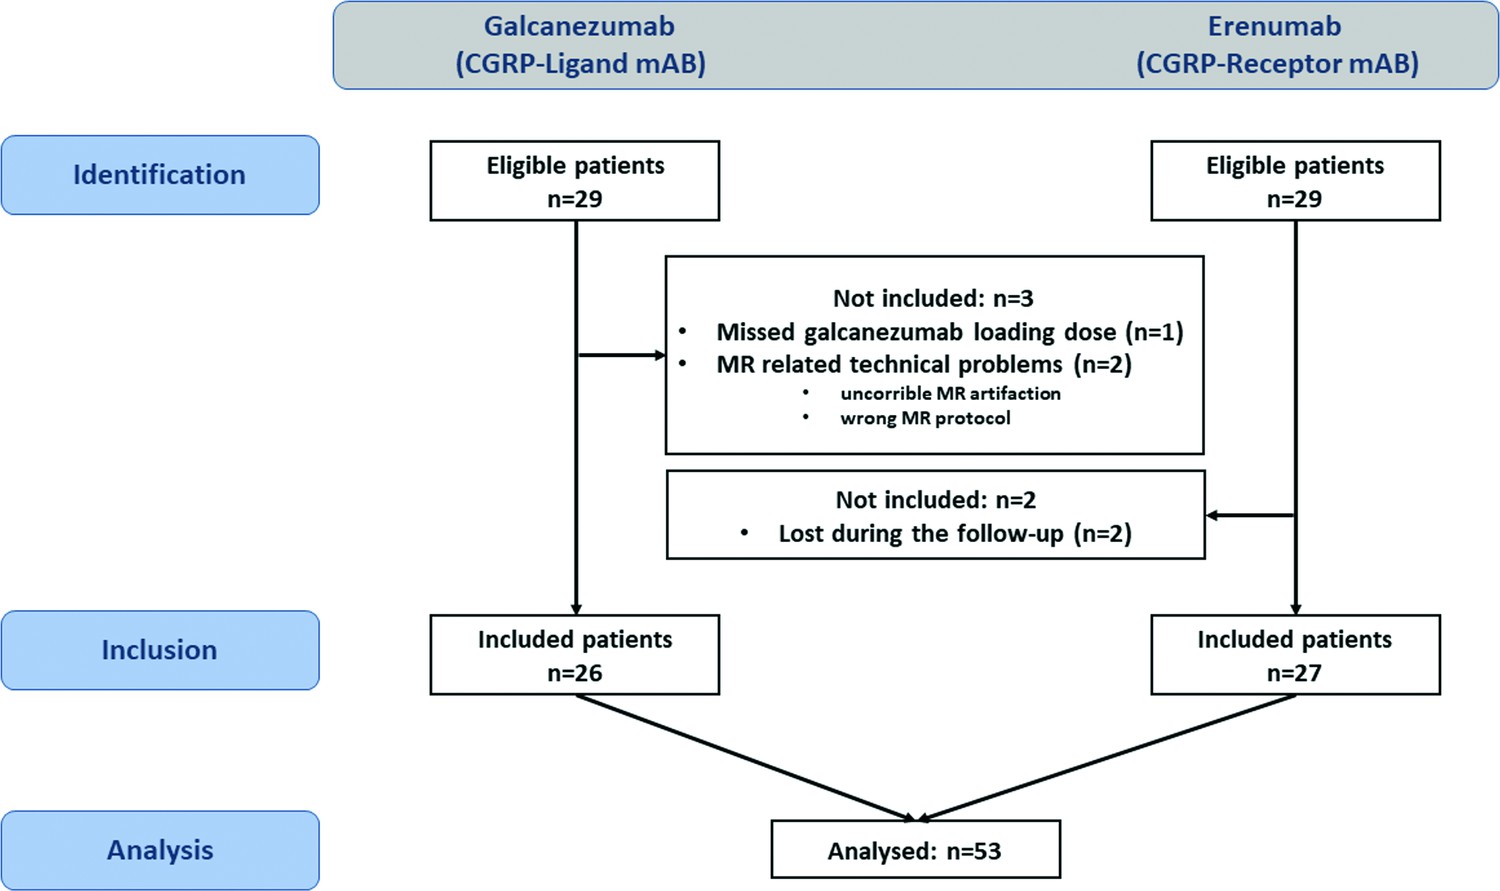
Study flowchart.
On the left side the galcanezumab cohort, on the right side the erenumab cohort.
Figure 2
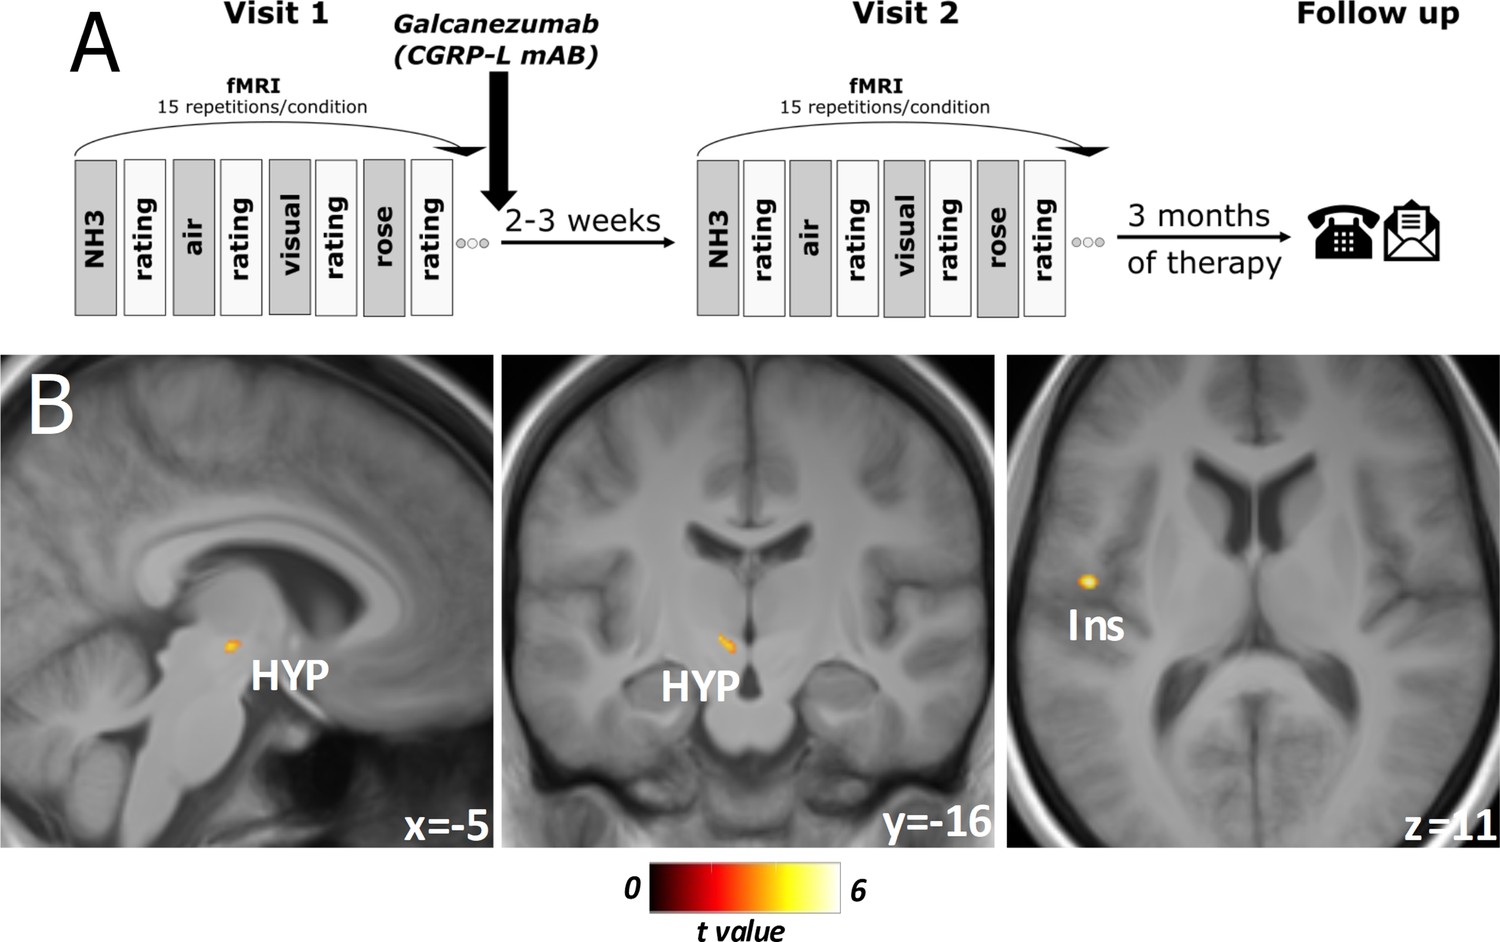
Experimental design and responder-specific main findings.
(A) Flowchart of the experimental design. At both visits, objective rating of pain intensity and unpleasantness on a numeric rating scale (NRS), session-specific questionnaire: current headache (yes/no), strength of headache (NRS), headache frequency (per week), date of last headache. Three months of total therapy duration, patients were contacted via phone and/or email to acquire their headache diaries. (B) Responder-specific decreased neuronal activity during nociception at visit 2 compared to visit 1 in subgroup analysis of migraine-phase matched patients (n=15). Data is shown at statistical threshold of p<0.001 and a minimum cluster size of 10 voxels, masked with gray and white matter study template where a higher t-value means a stronger decrease of activity after treatment for responders in comparison to non-responders.
Figure 3

Galcanezumab vs erenumab.
Erenumab (red)/galcanezumab (blue)-specific decreased neuronal activity during nociception at visit 2 compared to visit 1 in subgroup analysis of migraine-phase matched patients (n=15 vs. 17). Data is shown at statistical threshold of p<0.001 and a minimum cluster size of 10 voxels.
Figure 4
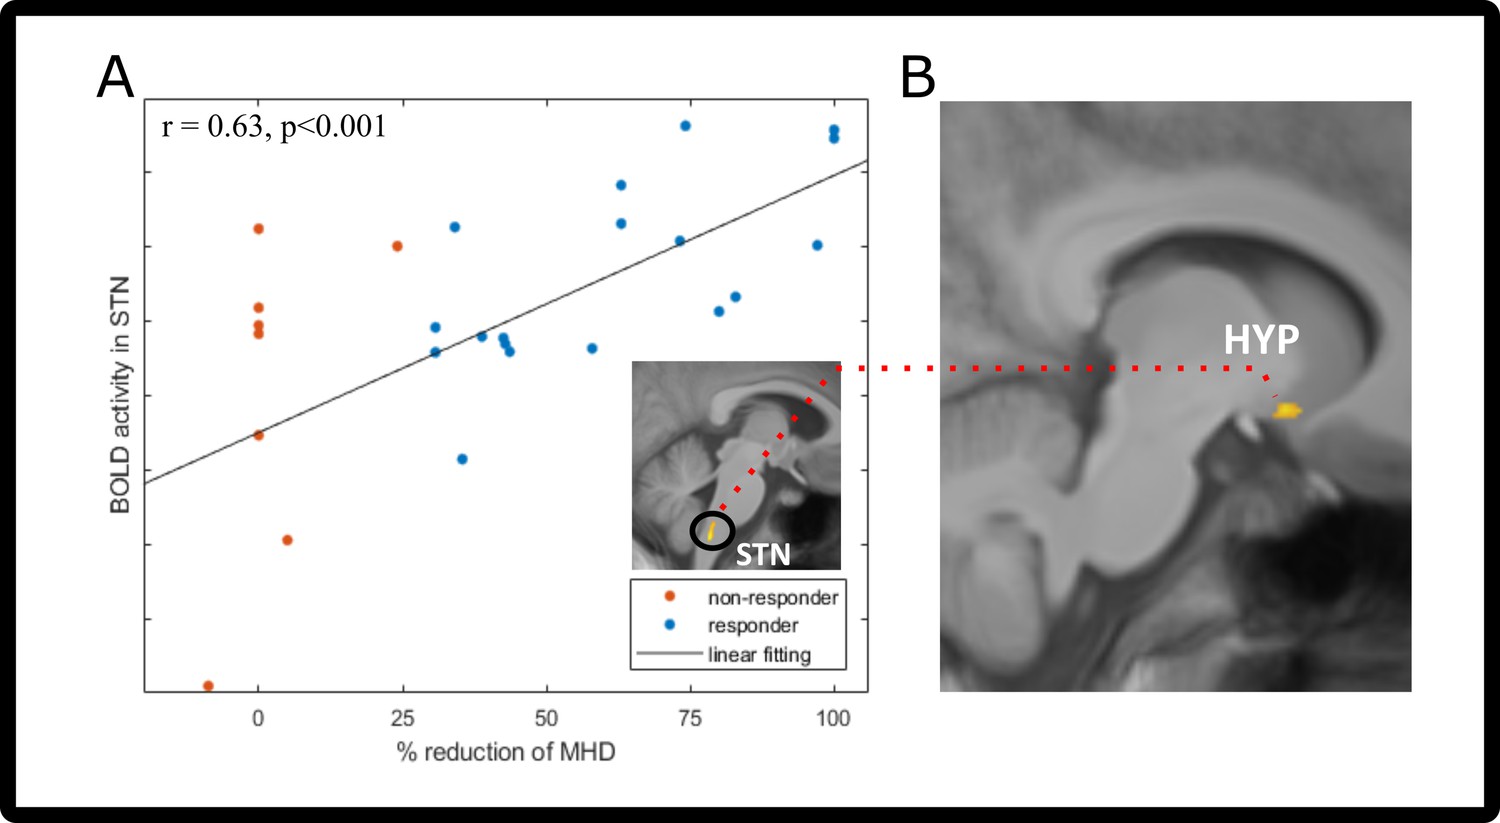
Prediction/functional connectivity changes after galcanezumab administration.
(A) Two-tailed Pearson’s correlation of visit 1 spinal trigeminal nucleus (STN) neuronal activity (before administration of galcanezumab) and response (in % change of MHD). Responder (>30% reduction) are marked in blue; non-responders (<30% reduction) are colored red. STN activation is shown in the image above the legend – visit 1 trigeminal-nociceptive activation (ammonia-air puffs) covaries with response (in percent reduction of monthly headache days [MHD]). Data is shown at statistical threshold of p<0.001 and a minimum cluster size of 10 voxels. (B) Results of the psychophysiological interaction (PPI) analysis, showing the decreased connectivity between STN (seed region [A]) and hypothalamus. Data is shown at statistical threshold of p<0.001.
Tables
Table 1
Patient characteristics.
| Patient characteristics | Galcanezumab | Erenumab |
|---|---|---|
| Number | 26 | 27 |
| Female, % (n) | 96 (25) | 81 (22) |
| Age, mean ± SD (range), in years | 37.81±12.11 (21–60) | 39.1±12.2 (22–60) |
| Disease duration, mean ± SD (range), in years | 19.77±12.43 (2–50) | 21.7±11.2 (6–43) |
| Headache frequency, mean ± SD (range), days/month EM: mean ± SD (range), days/month CM: mean ± SD (range), days/month | 16.71±8.92 (4–30) 10.28±2.94 (4–14) 25.48±6.32 (16–30) | 20.3±8.3 (8–30) 12.08±2.07 (8-14) 26.8±4.71(20–30) |
| Migraine with and without aura, n | 7 | 9 |
| Migraine without aura, n | 19 | 18 |
| Chronic migraine (ICHD-3), % (n) | 42 (11) | 56 (15) |
| Episodic migraine (ICHD-3), % (n) | 58 (15) | 44 (12) |
| Same headache state – episodic, % (n) | 40 (6) | 29 (5) |
| – chronic, % (n) | 60 (9) | 71 (12) |
-
Abbreviation: ICHD-3=International Classification of Headache Disorders, 3rd edition, EM: episodic migraine, CM: chronic migraine.
Table 2
Details of the statistical results of the functional magnetic resonance imaging (fMRI) analyses comparing before and after treatment as well as responders and non-responders.
| Anatomical region | Cluster size(voxels), n | T value | MNI coordinates(x,y,z) |
|---|---|---|---|
| (A) Visit 1>visit 2, all participants (n=26, contrast [ammonia-air puffs]visit1 > [ammonia-air puffs]visit2,threshold: p<0.001 [uncorrected], T>3.45, minimum cluster extent 25 voxels, df = 25) | |||
| R hypothalamus | 49 | 4.99 | 8, –14, –7 |
| R cerebellum | 48 | 5.0 | 20, –40, –25 |
| R cerebell. vermis | 52 | 4.09 | 3, –67, –34 |
| (B) Responder (n=8)>non-responder (n=7) with same headache state on both days (contrast [ammonia-air puffs]visit1 > [ammonia-air puffs]visit2, threshold p<0.001 [uncorrected], T>3.85, minimum cluster extent 10 voxels, df = 14) | |||
| R inf. parietal lobule | 91 | 9.17 | 58, –44, 21 |
| L precentral gyrus | 26 | 5.99 | −48, –11, 11 |
| L parahippocampal gyrus | 12 | 5.06 | −18, –11, –19 |
| L superior temporal gyrus | 13 | 4.76 | –36, 15,–26 |
| L inf. parietal lobule | 17 | 4.7 | 46, –42, 22 |
| R lentiform nucleus | 16 | 4.67 | 24, –2, 4 |
| R parahippocampal gyrus | 27 | 4.63 | 27, –28, –12 |
| L insula | 26 | 4.56 | −45, –27, 19 |
| L hypothalamus | 13 | 4.47 | −6, –17, –6 |
-
(A) Main findings of trigeminal pain processing alterations after administration of the CGRP-ligand monoclonal antibody galcanezumab. The contrast shows more neuronal activity on visit 1 than on visit 2, therefore decrease driven by galcanezumab and was tested with a one-way paired t-test. (B) Subgroup analysis of patients having the same migraine/headache state on both visits (ictal and ictal or interictal and interictal). Main findings specific for being responder (responder showing a higher decrease after galcanezumab than non-responder) tested with a one-way independent sample t-test. Note that left-right activation patterns in near proximity twin structures such as the hypothalamus are not necessarily side-locked (a left activation excludes a right activation) but may be due to statistical thresholding.
Table 3
Details of the statistical results of the functional magnetic resonance imaging (fMRI) analyses comparing calcitonin gene-related peptides (CGRP) receptor monoclonal antibody erenumab and CGRP ligand monoclonal antibody galcanezumab.
| Anatomical region | Cluster size(voxels), n | T value | MNI coordinates(x,y,z) |
|---|---|---|---|
| (A) Erenumab >Galcanezumab (Visit 1>visit 2, migraine-phase equal subgroup [n=15 vs. n=17], contrast [ammonia-air puffs]visit1 > [ammonia-air puffs]visit2,threshold: p<0.001 [uncorrected], T>3.39, minimum cluster extent 10 voxels, df = 30) | |||
| L operculum | 416 | 5.61 | −60, –5, 8 |
| L cerebellum | 122 | 5.59 | −16, –65, –22 |
| R cerebellum | 207 | 5.23 | 42, –51, –32 |
| R supramarginal gyrus | 37 | 5.11 | 64, –45, 23 |
| R thalamus | 67 | 5.0 | 6, –15, 11 |
| R hippocampus | 74 | 4.88 | 21, –32, –10 |
| L thalamus | 53 | 4.71 | −9, –7, 11 |
| L temporal pole/insula | 202 | 4.5 | –54, 17, –1 |
| L superior temporal gyrus | 55 | 4.42 | −55, –33, 16 |
| Locus coeruleus | 30 | 4.41 | 4, –37, –9 |
| R insula | 82 | 4.37 | 47, 14, –7 |
| R operculum | 19 | 4.15 | 62, –2, 7 |
| R middle temporal gyrus | 21 | 4.07 | 55, –6, –22 |
| R lingual gyrus | 11 | 3.9 | 16, –49, 0 |
| (B) Galcanezumab >Erenumab (Visit 1>visit 2, migraine-phase equal subgroup [n=15 vs. n=17], contrast [ammonia-air puffs]visit1 > [ammonia-air puffs]visit2,threshold: p<0.001 [uncorrected], T>3.39, minimum cluster extent 10 voxels, df = 30) | |||
| Pons | 40 | 4.09 | −1, –18, –38 |
| R substantia nigra | 13 | 4.01 | 9, –14, –10 |
| L thalamus | 13 | 3.93 | −18, –15, 0 |
| R hypothalamus | 12 | 3.89 | 4, –19, 0 |
-
Main findings of trigeminal pain processing alterations driven by the administration of the CGRP receptor monoclonal antibody erenumab in contrast to the CGRP ligand monoclonal antibody galcanezumab in the migraine-phase equal subgroup. (A) Erenumab-specific decrease in neuronal activity/BOLD across the two visits. (B) Galcanezumab-specific decrease in neuronal activity/BOLD across the two visits. Both results stem from one-sided independent t-tests.
Table 4
Statistical results of the functional magnetic resonance imaging (fMRI) analyses regarding the coherence with the reduction of headache days after treatment and changes in functional connectivity.
| Anatomical region | Cluster size(voxels), n | T value | MNI coordinates(x,y,z) |
|---|---|---|---|
| (A) Covariation of monthly headache day reduction (in % reduction) in the contrast (ammonia-air puffs) visit1, all participants (n=26) threshold: p<0.001 [uncorrected], T>3.48, minimum cluster extent 25 voxels, df = 25 | |||
| R middle temporal gyrus | 110 | 4.9 | 49, –8, –14 |
| STN | 83 | 4.65 | 4, –42, –53 |
| (B) PPI analysis of STN (region of interest 4, −42,–53), all participants (n=26) in the contrast (ammonia-air puffs) visit1> [ammonia-air puffs]visit2, threshold: p<0.001 [uncorrected], T>3.45, minimum cluster extent 25 voxels, df = 25 | |||
| L superior temporal gyrus | 62 | 5.57 | −52, –47, 18 |
| R hyopthalamus | 52 | 4.24 | 10, 5, –12 |
-
(A) Main findings of the covariation of the response to galcanezumab by the activation pattern of neuronal activity at visit 1 (before administration of galcanezumab). This result was gained by introducing the covariate of reduction in headache days into a one-sided, one-sample t-test. (B) Results from the psychophysiological interaction analysis of the above-mentioned STN activation.
Additional files
-
Transparent reporting form
- https://cdn.elifesciences.org/articles/77146/elife-77146-transrepform1-v1.docx
-
Reporting standard 1
STROBE Checklist.
- https://cdn.elifesciences.org/articles/77146/elife-77146-repstand1-v1.pdf
Download links
A two-part list of links to download the article, or parts of the article, in various formats.
Downloads (link to download the article as PDF)
Open citations (links to open the citations from this article in various online reference manager services)
Cite this article (links to download the citations from this article in formats compatible with various reference manager tools)
Migraine monoclonal antibodies against CGRP change brain activity depending on ligand or receptor target – an fMRI study
eLife 11:e77146.
https://doi.org/10.7554/eLife.77146


