A viral toolbox for conditional and transneuronal gene expression in zebrafish
- Friedrich Miescher Institute for Biomedical Research, Switzerland
- Gene Delivery Technology Core, Massachusetts General Hospital, United States
- Department of Molecular and Cellular Physiology, Institute of Medicine, Academic Assembly, Shinshu University, Japan
- National Institutes of Natural Sciences, Exploratory Research Center on Life and Living Systems, National Institute for Basic Biology, Japan
- Graduate University for Advanced Studies, Japan
- Faculty of Natural Sciences, University of Basel, Switzerland
Figures
Figure 1 with 9 supplements
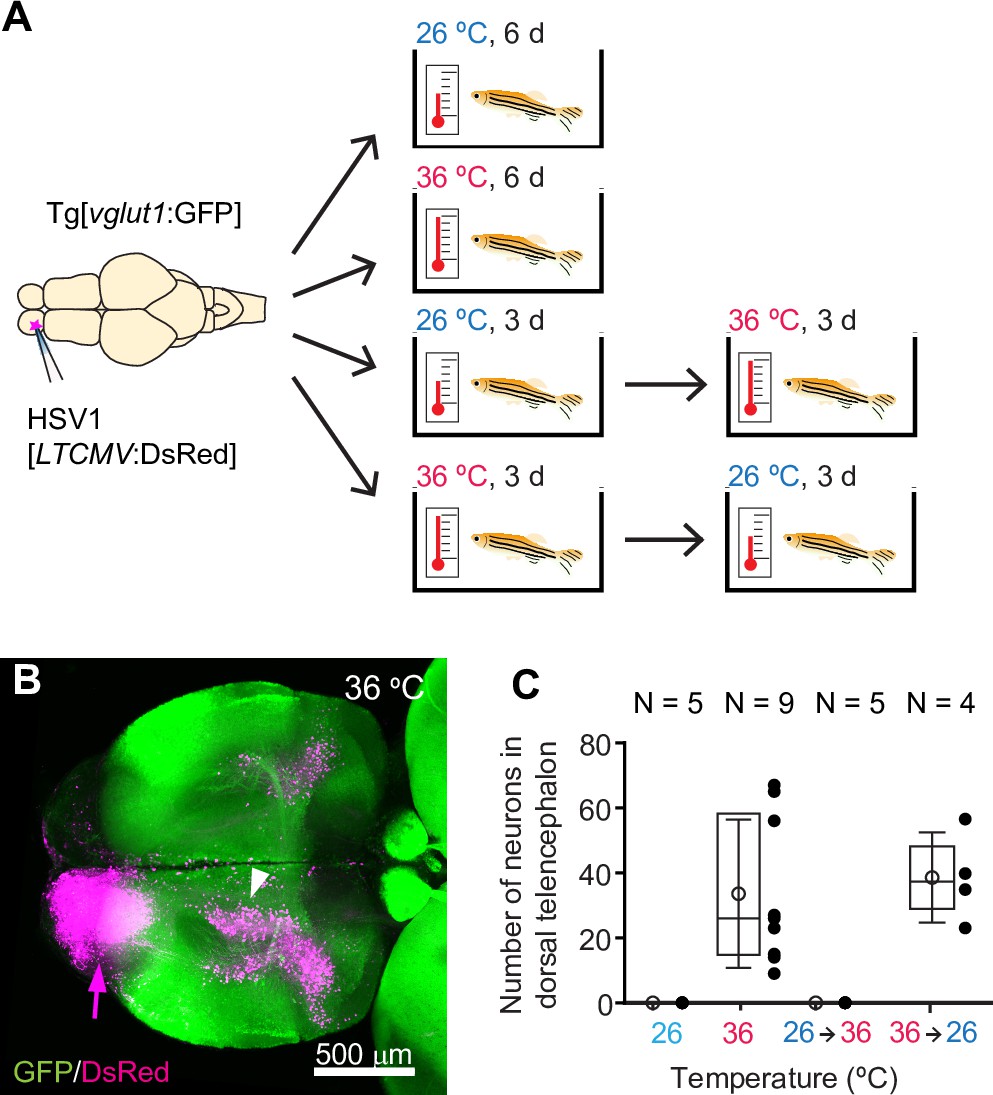
HSV1-mediated gene delivery in adult zebrafish.
(A) Procedure to test temperature-dependence of HSV1-mediated gene expression. (B) Maximum intensity projection after injection of HSV1[LTCMV:DsRed] into one OB (arrow) of a Tg[vglut1:GFP] fish and incubation at 36 °C. White arrowhead indicates the OB-projecting area in the dorsal telencephalon used for quantification in (C) and Figure 2F. vglut1:GFP expression served as a morphological marker. (C) Mean number of labeled neurons in the dorsal telencephalon after injection of HSV1[LTCMV:DsRed] into the ipsilateral olfactory bulb and incubation at different temperatures. In this and similar plots, black dots represent data from individual fish, box plot indicates median and 25th and 75th percentiles, circles and error bars indicate mean and s.d., respectively, over individual fish. N: number of fish.
Figure 1—figure supplement 1
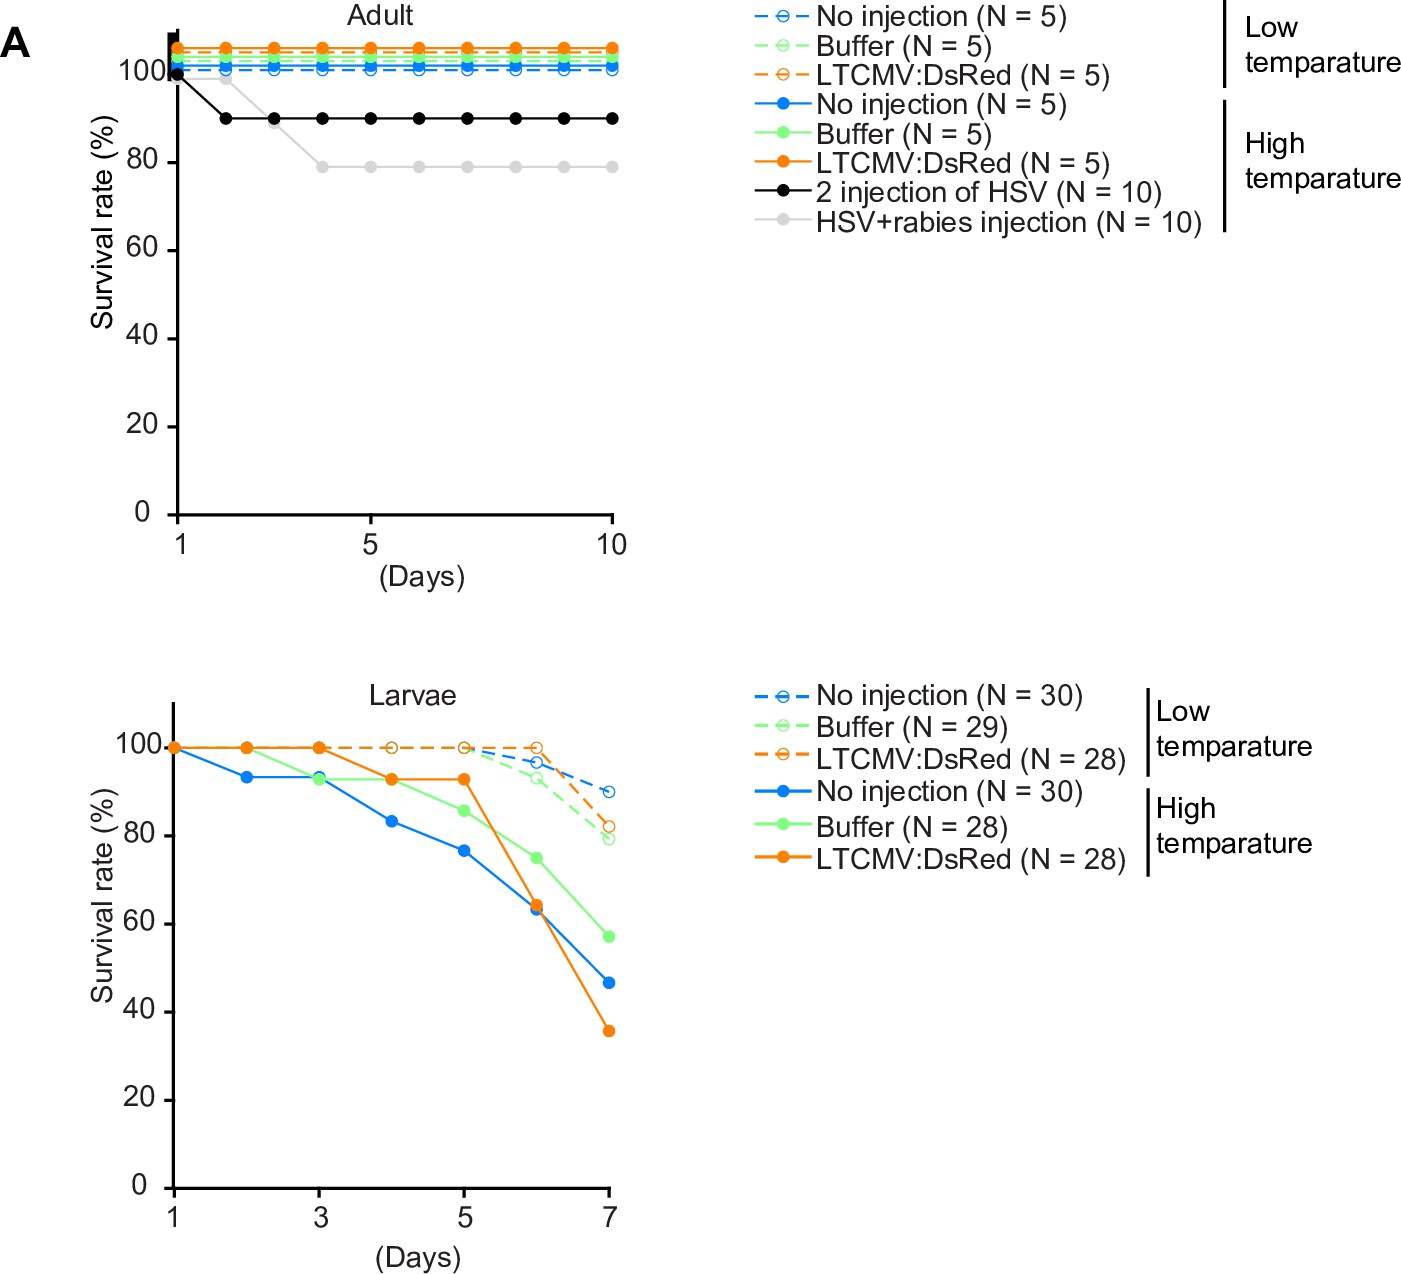
Effects of temperature and injections on survival.
(A) Survival rates of fish as a function of time after different treatments. The number of fish in each treatment group is given in the legend. Larvae were injected at 5 dpf.
Figure 1—figure supplement 2
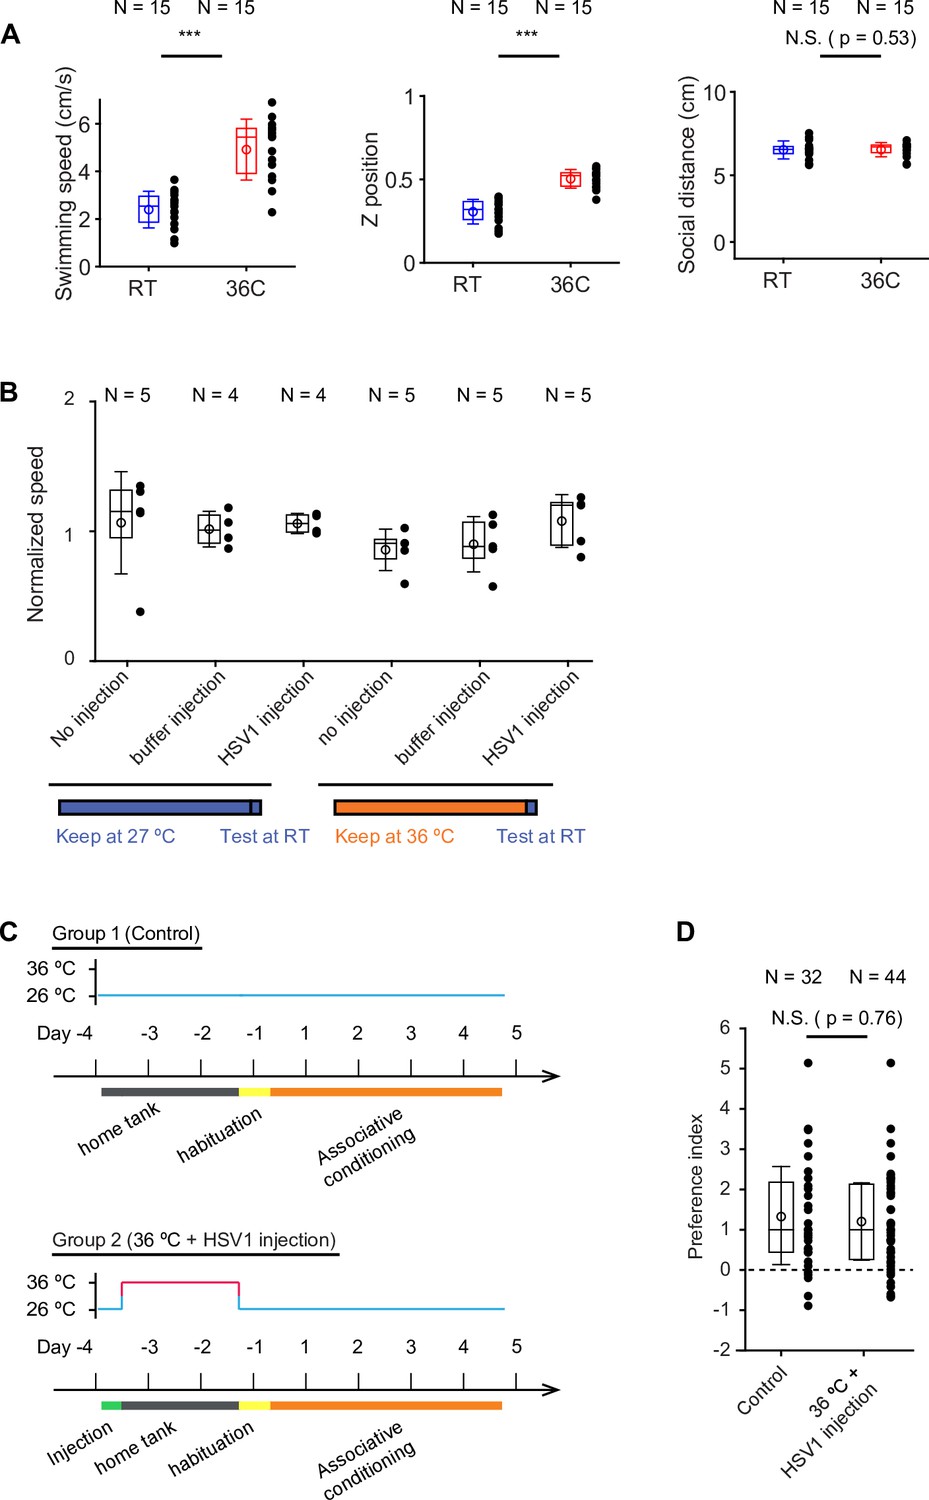
Effects of temperature and injections on behavior.
(A) Comparison of swimming speed, vertical position in the water column (Z position), and social distance in groups of five fish at room temperature (RT; 25 – 26 °C) and at 36 °C. Fish were kept at the indicated temperature for 15 min. Each datapoint represents the mean value during a one-minute time window (10 time windows in total). Box plots show median and 25th and 75th percentiles, circles and error bars indicate mean and s.d. over time windows. Swimming trajectories were analyzed in two dimensions using DeepLabCut. Z position is normalized to the distance between the bottom of the tank (0) and the water surface (1). Social distance is the mean distance between all pairs of fish in the group. (Swimming speed: p<0.001, Z position: p<0.001, p=0.53, Wilcoxon rank sum test). (B) Swimming speed of adult fish kept individually in 1 L tanks measured at 27 °C. Fish were either kept at 27 °C or at 36 °C for 7 days prior to measurements and received different treatments (no injection, buffer injection, or HSV1 injection). Plot symbols represent data from individual fish; box plots show median and 25th and 75th percentiles, circles and error bars indicate mean and s.d. over individual fish. N: number of fish. No significant differences were observed (p>0.54; ANOVA test). (C) Sequence of virus injections, temperature changes and associative conditioning to assess effects of experimental manipulations on discrimination learning. (D) Learning index (behavioral discrimination score) on the last day of training. Plot symbols represent data from individual fish; box plots show median and 25th and 75th percentiles, circles and error bars indicate mean and s.d. over individual fish. N: number of fish. Control fish (group 1) were not injected and kept at standard laboratory temperature. The experimental group (group 2) was injected with HSV1[LTCMV:jGCaMP7b], an amplicon type of HSV1 with an insert encoding the calcium indicator GCamp7b (Dana et al., 2019) under the control of a non-specific promoter for long-term expression (LTCMV), and subsequently kept at 36 °C for 2 days before training (A). Performance was not significantly different between groups (p=0.76, Wilcoxon rank sum test).
Figure 1—figure supplement 3
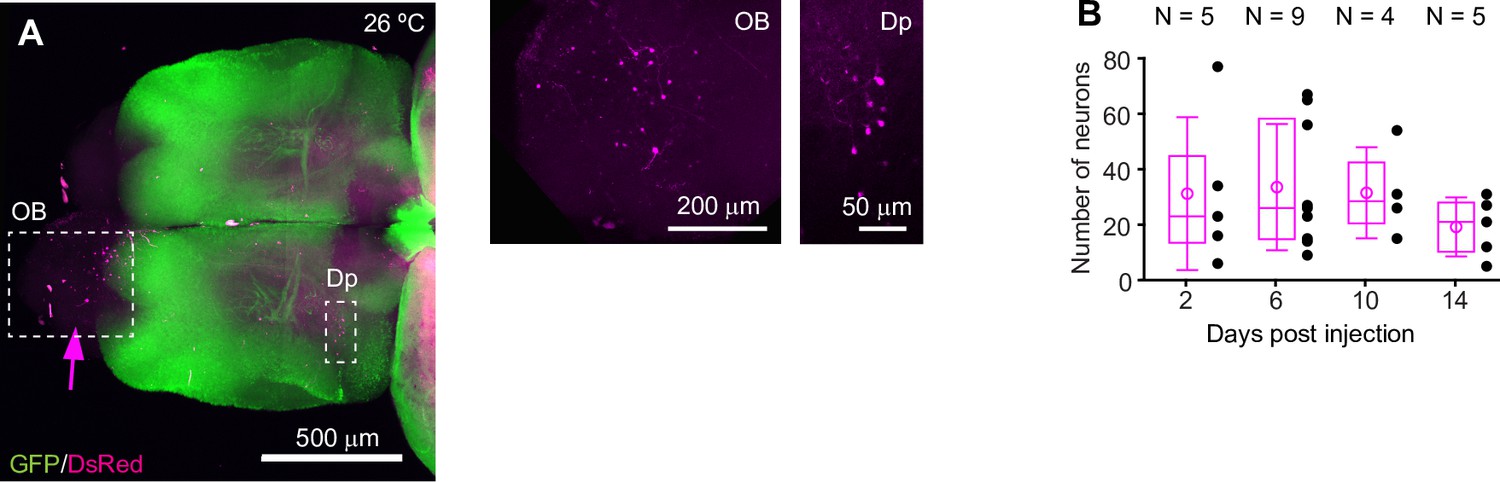
HSV1-mediated gene expression.
(A) Expression of DsRed (magenta) 6 days after injection of HSV1[LTCMV:DsRed] into the OB (arrow) of an adult Tg[vglut1:GFP] fish kept at 26 °C (maximum projection of confocal stack). Boxed areas (OB and Dp) are enlarged below. The number of DsRed-expressing neurons is low compared to DsRed expression at 36 °C (Figure 1). (B) DsRed expression in the dorsal telencephalon at different timepoints after injection of HSV1[LTCMV:DsRed] into the ipsilateral OB. Fish were kept at 36 °C. Black dots represent data from individual fish, box plot indicates median and 25th and 75th percentiles, circles and error bars indicate mean and s.d. over individual fish. N: number of fish.
Figure 1—figure supplement 4
HSV1-mediated gene delivery in larvae zebrafish and Gal4/UAS.
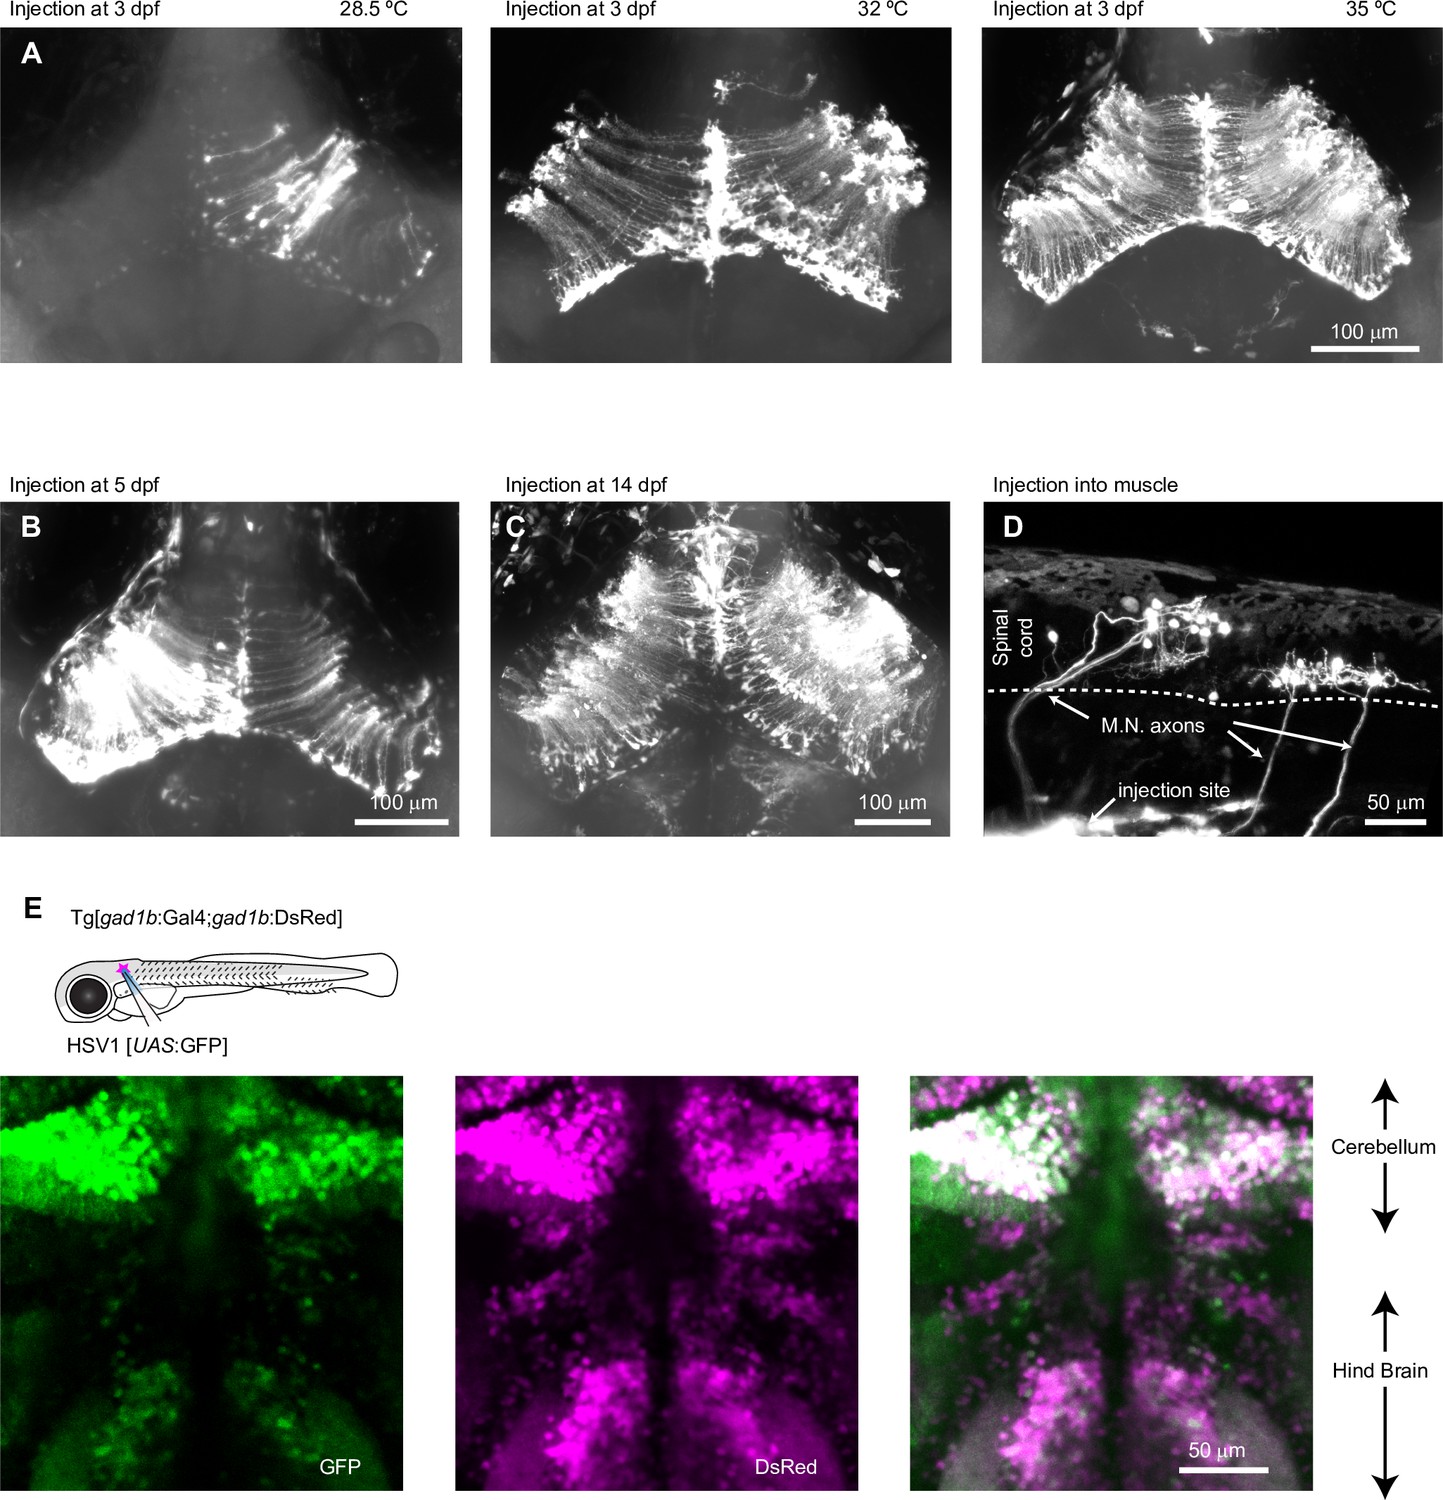
(A) Expression of GFP 48 hr after injection of HSV1[LTCMV:GFP] into the optic tectum of zebrafish larvae (3 dpf; maximum intensity projection of confocal stack). Larvae were kept after the injection at 28.5, 32, or 35 °C. (B) Expression of GFP 48 hr after injection of HSV1[LTCMV:GFP] into the optic tectum of a larva at 5 dpf (maximum intensity projection of confocal stack). The larva was kept after the injection at 35 °C. (C) Expression of GFP 48 hr after injection of HSV1[LTCMV:GFP] into the optic tectum of a larva at 14 dpf (maximum intensity projection of confocal stack). The larva was kept after the injection at 35 °C. (D) Expression of GFP 48 hr after injection of HSV1[LTCMV:GFP] into trunk muscles at 7 dpf (maximum intensity projection of confocal stack). The larva was kept after the injection at 35 °C. Note retrograde labeling of motor neurons (M.N.). (E) Expression of GFP 48 hr after injection of HSV1[UAS:GFP] into the hindbrain of a Tg[gad1b:Gal4; gad1b:DsRed] larva at 7 dpf (maximum intensity projection of confocal stack). The larva was kept after the injection at 35 °C. Note co-localization of DsRed and GFP in hindbrain and cerebellum.
Figure 1—video 1
Swimming behavior of adult zebrafish injected with HSV1[LTCMV:DsRed] into the OB at 27 °C.
Fish were kept at 27 °C for 10 days after the injection.
Figure 1—video 2
Tracking of nose key points during swimming behavior of adult zebrafish at room temperature (RT).
Figure 1—video 3
Swimming behavior of adult zebrafish injected with HSV1[LTCMV:DsRed] into the OB at 37 °C.
Fish were kept at 37 °C for 10 days after the injection.
Figure 1—video 4
Tracking of nose key points during swimming behavior of adult zebrafish at 36 °C.
Figure 1—video 5
Swimming behavior of zebrafish larvae injected with HSV1[LTCMV:GFP] into the optic tectum at 35 °C.
Fish were injected at 7 dpf and kept for 2 days at 35 °C.
Figure 2 with 7 supplements
Conditional HSV1-mediated gene expression using the Gal4/UAS system.
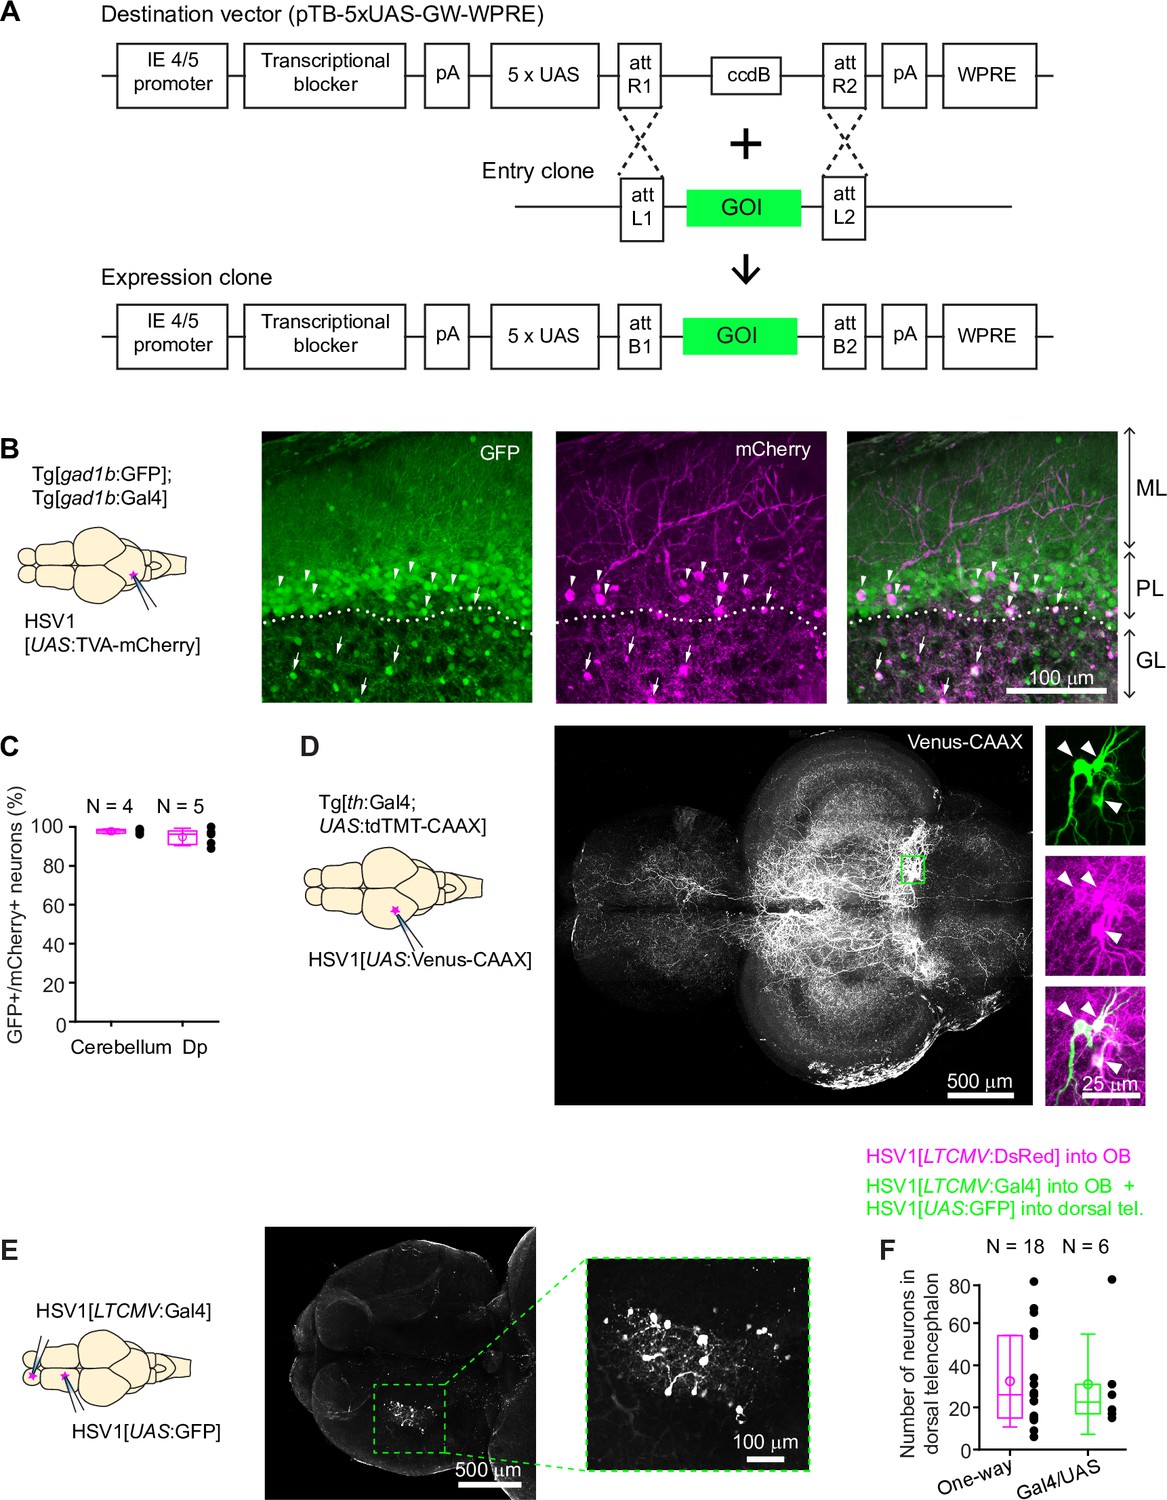
(A) Construction of the UAS vector for HSV packaging. Genes of interest (GOI) are inserted downstream of the 5xUAS sequences by recombination cloning using the Gateway system. The transcriptional blocker minimizes leaky expression (Eggermont and Proudfoot, 1993). (B) Injection of HSV1[UAS:TVA-mCherry] into the cerebellum of Tg[gad1b:Gal4; gad1b:GFP] double transgenic fish. Note co-localization of mCherry and GFP in Purkinje cells (arrowheads) and putative Golgi cells (arrows). ML: molecular layer; PL: Purkinje layer; GL: granular layer. (C) Fraction of mCherry-positive neurons that co-expressed GFP after injection of HSV1[UAS:TVA-mCherry] into the cerebellum or Dp of Tg[gad1b:Gal4; gad1b:GFP] double transgenic fish. N: number of fish. (D) Injection of HSV1[UAS:Venus-CAAX] into the optic tectum of Tg[th:Gal4; UAS:tdTomato-CAAX] fish. Venus-CAAX was expressed by a small number of neurons with somata in the locus coeruleus and extensive projections to the optic tectum and other brain areas. Images on the right are close-ups of the boxed region showing co-expression of Venus-CAAX (green) with tdTomato (red) in the locus coeruleus. (E) Injection of HSV1[LTCMV:Gal4] into the OB and HSV1[UAS:GFP] into the dorsal telencephalon of wildtype fish. Note selective expression of GFP in OB-projecting neurons. The region containing GFP-expressing neurons is indicated by the dashed outline and enlarged on the right. (F) Number of neurons labeled in the dorsal telencephalon by a single injection of HSV1[LTCMV:DsRed] into the OB (‘One way’) or by two injections using the two-component Gal4/UAS system (‘Gal4/UAS’). N: number of fish.
-
Figure 2—source data 1
List of HSV1 available.
Please note that not all HSV1s have been tested by injections (see comments column). Requests for HSV1 and the destination vector shown in Figure 2A should be addressed to R.L.N.
- https://cdn.elifesciences.org/articles/77153/elife-77153-fig2-data1-v1.xlsx
Figure 2—figure supplement 1
Targeting of GABAergic neurons in the telencephalon.
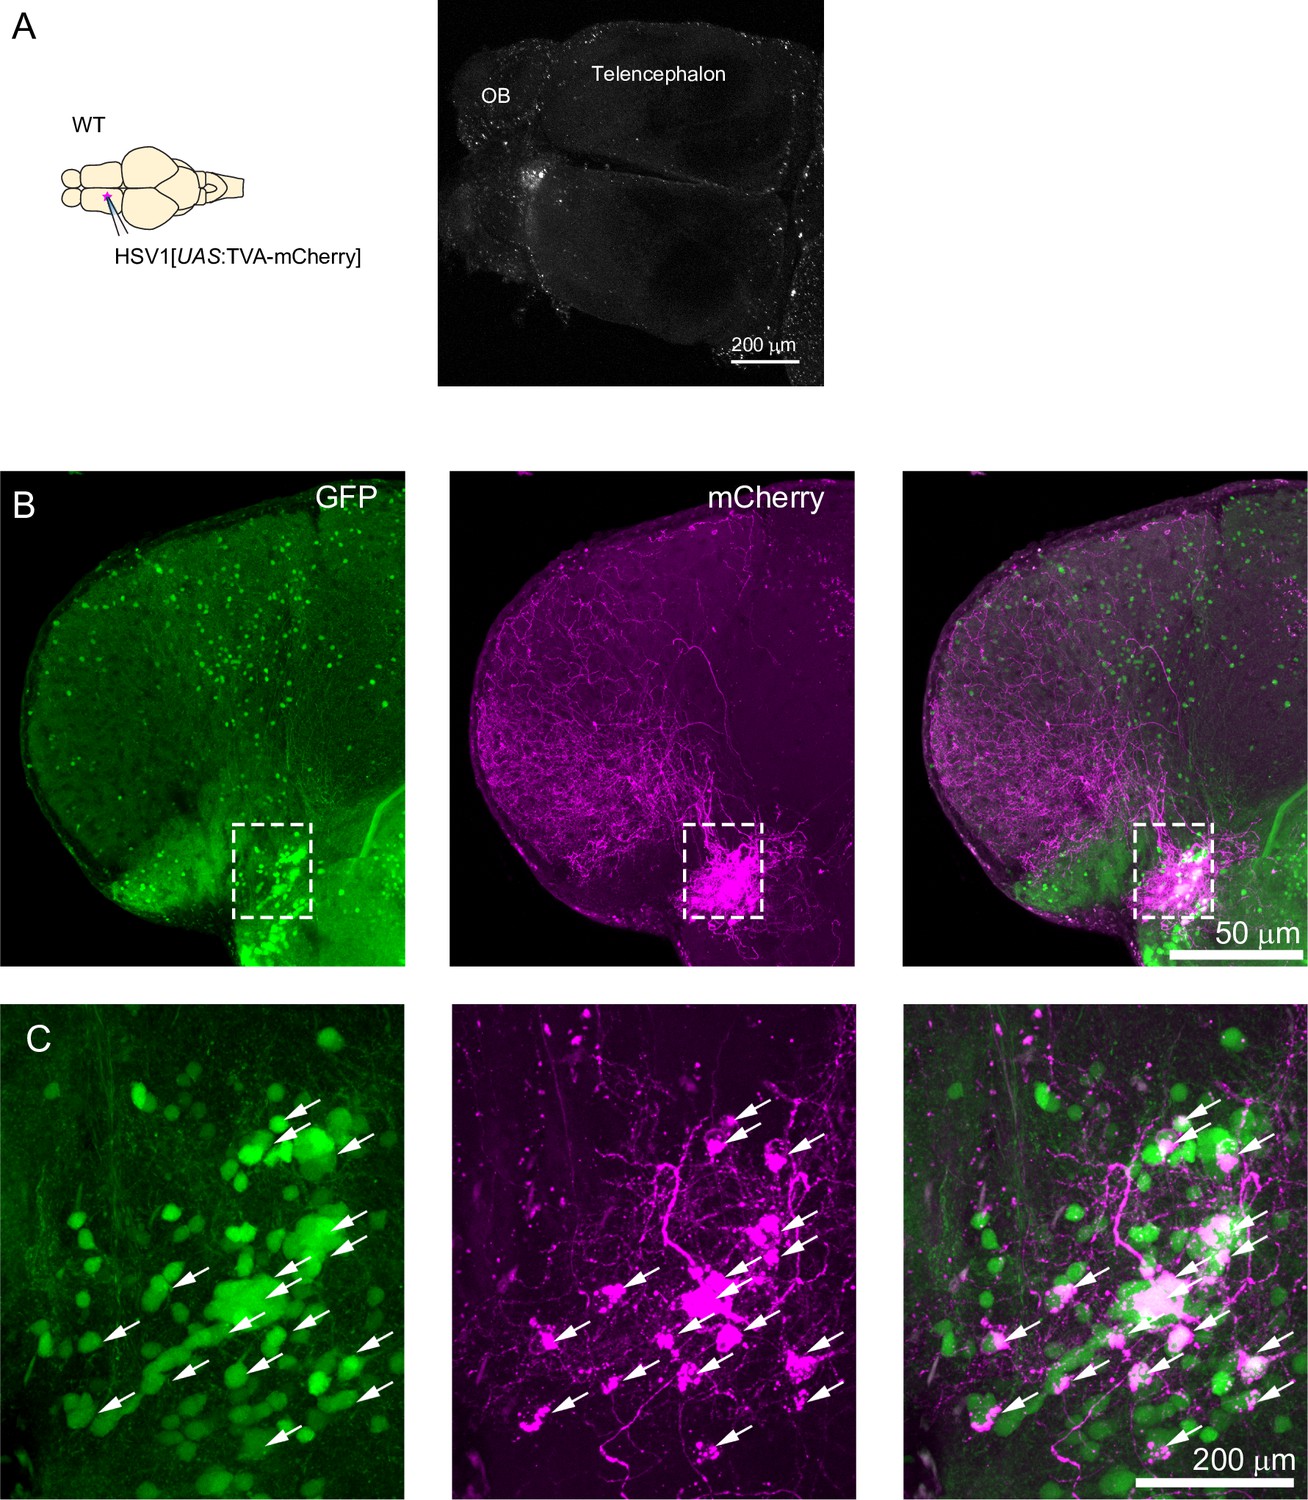
(A) Injection of HSV1[UAS:TVA-mCherry] into the telencephalon of adult wildtype fish. No expression of TVA-mCherry was detectable (granular particles are autofluorescent endogenous objects). (B) Coronal section through the telencephalon at the level of Dp after injection of HSV1[UAS:TVA-mCherry] into Tg[gad1b:Gal4; gad1b:GFP] double transgenic fish. The injection was targeted to a volume around Dp. mCherry was expressed predominantly in a cluster of GFP-positive neurons associated with Dp. Note long-range projections of mCherry-expressing neurons to multiple telencephalic areas. (C) Enlargements of boxed region in (a). Arrowheads indicate GFP+/mCherry +neurons.
Figure 2—figure supplement 2
Co-packaging of two different viruses does not facilitate co-infection of two viruses.
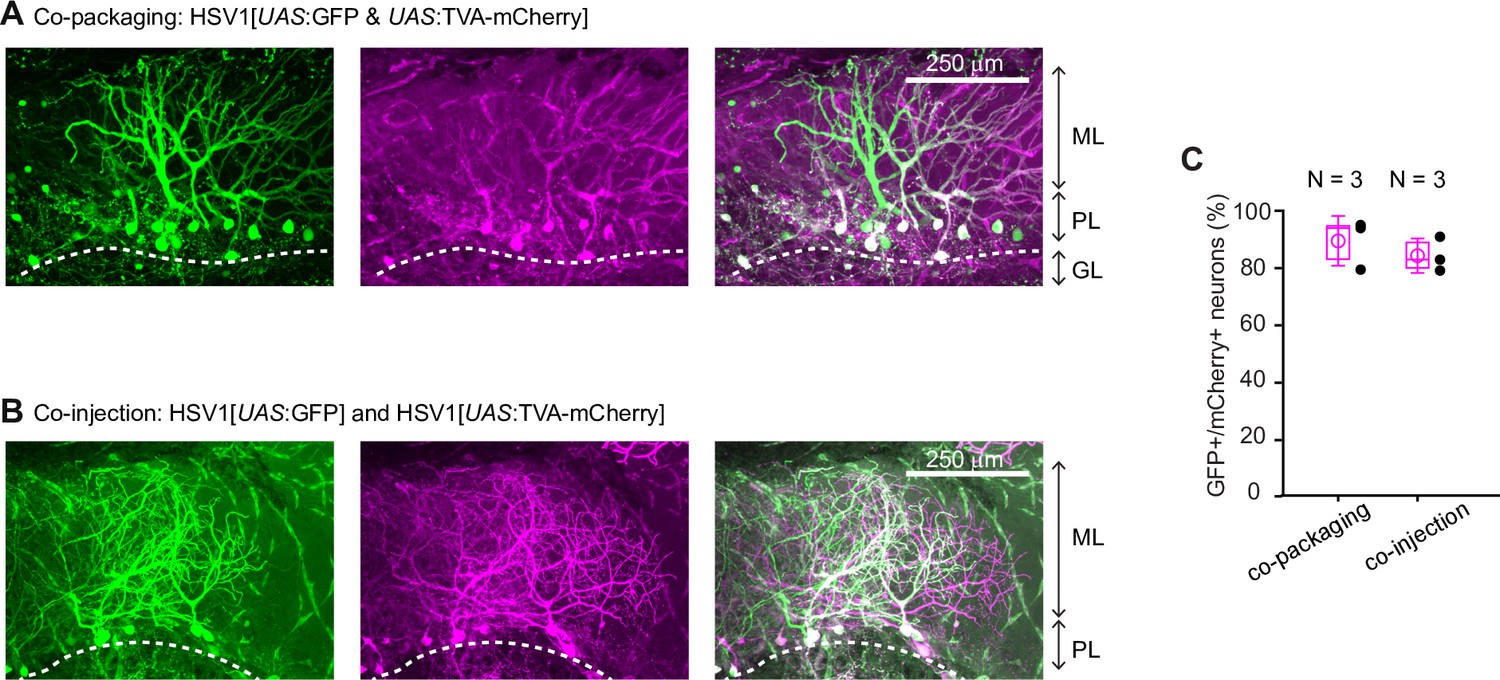
(A) Expression of GFP and mCherry after injection of HSV1[UAS:GFP & UAS:TVA-mCherry] into the cerebellum of Tg[gad1b:Gal4] fish. In this virus, two expression constructs, UAS:GFP and UAS:TVA-mCherry, are packaged into the same virus particles. Expression is observed in Purkinje neurons and in putative Golgi cells. Note high rate of co-expression of GFP and mCherry. ML: molecular layer; PL: Purkinje layer; GL: granular layer. (B) Expression of GFP and mCherry in the Purkinje layer after co-injection of two independent viruses (HSV1[UAS:GFP] and HSV1[UAS:TVA-mCherry]) into the cerebellum of Tg[gad1b:Gal4] fish. Note that the rate of co-expression was high even though GFP and mCherry were delivered by separate viruses. Note also that the overall expression was sparse, implying that co-expression was unlikely to occur by chance. (C) Percentage of GFP and mCherry-expressing neurons among all fluorescent neurons. Filled circles represent data from individual fish, box plot indicates median and the 25th and 75th percentiles, and open circles indicate mean over individual fish. N: number of fish.
Figure 2—figure supplement 3
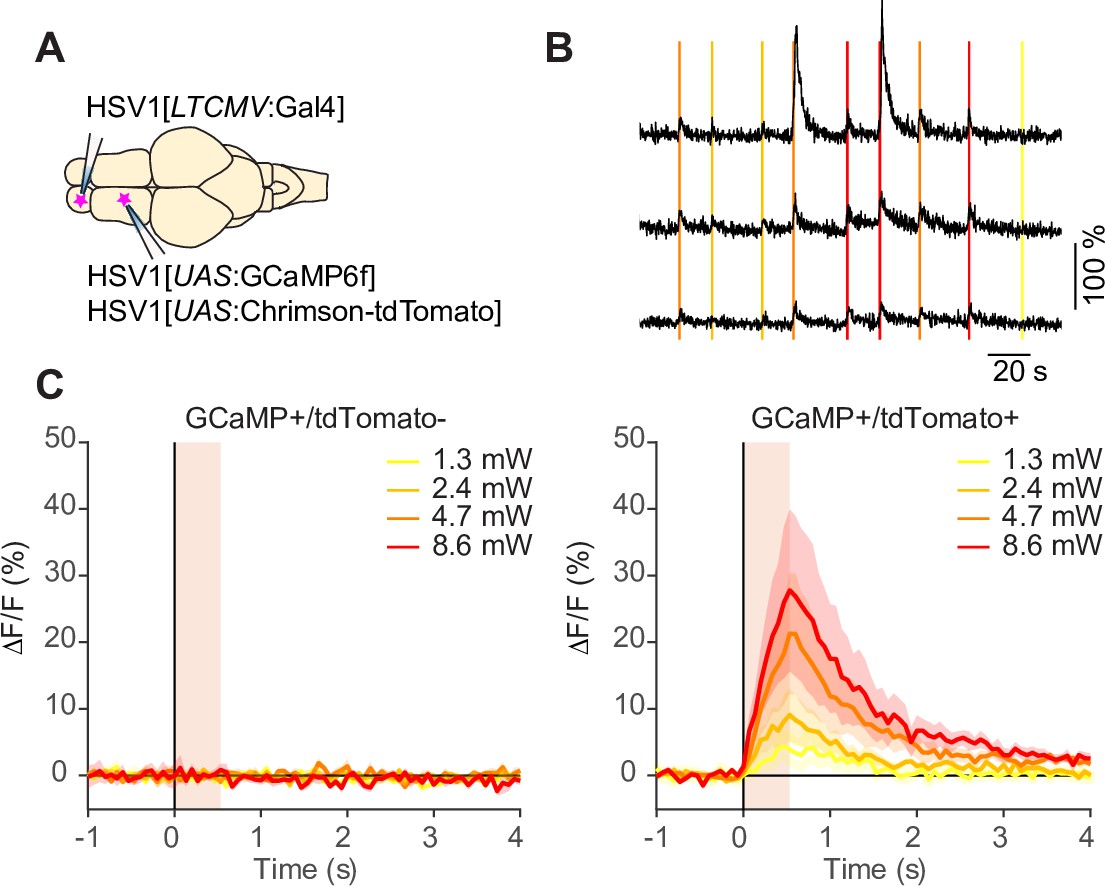
Optogenetic manipulations using HSV1.
(A) Schematic: injection of HSV1[LTCMV:Gal4] into the OB and subsequent co-injection of HSV1[UAS:GCaMP6f] and HSV1[UAS:Chrimson-tdTomato] into the dorsal telencephalon of wildtype fish.(B) Simultaneously recorded calcium transients evoked by optical stimulation of different light intensity (vertical lines) in three example neurons. (C) Mean change GCaMP6f evoked by optical stimulation of different light intensity (11–18 light stimuli at each intensity). Left: GCaMP6f +/tdTomato- neurons (N=8 out of 21 GCaMP6f+ neurons). Right: GCaMP6f +/tdTomato+ neurons (N=13 out 21 GCaMP6f+ neurons). Shading shows SEM. Responses to light stimulation were seen in all individual tdTomato+ neurons (N=13; not shown).
Figure 2—figure supplement 4
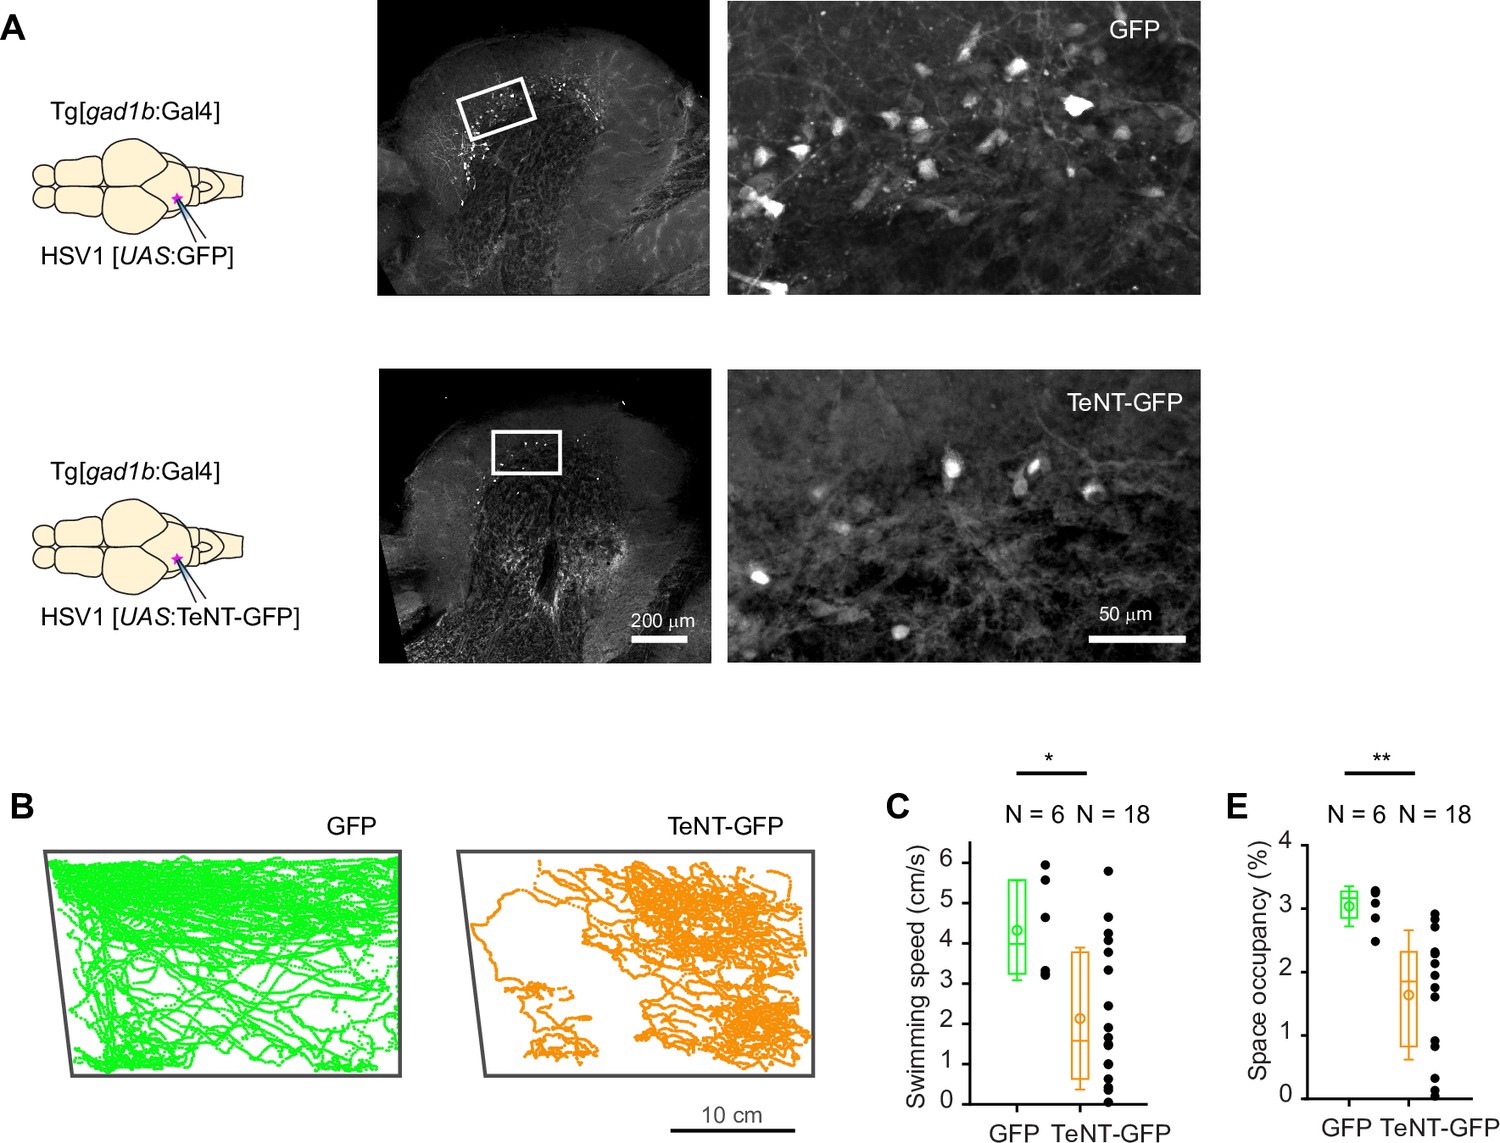
Functional manipulation using HSV1.
(A) Top: Expression of GFP in the cerebellum after injection of HSV1[UAS:GFP] into the cerebellum of Tg[gad1b:Gal4] fish. Bottom: Expression of TeNT-GFP after injection of HSV1[UAS:TeNT-GFP] into the cerebellum of Tg[gad1b:Gal4] fish. (B) Examples of swimming trajectories (15 min) of individual Tg[gad1b:Gal4] fish that received injections of HSV1[UAS:GFP] (left) or HSV1[UAS:TeNT-GFP] into the cerebellum. Note that the fish injected with HSV1[UAS:TeNT-GFP] covered less territory, showed fewer long straight swims, and showed a tendency to stay lower in the water column. (C) Mean swimming speed and 2D space occupancy of Tg[gad1b:Gal4] fish that received injections of HSV1[UAS:GFP] (left) or HSV1[UAS:TeNT-GFP] into the cerebellum. Plot symbols represent data from individual fish; box plots show median and 25th and 75th percentiles, circles and error bars indicate mean and s.d. over individual fish. N: number of fish. p=0.03 for swimming speed, p=0.0012 for space occupancy, Wilcoxon rank sum test.
Figure 2—video 1
Effect of TeNT expression in GABAergic neurons of the cerebellum on swimming behavior.
Left: Tg[gad1b:Gal4] fish 3 days after injection of HSV1[UAS:GFP] into the cerebellum (control). Right: Tg[gad1b:Gal4] fish 3 days after injection of HSV1[UAS:TeNT-GFP] into the cerebellum. Top: side view; bottom: top view of the same tanks.
Figure 2—video 2
Tracking of key points of adult zebrafish injected with an HSV1[UAS:GFP] into the cerebellum Tg[gad1b:Gal4] fish (control).
Figure 2—video 3
Tracking of key points of adult zebrafish injected with an HSV1[UAS:TeNT-GFP] into the cerebellum Tg[gad1b:Gal4] fish.
Figure 3 with 3 supplements
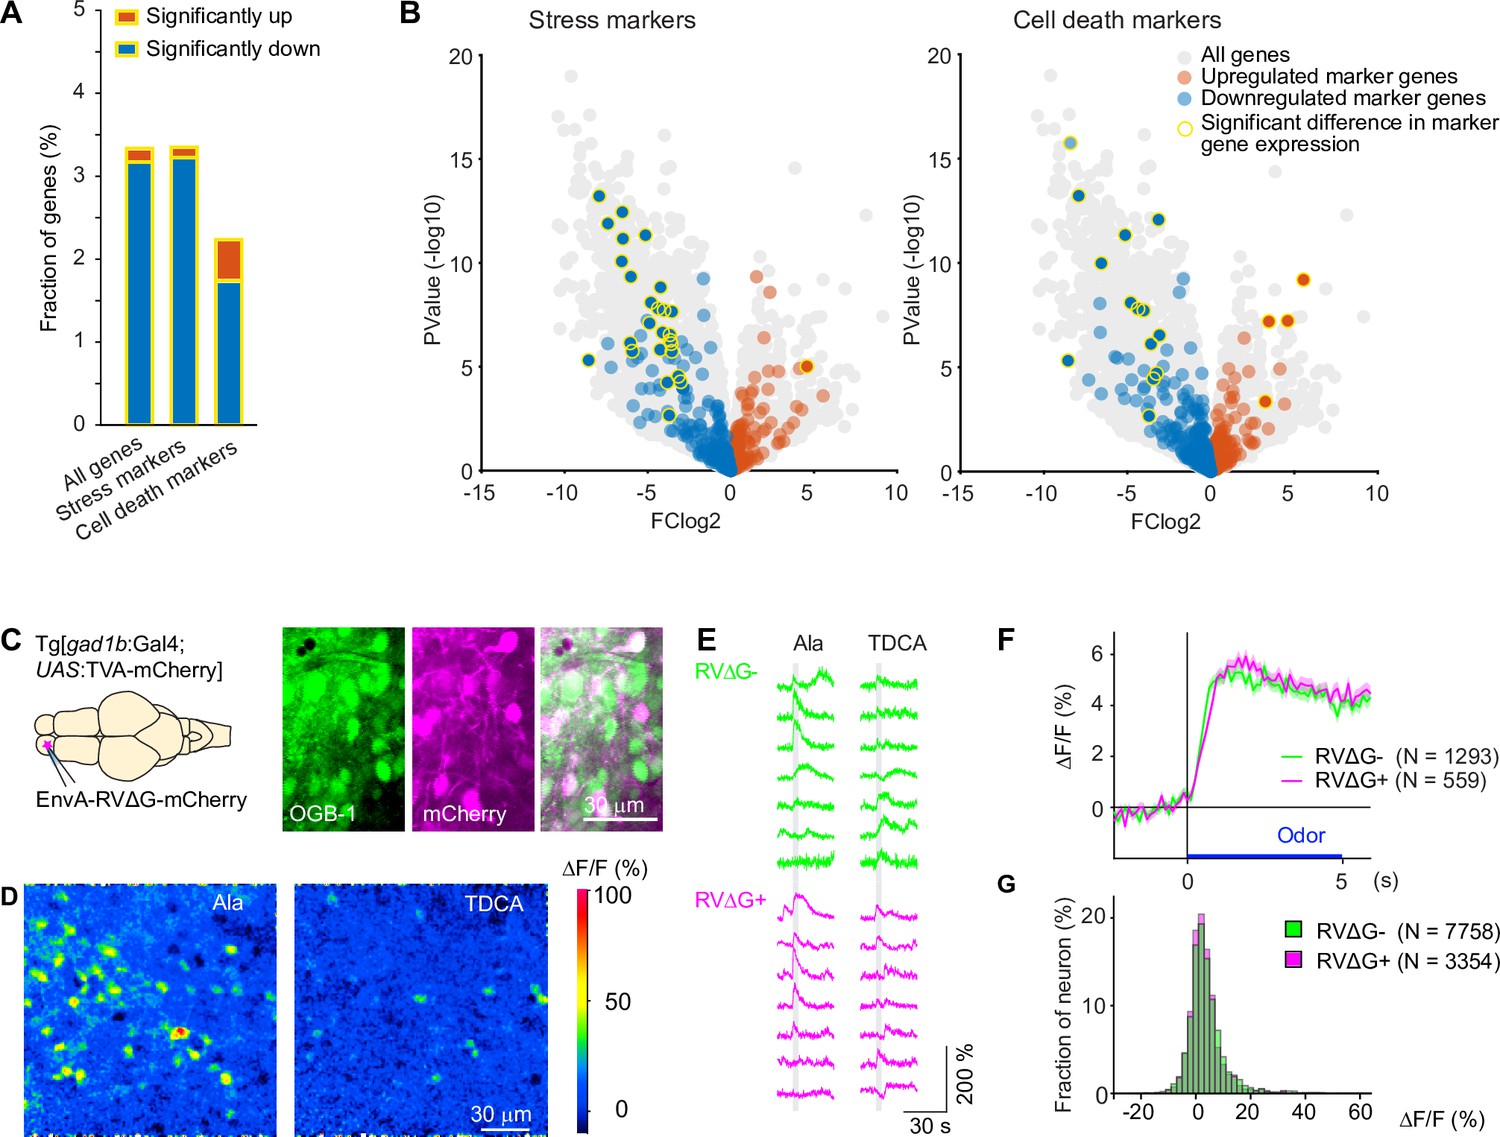
Effects of RV infection on neuronal health and function.
(A) Fraction of genes that were significantly up- or down-regulated genes in RVΔG-infected cells out of all 19,819 genes, out of the 471 stress markers (GO:0033554), and out of the 651 cell-death markers (GO:0008219). Differences in expression level were considered significant when abs(logFC (fold change))>3, log(counts per million reads mapped)>3, and FDR <0.05. The FDR (False Discovery Rate) corrects for multiple testing. (B) Volcano plots displaying differential gene expression in RVΔG-infected and uninfected cells. Colored dots indicate stress markers (left) and cell death markers (right) (orange: upregulated, blue: downregulated). Yellow outline depicts statistically significant difference in expression level. (C) OGB-1 labeling and mCherry expression in the deep (granule cell) layer of the adult zebrafish OB after injection of EnvA-RVΔG-mCherry into the OB of Tg[gad1b:Gal4; UAS:TVA-mCherry] fish and bolus loading of OGB-1. The two red fluorescent labels were distinguishable because fluorescence of TVA-mCherry is localized to the membrane and weak whereas fluorescence of virus-driven mCherry is strong and includes the nucleus. (D) Ca2+ signals evoked by two different odors in the same optical plane (single trials). Odors: alanine (Ala), taurodeoxycholic acid (TDCA). (E) Randomly selected responses of seven infected (magenta) neurons and seven uninfected (green) neurons from the same optical plane to two odors (single trials). (F) Odor-evoked Ca2+ signals of infected (N=559) and uninfected (N=1293) OB cells from N = 4 fish, averaged over all odors (N=6) and repetitions (N=3 for each odor). Shading indicates s.e.m.; bar indicates odor stimulation. (G) Distribution of response amplitudes in non-infected and infected cells to different odors (N=6), averaged over trials (N=3). Distributions of were not significantly different (p=0.24, Kolmogorov–Smirnov test).
-
Figure 3—source data 1
List of genes that were significantly up- or downregulated in cells infected by RVΔG.
Genes associated with GO terms cellular response to stress (GO:0033554) and cell death (GO: 0008219) are listed at the top (colored rows).
- https://cdn.elifesciences.org/articles/77153/elife-77153-fig3-data1-v1.xlsx
-
Figure 3—source data 2
Gene ontology (GO) terms that showed a significant association with the set of regulated genes in RVΔG-infected cells (Figure 3—source data 1), sorted by probability (p-value).
Note that most GO terms are linked to immunity. GO terms linked to stress, cell death or synaptic functions are rare or absent.
- https://cdn.elifesciences.org/articles/77153/elife-77153-fig3-data2-v1.xlsx
Figure 3—figure supplement 1
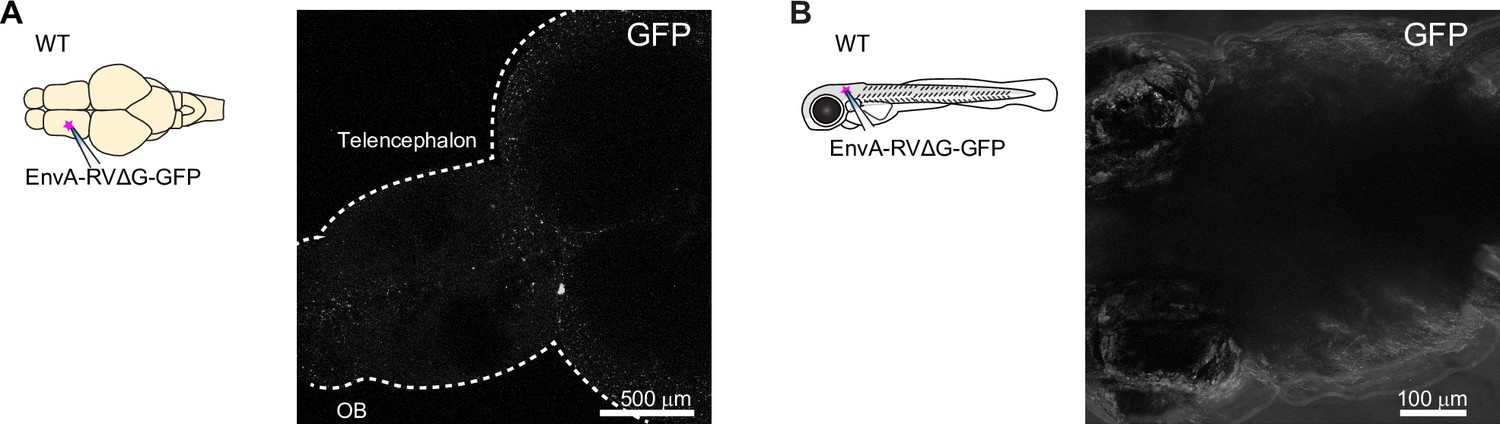
Injection of pseudotyped rabies virus does not infect neurons in the absence of TVA.
(A) Absence of expression after injection of EnvA-RVΔG-GFP into the telencephalon of adult wildtype fish.(B) Absence of expression after injection of EnvA-RVΔG-GFP into the optic tectum of wildtype fish at 7 dpf.
Figure 3—figure supplement 2
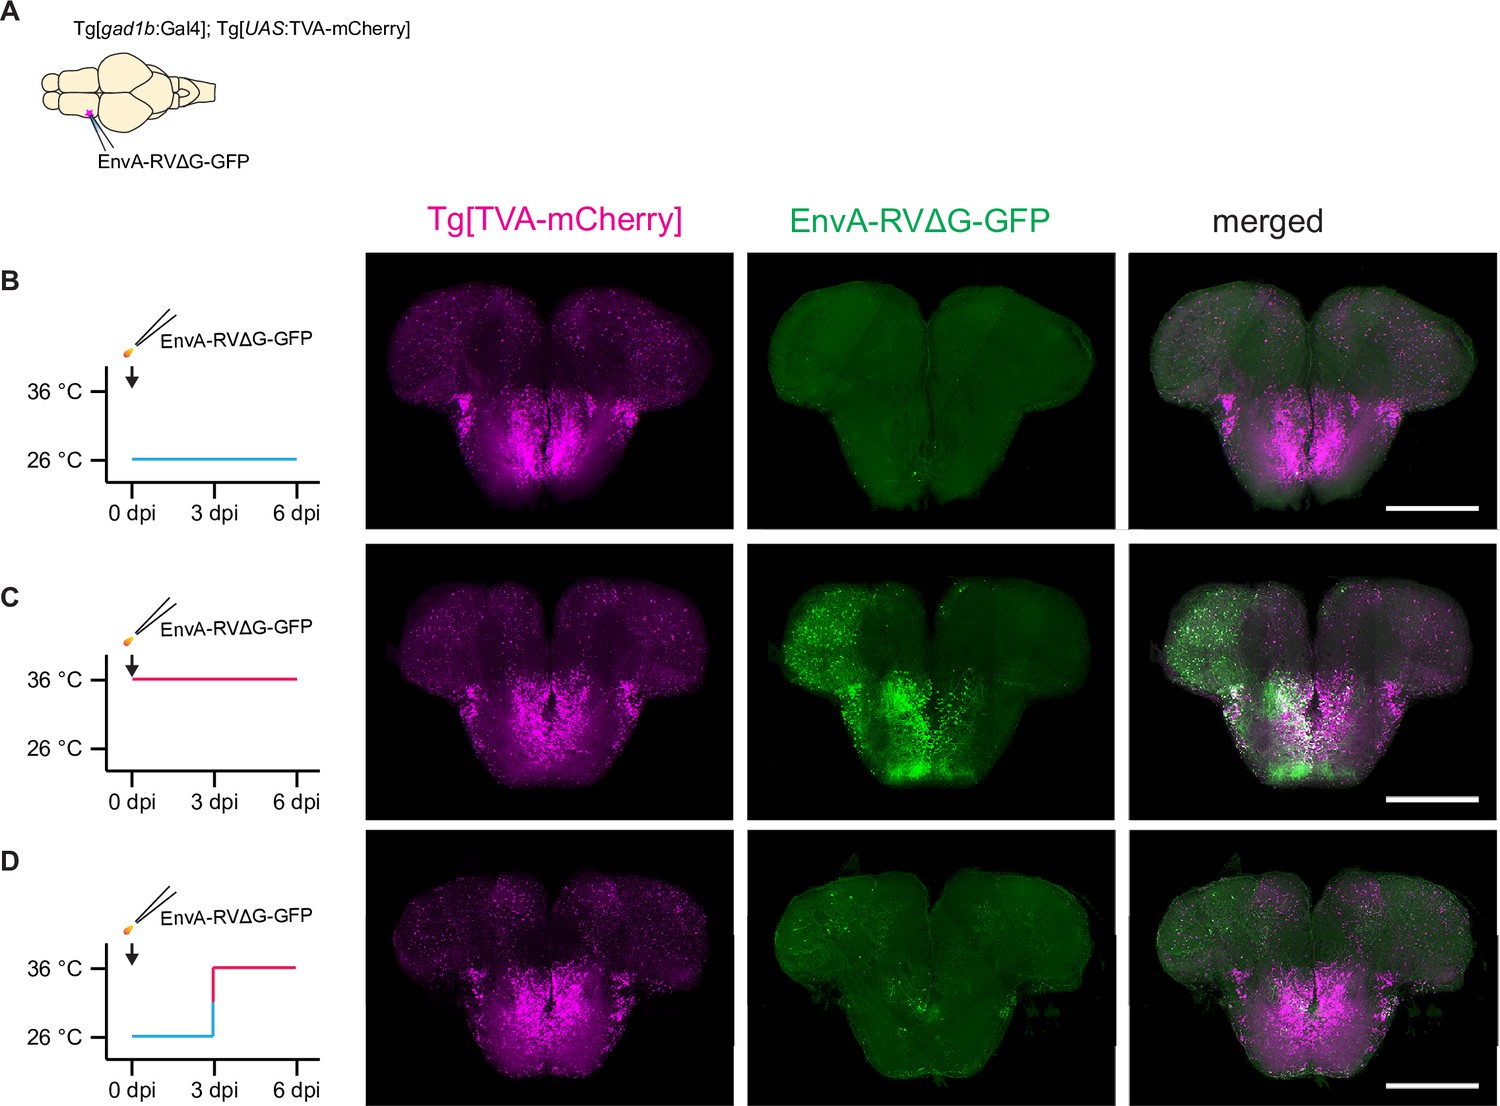
Temperature-dependence of infection by rabies virus.
(A) Experimental scheme: Rabies virus (EnvA-RVΔG-GFP) was injected into the telencephalon of transgenic fish expressing TVA-mCherry in GABAergic neurons (Tg[gad1b:Gal4; UAS:TVA-mCherry]). (B) Expression of TVA-mCherry and GFP when fish were kept at 26 °C for 6 days after injection. Note almost complete absence of GFP expression.(C) Expression of TVA-mCherry and GFP when fish were kept at 36 °C for 6 days after injection. Note strong GFP expression.(D) Expression of TVA-mCherry and GFP six days after injection when the housing temperature was increased from 26 °C to 36 °C 3 days after injection. GFP expression was weak and sparse.
Figure 3—figure supplement 3
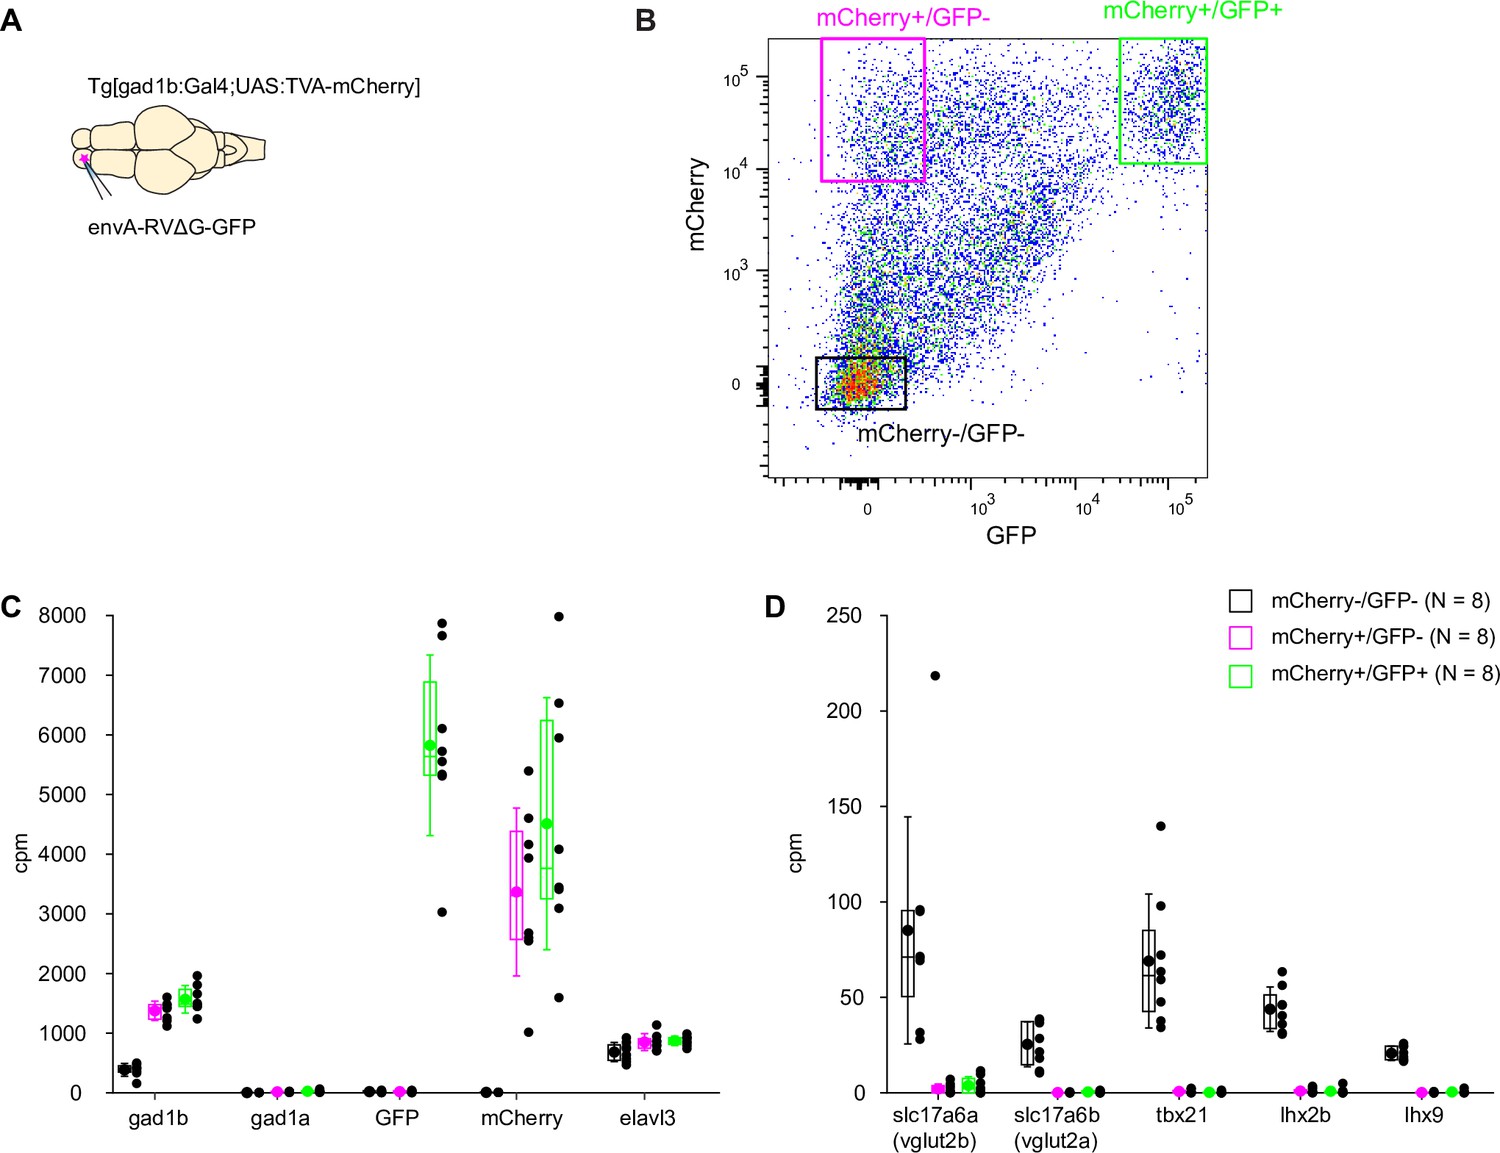
Analysis of gene expression in GABAergic neurons.
(A) Schematic: injection of EnvA-RVΔG-GFP into the OB of adult Tg[gad1b:Gal4;UAS:TVA-mCherry] fish. (B) Example of FACS analysis of GFP and mCherry expression. Boxes depict cells selected as mCherry+/GFP+ (EnvA-RVΔG-GFP infected gad1b neurons), mCherry+/GFP- (non-infected gad1b neurons), mCherry-/GFP- (negative control containing other OB cells). gad1b is one of two isoforms of gad1 that are expressed differentially in GABAergic neurons. (C) Expression of marker genes (x-axis) in infected gad1b neurons (mCherry+/GFP+; green), non-infected gad1b neurons (mCherry+/GFP-; magenta), and other OB cells (mCherry-/GFP-; black). Cells classified as gad1b-positive by fluorescence markers, but not other cells, expressed gad1b but not gad1a, the other gad1 isoform. Expression of fluorescent marker genes followed the detection of fluorescent markers by FACS. The neuronal marker elav3 was present in all three pools. Plot symbols represent data from individual samples; box plots show median and 25th and 75th percentiles, circles and error bars indicate mean and s.d. over individual samples (N=8 samples). (D) Expression of negative markers for GABAergic neurons. The selected marker genes (slc17a6a, slc17a6b, tbx21, lhx2b, and lhx9) should be expressed in mitral cells of the OB and other excitatory neurons but not in GABAergic neurons. Consistent with this expectation, expression of all negative markers was low or absent in pools of gad1b cells selected by FACS (N=8 samples).
Figure 4 with 3 supplements

Transneuronal tracing using pseudotyped rabies virus in adult zebrafish.
(A) Schematic of the cerebellar circuit. Glutamatergic neurons are shown in red colors, GABAergic neurons in blue colors. Purkinje cells receive extra-cerebellar input exclusively from the inferior olive. (B) Co-injection of EnvA-RVΔG-GFP and HSV1[UAS:TVA-mCherry] into the cerebellum of Tg[gad1b:Gal4] fish in the absence of glycoprotein. Left: schematic. Center: expression of TVA-mCherry (magenta) and GFP (green) in the cerebellum. Regions in the Purkinje and granular layers (dashed rectangles) are enlarged. Unfilled white arrowheads indicate GFP+/mCherry +neurons. Right: expression of GFP in the hindbrain. Region covering the inferior olive (dashed rectangle) is enlarged. Expression of GFP was restricted to putative starter neurons; no expression was detected in the inferior olive. ML: molecular layer; PL: Purkinje layer; GL: granular layer. (C) Same as in (B) but the glycoprotein (zoSADG) was supplied to starter neurons in trans by co-injection of HSV1[UAS:zoSADG]. Filled white arrowheads indicate GFP+/mCherry- neurons. Note expression of GFP in putative granule cells and in neurons of the inferior olive, indicating transneuronal spread. (D) Number of neurons that expressed GFP and mCherry (putative starter neurons) or GFP alone (putative presynaptic neurons) at different time points after injection of EnvA-RVΔG and HSV1[UAS:TVA-mCherry] into the cerebellum of Tg[gad1b:Gal4] fish. Left: without glycoprotein; right: with trans-complementation of zoSADG in starter neurons. Note that labeling of putative presynaptic neurons emerged between 6 and 10 days post injection only when zoSADG was trans-complemented in starter neurons. In all plots, black dots represent data from individual fish, box plot indicates median and the 25th and 75th percentiles, circles and error bars indicate mean and s.d. over individual fish. N: number of fish. (E) Convergence index for the projection from the inferior olive to the cerebellum at different time points. The convergence index is the numerical ratio of transneuronally labeled neurons (GFP+/mCherry- neurons in the inferior olive) and putative starter cells in the cerebellum (GFP+/mCherry +Purkinje neurons). N: number of fish. (F) Schematic of the putative circuitry in telencephalic area Dp. Glutamatergic neurons are shown in red colors, GABAergic neurons in blue colors. Long-range projections from mitral cells in the olfactory bulb terminate on glutamatergic neurons and on GABAergic interneurons in Dp. Additional long-range projections originate in other telencephalic areas. (G) Co-injection of EnvA-RVΔG and HSV1[UAS:TVA-mCherry] into Dp of Tg[gad1b:Gal4] fish in the absence of glycoprotein. Coronal section through the injected telencephalic hemisphere at the level of Dp. Area outlined by dashed rectangle is enlarged. Co-expression of GFP (green) and mCherry (magenta) indicates starter cells. (H) Same as in (G) but with trans-complementation of zoSADG in starter neurons by co-injection of HSV1[UAS:zoSADG]. Left: coronal section through the injected telencephalic hemisphere. Right: coronal section through the ipsilateral OB. Expression of GFP only (green) indicates transneuronally labeled neurons. (I) Number of neurons in the telencephalon that expressed GFP and mCherry (putative starter neurons) or GFP alone (putative presynaptic neurons) after injection of EnvA-RVΔG and HSV1[UAS:TVA-mCherry] into Dp with (+) or without (-) trans-complementation with zoSADG in starter neurons (HSV1[UAS:zoSADG]). Left: injection into Tg[gad1b:Gal4] fish; right: injection into Tg[vglut1:Gal4] fish (right). Expression was analyzed 10 days post injection. N: number of fish. (J) Convergence index for the projection of transneuronally labeled neurons in the OB to Dp when EnvA-RVΔG was targeted to GABAergic neurons (viral injections into Tg[gad1b:Gal4] fish) or to glutamatergic neurons (injections into Tg[vglut1:Gal4] fish) in Dp. Expression was analyzed at 10 days post injection. N: number of fish.
Figure 4—figure supplement 1
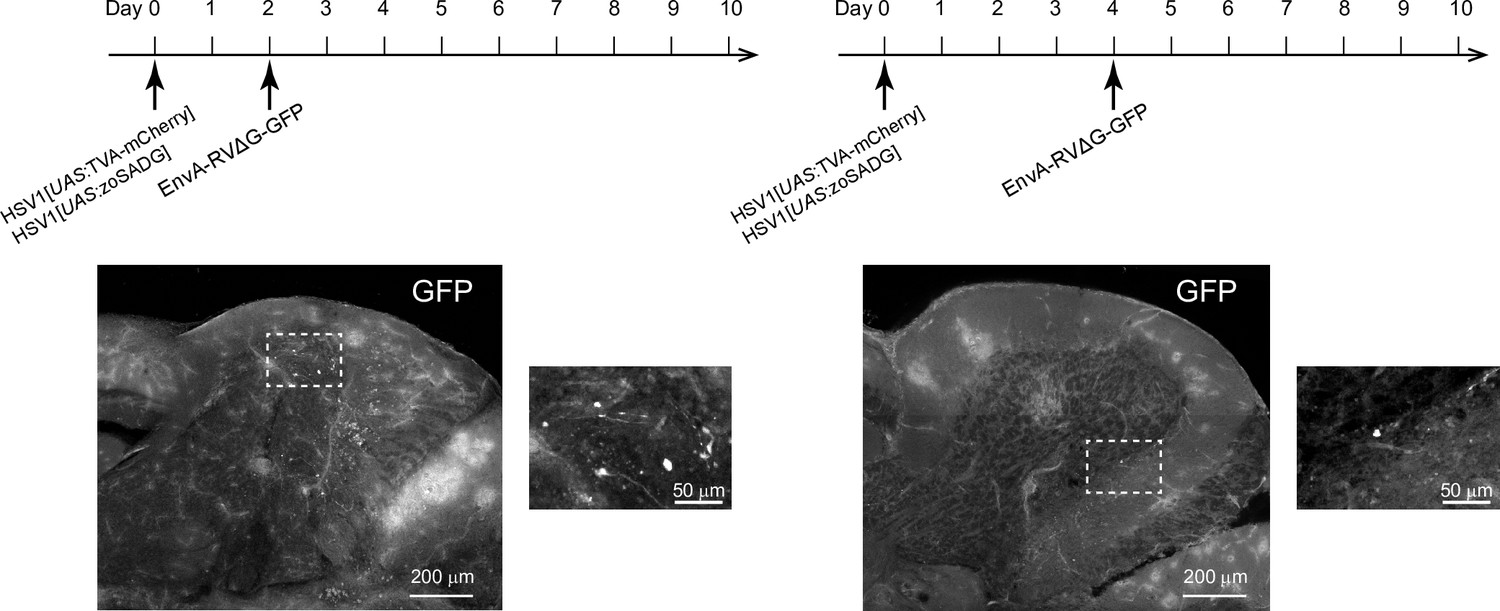
Sequential injection of HSV1 and rabies virus.
Expression of GFP in the cerebellum after sequential injection of (1) HSV1[UAS:TVA-mCherry] and HSV1[UAS:zoSADG] and (2) EnvA-RVΔG-GFP into the cerebellum of Tg[gad1b:Gal4] fish. Outlined regions are enlarged. Only few labeled neurons were detected. Left: EnvA-RVΔG-GFP was injected 2 days after HSV1 injection. Right: EnvA-RVΔG-GFP was injected 4 days after HSV1 injection.
Figure 4—figure supplement 2
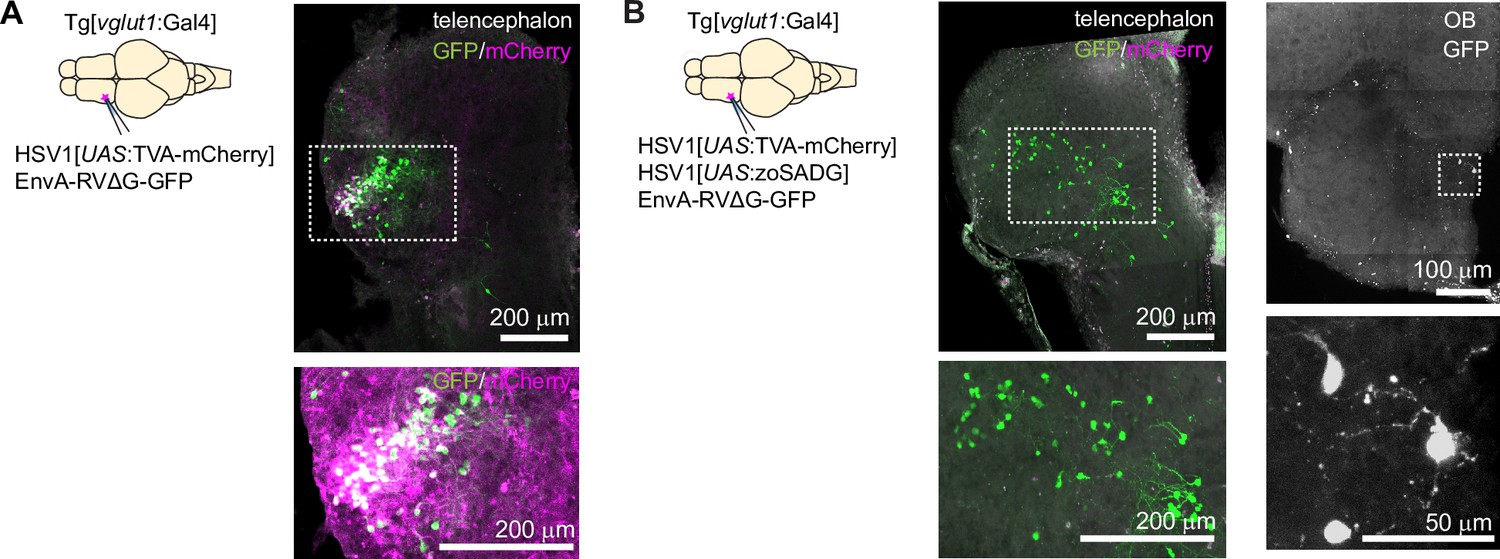
Transneuronal tracing using pseudotyped rabies virus from vglut1 +neurons in Dp in adult zebrafish.
(A) Co-injection of EnvA-RVΔG-GFP and HSV1[UAS:TVA-mCherry] into Dp of Tg[vglut1:Gal4] fish in the absence of glycoprotein. Coronal section through the injected telencephalic hemisphere at the level of Dp. Area outlined by dashed rectangle is enlarged below and red channel is enhanced. Co-expression of GFP (green) and mCherry (magenta) indicates starter cells. (B) Same as in (A) but with trans-complementation of zoSADG in starter neurons by co-injection of HSV1[UAS:zoSADG]. Left: coronal section through the injected telencephalic hemisphere. Right: coronal section through the ipsilateral olfactory bulb. Expression of GFP only (green) indicates transneuronally labeled neurons.
Figure 4—figure supplement 3
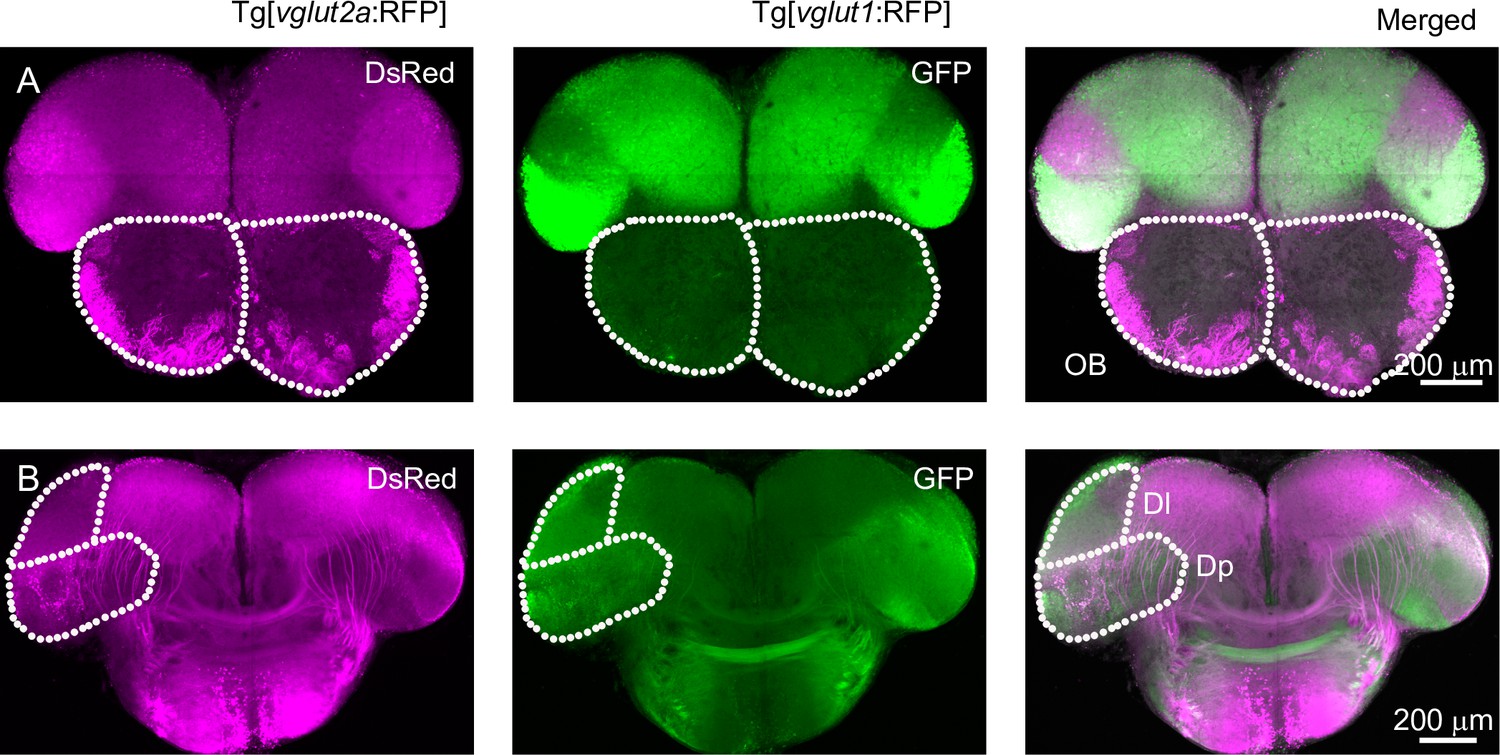
Expression pattern of vglut1 and vglut2 in olfactory bulb and Dp.
(A) Coronal cross sections through the OB and anterior telencephalon from Tg[vglut2a:RFP; vglut1:GFP] double transgenic fish. Note that vglut2a (magenta) is expressed by axons of olfactory sensory neurons innervating glomeruli in the OB and by a subset of mitral cells, while expression of vglut1 (green) in the OB is weak or absent. Dotted lines outline OBs. (B) More posterior coronal cross sections through the telencephalon of the same fish at the level of Dp. Note that expression of vglut2a and vglut1 in the telencephalon are largely complementary. Neurons in Dp express primarily vglut1. Dotted areas indicate the dorsal lateral telencephalic area (Dl) and Dp.
Figure 5
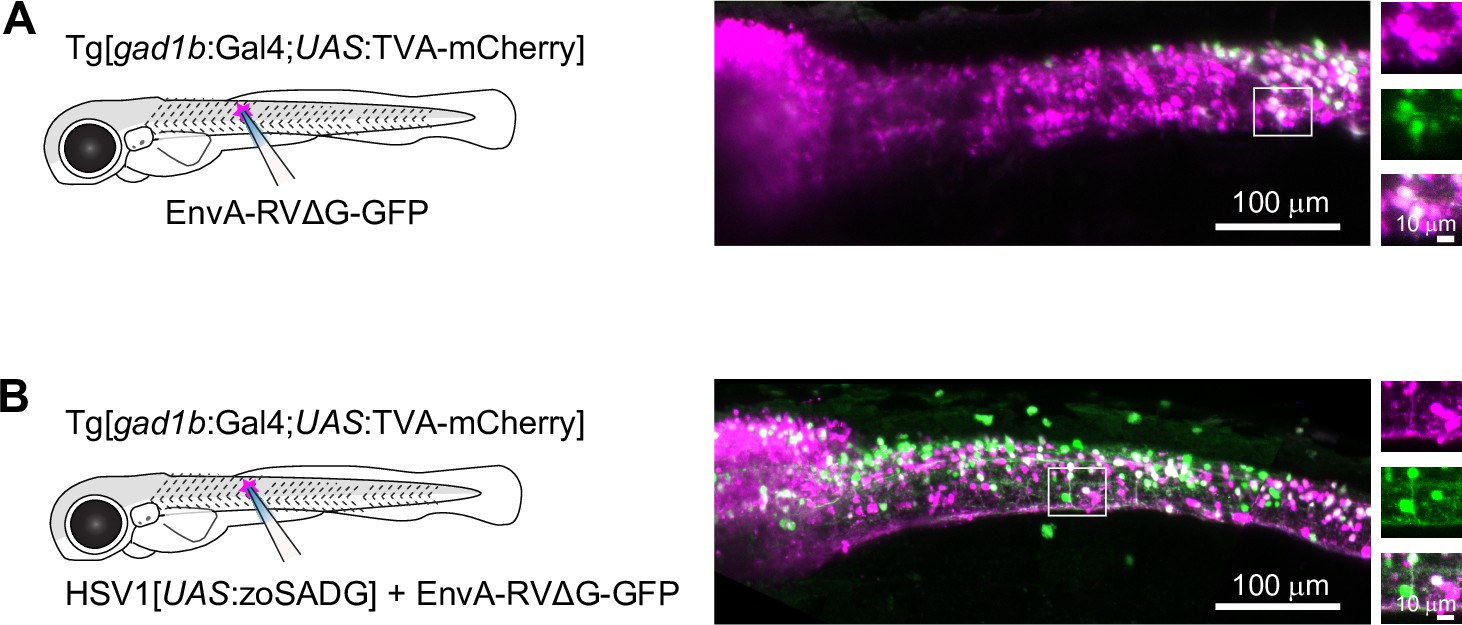
Transneuronal tracing using pseudotyped rabies virus in zebrafish larvae.
(A) Expression of GFP (green) and TVA-mCherry (red) 6 days after injection of EnvA-RVΔG-GFP into the spinal cord of Tg[gad1b:Gal4;UAS:TVA-mCherry] fish at 7 dpf. Boxed region is enlarged on the right. (B) Same after co-injection of EnvA-RVΔG-GFP and HSV1[UAS:zoSADG] into the spinal cord of Tg[gad1b:Gal4;UAS:TVA-mCherry] fish at 7 dpf.
Tables
Key resources table
| Reagent type (species) or resource | Designation | Source or reference | Identifiers | Additional information |
|---|---|---|---|---|
| Strain, strain background (Zebrafish) | AbtuTL x WIK | European zebrafish stock center | ||
| Strain, strain background (Zebrafish) | Basel-golden | Created in this study | To obtain this line, please contact Friedrich lab | |
| Strain, strain background (Zebrafish) | Tg[UAS:TVA-mCherry] | Created in this study | To obtain this line, please contact Friedrich lab | |
| Strain, strain background (Zebrafish) | Tg[vglut1:GFP] | Created in this study | To obtain this line, please contact Higashijima lab | |
| Strain, strain background (Zebrafish) | Tg[vglut1:Gal4] | Created in this study | To obtain this line, please contact Higashijima lab | |
| Strain, strain background (Zebrafish) | Tg[gad1b:GFP] | Satou et al., 2013 | ||
| Strain, strain background (Zebrafish) | Tg[gad1b:Gal4] | Frank et al., 2019 | ||
| Strain, strain background (Zebrafish) | Tg [vglut2a:loxP-DsRed-loxP-GFP] | Satou et al., 2013 | ||
| Strain, strain background (Zebrafish) | Tg[th:Gal4] | Li et al., 2015 | ||
| Strain, strain background (Zebrafish) | Tg[UAS:tdTomato-CAAX] | Miyasaka et al., 2014 | ||
| Recombinant DNA reagent (plasmid) | UAS:TVA-mCherry | Created in this study | Addgene plasmid # 187,823 | |
| Antibody | GFP (Chicken polyconal) | Thermofisher | A10262 | 1:200 |
| Antibody | mCherry (Rat monoclonal) | chromotek | 5F8 | 1:200 |
| Others | EnvA-RVΔG-GFP | Created in this study | To obtain viruse, please contact to FMI virus core. | |
| Others | HSV1 (See Figure 2—source data 1 file1) | Created in this study | To obtain viruses, please contact to Neve lab. | |
| Software, algorithm | matlab | 2021b | ||
| Software, algorithm | DeepLabCut | version 2.2.1 |
Additional files
Download links
A two-part list of links to download the article, or parts of the article, in various formats.
Downloads (link to download the article as PDF)
Open citations (links to open the citations from this article in various online reference manager services)
Cite this article (links to download the citations from this article in formats compatible with various reference manager tools)
A viral toolbox for conditional and transneuronal gene expression in zebrafish
eLife 11:e77153.
https://doi.org/10.7554/eLife.77153


