A neural network model of hippocampal contributions to category learning
- Department of Experimental Psychology, University of Oxford, United Kingdom
- Department of Psychology, University of Pennsylvania, United States
Figures
Figure 1

C-HORSE architecture.
The model consists of dentate gyrus (DG), CA3, and CA1 subfields which map inputs from superficial (ECin) to deep layers (ECout) of the entorhinal cortex. The height and color of each box represents the activity level of a unit. The trisynaptic pathway (TSP) connects EC to CA1 via DG and CA3 (blue arrows), and the monosynaptic pathway (MSP) connects EC directly with CA1 (green arrows). The TSP specializes in pattern separation (depicted as separated blue pools of neurons), whereas the MSP contains more overlapping representations (overlapping green pools).
Figure 2
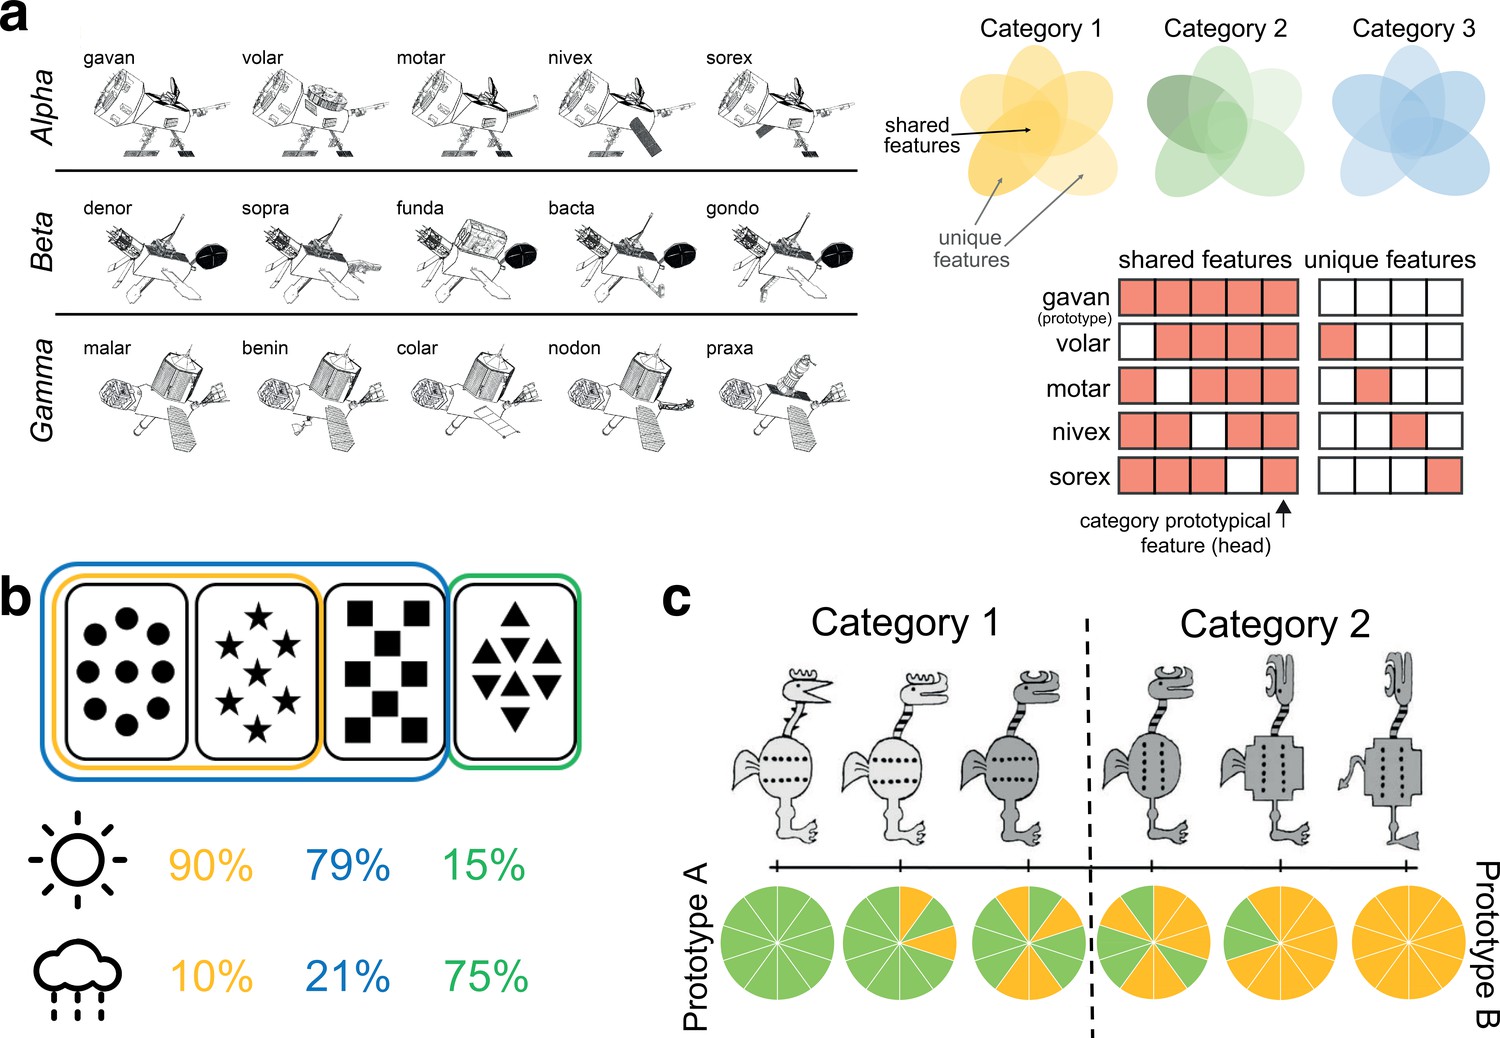
Overview of simulated category learning paradigms.
(a) Satellite categories: distinct categories of novel ‘satellites’ consisting of unique and shared features (reproduced from Figure 1A of Schapiro et al., 2017a). Grids depict model input structure for the five members of the Alpha category, with the prototype consisting of only shared features and all other exemplars containing one unique feature. One feature (the satellite head) is category prototypical, appearing in all exemplars of its category. (b) Weather Prediction Task: each abstract card is probabilistically related to a category (sun or rain), and on a given trial, category must be guessed from a simultaneously presented set of 1–3 cards (Knowlton et al., 1994). The illustration shows the first two cards related to the ‘sun’ category on 90% of the trials (and to ‘rain’ on 10% of the trials), while a combination of the first three cards related to sun 79% of the time, and a fourth card viewed by itself associated with sun 15% of the time. (c) Intermixed categories with varying typicality: categories where each item consists of 10 binary features. The two prototypes on opposite sides of the feature space have no features in common (depicted by all green versus all yellow features in the piecharts), and the rest of the exemplars have a varying number of features in common with the prototypes (adapted from Figure 1 of Zeithamova et al., 2008).
Figure 3
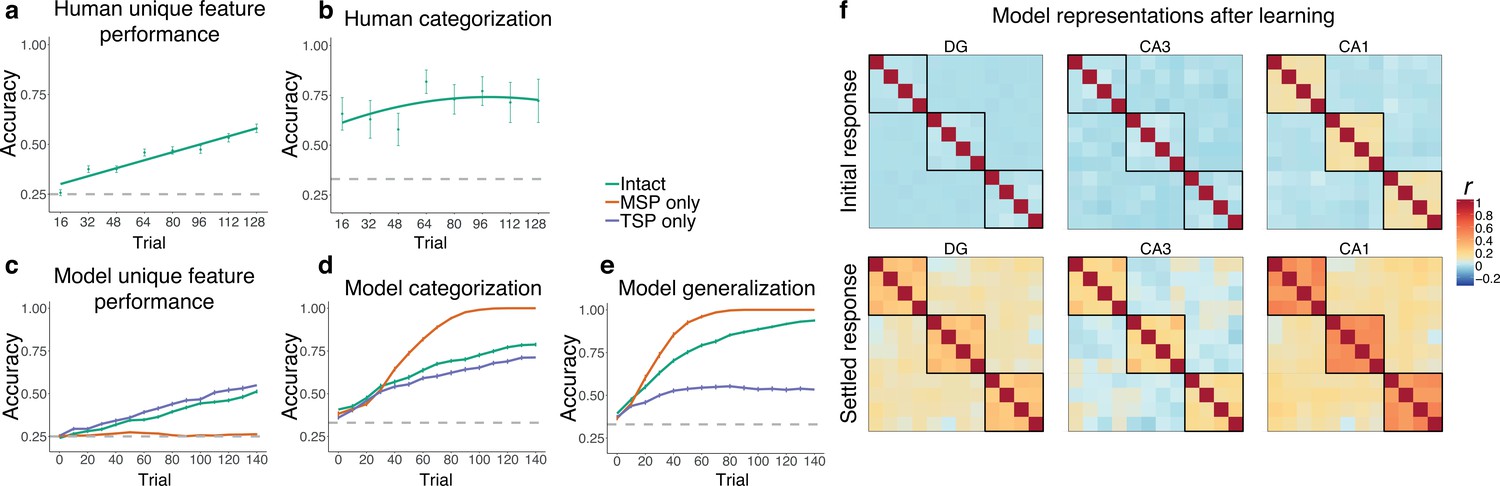
Simulation 1: satellite task.
Human performance on (a) unique features and (b) categorization across training in Schapiro et al., 2017a. Unique feature trajectory plotted with a linear learning curve fit and categorization with a quadratic fit. (Humans were not tested on generalization over the course of training.) Performance of the network across training trials for (c) unique feature recognition, (d) categorization of trained items, and (e) generalization (categorization of novel items). Performance is shown for the intact network (green), a version of the network with only the monosynaptic pathway (MSP) (orange), and a version with only the trisynaptic pathway (TSP) (purple). Plots show mean performance averaged across random network initializations. Error bars denote ±1 s.e.m. across people / 100 network initializations (some are too small to be visible). Dashed lines indicate chance level performance. Source data can be found in Figure 3—source data 1. (f) Representational similarity for the initial and settled response of the intact network. Each item appears in the rows and columns of the heatmaps. The diagonals are always 1 as this reflects items correlated to themselves, and the off-diagonals are symmetric. Black boxes delineate categories. Source data can be found in Figure 3—source data 2.
-
Figure 3—source code 1
R code used to generate Figure 3 panels.
- https://cdn.elifesciences.org/articles/77185/elife-77185-fig3-code1-v1.zip
-
Figure 3—source data 1
Data corresponding to all line plots in Figure 3.
- https://cdn.elifesciences.org/articles/77185/elife-77185-fig3-data1-v1.csv
-
Figure 3—source data 2
Correlation values for representational similarity analysis heatmaps in Figure 3f.
- https://cdn.elifesciences.org/articles/77185/elife-77185-fig3-data2-v1.xlsx
Figure 4
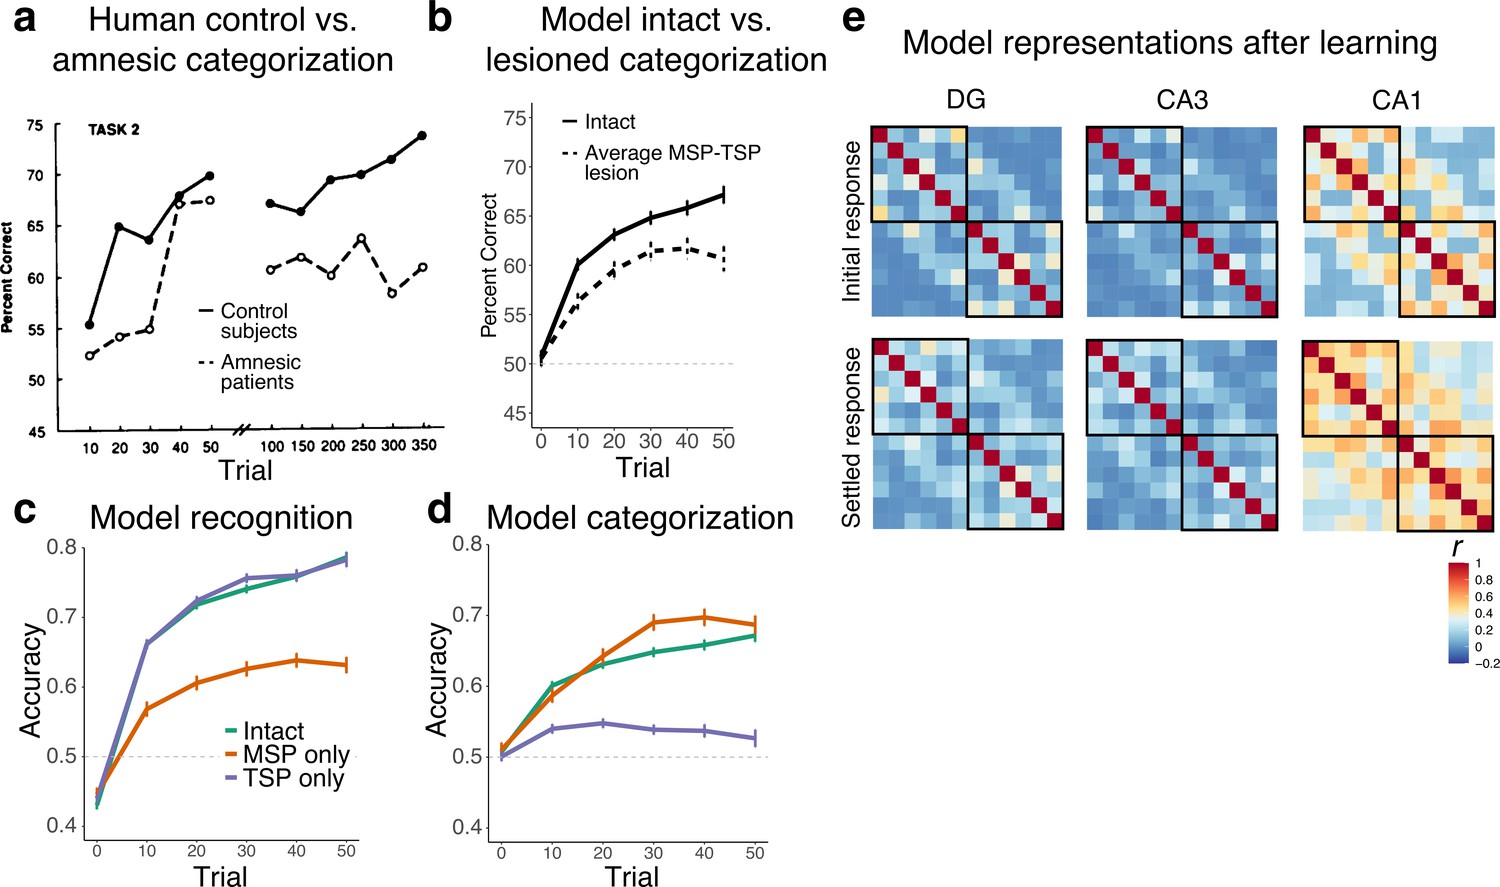
Simulation 2: Weather Prediction Task.
(a) Human control and amnesic performance from Task 2 of Knowlton et al., 1994 (adapted from Figure 2). (b) Intact and lesioned model categorization performance across trials, simulating the initial phase of human learning. (c) Model recognition performance for the intact network, a version of the network with only the monosynaptic pathway (MSP), and a version with only the trisynaptic pathway (TSP). (d) Model categorization performance across the three network variants. Source data can be found in Figure 4—source data 1. (e) Representational similarity for the initial and settled response of the intact network. Each combination of cards appears in the rows and columns of the heatmap, organized by most likely to predict sun to most likely to predict rain. Source data can be found in Figure 4—source data 2.
-
Figure 4—source code 1
R code used to generate Figure 4 panels.
- https://cdn.elifesciences.org/articles/77185/elife-77185-fig4-code1-v1.zip
-
Figure 4—source data 1
Data corresponding to all line plots in Figure 4.
- https://cdn.elifesciences.org/articles/77185/elife-77185-fig4-data1-v1.csv
-
Figure 4—source data 2
Correlation values for representational similarity analysis heatmaps in Figure 4e.
- https://cdn.elifesciences.org/articles/77185/elife-77185-fig4-data2-v1.xlsx
Figure 5
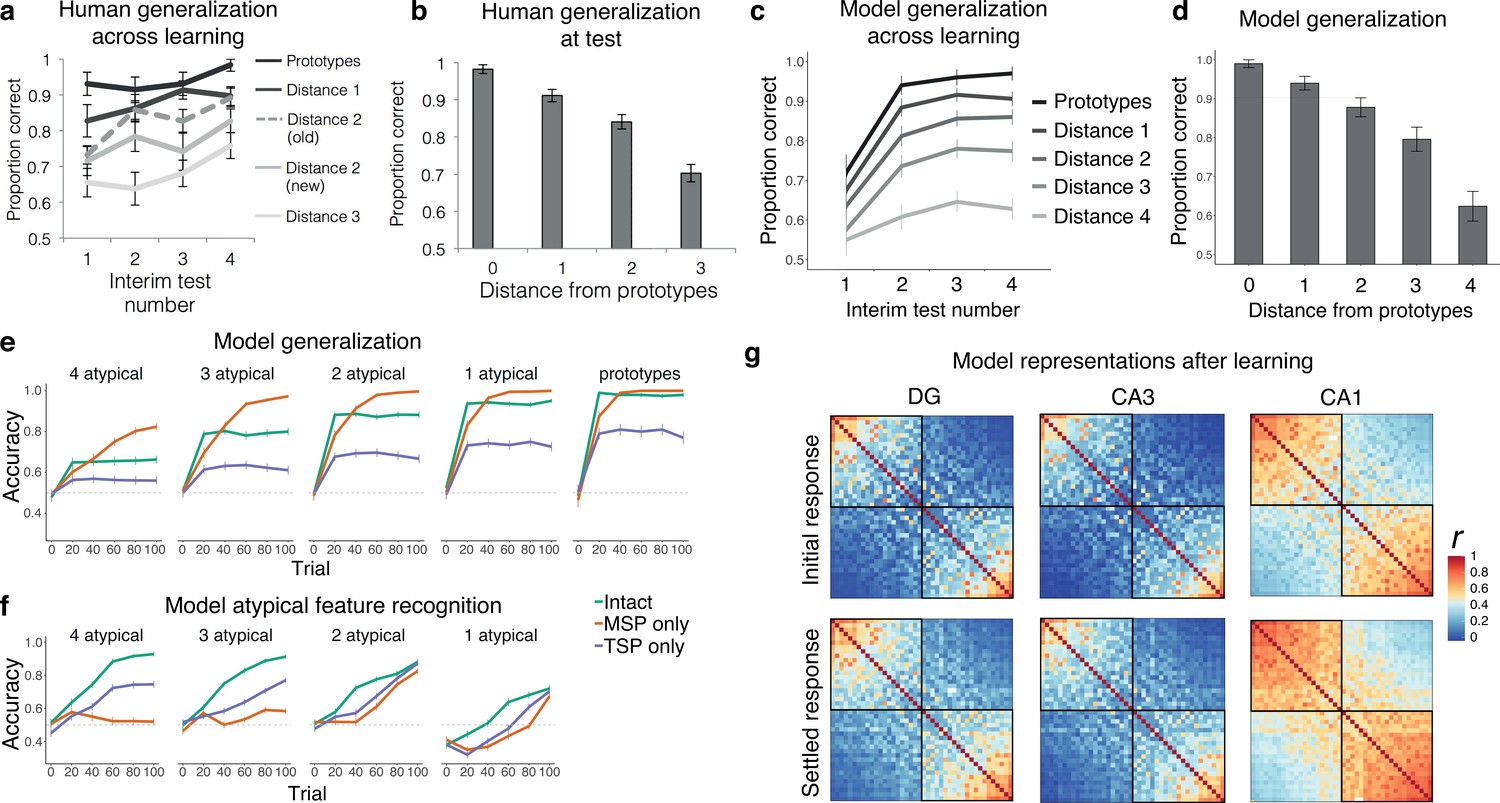
Simulation 3: intermixed categories with varying typicality.
Human generalization across (a) learning and (b) test, for varying levels of typicality, from Figure 3 in Bowman et al., 2020. Intact model generalization across (c) learning, with 10 trials prior to each interim test, and (d) at the end of learning. Source data can be found in Figure 5—source data 1. (e) Model generalization broken down by typicality and model type. (f) Model atypical feature recognition broken down by typicality and model type. Source data can be found in Figure 5—source data 2. (g) Representational similarity for the initial and settled response of the intact network. Each item appears in the rows and columns of the heatmap, organized by most prototypical members of one category to most prototypical members of the other. Source data can be found in Figure 5—source data 3.
-
Figure 5—source code 1
R code used to generate Figure 5 panels.
- https://cdn.elifesciences.org/articles/77185/elife-77185-fig5-code1-v1.zip
-
Figure 5—source data 1
Data corresponding to Figure 5c, d.
- https://cdn.elifesciences.org/articles/77185/elife-77185-fig5-data1-v1.csv
-
Figure 5—source data 2
Data corresponding to Figure 5e, f.
- https://cdn.elifesciences.org/articles/77185/elife-77185-fig5-data2-v1.csv
-
Figure 5—source data 3
Correlation values for representational similarity analysis heatmaps in Figure 5g.
- https://cdn.elifesciences.org/articles/77185/elife-77185-fig5-data3-v1.xlsx
Additional files
-
Supplementary file 1
Supplementary material includes input pattern and parameter details.
- https://cdn.elifesciences.org/articles/77185/elife-77185-supp1-v1.docx
-
Transparent reporting form
- https://cdn.elifesciences.org/articles/77185/elife-77185-transrepform1-v1.docx
Download links
A two-part list of links to download the article, or parts of the article, in various formats.
Downloads (link to download the article as PDF)
Open citations (links to open the citations from this article in various online reference manager services)
Cite this article (links to download the citations from this article in formats compatible with various reference manager tools)
A neural network model of hippocampal contributions to category learning
eLife 12:e77185.
https://doi.org/10.7554/eLife.77185


