A phenotype-based forward genetic screen identifies Dnajb6 as a sick sinus syndrome gene
- Department of Biochemistry and Molecular Biology, Department of Cardiovascular Medicine, Mayo Clinic, United States
- The Affiliated Hospital of Qingdao University & The Biomedical Sciences Institute of Qingdao University (Qingdao Branch of SJTU Bio-X Institutes), Qingdao University, China
- Department of Medicine, School of Medicine and Public Health, University of Wisconsin-Madison, United States
- Department of Medicine, University of California, San Francisco, United States
- Division of Cardiology, Xinhua Hospital Affiliated to Shanghai Jiaotong University School Of Medicine, China
- Department of Cardiothoracic Surgery, Xiangya Hospital, Central South University, China
- Department of Cardiovascular Medicine, Jiading District Central Hospital Affiliated Shanghai University of Medicine & Health Science, China
- Department of Pharmacology, University of California, Davis, United States
- Department of Biomedical Engineering, University of California, Irvine, United States
- Department of Electrical Engineering and Computer Science, University of California, Irvine, United States
- Department of Epidemiology and Public Health, University of Maryland School of Medicine, United States
- Department of Pediatrics, McGovern Medical School, The University of Texas Health Science Center at Houston, United States
Figures
Figure 1 with 1 supplement
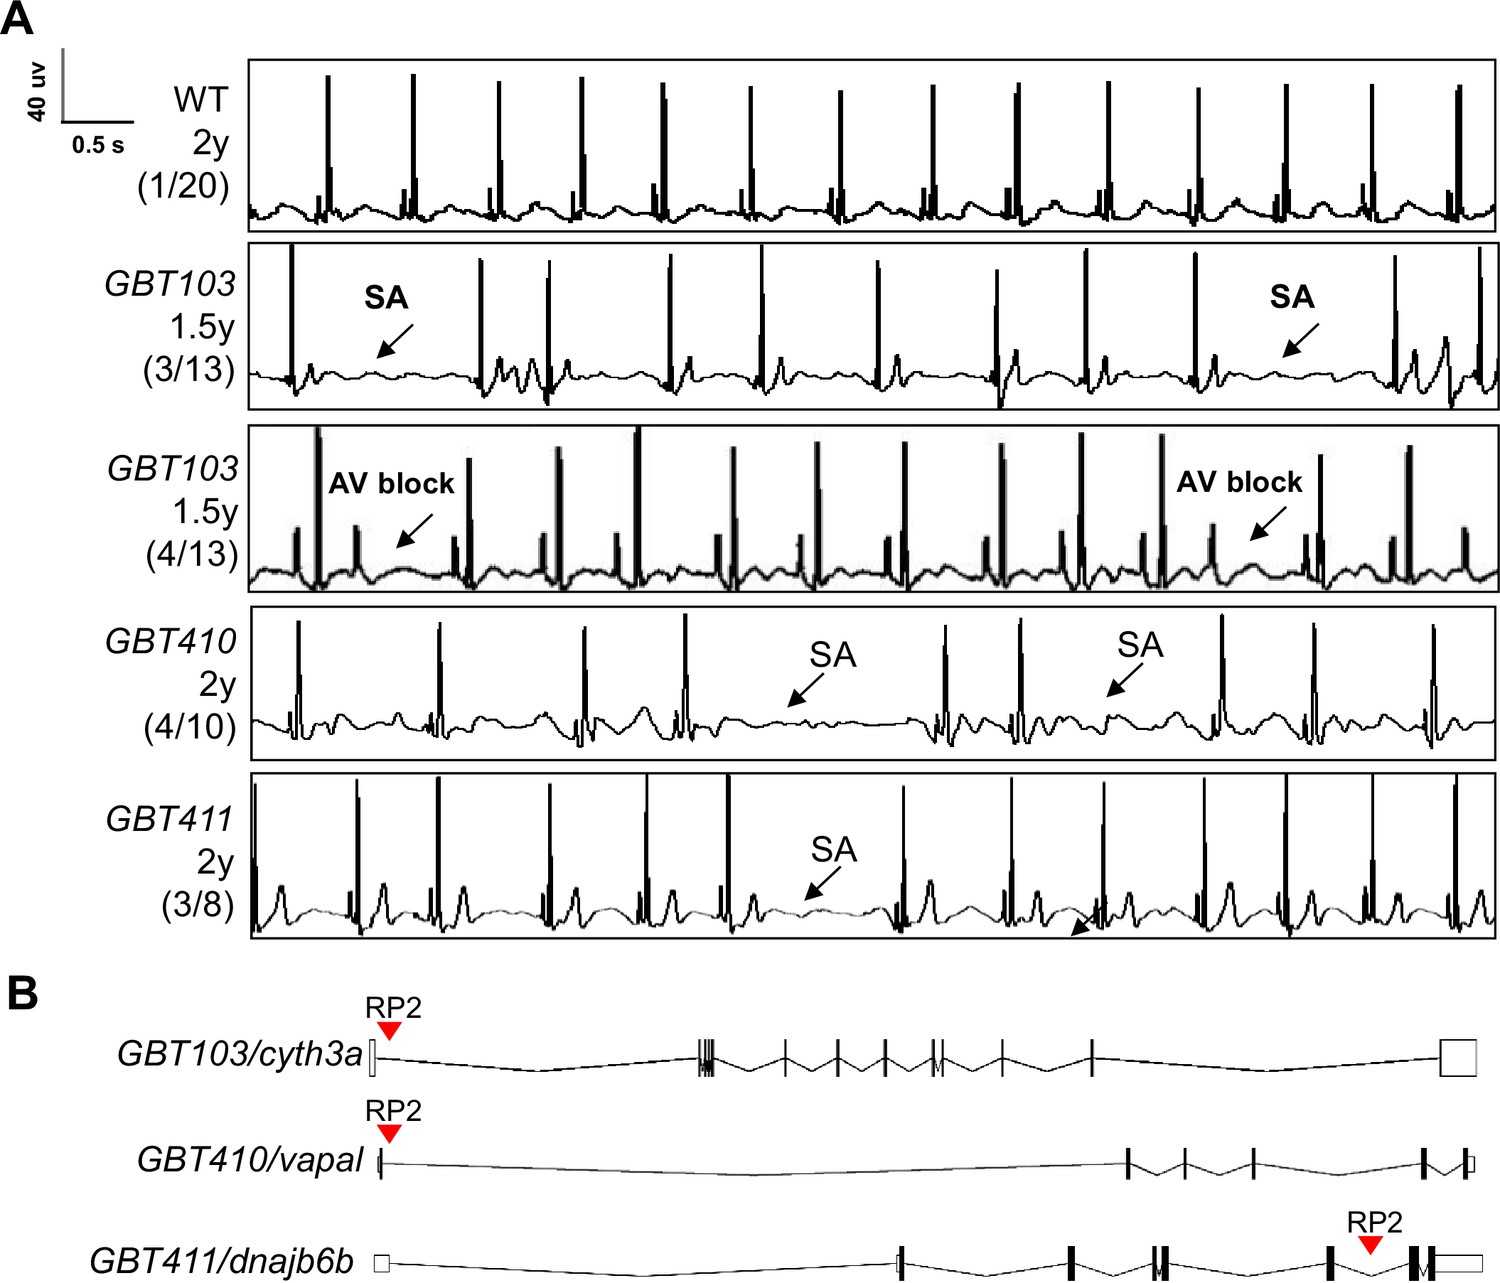
Screening of 35 ZIC lines identified three mutants with increased incidence of SA and/or AVB episodes.
(A) Representative ECG recordings for three heterozygous/homozygous GBT mutants with increased incidence of sinus arrest (SA) and/or atrioventricular block (AVB) episodes compared to WT control. (B) RP2 gene-break transposon insertional positions in the three candidate SSS mutants.
Figure 1—figure supplement 1
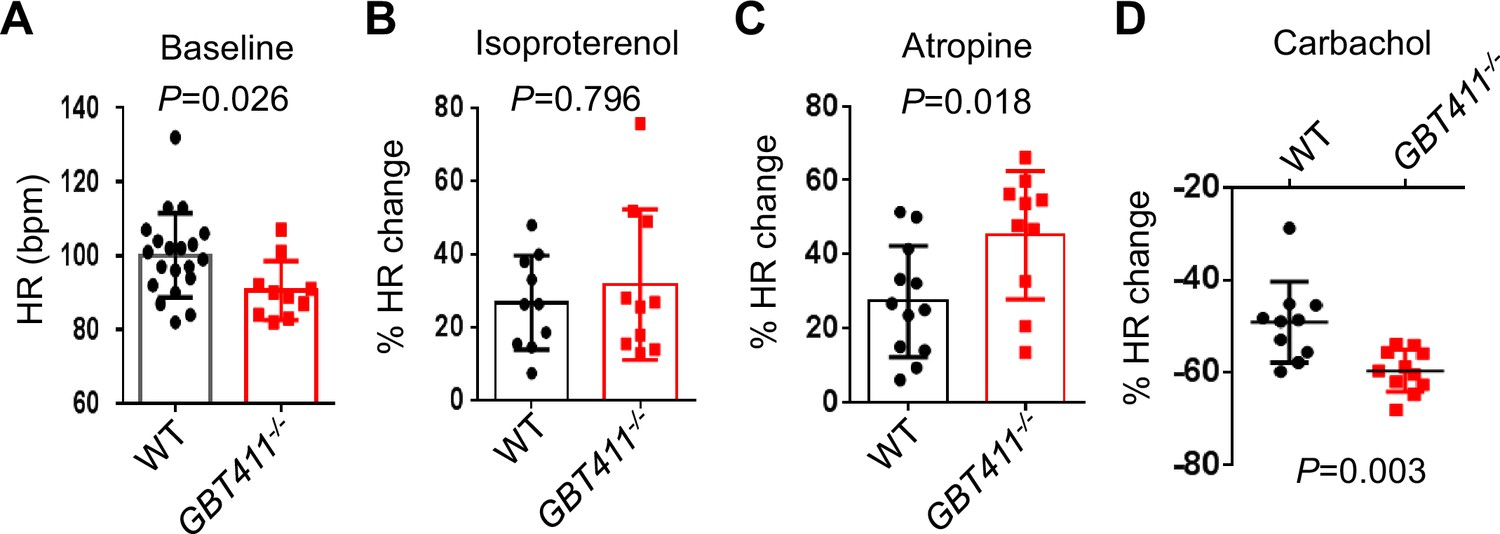
The GBT411 mutant displayed aberrant response to autonomic stimuli.
Shown are changes of HR in GBT411-/- homozygous fish at 16 months in response to different autonomic stimuli. N=9–20 animals per group, unpaired student’s t-test.
Figure 2
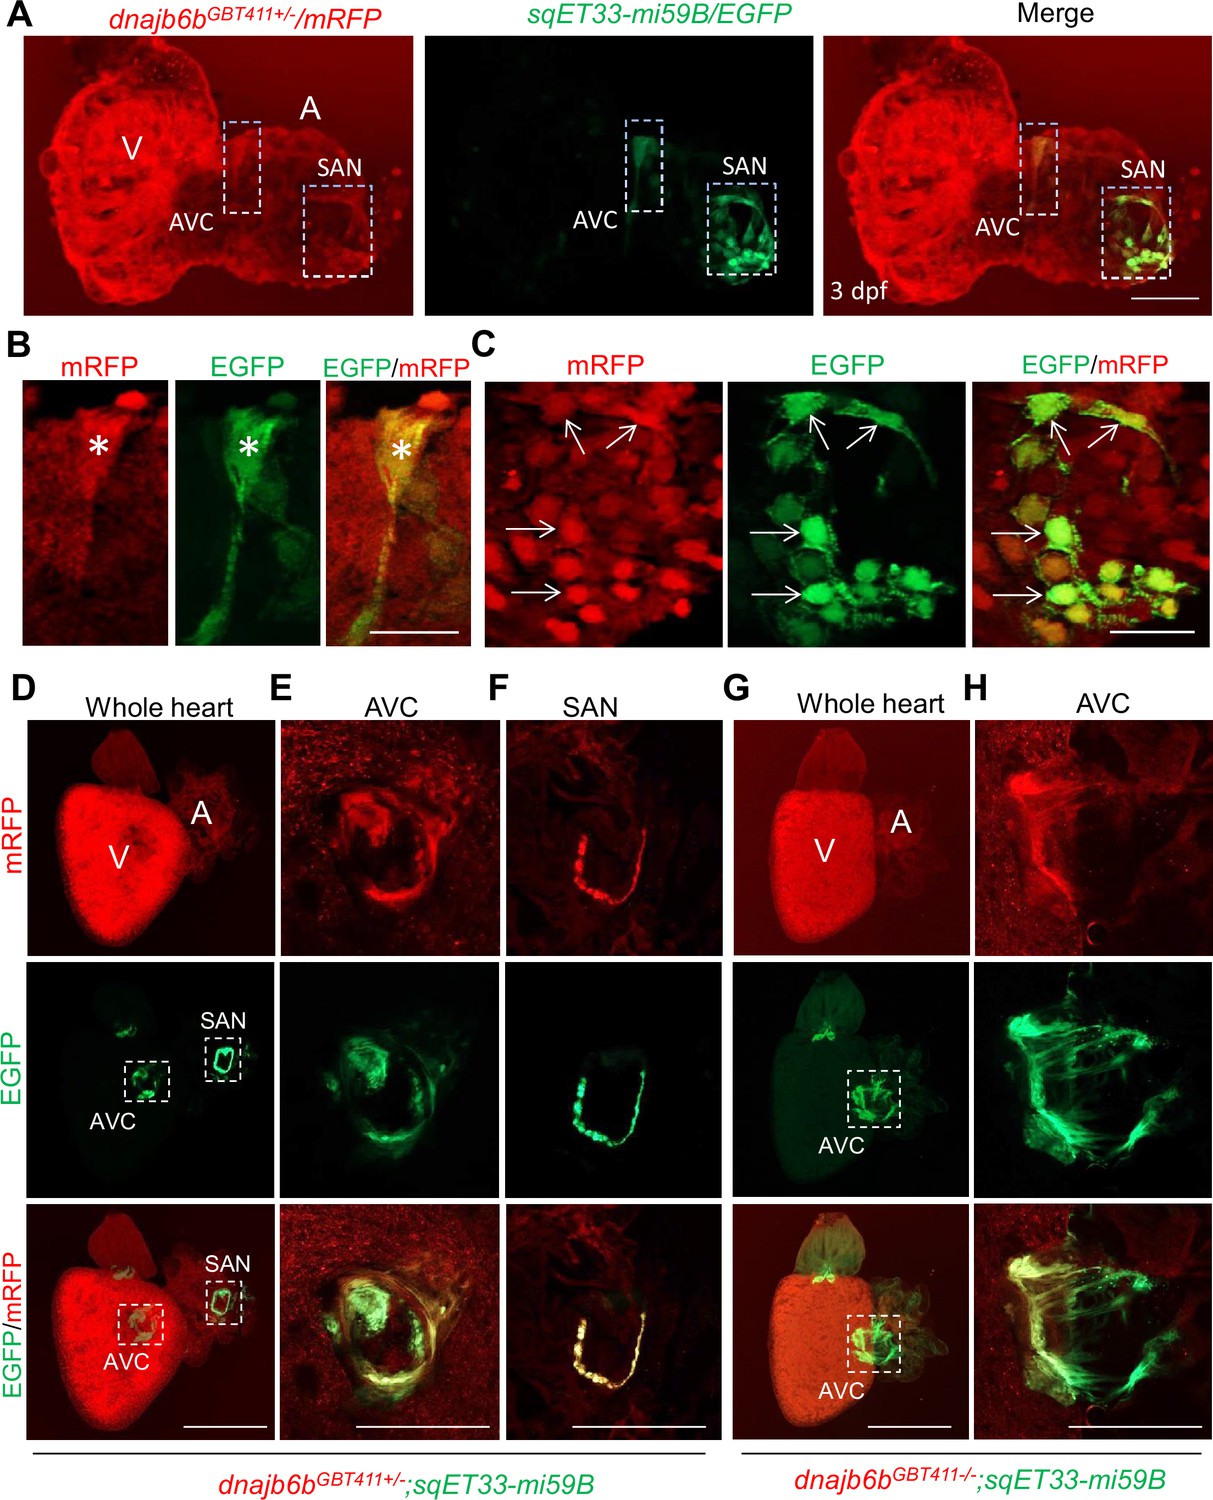
Expression and localization of Dnajb6b in zebrafish cardiac conduction system.
(A–C) Co-localization analysis of mRFP in GBT411/dnajb6b heterozygous mutant with the reporter line sqET33-mi59B in which EGFP labels cardiac conduction system (CCS) in zebrafish embryos. The mRFP reporter for the GBT411 tagged Dnajb6b protein partially overlaps with the EGFP reporter in the sqET33-mi59B transgenic line that labels atrio-ventricular canal (AVC) and sinoatrial node (SAN) in embryonic atrium at 3 dpf. Shown in (B) and (C) are higher magnification images of AVC and SAN in (A), respectively. Stars indicate EGFP + cells in the AVC, and arrows indicate EGFP + cells in the SAN. A: atrium. V: ventricle. dpf, days post-fertilization. (D–H) Co-localization analysis of EGFP in the sqET33-mi59B reporter line after crossed into the GBT411/dnajb6b heterozygous mutants (dnajb6bGBT411+/-;sqET33-mi59B) versus GBT411/dnajb6b homozygous mutants (dnajb6bGBT411-/-;sqET33-mi59B) in adult hearts. In the dnajb6bGBT411+/-;sqET33-mi59B, EGFP is mostly expressed in the AVC within a group of confined cells, and in SAN forming a ring-like structure, which co-localizes well with mRFP. Shown in (E) and (F) are higher magnification images of AVC and SAN in (D), respectively. In the dnajb6bGBT411-/-;sqET33-mi59B, EGFP is mostly detected in the AVC with a more diffused pattern. No ring-like structure with EGFP signal was detected in the SAN. Shown in (H) are higher magnification images of AVC in (G). Scale bars in A, 50 µm; In B, C, 20 µm; In D, G, 500 µm; In E, F, H, 200 µm.
Figure 3 with 1 supplement
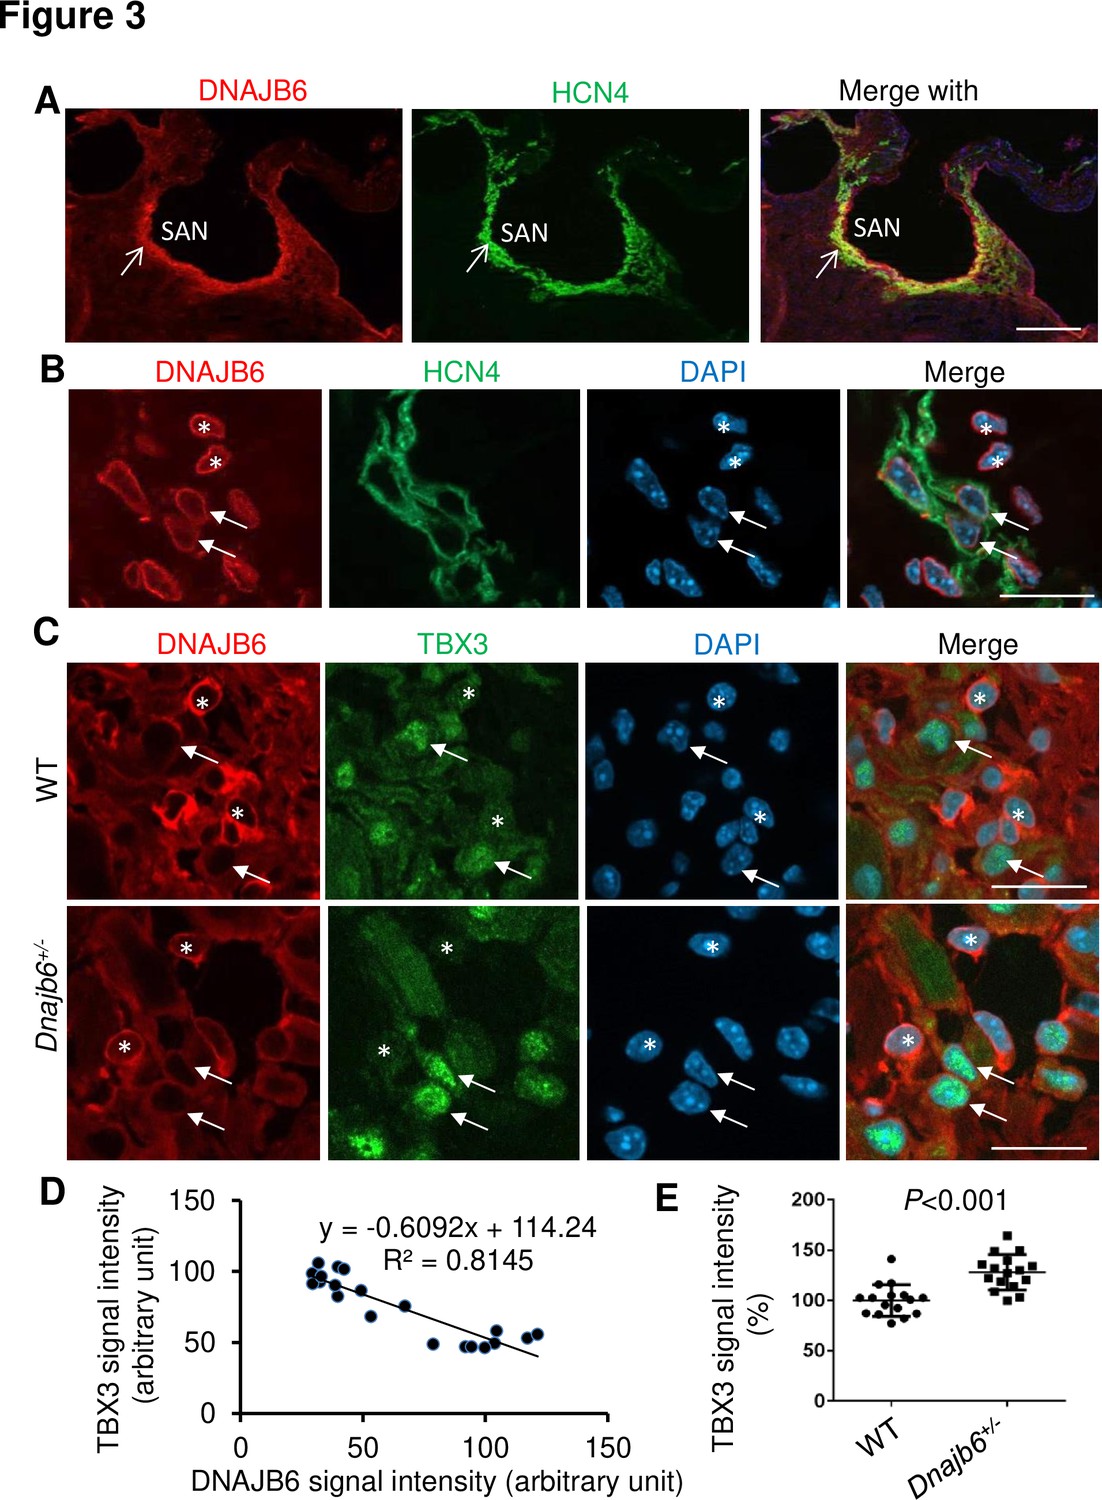
Expression and localization of DNAJB6 in the mouse SAN.
(A) The anti-DNAJB6 antibody immunostaining signal largely overlapped with the HCN4 immunostaining signal in the mouse SAN tissues under low magnification. (B) Under higher magnification, expression of DNAJB6 (red) only partially overlapped with HCN4 (green) as revealed by antibody co-immunostaining. Arrows point to cells with overlapping patterns. Stars indicate cells with no-overlapping. (C) Shown are fluorescent images after DNAJB6 and TBX3 antibody co-immunostaining indicating expression of DNAJB6 protein in the WT versus Dnajb6+/- +/- mouse SAN. Arrows point to cells with weak DNAJB6 but strong TBX3 immunostaining signal. Stars indicate cells with strong DNAJB6 but low level of TBX3 immunostaining signal. (D) Quantification and correlation analysis of DNAJB6 and TBX3 immunostaining signal in WT SAN. (E) Quantification analysis of TBX3 signal in the WT versus Dnajb6+/- mouse SAN. N=20 cells. Unpaired student’s t-test. Scale bars in A, 50 µm; In B, C, D, 20 µm.
Figure 3—figure supplement 1
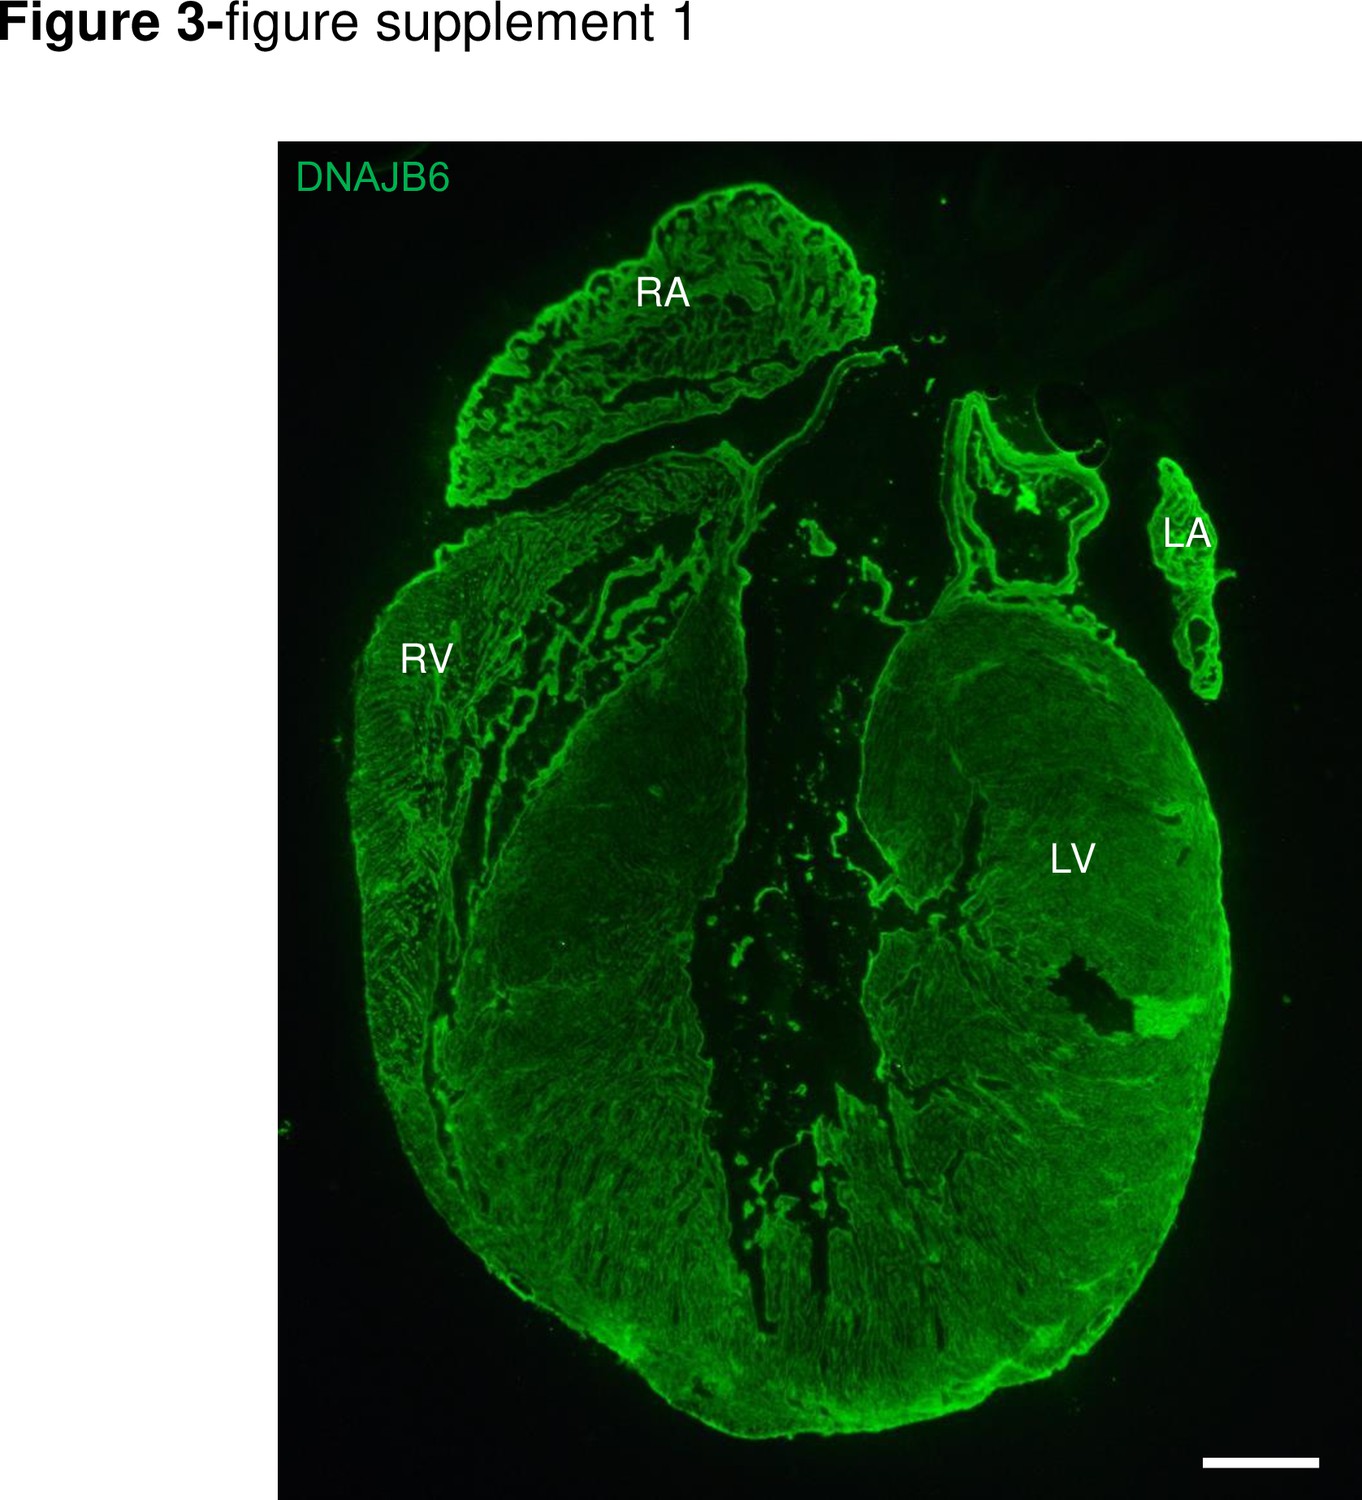
DNAJB6 is ubiquitously expressed in 4 cardiac chambers in mouse.
Shown are immunostaining of a whole mice heart section using an anti-DNAJB6 antibody. Scale bar: 50 μm. RA, rigt atrium. RV, right ventricle. LA, left atrium. LV, left ventricle.
Figure 4 with 1 supplement

Dnajb6+/- mice exhibited increased incidence of SA and AVB and impaired response to autonomic stimuli.
(A) Schematics of the Dnajb6 knockout (KO) mice. The insertion of Velocigene cassette ZEN-Ub1 created a deletion of 36,843 bp nucleotides spanning from the first to the last intron of the Dnajb6 gene at the Chromosome 5. The neomycin selection cassette was excised after crossed to a Cre expression line. (B) Representative DNA gel images of PCR genotyping for identifying WT (300 bp), Dnajb6+/- heterozygous (hets), and Dnajb6-/-homozygous (homo) mutant alleles . (C) Western blotting and quantification of DNAJB6 short (S) and long (L) protein expression in WT and Dnajb6 mutants. N=3 animal per group. (D) Shown are representative ECG recordings results showing SA and AVB phenotypes detected in the Dnajb6+/- mice at 6 months. (E) The Dnajb6+/- mice manifests impaired response to different autonomic stimuli. N=10–12 mice per group, unpaired student’s t-test. SA, sinus arrest. AVB, atrioventricular block.
-
Figure 4—source data 1
Uncropped DNA gel image of PCR genotyping for identifying WT and DNAJB6 mutant mouse alleles (in PPT format).
- https://cdn.elifesciences.org/articles/77327/elife-77327-fig4-data1-v2.zip
-
Figure 4—source data 2
Uncropped Western blot to show expression levels of DNAJB6 short (S) and long (L) proteins in WT and DNAJB6 mutants (in JPG format).
- https://cdn.elifesciences.org/articles/77327/elife-77327-fig4-data2-v2.zip
-
Figure 4—source data 3
Uncropped Western blot to show expression levels of DNAJB6 short (S) and long (L) proteins in WT and DNAJB6 mutants (in PPT format).
- https://cdn.elifesciences.org/articles/77327/elife-77327-fig4-data3-v2.zip
-
Figure 4—source data 4
Uncropped Western blot to show expression levels of DNAJB6 short (S) and long (L) proteins in WT and DNAJB6 mutants (in JPG format).
- https://cdn.elifesciences.org/articles/77327/elife-77327-fig4-data4-v2.zip
Figure 4—figure supplement 1
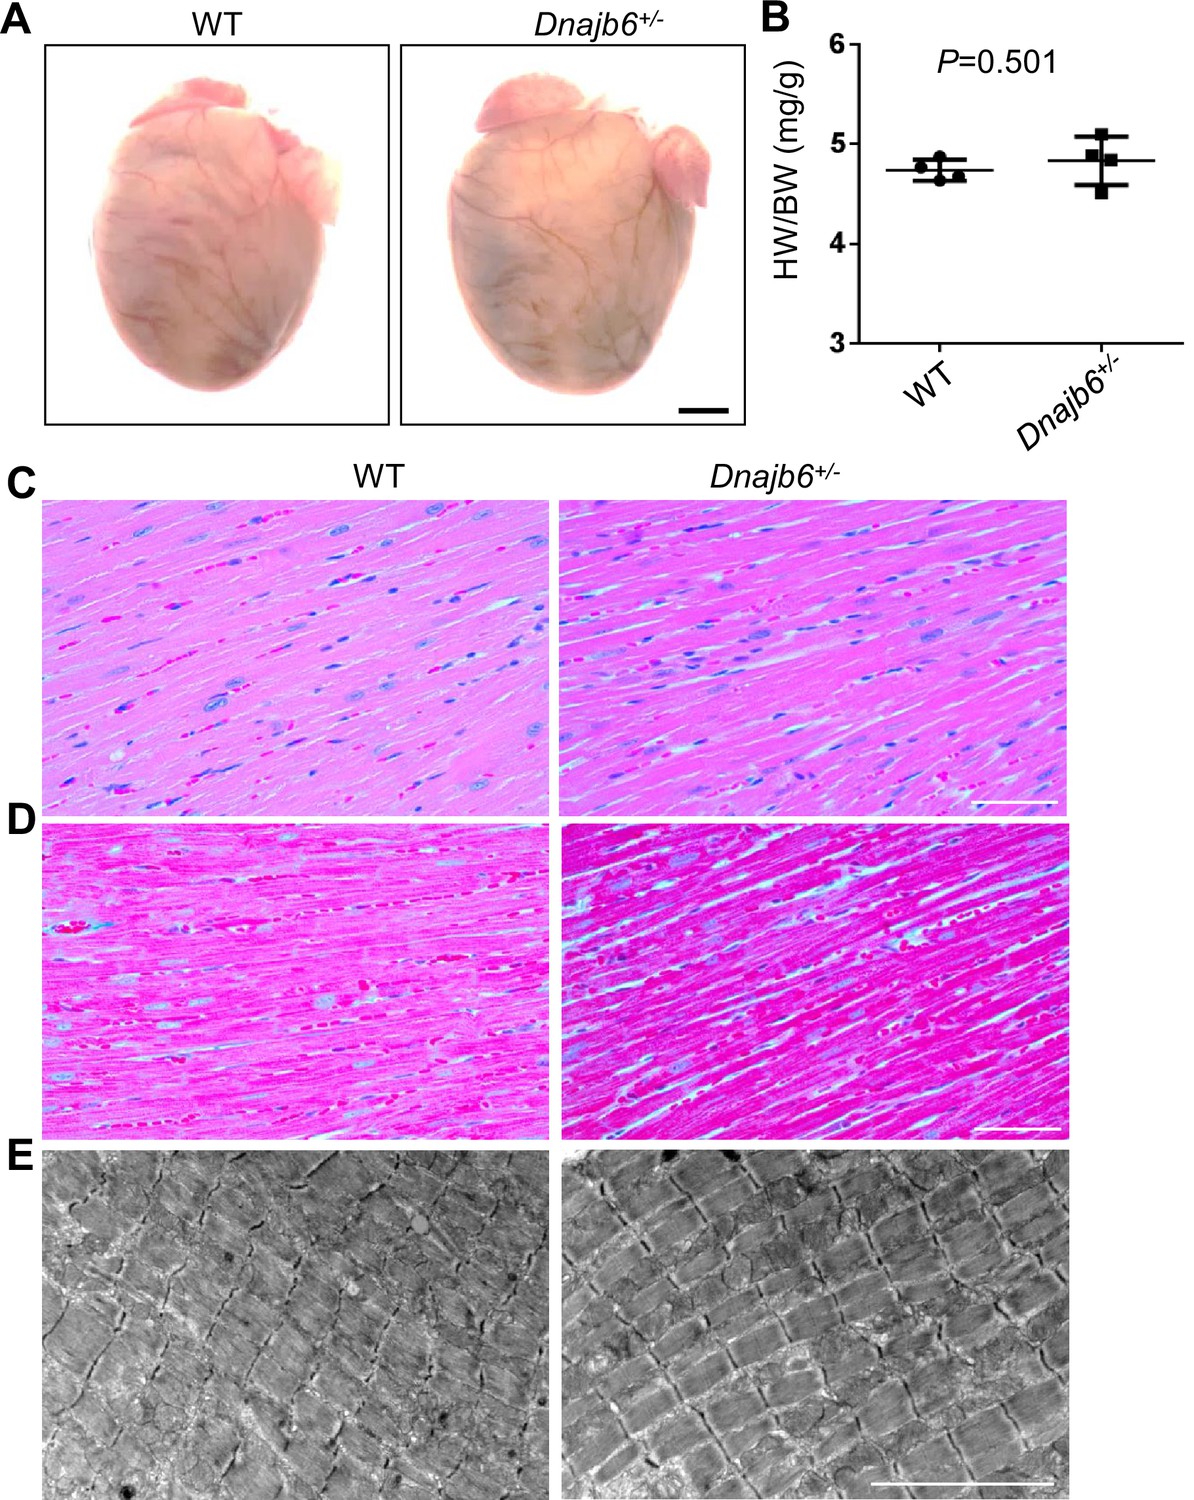
No abnormal myocardium structural remodeling was detected In the Dnajb6+/- mice.
(A) Heart morphology of Dnajb6+/- mice compared to WT control at 1 year of age. (B) Quantification analysis of heart weight normalized by body weight (HW/BW) of Dnajb6+/- mice compared to WT control at 1 year of age. N=4, unpaired student t test. (C–E) Shown are histology images of H&E staining (C), Masson’s Trichrome staining (D), and transmission electron microscope (E) indicating the myocardium structure of Dnajb6+/- mice appeared to be indistinguishable to that in WT control. Scale bars in A, 1 mm; In C, D, 100 µm; In E, 5 um.
Figure 5 with 2 supplements

SAN dysfunction in the Dnajb6+/- mice.
(A) Leading pacemakers were located and plotted from both WT (blue dots) and Dnajb6+/- (red dots) mice. One mouse could have multiple leading pacemaker locations due to the competing pacemakers and ectopic activities. SVC and IVC, superior and inferior vena cava; RAA, right atrial appendage; CT, crista terminalis; IAS, inter-atrial septum; AVN, atrioventricular node. Distribution of the leading pacemakers is summarized in panel. (B) Majority of leading pacemakers located within the SAN area in WT, whereas, in Dnajb6+/- mice, significant increase of leading pacemakers locating in subsidiary pacemaker area and IAS was observed. p-value by Fisher exact test. (C–D) Activation map based on the optical mapping of action potentials showed representative leading pacemaker locations in WT (SAN) and Dnajb6+/- mice (SAN and IAS areas). (E) Optical mapping on isolated atrial preparation showed bradycardia (baseline) and different responses of heart rate during isoproterenol, atropine, and carbachol stimulations between WT and Dnajb6+/- mice. N=7–9 mice per group. Unpaired student’s t-test. (F) Increased cycle length (CL) variation was observed in Dnajb6+/- isolated atrial preparations during different autonomic stimulations. N = 7–9 mice per group, unpaired student’s t-test.
Figure 5—figure supplement 1
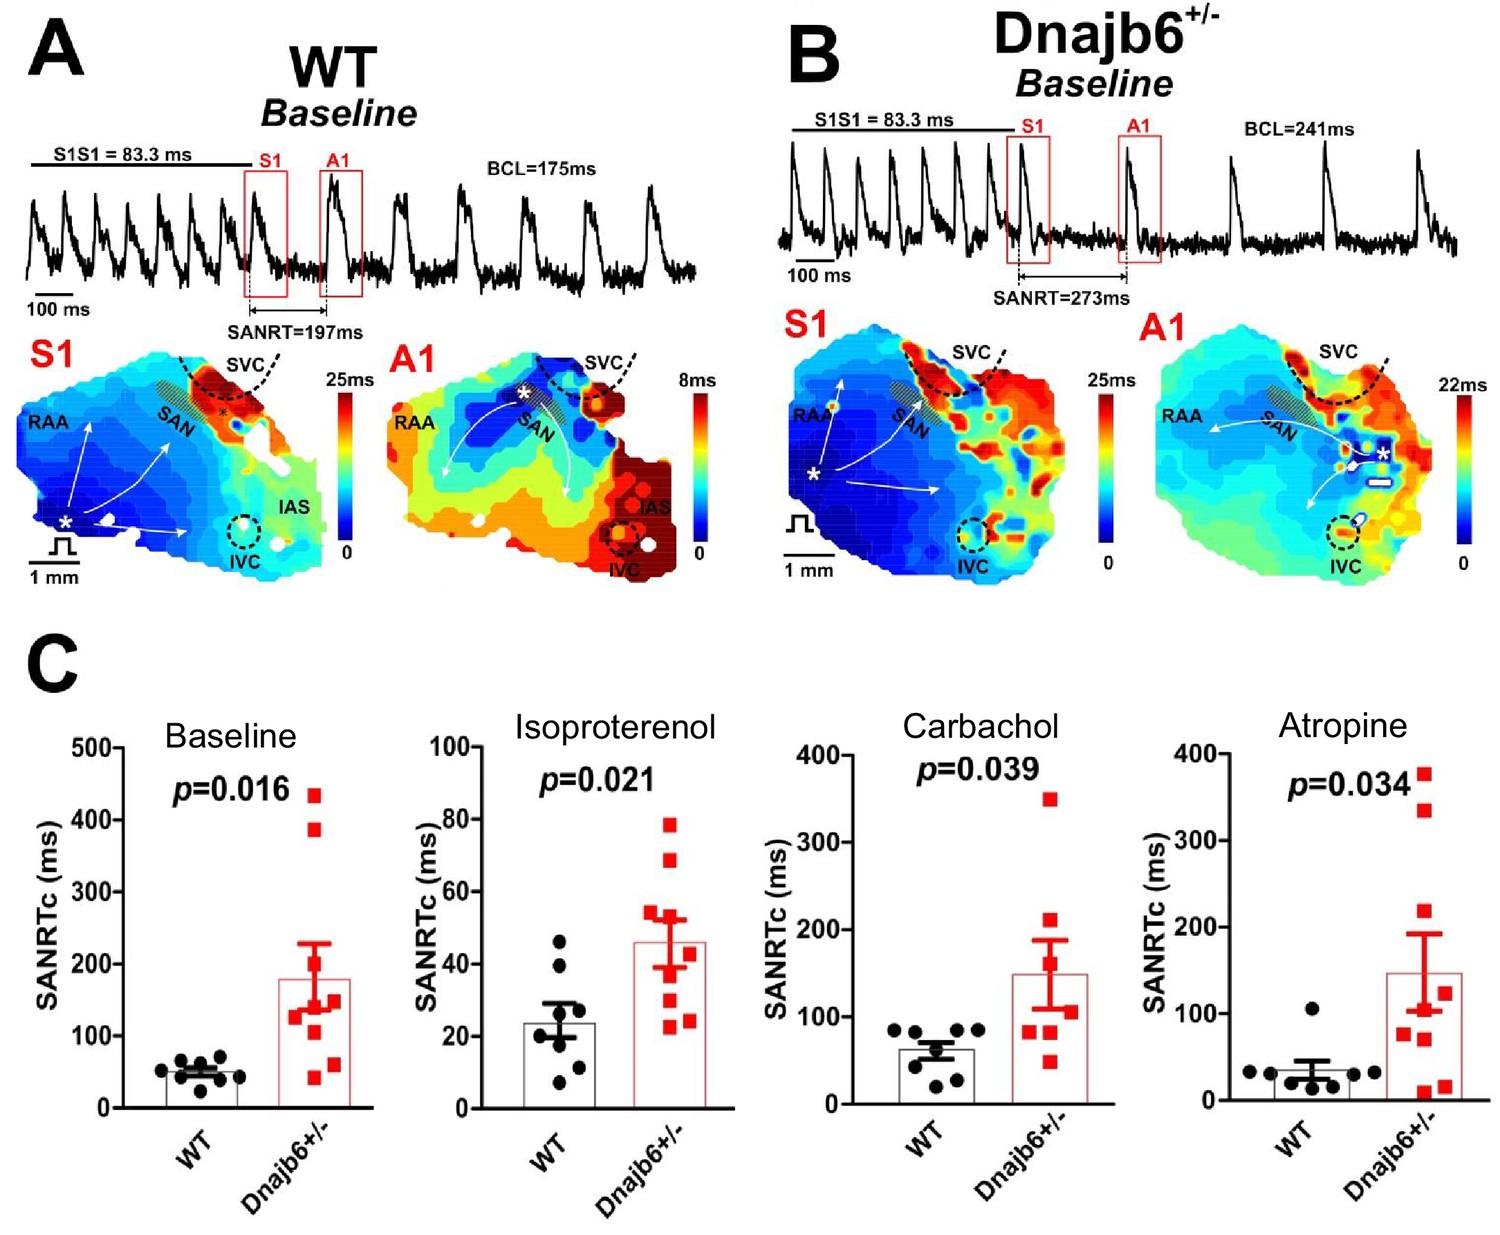
Sinus node recovery time was prolonged in the Dnajb6+/- mice.
(A–B) Representative activation maps reconstructed for the last pacing stimulus (S1) and the first spontaneous post-pacing atrial beat (A1) during SAN recovery time (SANRT) measurements are shown. A site of the earliest atrial activation is labeled by a white asterisk. In Dnajb6+/- group, unlike WT, the first spontaneous post-pacing atrial beat (A1) originated from an ectopic location outside of the anatomically and functionally defined SAN area. (C) Summarized data for corrected SANRT (+/-) measured during different autonomic stimulations is shown. N=7–9 mice per group, unpaired student’s t-test.
Figure 5—figure supplement 2
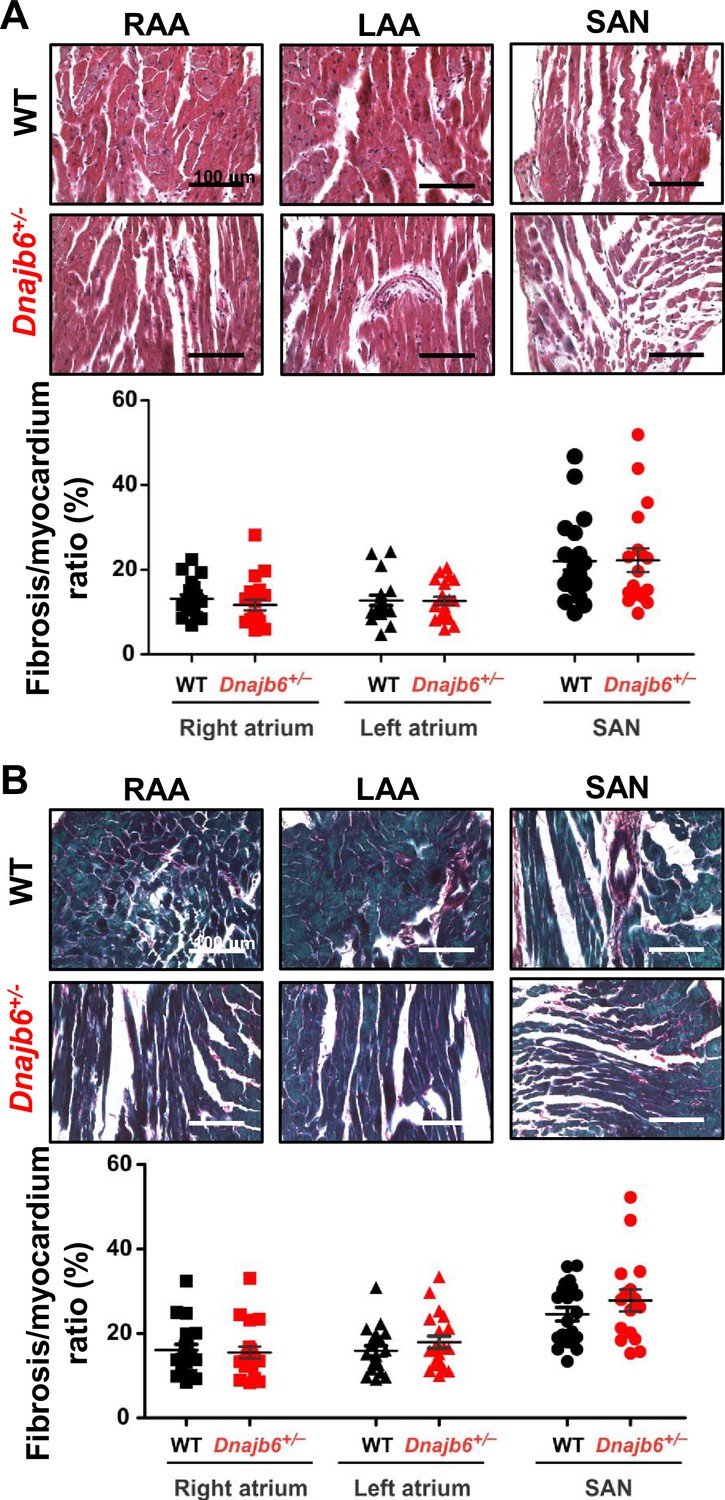
Fibrotic tissue content in atrial and SAN myocardium of Dnajb6+/-vs.WT mice.
(A–B) Masson’s Trichrome (A) and Picrosirius Red (B) staining of WT and Dnajb6+/- mice are shown for left (LAA) and right (RAA) atrial appendages as well as SAN regions. Below the representative images, summarized data for fibrotic to myocardial tissue ratio are shown for each staining. N=4 mice per group. Scale bars, 100 µm.
Figure 6
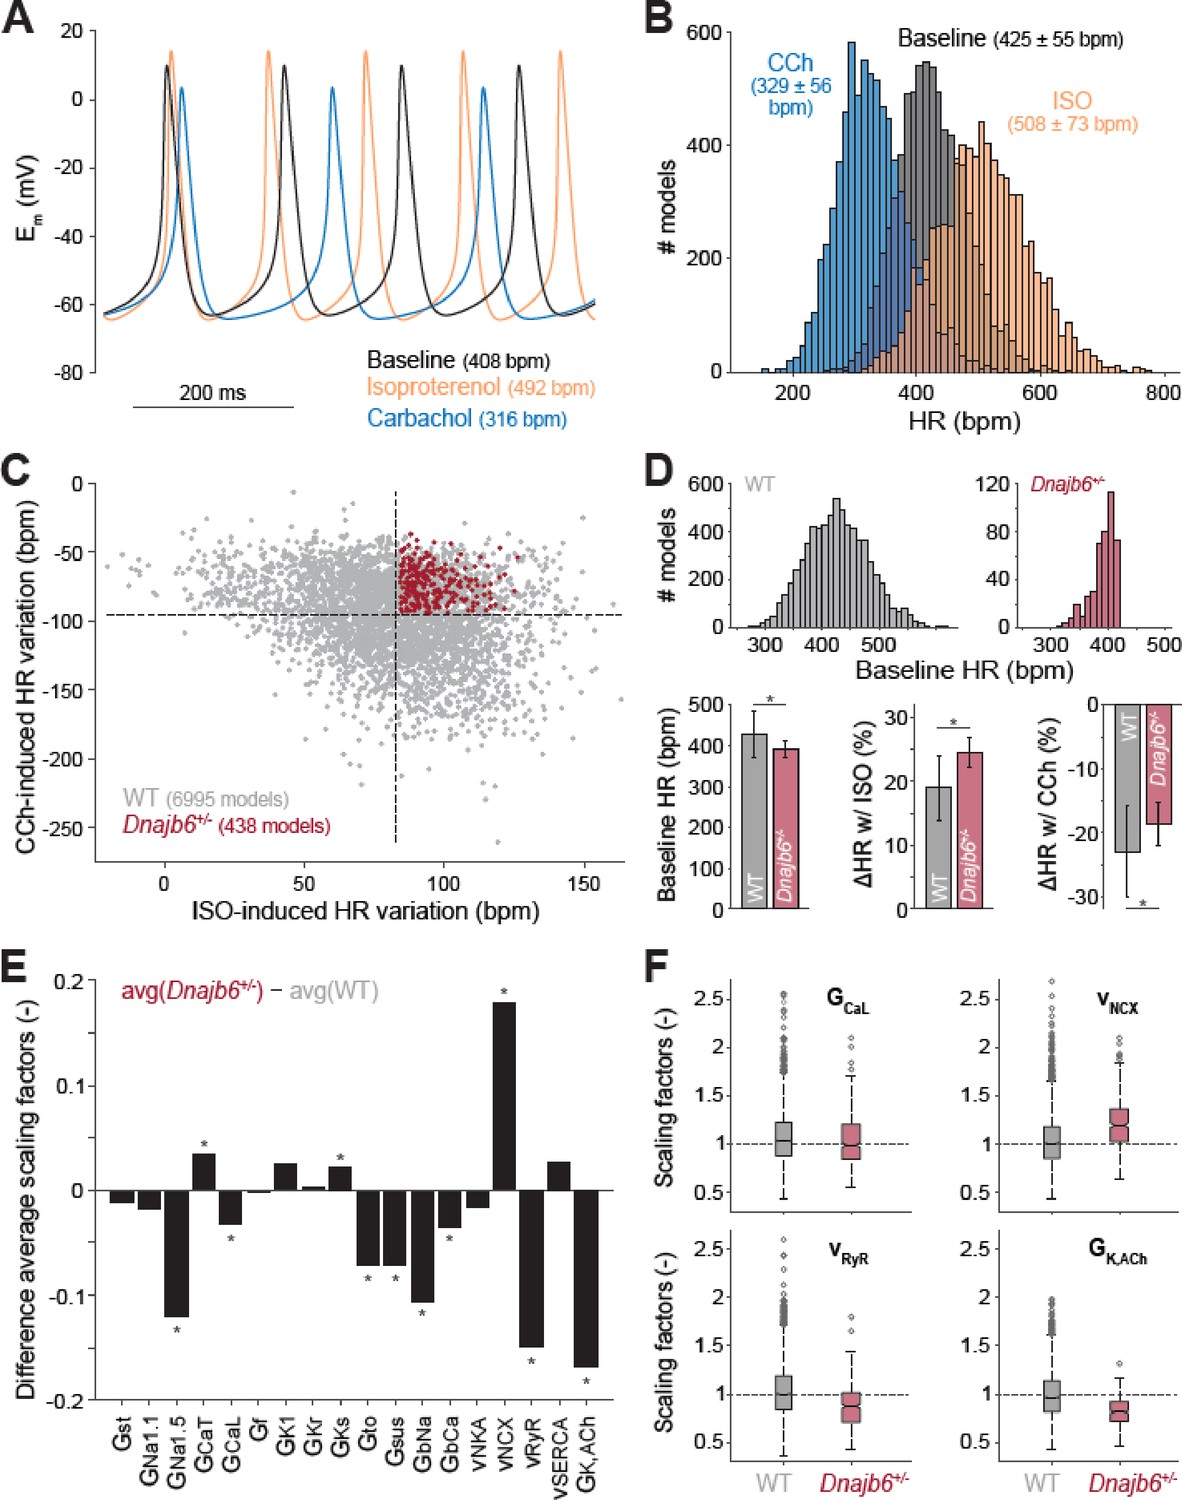
Computational analysis of the cellular mechanisms underlying the SSS phenotype observed in ex vivo mouse experiments.
(A) Time course of membrane potential (Em) predicted simulating our computational model of mouse SAN myocyte before (baseline) and after administration of isoproterenol (ISO) or carbachol (CCh). (B) Histogram illustrating the effects of ISO and CCh administration on firing rate (HR) distribution in our population of models. (C) Scatter plot quantifying HR variation in each model in the population. Red dots correspond to model variants resembling properties observed in ex vivo Dnajb6+/- mouse experiments ( +/- slower baseline HR, enhanced response to ISO, and reduced response to CCh), while the remaining model variants in grey mimic WT mouse functional measurements. (D) Histograms comparing the distribution of baseline HR in the two subgroups, and bar graphs reporting average ( ± SD) baseline HR, and relative HR variation after ISO and CCh administration in the two subgroups. (E) Bar graph reporting the differences between average model parameters’ scaling factors in the two subgroups. Note that a positive (negative) bar corresponds to increased (decreased) average parameter value in Dnajb6+/- vs. WT groups. Asterisks in panels D and E indicate significant difference according to the 2-sided Wilcoxon rank sum test (performed with the MATALB function ranksum). (F) Statistical analysis on the values of scaling factors of selected model parameters (GCaL, vNCX, vRyR, and GK,ACh) performed with the MATLAB command boxplot. The central line indicates the median of each group (q50). The central box represents the central +/- % of the data, with lower and upper boundaries corresponding, respectively, to the 25th and 75th percentiles (q25 and q75). The dotted vertical lines extend to 1.5 times the height of box, and individual values falling outside this range (shown here with grey circles) are considered outliers. The extremes of the lateral notches of the central box (determined as q50 ± 1.57(q75–q25)/sqrt(n), where n is the number of observations in each group) mark the 95% confidence interval for the medians. When the notches from two boxplots do not overlap, as in the four cases shown here, one can assume that the medians are different with a significance level of 0.05.
Figure 7 with 1 supplement
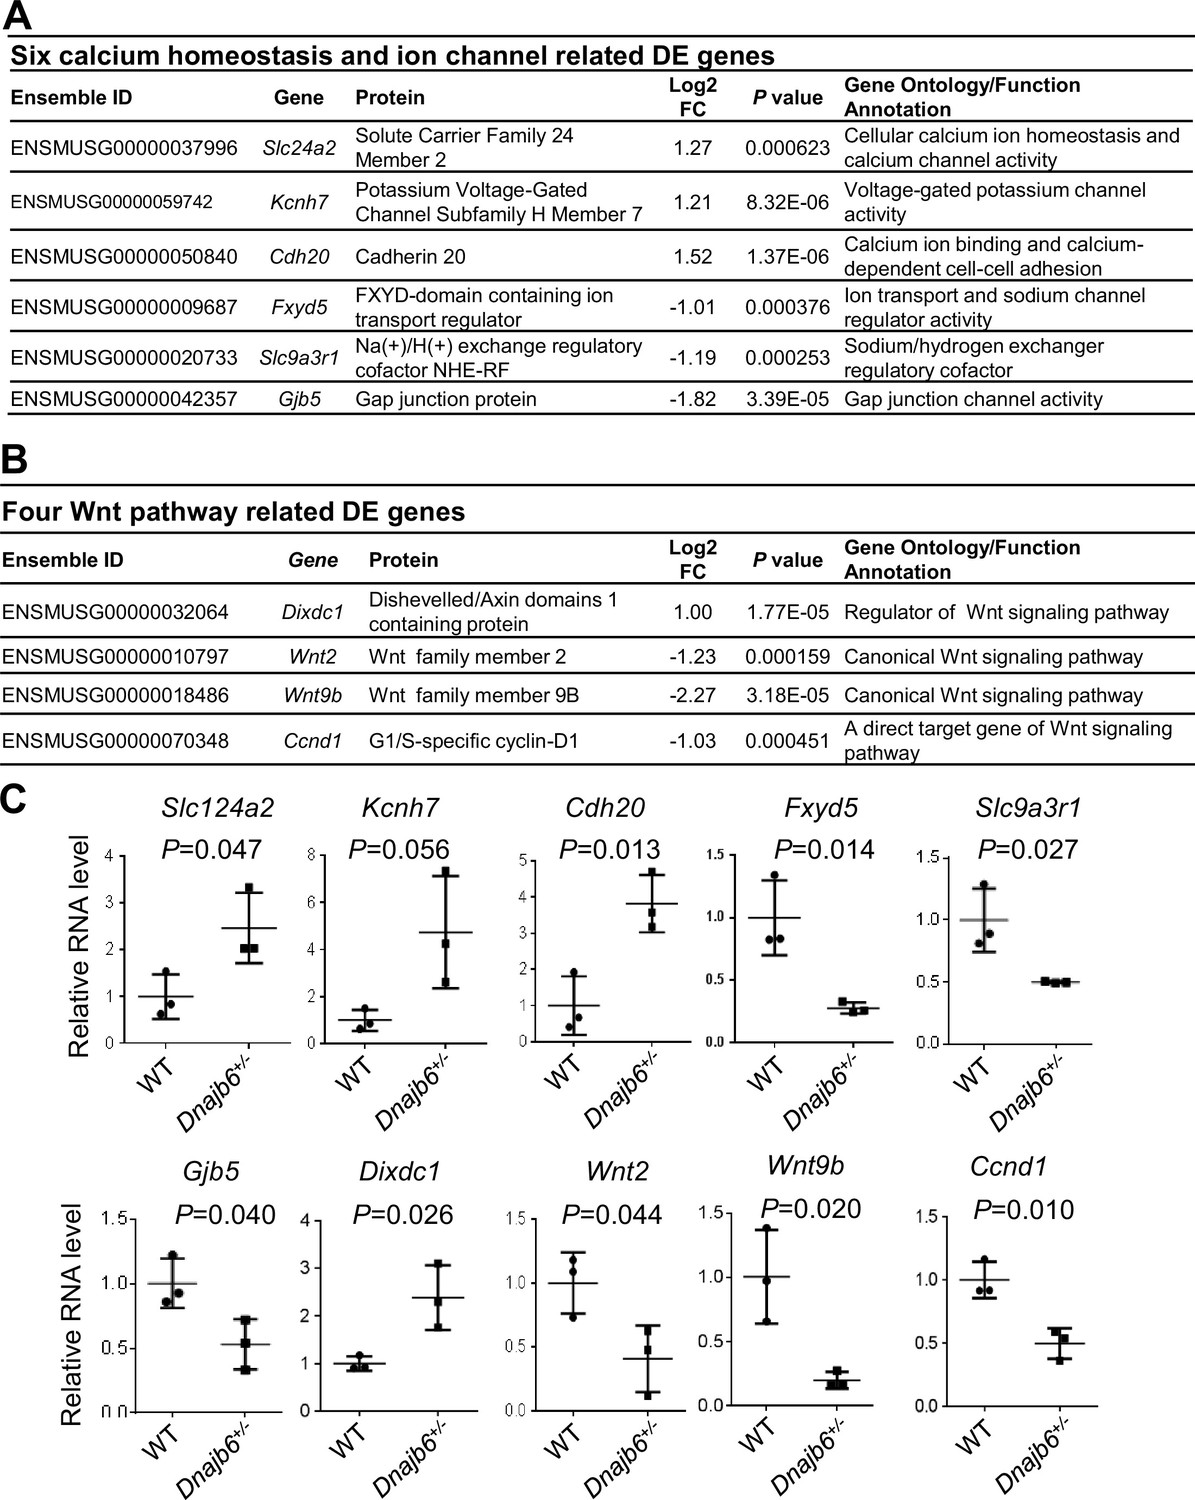
Transcriptomes are altered in the atrium of Dnajb6+/- mice.
(A) Expression of six calcium homeostasis and ion channel related genes were altered in the Dnajb6+/- mice right atrium. (B) Expression of four Wnt pathway related genes were altered in the Dnajb6+/- mice right atrium. (C) Quantitative polymerase chain reaction (qPCR) validation of DE genes listed in A and B, normalized to Gapdh; RNA was extracted from an individual moue right atrium, which was considered a single biological replicate. Samples were collected in triplicate. N=3 mice per group, unpaired student’s t-test.
-
Figure 7—source data 1
A list of 107 differentially expressed genes identified between DNAJB6+/- knockout and WT mouse.
- https://cdn.elifesciences.org/articles/77327/elife-77327-fig7-data1-v2.xlsx
Figure 7—figure supplement 1
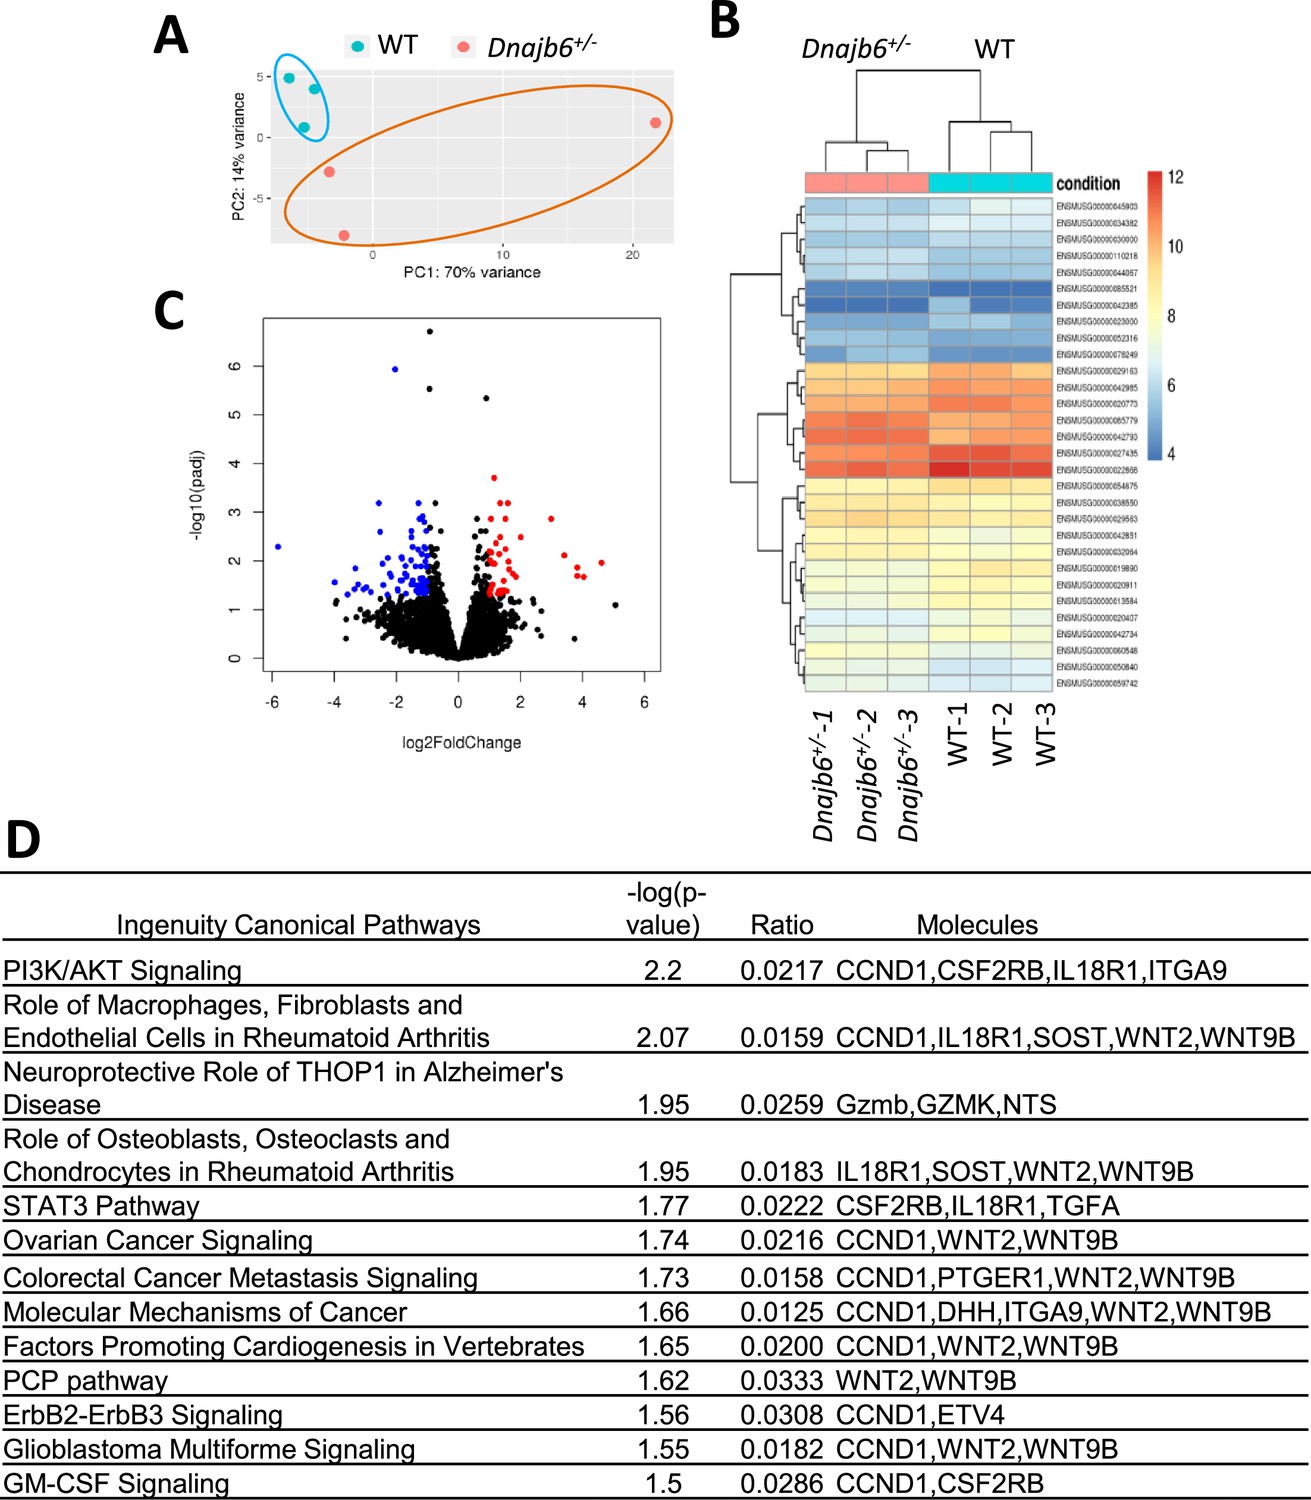
RNA sequencing identifies transcriptome changes in the Dnajb6+/- mice atrium.
(A) Principal component analysis (PCA) reveals the variance in transcriptome distribution in the Dnajb6+/- mice and WT controls at 6 months. Each point represents the projections of individual hearts onto principal component (PC). (B) Heatmap of genes differentially expressed in the Dnajb6+/- mice and WT controls. Each column represents an individual replicate and there are 3 replicates per group. Each row represents an individual gene. The color bar represents relative expression of log-transformed, normalized counts with upregulated genes shown in red and downregulated genes in blue. (C) Volcano plot shows magnitude and significance of genes that altered in distribution in the Dnajb6+/- mice and WT controls. Genes that significantly downregulated in the Dnajb6+/- mice are plotted in blue (left) and upregulated are plotted in red (right). (D) Ingenuity Pathway Analysis (IPA) of differentially expressed genes in the Dnajb6+/- mice and WT controls. Signaling pathways are organized in the order of significance as –log10 of P value.
Author response image 1
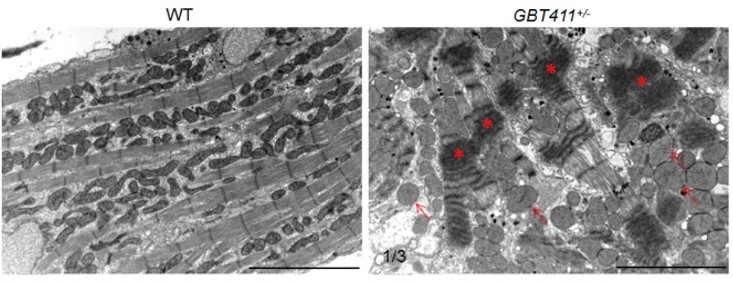
Myocardium structural defects were detected in the GBT411 heterozygous mutant at 2 years of age.
Shown are transmission electron microscopy micros (TEM) images of WT and GBT411 heterozygous mutant heart ventricles at 2 years of age. Arrows point to round-shape and swollen mitochondrial. Stars indicate degenerated sarcomeric Z-discs. Scale bars, 5µm.
Author response image 2
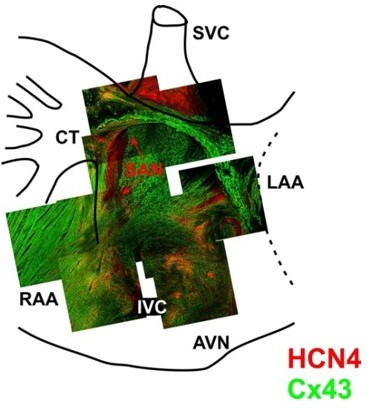
3-D reconstruction of the entire mouse SAN preparations was used for immunofluorescent labeling of connexin 43 (Cx43, green) and HCN4 (red).
Mosaic images were created by superimposing of 3-D Z-stacks (averaged through 30-50 scanned layers; 50-200 μm thickness) of different regions throughout the SAN pacemaker complex. Pacemaker regions are shown to be characterized by HCN4-positive staining. From Glukhov et al. Eur Heart J. 2015 Mar 14;36(11):686-97.
Tables
Table 1
Collection of 35 zebrafish insertional cardiac (ZIC) mutants.
| GBT # | Gene ID | Human ortholog | Insertion position | OMIM# |
|---|---|---|---|---|
| GBT001 | casz1 | CASZ1 | 5’ UTR | 609895 |
| GBT002 | sorbs2b | SORBS2 | 1st intron | 616349 |
| GBT103 | cyth3a | CYTH3 | 1st intron | 605081 |
| GBT130 | lrp1b | LRP1 | 73rd intron | 107770 |
| GBT135 | bhlhe41 | BHLHE41 | 2nd intron | 606200 |
| GBT136 | ano5a | ANO5 | 1st intron | 608662 |
| GBT145 | epn2 | EPN2 | 1st intron | 607263 |
| GBT166 | atp1b2a | ATP1B2A | 1st intron | 182331 |
| GBT235 | Irpprc | LRPPRC | 22nd intron | 607544 |
| GBT239 | map7d1b | MAP7D1 | 1st intron | NA |
| GBT249 | b2ml | B2M | 1st intron | 109700 |
| GBT250 | ptprm | PTPRM | 1st intron | 176888 |
| GBT268 | idh2 | IDH2 | 12th intron | 147650 |
| GBT298 | zgc:194659 | NA | 1st intron | NA |
| GBT270 | zpfm2a | ZFPM2 | 2nd intron* | 603693 |
| GBT299 | dph1 | DPH1 | 1st intron | 603527 |
| GBT340 | nfatc3 | NFATC3 | 1st intron | 602698 |
| GBT345 | amot | AMOT | 1st intron | 300410 |
| GBT360 | tefm | TEFM | 1st intron | NA |
| GBT361 | abr | ABR | 3’ UTR | 600365 |
| GBT364 | mat2aa | MAT2A | 1st intron | 601468 |
| GBT386 | babam1 | BABAM1 | 2nd intron | 612766 |
| GBT402 | scaf11 | SCAF11 | 2nd intron | 603668 |
| GBT410 | vapal | VAPA | 1st intron | 605703 |
| GBT411 | dnajb6 | DNAJB6 | 6th intron* | 611332 |
| GBT412 | xpo7 | XPO7 | 1st intron | 606140 |
| GBT415 | arrdc1b | ARRDC1 | 1st intron | NA |
| GBT416 | csrnp1b | CSRNP1 | 1st intron* | 606458 |
| GBT419 | rxraa | RXRA | 1st intron* | 180245 |
| GBT422 | insrb | INSR | 6th intron | 147670 |
| GBT424 | v2rl1 | VMN2R1 | 2nd intron | NA |
| GBT425 | mrps18b | MRPS18B | 5th intron | 611982 |
| GBT503 | stat1a | STAT1 | 6th intron* | 600555 |
| GBT513 | map2k6 | MAP2K6 | 1st intron | 601254 |
| GBT589 | oxsr1b | OXSR1 | 3rd intron | 604046 |
-
OMIM, Online Mendelian Inheritance in Man; NA, not available.
Table 2
ECG quantification to validate three GBT lines as SA mutants in homozygous fish.
| Genotype | Age | N | SA incidence (%) | AVB incidence (%) | Heart rate (bpm) |
|---|---|---|---|---|---|
| WT | 16 m | 20 | 1 (5.0) | 0 (0) | 100.1±11.1 |
| GBT103-/- | 16 m | 7 | 4 (57.1)* | 1 (14.3) | 89.1±9.1. |
| GBT410-/- | 16 m | 9 | 4 (44.4)* | 0 (0) | 99.9±17.7 |
| GBT411-/- | 16 m | 10 | 4 (40.0)* | 1 (10.0) | 90.6±7.5* |
-
N=7-20.
-
*
, p<0.05, data are expressed as mean ± SEM. For SA incidence comparison, Chi-square test. For heart rate comparison, unpaired student’s t-test.
-
SA, sinus arrest. AVB, atrioventricular block. bpm, beats per minute.
Table 3
Echocardiography indices in the Dnajb6+/- mice compared to WT controls at 1 year.
| WT | Dnajb6+/- | p alue | |
|---|---|---|---|
| Mice number (n) | 6 | 6 | |
| HR (bpm) | 481±16 | 447±11 | 0.0017 |
| IVSd (mm) | 0.73±0.08 | 0.80±0.06 | 0.0895 |
| LVIDd (mm) | 3.92±0.33 | 3.71±0.18 | 0.2022 |
| LVPWd (mm) | 0.80±0.05 | 0.81±0.03 | 0.5204 |
| IVSs (mm) | 1.10±0.0.07 | 1.11±0.08 | 0.7878 |
| LVIDs (mm) | 2.95±0.26 | 2.77±0.15 | 0.1821 |
| LVPWs (mm) | 1.11±0.06 | 1.21±0.12 | 0.1000 |
| LVEF (%,Cube) | 57.17±5.95 | 58.17±3.92 | 0.7380 |
| LVEF (%, Teich) | 55.50±5.82 | 56.67±4.23 | 0.6996 |
| LVFS (%) | 24.67±3.61 | 25.17±2.32 | 0.7813 |
| LVd Mass (g) | 0.69±0.01 | 0.68±0.01 | 0.7650 |
| LVs Mass (g) | 0.69±0.01 | 0.69±0.01 | 1.0000 |
-
HR, heart rate; bpm, beats per minute; IVSd, Interventricular septum thickness at end–diastole; LVIDd, left ventricular internal dimension at end-diastole; LVPWd, left ventricular internal dimension at end-diastole; IVSs, Interventricular septum thickness at end–systole; LVIDs, Left ventricular internal dimension at end-systole; LVPWs, Left ventricular posterior wall thickness at end–diastole; LVEF, left ventricular ejection fraction; LVFS, left ventricular fractional shortening; LVd, left ventricular at end-diastole; LVs, left ventricular at end-systole. Unpaired 2-tailed student’s t-test.
Table 4
ECG quantification of Dnajb6 heterozygous mice at 6 months of age.
| Genotype | Age | N | SA incidence (%) | AVB incidence (%) | Heart rate(bpm) |
|---|---|---|---|---|---|
| WT | 6 m | 20 | 1 (5.0) | 0 | 516.3±34.3 |
| Dnajb6+/- | 6 m | 44 | 15 (34.1)* | 3 (6.8) | 494.8±38.3* |
-
N=20-44.
-
*
, p<0.05, data are expressed as mean ± SEM. For SA incidence comparison, Chi-square test. For heart rate comparison, unpaired student’s t-test.
-
SA, sinus arrest. AVB, atrioventricular block. bpm, beats per minute.
Author response table 1
Identification of the DNAJB6 variant from patients with sick sinus syndrome (n=162).
| Nucleotide change (protein change) | Genotyoe frequency | ExAC MAF frequency (%) | Clinical phenotype | SIFT prediction (score) | PolyPhen Prediction (score) |
|---|---|---|---|---|---|
| c.145G>T (p.V49L) | 0/8600 (EVS) 1/95768 (ExAC) 1/140242 (GnomAD) 1/162 (SSS) | 0 | Sick Sinus syndrome | Tolerate (o.142) | Damaging (0.972) |
Additional files
-
Supplementary file 1
ECG quantification of GBT411-/- mutant at 10 months of age.
SA, sinus arrest. epm, episode per minute. bpm, beats per minute. N=8–9. *, P<0.05, data are expressed as mean ± SEM. For SA incidence comparison, Chi-square test. For heart rate comparison, unpaired student t-test.
- https://cdn.elifesciences.org/articles/77327/elife-77327-supp1-v2.docx
-
Supplementary file 2
ECG quantification of GBT411-/- mutant at 16 months of age.
N=8. *, P<0.05, data are expressed as mean ± SEM.
- https://cdn.elifesciences.org/articles/77327/elife-77327-supp2-v2.docx
-
Supplementary file 3
ECG quantification of Dnajb6+/- mice at 6 months of age.
bpm, beats per minute. N=8 *, P<0.05, unpaired student’s t-test.
- https://cdn.elifesciences.org/articles/77327/elife-77327-supp3-v2.docx
-
Supplementary file 4
Variants in DNAJB6 associated with sick sinus syndrome with P<0.05.
aThe effect that the variant has on each feature that it overlaps. bA subjective classification of the severity of the variant consequence, based on agreement with SNPEff. SNP, single nucleotide polymorphism; MAF minor allele frequency; A1, minor allele; A2, major; OR, odds ratio; SE, standard error; info, information metric (info score).
- https://cdn.elifesciences.org/articles/77327/elife-77327-supp4-v2.docx
-
Supplementary file 5
Quantitative RT-PCR primers used to validate differentially expressed (DE) genes identified from RNAseq.
- https://cdn.elifesciences.org/articles/77327/elife-77327-supp5-v2.docx
-
Supplementary file 6
Definition of model parameters and changes induced by isoproterenol (ISO) and carbachol (CCh) administration.
- https://cdn.elifesciences.org/articles/77327/elife-77327-supp6-v2.docx
-
Transparent reporting form
- https://cdn.elifesciences.org/articles/77327/elife-77327-transrepform1-v2.pdf
Download links
A two-part list of links to download the article, or parts of the article, in various formats.
Downloads (link to download the article as PDF)
Open citations (links to open the citations from this article in various online reference manager services)
Cite this article (links to download the citations from this article in formats compatible with various reference manager tools)
A phenotype-based forward genetic screen identifies Dnajb6 as a sick sinus syndrome gene
eLife 11:e77327.
https://doi.org/10.7554/eLife.77327


