Systematic lncRNA mapping to genome-wide co-essential modules uncovers cancer dependency on uncharacterized lncRNAs
- Department of Cancer Biology, Sidney Kimmel Cancer Center, Thomas Jefferson University, United States
Figures
Figure 1 with 4 supplements
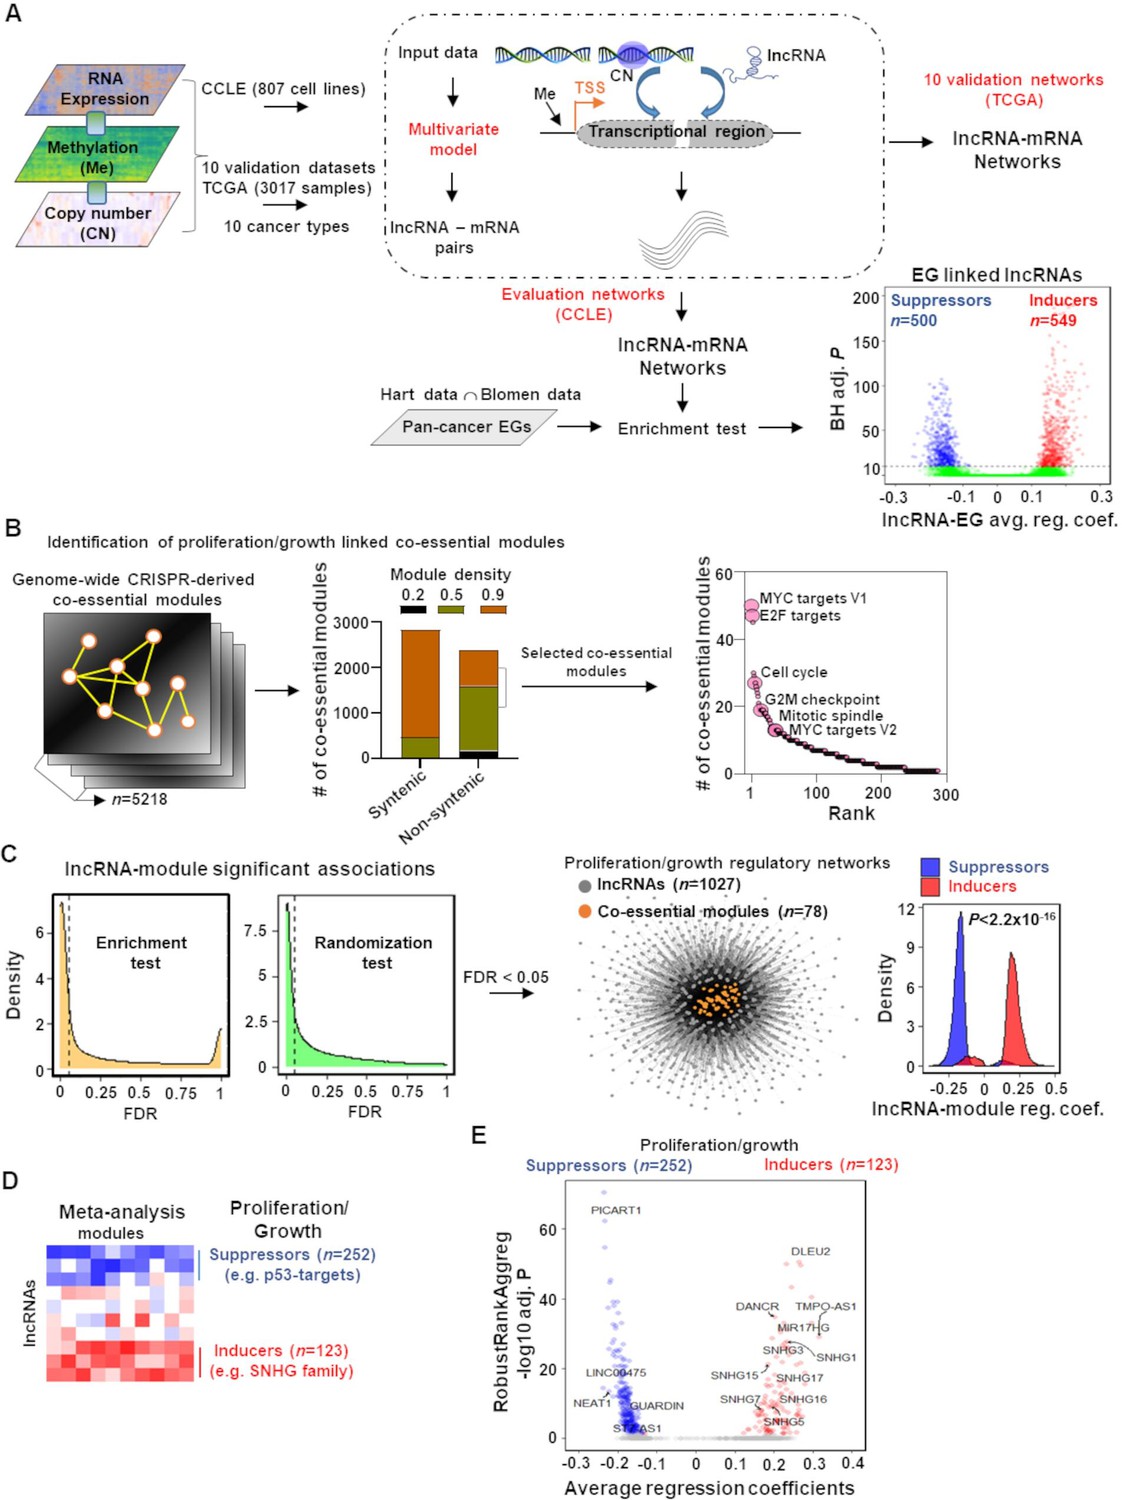
Mapping of long noncoding RNAs (lncRNAs) to genome-wide co-essential networks.
(A) Identification of lncRNA-mediated mRNA expression changes after controlling for the impact of DNA methylation and gene copy number changes by modeling a multivariate regression function. The model was separately employed for pan-cancer cell lines (evaluation data) and patient samples (validation data) of 10 TCGA cancer types. The lncRNAs showing significantly enriched associations with the essential genes were identified (n denotes the number of lncRNAs; EG: essential genes; BH adj. P denotes Benjamini–Hochberg corrected adjusted hypergeometric p-value; avg. reg. coef. denotes regression coefficients; ∩: intersection). (B) Selection of high-confidence proliferation/growth-regulating modules (n denotes number of co-essential modules). (C) The lncRNAs and co-essential modules with significant association strengths (left of dashed vertical lines; FDR: false discovery rate), measured by indicated statistical tests, were selected to construct lncRNA-mediated proliferation/growth-regulatory networks. n denotes the number of indicated node types present in the network. Density plot (center) indicates distribution of lncRNA-module positive or negative associations. p-Value in the density plot was calculated from two-tailed Wilcoxon rank-sum test. Reg. coef. denotes regression coefficients. (D) A schematic heatmap showing indicated numbers of proliferation/growth-inducing (red) or suppressing (blue) lncRNAs, identified from the meta-analysis tool RobustRankAggreg. (E) Volcano plot of the lncRNAs that potentially induce (red dots) or suppress (blue dots) proliferation/growth-regulating co-essential modules. X-axis summarizes lncRNA-module association strength where positive and negative scores indicate the lncRNAs potentially induce or suppress the co-essential modules, respectively. RobustRankAggreg significance levels, denoted on Y-axis, indicate the lncRNAs with consistent positive (red dots) or negative (blue dots) associations across the co-essential modules or the remaining lncRNAs (gray dots).
-
Figure 1—source data 1
Long noncoding RNAs (lncRNA)-mediated potential regulation of co-essential modules.
- https://cdn.elifesciences.org/articles/77357/elife-77357-fig1-data1-v1.xlsx
Figure 1—figure supplement 1
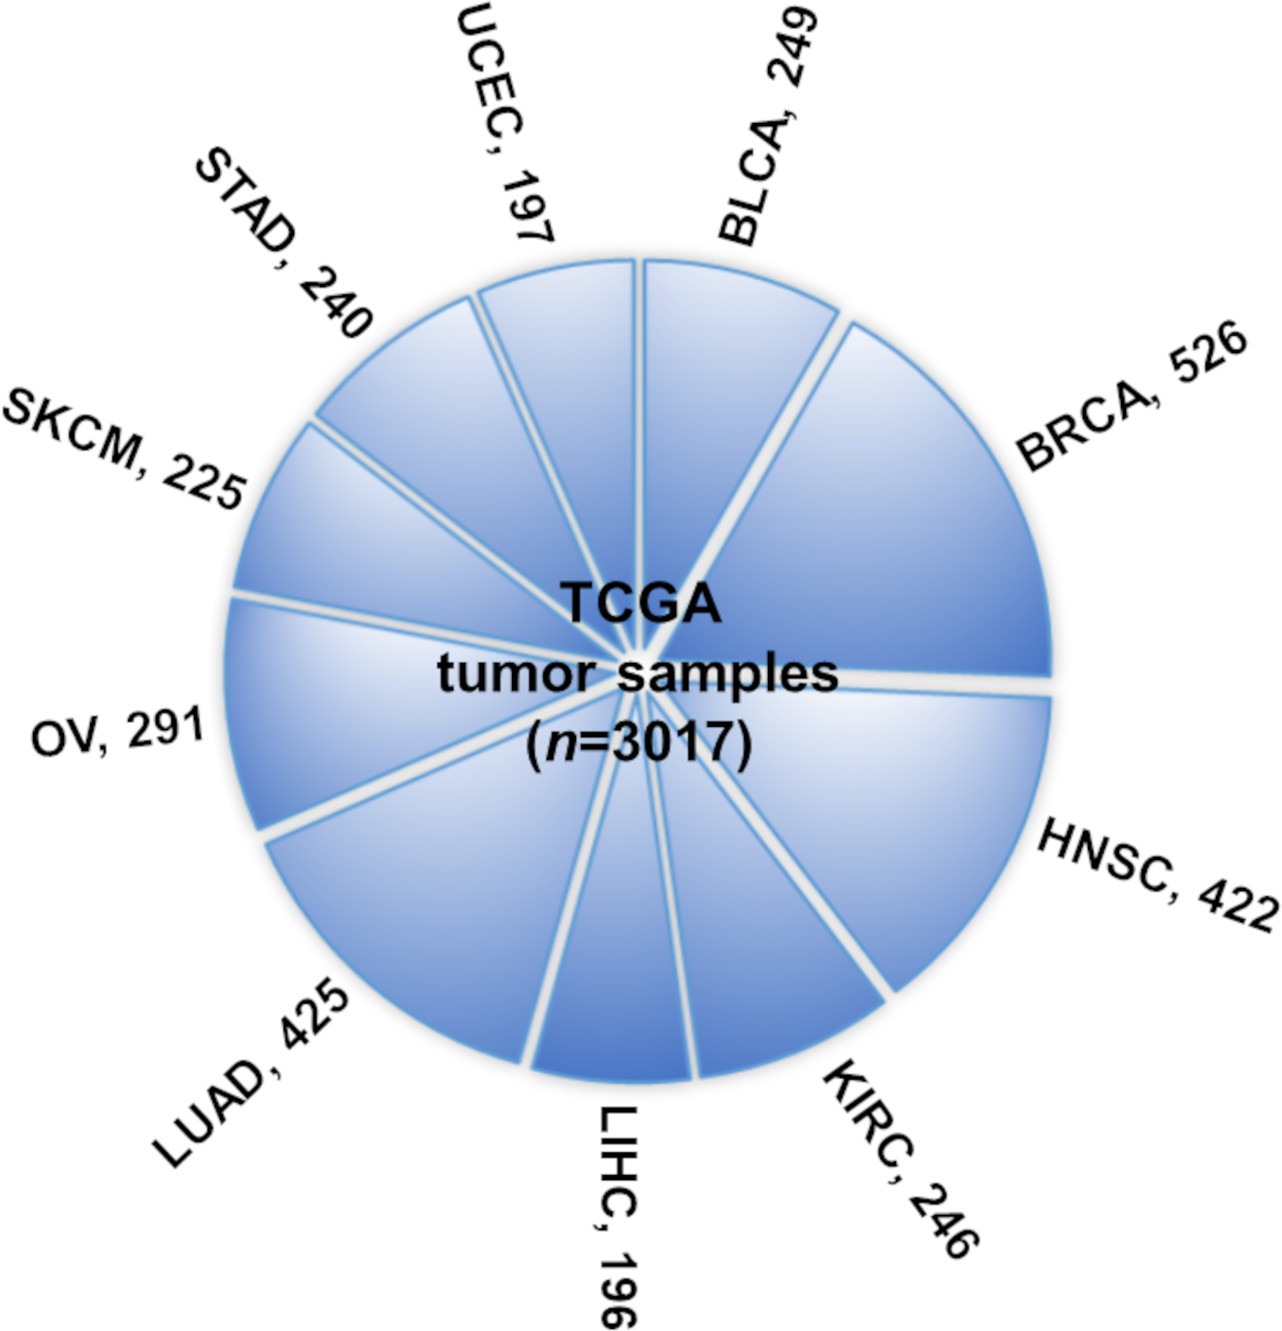
Ten TCGA cancer types evaluated in this study.
The numbers indicate tumor sample size for the number of samples of each cancer type (and overall ‘n’) for which the four types of omics data (mRNA expression, long noncoding RNA [lncRNA] expression, methylation, and copy number alteration profiles) are available.
Figure 1—figure supplement 2
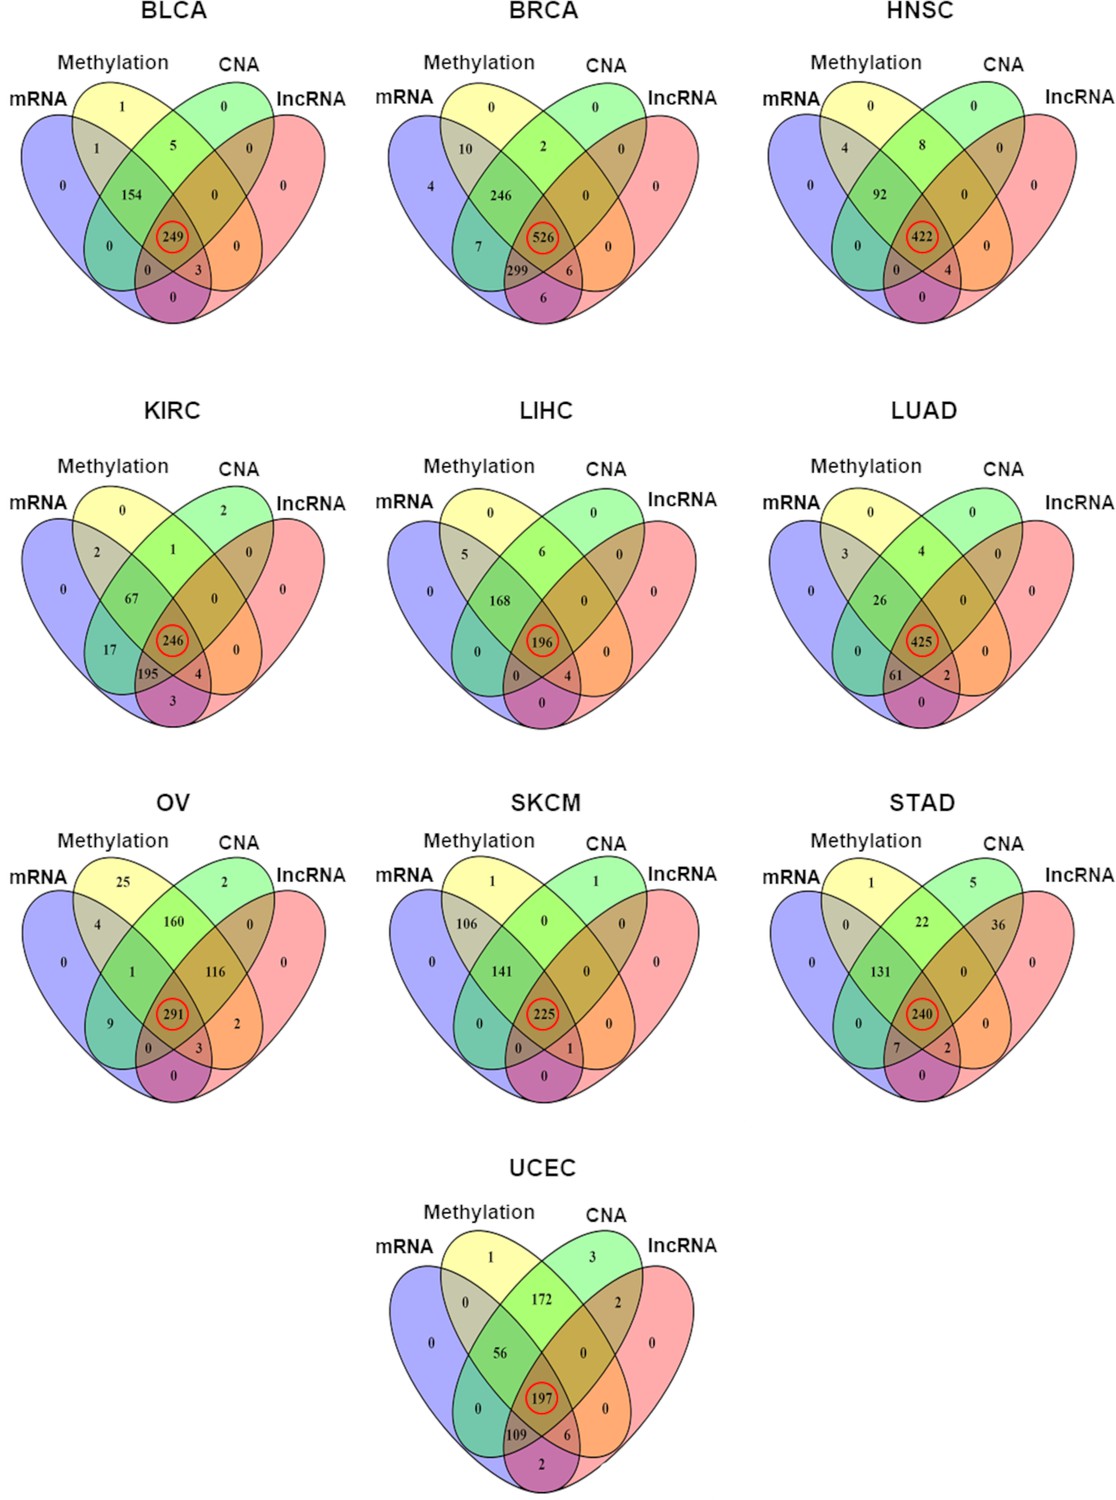
Distribution of samples having each of the four different types of omics data in each of the 10 TCGA cancer types.
The number of samples with all four types of omics data, marked with red circles, was selected for the multivariate regression analysis (copy number alteration [CNA]).
Figure 1—figure supplement 3

The number of co-essential modules associated with proliferation or other gene signatures.
The distribution of the number of co-essential modules that have significantly enriched association with individual gene signatures that regulate proliferation or other functions. Y-axis indicates the number of co-essential modules. Dots are individual gene signatures. *p=2.06 × 10–04; two-tailed Wilcoxon rank-sum test.
Figure 1—figure supplement 4

Percentage of long noncoding RNA (lncRNA)-associated co-essential modules showing enrichment with proliferation or other gene signatures.
The associations were determined from the indicated statistical test (X-axis).
Figure 2 with 1 supplement

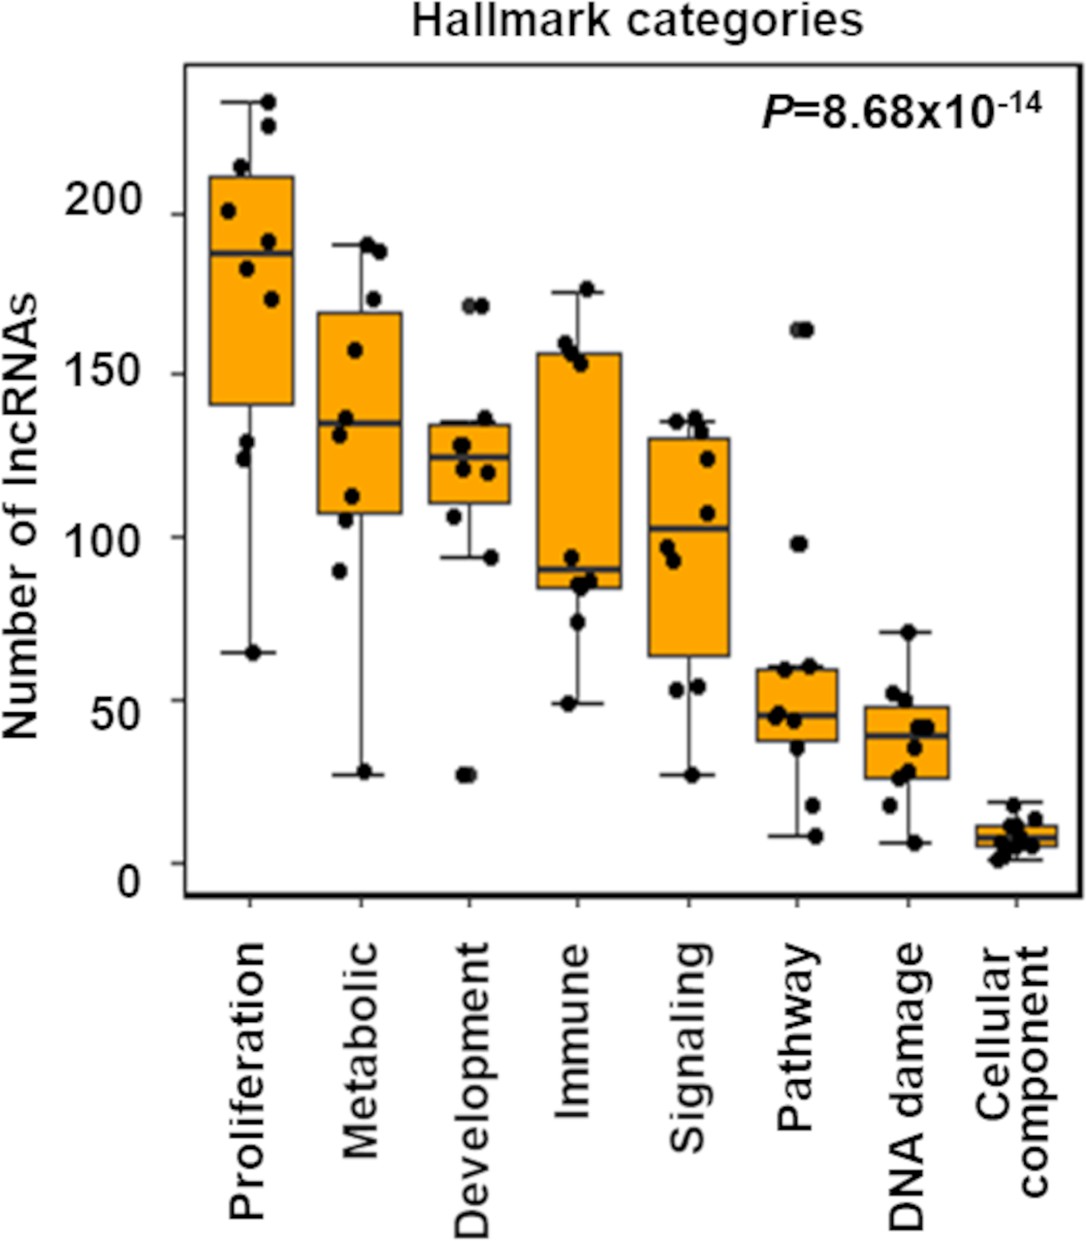
TCGA cancer patient samples reproduce growth-regulating long noncoding RNAs (lncRNAs).
(A) Box plot shows indicated number of lncRNAs (Y-axis) that potentially regulate different Hallmark functions in cancer (X-axis) across 10 TCGA cancer types. p-Value calculated from ANOVA indicates a significant difference in the number of regulating lncRNAs across Hallmark functional categories. Dot represents individual cancer types. (B) Violin plots of the percentage of predicted proliferation-suppressing lncRNAs (blue) or proliferation-inducing lncRNAs (red) with negative (-) or positive (+) associations with proliferation signatures across TCGA cancer types; *p=3.19 × 10⁻³, **p=5.17 × 10⁻⁴; two-tailed Wilcoxon rank-sum test. (C) Levels of proliferation-inducing and -suppressing lncRNAs in patients with higher proliferation activity compared to patients with lower proliferation activity across 10 TCGA cancer types; *p=0.022, **p<1.68 × 10⁻⁶; two-tailed Wilcoxon rank-sum test. (D) Scatter plot shows known proliferation/growth-inducing and -suppressing lncRNAs that have positive or negative impact on the indicated number of Hallmark proliferation genesets (Y-axis) in the indicated number of TCGA cancer types (X-axis). (E) Poorly characterized lncRNAs that potentially regulate (induce or suppress) proliferation/growth in at least five Hallmark proliferation genesets in five or more TCGA cancer types are shown.
-
Figure 2—source data 1
The number of long noncoding RNAs (lncRNAs) predicted to regulate different Hallmark categories in a specific cancer type.
- https://cdn.elifesciences.org/articles/77357/elife-77357-fig2-data1-v1.xlsx
-
Figure 2—source data 2
The number of cell line-based predicted proliferation-regulating long noncoding RNAs (lncRNAs) that potentially alter proliferation signatures across TCGA cancer types.
- https://cdn.elifesciences.org/articles/77357/elife-77357-fig2-data2-v1.xlsx
-
Figure 2—source data 3
Cell line-based predicted proliferation-regulating long noncoding RNAs (lncRNAs) that have significant (false discovery rate [FDR] < 0.05) differential expression in TCGA patients with higher proliferation activity compared to the patients with lower proliferation activity.
- https://cdn.elifesciences.org/articles/77357/elife-77357-fig2-data3-v1.xlsx
Figure 2—figure supplement 1
More long noncoding RNAs (lncRNAs) potentially regulate proliferation across TCGA cancer types.
The box plot shows indicated number of lncRNAs (Y-axis) that potentially regulate different Hallmark functions in cancer (X-axis) across 10 TCGA cancer types. Using Gene Set Enrichment Analysis (GSEA), the lncRNA and Hallmark geneset associations were evaluated, and significantly (false discovery rate [FDR] < 0.05) enriched associations were selected. The Hallmark genesets were grouped into indicated Hallmark categories (X-axis). In each cancer type, the total number of unique lncRNAs showing associations with the genesets under a specific Hallmark category (X-axis) is shown (Y-axis). The dots represent individual cancer types. p-Value calculated from ANOVA indicates a significant difference in the number of regulating lncRNAs across Hallmark functional categories.
Figure 3 with 3 supplements
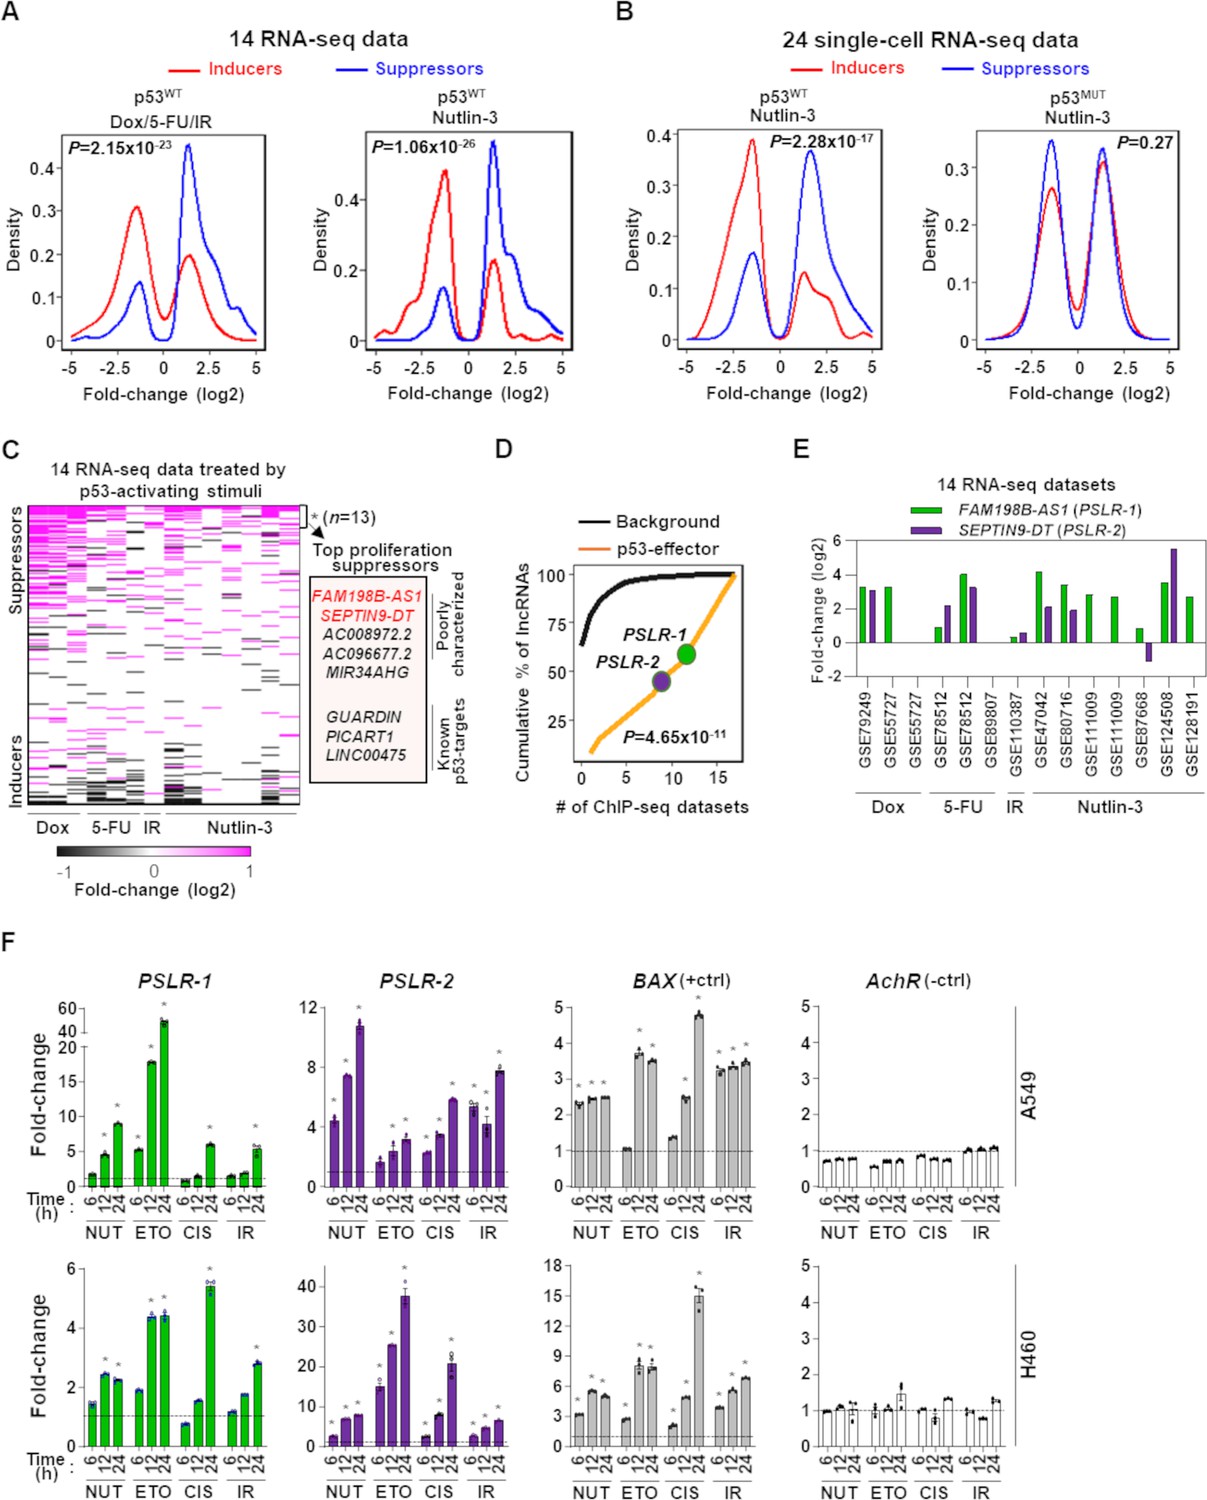
Modulation of growth-regulating long noncoding RNAs (lncRNAs) across diverse stresses.
(A) Density plots showing the distribution of proliferation-inducing and -suppressing lncRNA levels in cells treated with doxorubicin (Dox), 5-fluorouracil (5-FU), or ionizing radiation (IR) in seven bulk RNA-seq data and seven bulk RNA-seq data of cells treated with Nutlin-3. (B) Density plots as in (A) from 24 single-cell RNA-seq data from cells treated with Nutlin-3 (7 p53WT and 17 p53MUT cell lines). (C) Heatmap showing fold change of predicted proliferation-inducing and -suppressing lncRNAs across 14 RNA-seq datasets, indicated in (A). n is the number of consistently upregulated lncRNAs across the RNA-seq datasets with statistical significance (Benjamini–Hochberg [BH] adjusted *p<0.05) calculated by the meta-analysis tool RobustRankAggreg; a subset of the top proliferation suppressors are highlighted in the box. (D) The number of ChIP-seq datasets showing p53-binding sites near the transcription start site of the 13 meta-analyses-derived significantly upregulated lncRNAs, indicated in (C), or background lncRNAs. For (A, B, D), p-values were calculated from two-tailed Wilcoxon rank-sum tests. (E) The expression fold change of two poorly characterized top predicted proliferation-suppressing lncRNAs in cells treated with p53-activating agents (see A) compared to control cells. The X-axis indicates the accession number of the 14 RNA-seq datasets present in the Gene Expression Omnibus database. (F) Two lung adenocarcinoma (LUAD) cell lines treated with 10 µM of Nutlin (NUT), etoposide (ETO), or cisplatin (CIS) or received 5 Gy of gamma-radiation (IR) were harvested at intervals. qRT-PCR (triplicate) for specific lncRNA was performed. BAX and AchR mRNA are positive and negative controls, respectively. RNA levels were normalized to β-ACTIN, and values are presented as 2-ΔΔCt, with vehicle control-treated cells set at 1 (black line); data are mean ± SEM. For A549, PSLR-1 *p<6.86 × 10⁻⁴, PSLR-2 *p<1.17 × 10⁻², BAX *p<4.93 × 10⁻⁶; for H460, PSLR-1 *p<6.95 × 10⁻⁶, PSLR-2 *p<5.69 × 10⁻³, and BAX *p<3.99 × 10⁻⁴; two-tailed t-tests.
-
Figure 3—source data 1
qRT-PCR for Figure 3F.
- https://cdn.elifesciences.org/articles/77357/elife-77357-fig3-data1-v1.xlsx
Figure 3—figure supplement 1
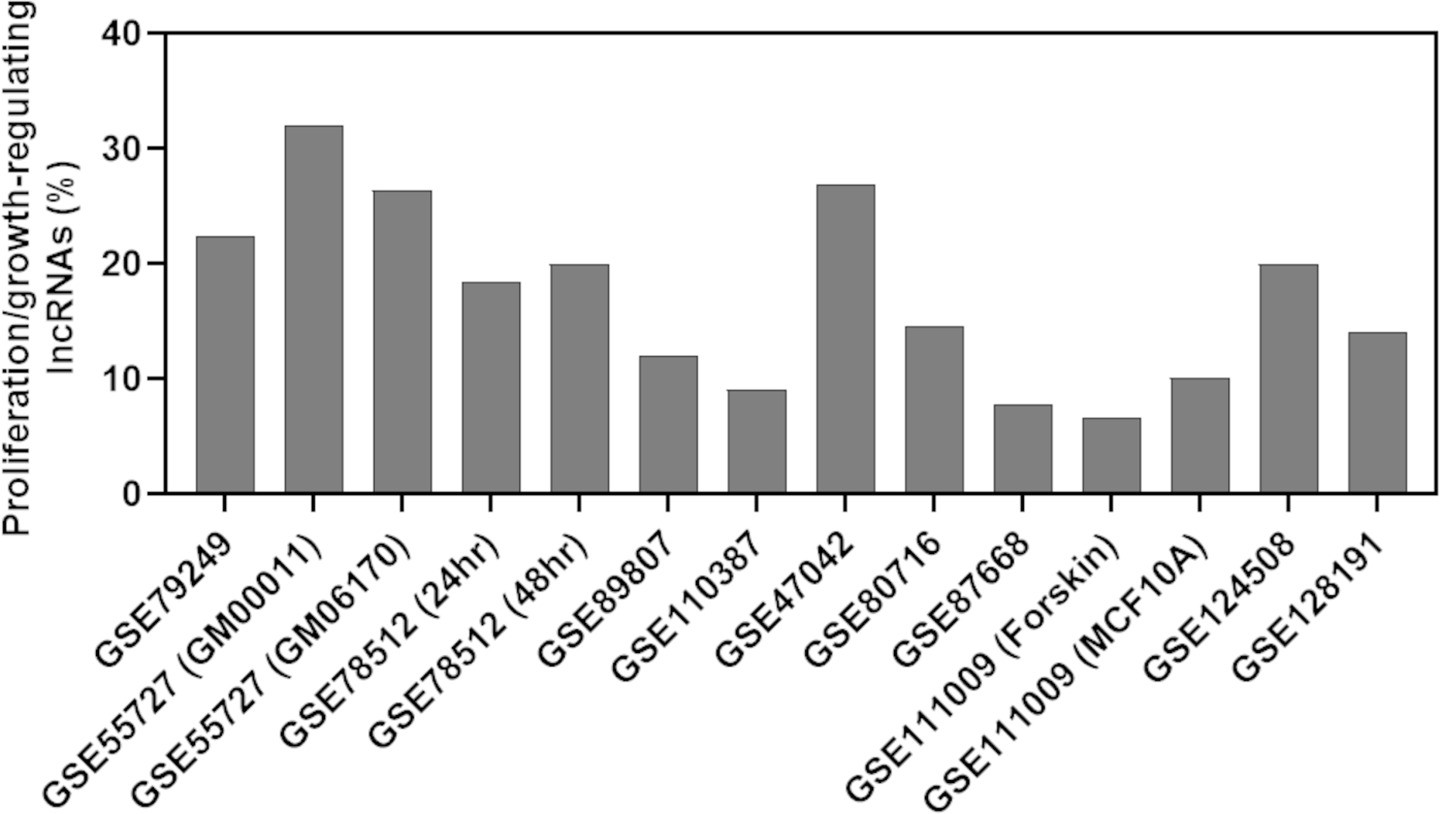
Percentage of predicted proliferation/growth-regulating long noncoding RNAs (lncRNAs) showing at least twofold expression change in the cells treated with a growth inhibitor compared to the control cells.
The X-axis indicates the accession number of the 14 RNA-seq data available in the Gene Expression Omnibus database. The information within the parenthesis for specific samples indicates data that shared the same accession number.
Figure 3—figure supplement 2
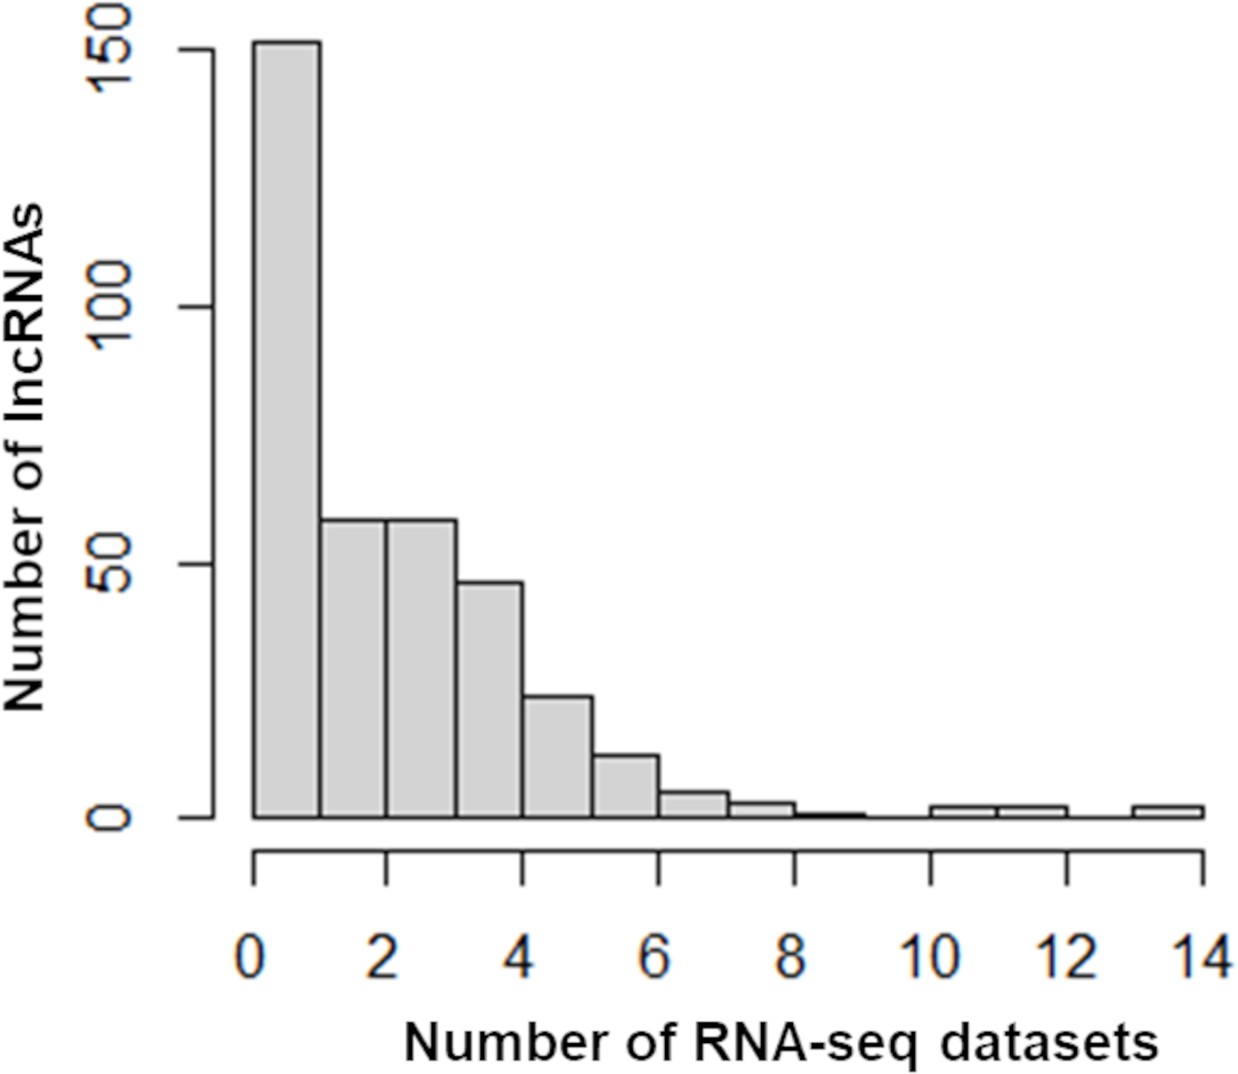
Distribution of differentially expressed long noncoding RNAs (lncRNAs) across RNA-seq datasets.
The number of lncRNAs (Y-axis) with more than twofold expression changes in the indicated number of RNA-seq datasets (X-axis) is shown.
Figure 3—figure supplement 3

p53 ChIP-seq datasets showing long noncoding RNAs (lncRNAs) bound by p53.
X-axis indicates the number of ChIP-seq studies that determined p53 binding sites in the promoter region of the lncRNA listed on the Y-axis.
Figure 4
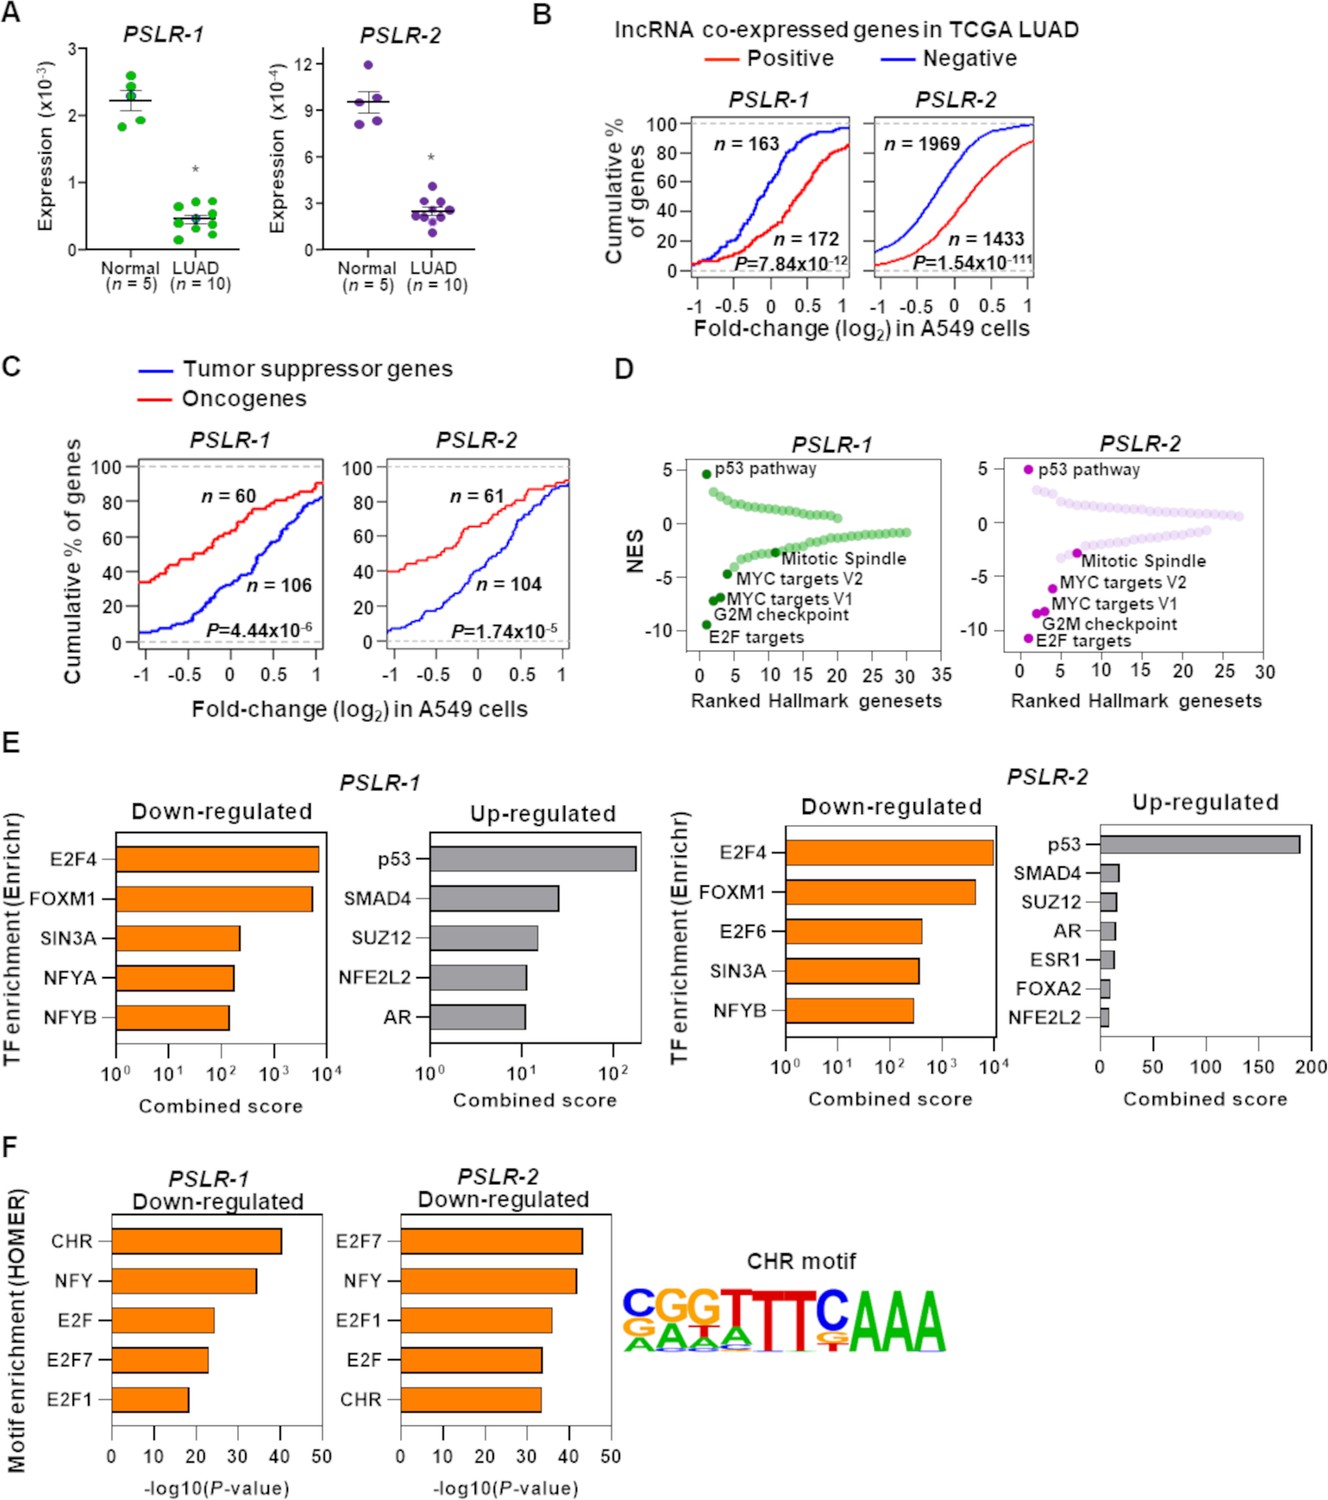
Functional characterization of PSLRs in lung adenocarcinoma (LUAD).
(A) Expression of PSLR-1 and -2 was measured by qRT-PCR (triplicate) in normal human lung tissue (n = 5) and LUAD patient samples (n = 10). RNA levels were normalized to β-ACTIN and values are presented as 2-ΔCt; data are mean ± SEM. PSLR-1, *p=7.75 × 10⁻⁹; PSLR-2, *p=2.77 × 10⁻⁸; two-tailed t-tests. (B–D) RNA-sequencing of A549 LUAD cell line after expression of each of the two long noncoding RNAs (lncRNAs) or vector control (quadruplicate). (B) Genes that have significant (adjusted regression p<10–3) positive or negative associations with the indicated lncRNA in TCGA LUAD data were selected. Empirical cumulative distribution of expression fold changes of these genes in A549 cells expressing the indicated lncRNA compared with vector control. (C) Empirical cumulative distribution of expression changes of curated tumor-suppressor genes and oncogenes in A549 cells expressing the indicated lncRNA compared with vector control. For (B, C), x-axis indicates the expression fold changes of genes, y-axis estimates the percentage of genes at a log2 fold-change value indicated on the x-axis, and p-values were from two-tailed Wilcoxon rank-sum tests. (D) Gene Set Enrichment Analysis (GSEA) demonstrated top up- and downregulated Hallmark genesets after expression of the indicated lncRNA in A549 cells compared with vector control. Positive and negative normalized enrichment scores (NES) indicate up- and downregulation, respectively. Significantly enriched (false discovery rate [FDR] < 0.05) proliferation-associated pathways/gene signatures indicated. (E) Enrichr-calculated combined score indicates transcription factor (TF) enrichment of genes altered upon expression of the indicated lncRNA in A549 LUAD cells. (F) HOMER-calculated promoter motif enrichment of downregulated genes upon indicated lncRNA expression in LUAD cells. CHR motif elements are shown (right).
-
Figure 4—source data 1
qRT-PCR for Figure 4A.
- https://cdn.elifesciences.org/articles/77357/elife-77357-fig4-data1-v1.xlsx
Figure 5 with 1 supplement

p53-regulated long noncoding RNAs (lncRNAs) exert tumor-suppressive activity in lung adenocarcinoma (LUAD).
The lncRNAs PSLR-1, PSLR-2, or MALAT1 or vector control were expressed (lentivirus) in LUAD cell lines. (A) MTT assays (quadruplicate) performed at 24 hr intervals. Each assay performed 2–4 independent times for both cell lines and one representative experiment is shown ± SD; A549 *p=1.11 × 10⁻⁴ and **p<3.03 × 10⁻⁴, H460 *p=2.04 × 10⁻⁵ and **p<2.28 × 10⁻⁴; two-tailed t-tests. (B) Colonies from colony formation assays were counted 14 days after lncRNA expression. Assays (triplicate) performed 2–3 independent times and a representative experiment ± SEM and images (no magnification) shown; A549 *p=1.49 × 10⁻² and **p<2.09 × 10⁻⁴, H460 *p=3.42 × 10⁻² and **p<1.16 × 10⁻³; two-tailed t-tests. (C) Live cell number determined by Trypan Blue dye exclusion 48 hr after placing cells in 6-well plates. Mean of four independent experiments for both cell lines ± SD is graphed; A549 *p=5.77 × 10⁻⁴ and **p<2.68 × 10⁻⁵, H460 *p=2.90 × 10⁻⁵ and **p<3.63 × 10⁻⁶; two-tailed t-tests. (D) Cell cycle evaluated at intervals following propidium iodide staining and flow cytometry; representative histograms from one experiment shown (left). Graphs of the cell cycle phases represent the mean of four independent experiments for both cell lines at 48 hr ± SEM; A549 *p=8.82 × 10⁻³ and **p<1.73 × 10⁻², H460 *p=4.00 × 10⁻³ and **p<1.35 × 10⁻³; two-tailed t-tests.
-
Figure 5—source data 1
MTT for Figure 5A.
- https://cdn.elifesciences.org/articles/77357/elife-77357-fig5-data1-v1.xlsx
-
Figure 5—source data 2
Colony number for Figure 5B.
- https://cdn.elifesciences.org/articles/77357/elife-77357-fig5-data2-v1.xlsx
-
Figure 5—source data 3
Live cell number for Figure 5C.
- https://cdn.elifesciences.org/articles/77357/elife-77357-fig5-data3-v1.xlsx
-
Figure 5—source data 4
Cell cycle for Figure 5D.
- https://cdn.elifesciences.org/articles/77357/elife-77357-fig5-data4-v1.xlsx
Figure 5—figure supplement 1
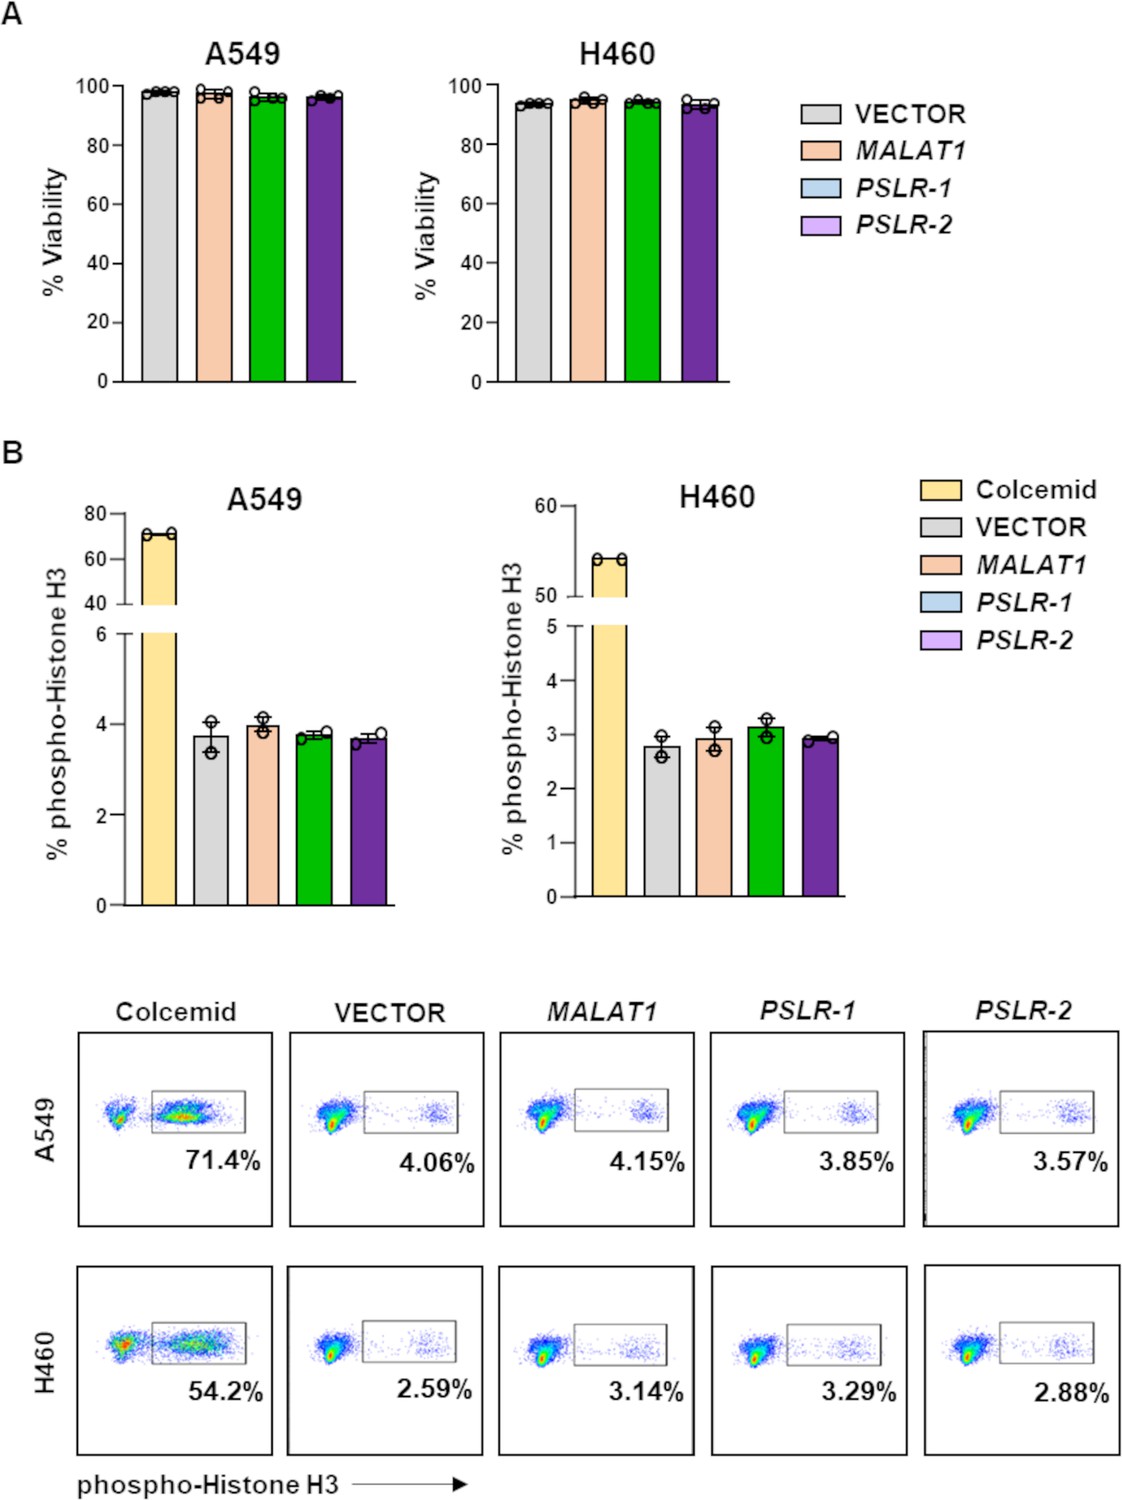
Cell viability and numbers of cells in mitosis are not altered by ectopic expression of the PSLRs.
Lung adenocarcinoma cell lines were infected with lentivirus to ectopically express PSLR-1, PSLR-2, MALAT1, or empty vector control. (A) Viability was determined by Trypan Blue dye exclusion 48 hr after plating. Graphs represent the average ± SD from four independent experiments for both cell lines. (B) Intracellular staining for phospho-histone H3 was performed two independent times, in duplicate, 48 hr after plating. One representative experiment is shown with quantification (top; ± SEM) and representative flow plots (bottom). Colcemid was used to arrest cells in mitosis and serves as a positive control.
Figure 6

Elevated PSLR expression alters the G2 regulatory network across diverse cancer types.
(A) A network was constructed from the genes that regulate cell cycle in G2 phase (left) and were significantly altered in PSLR-expressing A549 cells compared to control cells from our RNA-seq data (right). Circle, square, and triangle nodes represent the PSLR, genes, and p53, respectively. Red and blue nodes indicate up- and downregulation, respectively. The edges with direction indicate regulator-mediated target activation (red line with arrowhead) or suppression (blue line with T-shape head). The outgoing edges from the PSLRs indicate expression association. All other edges indicate biologically validated interactions. Benjamini–Hochberg (BH) adjusted *p<6.34 × 10⁻³ and **p<3.23 × 10–43 were calculated from EdgeR. (B, C) 48 hr after lentiviral expression of the PSLRs in lung adenocarcinoma (LUAD) cell lines, qRT-PCR (triplicate) for the cell cycle genes indicated was performed (B) and the proteins assessed by Western blotting (C). RNA levels were normalized to β-ACTIN and values plotted as log2 fold change relative to vector (VEC) control. Data are mean values ± SEM; A549 *p<2.55 × 10⁻³ and H460 *p<5.31 × 10⁻⁴; two-tailed t-tests. Vertical line in the Western blots denotes a lane was removed in between PSLR-1 and PSLR-2 of this exposure. (D) Expression fold-change distribution of the four genes that inhibit (blue dots) or the three genes that induce (red squares) G2 cell cycle arrest from (B) and (C). The expression fold changes were measured in samples with increased (highest quartile) PSLR expression compared to the samples with reduced (lowest quartile) PSLR expression. Accumulated results from 10 TCGA cancer types are shown; *p<2.73 × 10⁻⁴ from two-tailed Wilcoxon rank-sum test denotes significantly distinct distribution.
-
Figure 6—source data 1
qRT-PCR for Figure 6B.
- https://cdn.elifesciences.org/articles/77357/elife-77357-fig6-data1-v1.xlsx
-
Figure 6—source data 2
Western blots for Figure 6C.
- https://cdn.elifesciences.org/articles/77357/elife-77357-fig6-data2-v1.pdf
Figure 7

Elevated PSLR expression correlates with increased patient overall survival across diverse cancer types.
(A) Distribution of expression changes of genes that have significant favorable or unfavorable prognostic associations with TCGA lung adenocarcinoma (LUAD) patient cohort; p-values from two-tailed Wilcoxon rank-sum tests. (B) Kaplan–Meier plots of overall survival associations between the indicated PSLR and the patients of the indicated cancer types. The low and high groups of patient samples were determined based on median expression of the indicated PSLR. To measure significantly different survival outcomes, log-rank tests were performed; n represents number of samples (A, B).
Author response image 1
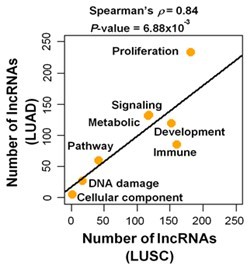
Number of predicted proliferation/growth-regulating lncRNAs that have significant (FDR < 0.05; GSEA) enrichment with the indicated cancer hallmark categories in LUAD and/or LUSC.
P-value was derived from Spearman’s rank correlation test.
Tables
Key resources table
| Reagent type (species) or resource | Designation | Source or reference | Identifiers | Additional information |
|---|---|---|---|---|
| Cell line (Homo sapiens) | A549, lung adenocarcinoma | ATCC | CCL-185 | |
| Cell line (H. sapiens) | H460, lung adenocarcinoma | ATCC | HTB-177 | |
| Transfected construct (Homo sapiens) | PSLR-1 | VectorBuilder | FAM198B-AS1 VB200405-4575kbk | Lentiviral construct to express the lncRNA |
| Transfected construct (H. sapiens) | PSLR-2 | VectorBuilder | SEPTIN9-DT VB200405-4635tnb | Lentiviral construct to express the lncRNA |
| Transfected construct (H. sapiens) | MALAT1 | Addgene | #118580 | Lentiviral construct to express the lncRNA |
| Transfected construct | GIPZ lentiviral empty vector control | Dharmacon/Horizon | #RHS4349 | Lentiviral construct used as control |
| Antibody | Anti-cyclin B1 (mouse monoclonal) | BD Pharmingen | #554177 | WB (1:1000) |
| Antibody | Anti-14-3-3-σ (goat polyclonal) | Santa Cruz | #sc-7681 | WB (1:500) |
| Antibody | Anti-p21 (mouse monoclonal) | Santa Cruz | #sc-6246 | WB (1:250) |
| Antibody | Anti-cyclin A2 (rabbit polyclonal) | Cell Signaling | #91500 | WB (1:1000) |
| Antibody | Anti-GADD45A (rabbit polyclonal) | Cell Signaling | #4632 | WB (1:1000) |
| Antibody | Anti-CDK1 (mouse monoclonal) | Cell Signaling | #9116 | WB (1:1000) |
| Antibody | Anti-CDC25C (rabbit polyclonal) | Cell Signaling | #4688 | WB (1:1000) |
| Antibody | Anti-B-ACTIN (mouse monoclonal) | Sigma | #A5316 | WB (1:5000) |
| Antibody | Anti-histone H3 (phospho S10) (rabbit polyclonal) | Abcam | #ab5176 | Intracellular staining FACS (1:100) |
| Sequence-based reagent | Hsa-CDK1-For | This paper | qRT-PCR primer | GCCGGGATCTACCATACCC |
| Sequence-based reagent | Hsa-CDK1-Rev | This paper | qRT-PCR primer | AGGAACCCCTTCCTCTTCAC |
| Sequence-based reagent | Hsa-CCNB1-For | This paper | qRT-PCR primer | ATGACATGGTGCACTTTCCTCC |
| Sequence-based reagent | Hsa-CCNB1-Rev | This paper | qRT-PCR primer | GCCAGGTGCTGCATAACTGG |
| Sequence-based reagent | Hsa-CCNA2-For | This paper | qRT-PCR primer | GAAAACCATTGGTCCCTCTTG |
| Sequence-based reagent | Hsa-CCNA2-Rev | This paper | qRT-PCR primer | GGCTGTTTCTTCATGTAACCC |
| Sequence-based reagent | Hsa-CDC25C-For | This paper | qRT-PCR primer | CTTCCTTTACCGTCTGTCCAG |
| Sequence-based reagent | Hsa-CDC25C-Rev | This paper | qRT-PCR primer | CCAAGTTTCCATTGTCATCCC |
| Sequence-based reagent | Hsa-CDKN1A-For | This paper | qRT-PCR primer | GGAAGACCATGTGGACCTGT |
| Sequence-based reagent | Hsa-CDKN1A-Rev | This paper | qRT-PCR primer | GGATTAGGGCTTCCTCTTGG |
| Sequence-based reagent | Hsa-GADD45A-For | This paper | qRT-PCR primer | CCCTGATCCAGGCGTTTTG |
| Sequence-based reagent | Hsa-GADD45A-Rev | This paper | qRT-PCR primer | GATCCATGTAGCGACTTTCCC |
| Sequence-based reagent | Hsa-SFN-For | This paper | qRT-PCR primer | GAGACACAGAGTCCGGCATT |
| Sequence-based reagent | Hsa-SFN-Rev | This paper | qRT-PCR primer | CTGCCATGTCCTCATAGCGT |
| Sequence-based reagent | Hsa-BAX-For | This paper | qRT-PCR primer | CCCGAGAGGTCTTTTTCCGAG |
| Sequence-based reagent | Hsa-BAX-Rev | This paper | qRT-PCR primer | CCAGCCCATGATGGTTCTGAT |
| Sequence-based reagent | Hsa-AchR-For | This paper | qRT-PCR primer | AGGACCCTACAGACCCCTCTTC |
| Sequence-based reagent | Hsa-AchR-Rev | This paper | qRT-PCR primer | AGTGTTCATGGTGGCTAGGTG |
| Sequence-based reagent | Hsa-PSLR1-For | This paper | qRT-PCR primer | AGCCACCCTTGACTGAGGTA |
| Sequence-based reagent | Hsa-PSLR1-Rev | This paper | qRT-PCR primer | CTCTGTCTTCTGTGCCGTGT |
| Sequence-based reagent | Hsa-PSLR2-For | This paper | qRT-PCR primer | GAAAGTCAGCGATTCCTGCG |
| Sequence-based reagent | Hsa-PSLR2-Rev | This paper | qRT-PCR primer | GTTGGACAGTTCCTCCCTGAG |
| Sequence-based reagent | Hsa-B-ACTIN-For | This paper | qRT-PCR primer | CACCAACTGGGACGACAT |
| Sequence-based reagent | Hsa-B-ACTIN-Rev | This paper | qRT-PCR primer | ACAGCCTGGATAGCAACG |
| Commercial assay or kit | RT2 SYBR Green ROX qPCR Mastermix | QIAGEN | #330521 | qPCR Mastermix |
| Commercial assay or kit | SuperScript III First-Strand Synthesis System | Invitrogen | #18080051 | cDNA synthesis |
| Commercial assay or kit | TRIzol Reagent | Invitrogen | #15596026 | RNA isolation |
| Chemical compound, drug | MTT (3-(4,5-Dimethyl-2-thiazolyl)–2,5-diphenyl-2H-tetrazolium bromide) | Sigma-Aldrich | #475989 | Used for proliferation assay |
| Chemical compound, drug | Crystal violet | Sigma-Aldrich | #192 | Used for colony formation assay |
| Chemical compound, drug | Propidium iodide | Sigma-Aldrich | #537059 | Used for cell cycle analysis |
| Chemical compound, drug | Nutlin-3 | Sigma-Aldrich | #444143 | p53-activating stimuli |
| Chemical compound, drug | Etoposide | Sigma-Aldrich | #341205 | p53-activating stimuli |
| Chemical compound, drug | Cisplatin | Sigma-Aldrich | #232120 | p53-activating stimuli |
| Chemical compound, drug | Colcemid | Gibco | #15212012 | Used to treat cells for positive control for mitotic cells |
| Software, algorithm | FlowJo | TreeStar | Dean–Jett–Fox cell cycle model used for cell cycle analysis | |
| Software, algorithm | GraphPad Prism | GraphPad Prism (https://graphpad.com) | PRID:SCR_002798 | |
| Software, algorithm | R Project for Statistical Computing | R Project for Statistical Computing (https://www.r-project.org/) | PRID:SCR_001905 |
Additional files
-
Supplementary file 1
(a) Long noncoding RNAs (lncRNAs) that have significantly enriched positive associations with essential genes. (b) lncRNAs that have significantly enriched negative associations with essential genes. (c) Reannotation of co-essential modules using cancer Hallmark gene set enrichment analysis. Genes in the individual modules can be obtained from PubMed ID: 33859415. (d) Reannotation of co-essential modules using Kyoto Encyclopedia of Genes and Genome (KEGG) pathway enrichment analysis. Genes in the individual modules can be obtained from PubMed ID: 33859415. (e) Number of co-essential modules significantly enriched with indicated KEGG pathways or Hallmark genesets. Rankings of individual pathways/genesets were based on number of co-essential modules. (f) Networks of lncRNA and co-essential modules. Co-essential module details can be obtained from PubMed ID: 33859415. (g) Meta-analysis-derived potential proliferation/growth-inducing lncRNAs. (h)Meta-analysis-derived potential proliferation/growth-suppressing lncRNAs. (i) Number of pubmed hits for individual lncRNAs. PubMed was searched on September 11, 2021. (j) lncRNAs that have more than twofold expression change in one or more cancer types. (k) Proliferation/growth-suppressing lncRNAs showing consistent upregulation across RNA-seq data. (l) Proliferation/growth-inducing lncRNAs showing consistent downregulation across RNA-seq data.
- https://cdn.elifesciences.org/articles/77357/elife-77357-supp1-v1.xlsx
-
Supplementary file 2
(a) Differential distribution of expression changes of proliferation inducing and suppressing long noncoding RNAs (lncRNAs) across TCGA cancer types. (b) Summary of the 14 RNA-seq datasets evaluated. (c) Summary of the 17 ChIP-seq datasets evaluated. (d) Primers used for qRT-PCR.
- https://cdn.elifesciences.org/articles/77357/elife-77357-supp2-v1.docx
-
Transparent reporting form
- https://cdn.elifesciences.org/articles/77357/elife-77357-transrepform1-v1.pdf
Download links
A two-part list of links to download the article, or parts of the article, in various formats.
Downloads (link to download the article as PDF)
Open citations (links to open the citations from this article in various online reference manager services)
Cite this article (links to download the citations from this article in formats compatible with various reference manager tools)
Systematic lncRNA mapping to genome-wide co-essential modules uncovers cancer dependency on uncharacterized lncRNAs
eLife 11:e77357.
https://doi.org/10.7554/eLife.77357


